Orbitool: a software tool for analyzing online Orbitrap mass spectrometry data
←
→
Page content transcription
If your browser does not render page correctly, please read the page content below
Atmos. Meas. Tech., 14, 2377–2387, 2021
https://doi.org/10.5194/amt-14-2377-2021
© Author(s) 2021. This work is distributed under
the Creative Commons Attribution 4.0 License.

Orbitool: a software tool for analyzing online Orbitrap
mass spectrometry data
Runlong Cai1, , Yihao Li2,3, , Yohann Clément4 , Dandan Li5 , Clément Dubois5 , Marlène Fabre5 , Laurence Besson5 ,
Sebastien Perrier5 , Christian George5 , Mikael Ehn1 , Cheng Huang2 , Ping Yi3 , Yingge Ma2 , and Matthieu Riva5
1 Institute
          for Atmospheric and Earth System Research/Physics, Faculty of Science,
University of Helsinki, Helsinki, 00014, Finland
2 State Environmental Protection Key Laboratory of Formation and Prevention of Urban Air Pollution Complex, Shanghai

Academy of Environmental Sciences, Shanghai, 200233, China
3 School of Electronic Information and Electrical Engineering, Shanghai Jiao Tong University, Shanghai, 200240, China
4 Univ. Lyon, Université Claude Bernard Lyon 1, CNRS, Institut des Sciences Analytiques, UMR 5280,

5 rue de la Doua, 69100 Villeurbanne, France
5 Univ. Lyon, Université Claude Bernard Lyon 1, CNRS, IRCELYON, 69626, Villeurbanne, France
 These authors contributed equally to this work.

Correspondence: Matthieu Riva (matthieu.riva@ircelyon.univ-lyon1.fr) and Yingge Ma (mayg@saes.sh.cn)

Received: 30 June 2020 – Discussion started: 12 August 2020
Revised: 4 November 2020 – Accepted: 23 November 2020 – Published: 26 March 2021

Abstract. The Orbitrap mass spectrometer has recently been          far, which consists of ambient gas-phase measurements in ur-
proved to be a powerful instrument to accurately mea-               ban Shanghai. These tests showed that Orbitool was able to
sure gas-phase and particle-phase organic compounds with            automatically assign hundreds of molecular formulae as well
a greater mass resolving power than other widely used on-           as their isotopes with high accuracy.
line mass spectrometers in atmospheric sciences. We develop
an open-source software tool (Orbitool, https://orbitrap.
catalyse.cnrs.fr, last access: 4 February 2021) to facilitate the
analysis of long-term online Orbitrap data. Orbitool can av-        1   Introduction
erage long-term data while improving the mass accuracy by
                                                                    Biogenic and anthropogenic sources emit a wide variety
re-calibrating each mass spectrum, assign molecular formu-
                                                                    of volatile organic compounds (VOCs) into the atmosphere
lae of compounds and their isotopes to measured signals, and
                                                                    (Hallquist et al., 2009; Shrivastava et al., 2017). Once emit-
export time series and mass defect plots. The noise reduction
                                                                    ted, VOCs can quickly react with different atmospheric oxi-
procedure in Orbitool can separate signal peaks from noise
                                                                    dants (OH radicals, O3 , NO3 radicals, or Cl atoms) yielding
and reduce the computational and storage expenses. Chem-
                                                                    a wide variety of oxidized VOCs (OVOCs) spanning a broad
ical ionization Orbitrap data from laboratory experiments
                                                                    range of chemical formulae and, thus, volatilities (Hallquist
on ozonolysis of monoterpenes and ambient measurements
                                                                    et al., 2009; Li et al., 2020; Wennberg et al., 2018). OVOCs
in urban Shanghai were used to test Orbitool. For the test
                                                                    play a central role in the formation of atmospheric aerosols
dataset, the average mass accuracy was improved from < 2
                                                                    by either condensing onto pre-existing aerosol particles or
to < 0.5 ppm by mass calibrating each spectrum. The denois-
                                                                    forming new particles (Hallquist et al., 2009; Jimenez et al.,
ing procedure removed 97 % of the noise peaks from a spec-
                                                                    2009; Kirkby et al., 2016; Shrivastava et al., 2017). Gener-
trum averaged for 30 min while maintaining the signal peaks,
                                                                    ally, the more oxidized OVOCs are, the lower their volatility
substantially helping the automatic assignment of unknown
                                                                    and the greater their probability of partitioning to the par-
species. To illustrate the capabilities of Orbitool, we used the
                                                                    ticle phase. However, the quantitative evaluation of the im-
most challenging and complex dataset we have collected so
                                                                    pact of aerosols on climate is as yet inadequately constrained

Published by Copernicus Publications on behalf of the European Geosciences Union.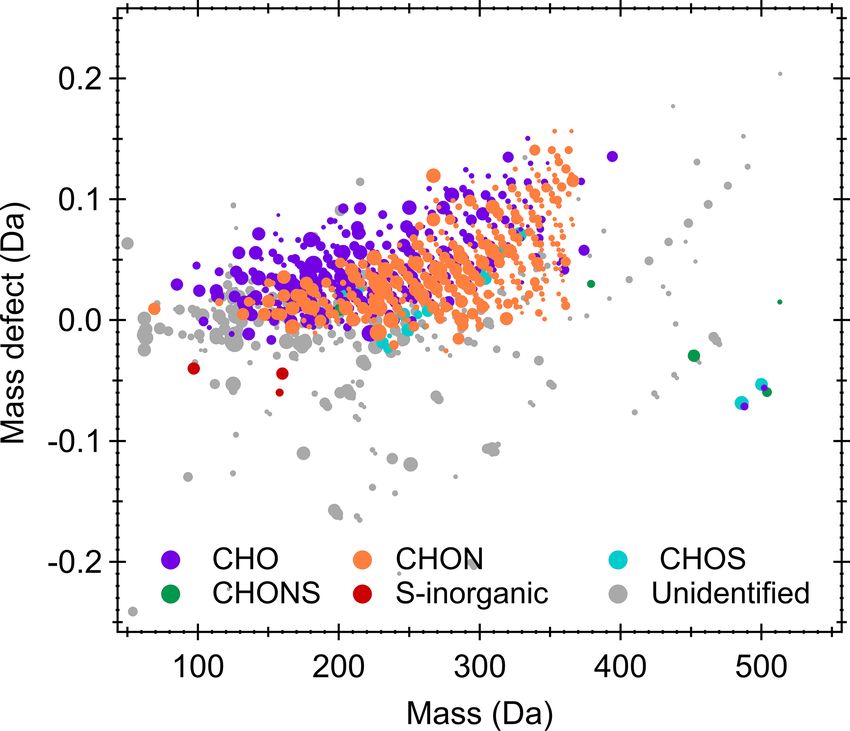
2378                                                               R. Cai et al.: Orbitool: a new software tool for Orbitrap

due to many factors, including an incomplete understand-          continuous online measurements. The commercial software,
ing of how VOC oxidation processes contribute to new par-         Xcalibur™, which was used in our initial studies (Lee et al.,
ticle and secondary organic aerosol formation (Glasius and        2020; Riva et al., 2019a, 2020), provides an interface for ba-
Goldstein, 2016). Indeed, the gas-phase oxidation of one sin-     sic data analysis, e.g., reading single or averaged scans and
gle VOC can yield thousands of oxidized products (Glasius         exporting the time evolution of selected signal peaks. How-
and Goldstein, 2016; Goldstein and Galbally, 2007; Li et al.,     ever, more complicated data analysis is usually needed for in-
2020; Riva et al., 2019b). As a result, the chemical variety      vestigating the complexity and chemical processes occurring
of OVOCs poses a major challenge in detecting, quantifying,       within the atmosphere. Hence, some customized software
and characterizing such a large number and wide variety of        tools, e.g., RawQuant (Kovalchik et al., 2018), RawTools
organic compounds.                                                (Kovalchik et al., 2019), and DIMSpy (Weber and Zhou,
   Over the last decade, mass spectrometric techniques have       2019) have been developed to meet different demands. In at-
made extensive improvements and are now well suited to de-        mospheric sciences, the concentrations of some key chemical
tecting a large range of species simultaneously. This is high-    species (e.g., peroxy radicals) in a typical atmospheric envi-
lighted by the key role of chemical ionization mass spec-         ronment are extremely low (< 1 ppt). The measured spectra
trometry (CIMS) in improving our understanding of atmo-           must be averaged over a long period to decrease the noise
spheric chemical composition (Breitenlechner et al., 2017;        level so that these low signals can be unambiguously identi-
Ehn et al., 2014; Jokinen et al., 2012; Krechmer et al., 2018;    fied among noise. This step implies averaging spectra across
Lindinger et al., 1998; Yuan et al., 2017). Chemical ioniza-      files while maintaining mass accuracy. Although facilitated
tion is a soft ionization technique where the analytes are ion-   by the high mass resolution of the Orbitrap, a minor propor-
ized through a clustering process with the reagent ions and       tion of the detected signal peaks still inevitably overlap with
undergo only minimal fragmentation. While CIMS provides           each other. Therefore, peak fitting is needed to separate the
very good sensitivities (i.e., as low as 104 molecules cm−3 )     overlapped signal peaks. In addition, using a list (i.e., “peak
(Jokinen et al., 2012) and is suitable for measuring a wide       list”) of possible species obtained in similar atmospheric en-
variety of gaseous organic and inorganic compounds, it is         vironments reduces the expense of data analysis. The afore-
mainly associated with time-of-flight (TOF) mass analyzers.       mentioned features have already been realized in existing
The mass resolving power of a TOF analyzer typically ranges       software tools for analyzing data acquired with CIMS or
from hundreds to less than 50 000, and the mass resolving         proton-transfer-reaction (PTR) TOF MS, e.g., TofTools (Jun-
power of online TOF mass spectrometry (MS) used in at-            ninen et al., 2010), Tofware, and other software developed
mospheric measurements is only up to 15 000 (Riva et al.,         to analyze PTR TOF MS datasets (Holzinger, 2015; Müller
2019b). Although often able to distinguish some isobaric          et al., 2013). It would seem straightforward to convert the
species, these mass resolving powers still limit accurate as-     Orbitrap raw data into certain formats and then conduct data
signment and quantification of OVOCs in a complex air sam-        analysis using these existing software tools. However, due to
ple. The existence of multiple overlapping ions yields signif-    the high mass resolution of the Orbitrap compared to TOF
icant uncertainties (Cubison and Jimenez, 2015; Riva et al.,      mass analyzers, the computational expense will be high if
2019b; Stark et al., 2015). Computational approaches, in-         analyzing Orbitrap data using, for example, TofTools. This is
cluding ion deconvolution procedures, are required to partly      because the TOF mass spectra are stored on equally spaced
resolve this limitation in order to extract the maximum possi-    grids (with respect to TOF), with data points on the order
ble information content (Cubison and Jimenez, 2015; Meija         of 104 –105 . For comparison, approximately 108 data points
and Caruso, 2004; Zhang et al., 2019, 2020). To overcome          are needed to characterize a single Orbitrap spectrum using
these limitations, we have coupled a high-resolution mass         this grid-based data structure. Instead, saving only the sig-
spectrometer (Orbitrap; Eliuk and Makarov, 2015) with a           nals with their adjacent zeros will reduce the computational
chemical ionization source (Riva et al., 2019a, 2020) and         and storing expenses by orders of magnitude, and the Orbi-
an extractive electrospray ionization inlet (Lee et al., 2020)    trap raw data are saved using this data structure. In addition,
for online analysis. Similarly, Zuth et al. (2018) have com-      TofTools determines the noise level using the equally spaced
bined an atmospheric pressure chemical ionization (APCI)          data within a certain mass defect range, whereas such infor-
interface with an Orbitrap and have shown that such a tech-       mation is not recorded in the Orbitrap data. As a result, a
nology can achieve much greater mass resolving power at           new software tool for analyzing Orbitrap data is needed to
a similar detection limit for the real-time measurement of        facilitate its application in atmospheric research.
organic aerosols. As a result, chemical ionization, extrac-          In this study, we develop a new software tool, named Or-
tive electrospray ionization, and/or APCI–Orbitrap represent      bitool, for analyzing online Orbitrap mass spectrometry data.
very promising new techniques for online characterization of      The working principles and features of Orbitool are intro-
the chemical compositions of gaseous and particle phases at       duced. Several test examples using both laboratory and at-
a very high mass resolving power.                                 mospheric data are presented to illustrate and validate its fea-
   The demand for a new software tool for analyzing Orbi-         tures.
trap data comes along with applying an Orbitrap in long-term

Atmos. Meas. Tech., 14, 2377–2387, 2021                                            https://doi.org/10.5194/amt-14-2377-2021

R. Cai et al.: Orbitool: a new software tool for Orbitrap                                                                    2379

2     Orbitool                                                    eReader library, and the average is calculated with respect to
                                                                  scan number. Hence, it is assumed that the parameters de-
Orbitool is a software tool with a graphical user interface       termining the duration of every single scan (e.g., injection
(GUI) for analyzing online Orbitrap mass spectrometry data.       time and the number of microscans) are kept constant dur-
It is optimized for long-term field or laboratory campaigns       ing each time interval. When multiple data files are found
and laboratory studies. Flexible input and output interfaces      in the same time interval for averaging, the average spec-
facilitate the coupling between Orbitool and other software.      tra of each file are calculated first and then averaged with
Orbitool’s basic working principle is shown in Fig. 1, which      respect to time. Peaks close to each other in the averaged
includes data reading and averaging, noise determination and      spectrum are merged or identified as separated peaks accord-
reduction, peak shape determination, mass calibration, sig-       ing to the mass resolution of the Orbitrap. To facilitate quick
nal abundance determination via peak fitting, molecular for-      data analysis and minimize unnecessary expenses, averaging
mula assignment, and data output. The details of these fea-       is not conducted until either the user or Orbitool calls the av-
tures will be elaborated in the following sections. Orbitool is   eraged spectrum. Further, data averaging can be skipped. In
mainly coded in Python with support from several third-party      this case, single spectra are used instead of averaged spectra
libraries (Pedregosa et al., 2011; Goloborodko et al., 2013;      in the following steps. Orbitool also supports filtering data
Levitsky et al., 2018). To enhance computational speed, the       using the ion polarity. For instance, when the positive polar-
mass spectra are processed using the Numba package (Lam           ity is selected, only spectra from the positive mode are taken
et al., 2015) and chemical composition and signal abundance       for the averaging while spectra from the negative mode are
are determined using the Cython package (Behnel et al.,           excluded. Hence, this feature can support the analysis of Or-
2011). RawFileReader from Thermo Fisher Scientific is used        bitrap measurements that switch the ion polarity routinely
to read the raw data reported by Orbitrap. Orbitool was tested    (e.g., every 1 min) to realize near-real-time measurement of
in Python 3.6 on the Microsoft Windows operating system.          both positively and negatively charged compounds.
An executable version of Orbitool and its open-source codes
are publicly available (see “Code availability”).                 2.2   Noise determination and reduction

2.1    Data averaging                                             The noise is estimated and then removed from the average
                                                                  spectra during this step. When converting electronic signals
The data collected by the Orbitrap are stored in a RAW file,      into a spectrum via the Fourier transform, the instrument re-
containing segmented peak intensities and their correspond-       moves signals below the noise threshold defined by the Or-
ing masses of each scan, scan filters, event logs, instrumental   bitrap. Signals exceeding this noise threshold are converted
information, etc. The RAW file records only the spectra of all    into peaks recorded in the data file. Since this procedure does
the detected peaks rather than a dense grid-based spectrum.       not remove all the noise signals, some noise peaks are also
Most tuning parameters of Orbitrap, e.g., injection time of       recorded in the data file. In this study, “noise” refers to these
each microscan and the number of microscans for every sin-        noise peaks. It is difficult to separate the signal peaks for
gle scan, do not affect the analysis with Orbitool. However,      some compounds with low concentrations from noise peaks.
it should be specially clarified that Orbitool is compatible      However, after averaging for a sufficiently long period, the
with the profile mode but not the centroid mode of Orbi-          signal peaks usually exceed noise peaks because averaging
trap, because attributing chemical formulae to measured sig-      reduces the height of noise peaks but not signal peaks. To
nal peaks is based on fitting peaks to the profile data.          estimate the noise level, Orbitool first takes all the detected
   The first step to analyze raw mass spectrometry data with      peaks whose peak positions are located in the mass defect
Orbitool is reading and averaging the spectra. Since the abun-    range of [0.5, 0.8] Da. The mass defect is the absolute dif-
dances of most detected species can be extremely low, es-         ference between the accurate mass and the nominal mass of
pecially under typical ambient concentrations, averaging is       the given compound, which is determined by the type and
needed for identifying these signal peaks against noise. The      quantity of atoms contained in a compound and its ion polar-
raw data can be imported into Orbitool as single files or using   ity. Such a mass defect range is chosen because most of the
a file folder. The user can choose to average all the imported    observed compounds in atmospheric measurements are lo-
files or a subset of them. The average spectra are calculated     cated outside of this mass range (Zhang et al., 2019). Then,
based on either scan number or time. For the time-based data      peaks lower than a certain percentile of the peak heights in
averaging, time intervals are determined by the beginning         this mass defect range (0.5–0.8) are taken as noise peaks.
time, the end time, and the duration of each time interval.       This certain percentile can be customized, and it is by de-
Orbitool calculates the average spectrum for each time in-        fault 70 %; i.e., the 70 % low peaks within this mass defect
terval. The beginning and end times can be specified by the       range are taken as noise peaks and used to estimate the noise
user, while they are by default obtained from the time range      level. The noise and discriminator levels are determined as
of the input data files. The data recorded in the same file are   µ and µ + 3σ , respectively, where µ and σ are the mean
averaged using an averaging function in the Thermo RawFil-        and standard deviation of these noise peaks, respectively. The

https://doi.org/10.5194/amt-14-2377-2021                                            Atmos. Meas. Tech., 14, 2377–2387, 2021
2380                                                                     R. Cai et al.: Orbitool: a new software tool for Orbitrap

Figure 1. Simplified schematics of the working principle of Orbitool.

noise and discriminator levels as a function of mass can be             ence value of 200 Da is chosen because the instrumental res-
exported into files for further analysis.                               olution of the Orbitrap is usually reported at this mass. After
   Concerning different quantities of noise peaks in an av-             this normalization, the mass resolution at 200 Da is deter-
eraged spectrum, Orbitool provides three strategies to deal             mined via least-squares fitting. The shapes of some selected
with the obtained noise: (a) remove noise peaks below the               signal peaks composed of multiple ions may deviate from
discriminator level; (b) remove noise peaks below the dis-              others. The user can remove these peaks manually on the
criminator level and subtract the noise level (µ) from all sig-         GUI before the fitting. As shown in Fig. 2a, the normalized
nals above the discriminator level; (c) preserve all the noise          peaks can be well characterized using a normal distribution
peaks. Option (a) is the default setting. Option (b) is for av-         and the fitted resolution at 200 Da is close to the instrumental
eraging over a long period so that the signal peaks are likely          mass resolution.
to be overlapped by noise peaks, and hence the abundances
of signal peaks have contributions by noise. Option (c) is for          2.4   Mass calibration
averaging over a very short period so that it is difficult to dis-
tinguish signals from noise. In addition to correcting the im-          Due to the high mass resolving power of the Orbitrap, deter-
pact of noise on the signal abundance, removing noise peaks             mining the mass accurately is critical to assigning the molec-
reduces the expenses for both peak fitting and data storage.            ular formula corresponding to a measured peak. The Orbitrap
This is because each averaged spectrum in Orbitool is stored            is able to maintain its mass accuracy (i.e., < 2 ppm) for long
as a series of peaks rather than the signal intensities at each         time series with the help of constantly existing peaks with
given mass grid.                                                        relatively high abundances, named lock masses (Olsen et al.,
                                                                        2005). Despite this feature, additional mass calibration might
2.3    Single-peak-shape determination                                  be needed, especially for long-term measurements, to ensure
                                                                        an optimal assignment of molecular formulae across the en-
Although the mass resolution of the Orbitrap (e.g., 140 000             tire mass range. The user can also skip the mass calibration.
at mass 200 Da) is considerably higher than those of con-                  During the mass calibration step, Orbitool can automat-
ventional online mass spectrometers in atmospheric research             ically find the peaks of user-specified calibration species
(Riva et al., 2019a), some peaks (e.g., 13 C or 18 O isotopes)          within a given uncertainty range. The mass positions of these
in an Orbitrap spectrum might still need to be distinguished            calibration species are shown on the top of the averaged spec-
via fitting multiple peaks to the measured signals. A known             trum on the GUI to guide the eyes. Then, a calibration curve
single peak shape is necessary for the peak fitting, where a            is fitted using a polynomial function and shown on the GUI.
single peak herein refers to the signals contributed by com-            The users can set the degree of the polynomial and adjust the
pounds with a single molecular formula. A signal peak here-             calibration curve by using different calibration species. The
after refers to a measured peak, which may be composed of               spectra saved in the same raw data file share the same calibra-
a single ion or multiple different ions. Orbitool uses a nor-           tion parameters. The difference between the measured mass
mal distribution to characterize the single peak shape (see             and the calibration mass inferred from the chemical formula
Fig. 2a). To obtain the standard deviation of the normal dis-           is shown on the GUI. If the analyzed dataset contains more
tribution at different masses, Orbitool first takes the x-highest       than one raw file, the trends in these differences for all the
signal peaks in the spectrum, where x can be set from 1                 calibration species are displayed (Fig. 2b). The calibration
to 999 and is 100 by default. The √ mass resolution of Orbi-            information can also be exported for further analysis. Using
trap is inversely proportional to m (Zubarev and Makarov,               lock mass(es) during Orbitrap measurements can improve
2013), where m is mass;√ hence, the peak width is theoreti-             mass accuracy, but it requires a constantly existing com-
cally proportional to m. According to this relationship, the            pound in the measured spectra. When charging compounds
measured widths of these selected peaks   √ are normalized to           by chemical ionization, the reagent ion and its dimer are usu-
widths at 200 Da by dividing them by m/200 Da. A refer-                 ally in high abundance. Therefore, it is recommended to use

Atmos. Meas. Tech., 14, 2377–2387, 2021                                                  https://doi.org/10.5194/amt-14-2377-2021
R. Cai et al.: Orbitool: a new software tool for Orbitrap                                                                            2381

Figure 2. (a) Peak shape determined using the highest 100 peaks observed by the mass spectrometer. The position and width of signal peaks
were normalized to 200 Da. The intensity of each signal peak was normalized by dividing by its peak intensity. (b) Mass accuracy of product
ions at mass (in Da) 62 (red), 125 (grey), 183 (orange), 201 (green), 246 (blue), 358 (purple), and 401 (dark blue) before and after mass
calibration. Each data point (as indicated by the fluctuation of the lines) corresponds to a raw data file.

the reagent ions as lock masses when using a CI-Orbitrap.               mum numbers of atoms contained in each measured ion, the
Instead of excluding the lock masses from the spectra (i.e.,            range of equivalent double-bond numbers, and the maximum
the default setting in Xcalibur™), Orbitool treats the lock             tolerance of mass precision are used as boundary conditions.
masses as normal signals since the abundance of the reagent             Orbitool searches for all possible chemical formulae satisfy-
ion is usually a critical parameter for characterizing the per-         ing these boundary conditions for a given mass. If needed,
formance of a CI mass spectrometer.                                     the nitrogen rule can be used to help in constraining the peak
                                                                        identification (Pellegrin, 1983). An empty string is returned if
2.5   Peak assignment                                                   no possible chemical formula is found under the given condi-
                                                                        tions. The user can edit the retrieved chemical formulae after
                                                                        this automatic screening. A separate window on the GUI also
Identifying the abundances and assigning molecular formu-
                                                                        supports the conversion of chemical formulae to mass at any
lae of compounds contained in each signal peak are the main
                                                                        analyzing step and vice versa.
advantages of Orbitool. Before peak assignment, the user can
                                                                           Orbitool also supports the identification of isotopes. The
merge the peaks in a given mass range using a customized
                                                                        users can adjust the possible isotopes in an isotope list, and
mass tolerance. A merge sort algorithm (Knuth, 1998) is used
                                                                        all the isotopes in this list will be considered. Using the de-
to improve computational efficiency. The first step of peak
                                                                        fault algorithm for peak assignment, the molecular formula
assignment is to fit single peaks to the calibrated averaged
                                                                        containing a less abundant isotope can be determined only
spectrum. Since the width of a certain single peak is deter-
                                                                        when its corresponding formula containing the most abun-
mined by its position (mass), the fitted parameters are only
                                                                        dant isotope is found in the spectrum. In addition, this default
peak position and peak area (which can be converted to peak
                                                                        algorithm also checks whether the abundance ratio of these
height). Orbitool usually conducts a default peak fitting to the
                                                                        two species is consistent with their natural abundances within
whole spectra. The number of single peaks used to fit a signal
                                                                        the uncertainty range. To facilitate studies such as isotope-
peak is determined automatically according to the number of
                                                                        labeling experiments, Orbitool also provides an algorithm
local maxima of intensities. After a default fitting, the user
                                                                        that does not restrict isotope abundances during peak assign-
can look into each signal peak. The signal peak, fitted single
                                                                        ment. However, it is important to mention that the Orbitrap
peaks, and fitting residues are shown on the GUI to indicate
                                                                        provides non-linear responses when the concentrations of the
the quality of the default fitting. Orbitool supports repeating
                                                                        analytes are very low (i.e., < 1 × 10⁶ molecules cm−3 , at a
the peak fitting for each signal peak with a user-determined
                                                                        10 min integration time). As a result, the calculated isotope
single-ion number, and the updated fitting results for the sig-
                                                                        abundance may be substantially smaller than its true value
nal peak will replace the default fitting results in the whole
                                                                        (Riva et al., 2020).
spectra.
                                                                           After assigning molecular formulae to all the single peaks,
    The possible molecular formulae corresponding to each
                                                                        a mass list is generated from the fitted peak positions and
fitted single peak are retrieved during fitting. Prior to assign-
                                                                        their corresponding molecular formulae. The user may add
ing the molecular formulae from a given mass, the user can
                                                                        all the molecular formulae into the mass list or select only
customize the possible elements contained in the detected
                                                                        a proportion of them. The unidentified chemical species are
compounds and the ion polarity. The minimum and maxi-

https://doi.org/10.5194/amt-14-2377-2021                                                   Atmos. Meas. Tech., 14, 2377–2387, 2021
2382 R. Cai et al.: Orbitool: a new software tool for Orbitrap
shown with empty strings. The mass list can be exported and However, such uncertainties are practically negligible after
saved into a CSV file. Alternatively, an existing mass list with averaging the spectrum. To validate the algorithm used in
a certain format can be imported into Orbitool. The new mass Orbitool for estimating the noise level, Fig. 3 shows the to-
list imported from a file or retrieved from a new mass spec- tal number of peaks in each single or averaged spectrum
trum can either substitute the existing list or merge with it. measured in Shanghai. The noise and discriminator levels
Orbitool supports fitting the signal peaks using a mass list in- were first determined using a certain percentile of peaks in
stead of fitting all the signal peaks, which reduces the user’s the mass defect range of [0.5, 0.8] Da. Peaks below the de-
workload when analyzing the chemical species in a known termined discriminator level in the entire mass range were
system. For instance, when measuring ambient air, the user then taken as noise and removed from the spectrum. Con-
can average data over a whole day to obtain a mass list. Af- sidering that some species may not be detected in a single
ter this, the user may restart data analysis from the beginning scan (i.e., present at a very low concentration), the total num-
and average the raw data with a higher temporal resolution ber of peaks in the averaged spectrum should grow with the
(e.g., 30 min). Then, the user may fit the signals using the increasing averaging time when the period is considerably
former mass list derived from the whole day instead of re- short, and then it should converge to a certain value when the
peating the default fitting and a manual correction. averaging period is sufficiently long. This is consistent with
the observed trend in the total number of peaks after noise
2.6 Time series and mass defect reduction in Fig. 3, in which the total number of peaks af-
ter noise reduction with the 50th percentile increases slightly
The time series (temporal evolution of abundance) of given with an increasing averaging time. In contrast, the total num-
chemical species can be calculated based on the measured ber of peaks without noise reduction increases dramatically
time-evolving spectra. The chemical species for the time se- with the increasing averaging time, indicating that most of
ries are usually chosen from the mass list. Due to the un- the peaks observed in the averaged spectrum are noise. In
avoidable random error in the measured mass even after mass addition, using the 25th or 70th percentile does not lead to a
calibration, Orbitool searches for these chosen peaks within significant difference in the total number of peaks after noise
a customized uncertainty range (e.g., 1 or 2 ppm). The time reduction (within 5 %–10 %), which indicates that the noise
series of all the chosen species are displayed on the GUI, level is governed by the instrument rather than by the cus-
and they can be exported into other file formats. The tempo- tomized percentile value. Accordingly, Orbitool uses the 70th
ral resolution of these time series is configured in the data- percentile as the default value to estimate the noise and dis-
averaging step. To facilitate a quick analysis, Orbitool can criminator levels.
also show the time series of a given compound instead of us- Combining data averaging and noise reduction, Orbitool
ing a mass list. The input for specifying this compound is can remove most of the noise while maintaining most of
either its accurate mass (or its molecular formula which will the signal peaks. Figure 4 shows the averaged spectra be-
be automatically converted into accurate mass) with a mass fore and after noise reduction measured from the ozonolysis
tolerance or a mass range. Using this feature, the user can of monoterpenes in ambient indoor air conditions and am-
also obtain the abundance of all the signals within a wide bient air measured in Shanghai. The noise levels were cal-
mass range. Orbitool is also able to show the mass defect culated using the 70th percentile of peaks in the mass de-
plot on the GUI for intuitive and rapid characterization of an fect range of [0.5, 0.8] Da. They can also be identified by
averaged spectrum. The size of data points is determined by eye in the mass range from 600 to 750 Da, where only a few
their intensity, which can be tuned on the GUI. These data signal peaks were detected and noise peaks are at approxi-
points are colored by the number of a chosen element (e.g., mately the same height. The noise level in Fig. 4b is lower
C, O, N) or the double-bond equivalent. The peaks without than that in Fig. 4a because it was averaged for a longer
assigned molecular formulae can be either omitted or dis- period. Of the measured peaks in the Shanghai dataset af-
played in grey. ter the 30 min averaging, 97 % were identified as noise and
hence removed. Since no significant mass dependencies on
noise and discriminator levels were observed, Orbitool uses
3 Results and discussion size-independent noise and discriminator levels. It should be
clarified that some signal peaks with low abundances may
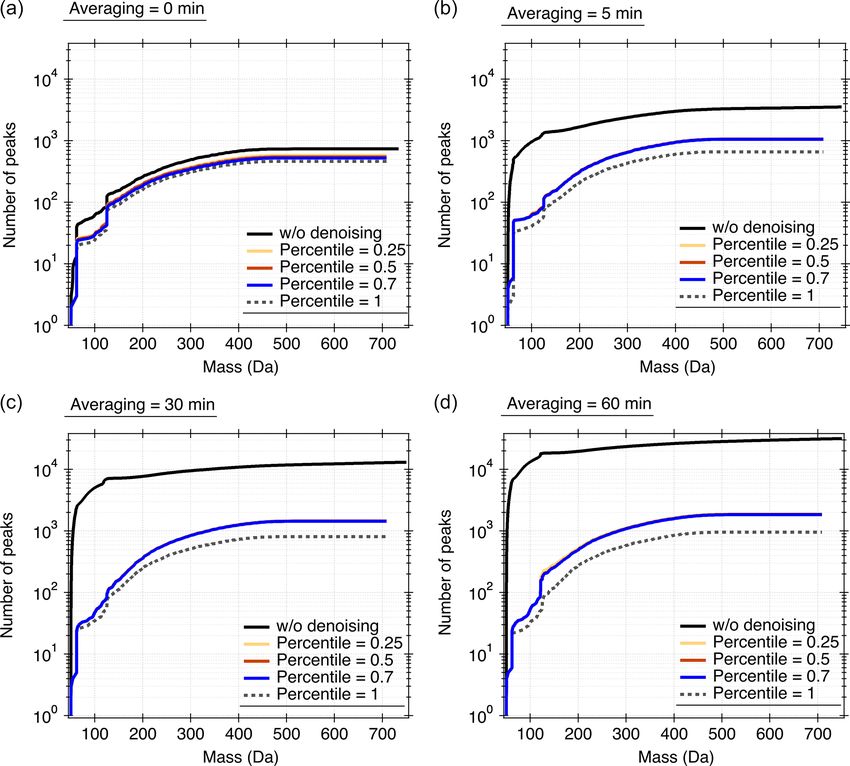
As illustrated in Sect. 2.2, Orbitool estimates the noise be mistaken as noise peaks during noise reduction. Even af-
level and discriminator level based on the statistics of the ter averaging for a longer period, some detected compounds
measured spectra. Except for the mass defect range of with extremely low abundances may still be below the dis-
[0.5, 0.8] Da, no prior information is used for determining criminator level.
the noise level. This indicates that one cannot unambigu- To illustrate the capabilities of Orbitool, measured ions de-
ously distinguish every signal peak from the noise, which picted in Fig. 4b were characterized. A total of 1850 molecu-
may theoretically introduce uncertainties in retrieving molec- lar formulae were identified. Figure 5 shows the correspond-
ular formulae and abundances of the measured compounds. ing mass defect plot of gaseous compounds measured in ur-
Atmos. Meas. Tech., 14, 2377–2387, 2021 https://doi.org/10.5194/amt-14-2377-2021R. Cai et al.: Orbitool: a new software tool for Orbitrap 2383 Figure 3. Number of peaks automatically detected in ambient air by Orbitool with and without noise reduction and for different averaging times. When the 100th percentile is used (i.e., the percentile is 1 in the figure), all the peaks in the mass defect range of [0.5, 0.8] were removed. Figure 4. The noise and discriminator levels of mass spectra obtained from the ozonolysis of monoterpenes in (a) ambient indoor air conditions (via peeling an orange in front of the Orbitrap) and (b) ambient air measured in Shanghai (31 October 2019 between 14:00– 14:30 UTC+8). The averaging span for raw data in (a, b) was 5 and 30 min, respectively. The 70th percentile was used to estimate the noise and discriminator level. https://doi.org/10.5194/amt-14-2377-2021 Atmos. Meas. Tech., 14, 2377–2387, 2021
2384                                                               R. Cai et al.: Orbitool: a new software tool for Orbitrap

                                                                  surements. The noise reduction was demonstrated to be able
                                                                  to separate signal peaks from noise and reduce the number
                                                                  of saved data. For instance, the total number of peaks of a
                                                                  test spectrum averaged over 30 min was reduced by 97 %.
                                                                  The mass defect plot retrieved using Orbitool indicates that
                                                                  most of the chemical species in urban Shanghai measured
                                                                  by a CI-Orbitrap were organic compounds and reveals the
                                                                  presence of gaseous compounds with unique compositions
                                                                  (i.e., CHONS, CHOS).
                                                                     Orbitool is open-source and freely available for download
                                                                  (see “Code availability” below). We hope that it will evolve
                                                                  in the future with added features, optimally as a community
                                                                  effort as Orbitrap mass spectrometers become increasingly
                                                                  utilized as tools for online studies within, and possibly out-
                                                                  side, atmospheric sciences.

Figure 5. Mass defect of gaseous compounds observed using         Code availability. An executable version of Orbitool and its source
the CI-Orbitrap in Shanghai (31 October 2019 between 14:00–       codes can be found at https://orbitrap.catalyse.cnrs.fr (last access:
14:30 UTC+8).                                                     4 February 2021, Orbitool, 2021). The users can run either Main.py
                                                                  via Python or Orbitool.exe without Python. The required Python en-
                                                                  vironment (optional) for Orbitool is described in detail on the web-
                                                                  site. Orbitool will be continuously updated in the future. It is recom-
ban Shanghai, whose data were retrieved and exported by Or-       mended to contact the corresponding authors for needs on software
bitool. Organic compounds contributed to a major proportion       development.
of the measured compounds. The reagent ion (i.e., NO−    3 ) is
not considered when sorting out the different ions into fam-
ily groups. Hence the chemical analysis reveals that due to its   Data availability. Data will be made available upon request from
higher mass resolving power compared to other online mass         the corresponding authors.
spectrometers, the CI-Orbitrap identifies a large number of
gas-phase signals with elemental composition categories in-
cluding CHO, CHON, CHONS, and CHOS. In addition, in-              Author contributions. MR initialized this study; YL, RC, and YC
organic sulfuric acid was observed, which has been reported       wrote the software with the help of YP; DL, CD, YM, CH, CG, and
to be one of the major gaseous precursors for nucleation in       MR conducted the experiments; DL, CD, SP, YM, ME, and MR
Shanghai (Yao et al., 2018). Interestingly, the presence of       tested Orbitool; MR analyzed the data; MF and LB developed the
highly oxygenated CHONS and CHOS species might indi-              website; RC and MR wrote the manuscript with contributions from
                                                                  all co-authors.
cate the existence of uncharted chemical processes.

                                                                  Competing interests. The authors declare that they have no conflict
4   Summary                                                       of interest.

We developed a software tool named Orbitool for analyzing
long-term online Orbitrap mass spectrometry data in atmo-         Acknowledgements. We gratefully acknowledge Jianmin Chen and
spheric research. Orbitool is capable of averaging raw data       Hui Chen (Fudan University) for their support during the field cam-
across files while improving the mass accuracy, distinguish-      paign. We would like to thank Bin-Yu Kuang (Zhejiang University)
ing signal peaks against noise peaks, assigning chemical          for useful discussions. Matthieu Riva wishes to thank the French na-
compounds and their isotopes via peak fitting, and exporting      tional program LEFE (Les Enveloppes Fluides et l’Environnement)
time series and mass defect plots. Compared to similar soft-      for their financial support.
ware tools for atmospheric science studies such as TofTools,
Orbitool redesigned the storage method for the measured
signals so that it reduces the computational and storage ex-      Financial support. This research has been supported by the Euro-
penses. The data measured in a laboratory study on ozonoly-       pean Research Council (ERC-StG MAARvEL (grant no. 852161)
sis of monoterpenes and in the ambient air of Shanghai were       and ERC-StG CHAPAs (grant no. 850614)), the National Key
used to test Orbitool. The mass axis uncertainty after calibra-   R&D Program of China (grant nos. 2016YFC0200104 and
                                                                  2018YFC0213800), the Academy of Finland (grant no. 332547),
tion using Orbitool was < 0.5 ppm in this test, which is lower
than the average uncertainty of 2 ppm calibrated during mea-

Atmos. Meas. Tech., 14, 2377–2387, 2021                                              https://doi.org/10.5194/amt-14-2377-2021
R. Cai et al.: Orbitool: a new software tool for Orbitrap 2385
and the French national program LEFE (Les Enveloppes Fluides et Holzinger, R.: PTRwid: A new widget tool for processing
l’Environnement). PTR-TOF-MS data, Atmos. Meas. Tech., 8, 3903–3922,
https://doi.org/10.5194/amt-8-3903-2015, 2015.
Jimenez, J. L., Canagaratna, M. R., Donahue, N. M., Pre-
Review statement. This paper was edited by Pierre Herckes and re- vot, A. S. H., Zhang, Q., Kroll, J. H., DeCarlo, P. F., Allan, J. D.,
viewed by four anonymous referees. Coe, H., Ng, N. L., Aiken, A. C., Docherty, K. S., Ulbrich, I. M.,
Grieshop, A. P., Robinson, A. L., Duplissy, J., Smith, J. D., Wil-
son, K. R., Lanz, V. A., Hueglin, C., Sun, Y. L., Tian, J., Laakso-
nen, A., Raatikainen, T., Rautiainen, J., Vaattovaara, P., Ehn, M.,
Kulmala, M., Tomlinson, J. M., Collins, D. R., Cubison, M. J., E.,
References Dunlea, J., Huffman, J. A., Onasch, T. B., Alfarra, M. R.,
Williams, P. I., Bower, K., Kondo, Y., Schneider, J., Drewnick, F.,
Behnel, S., Bradshaw, R., Citro, C., Dalcin, L., Seljebotn, D. S., and Borrmann, S., Weimer, S., Demerjian, K., Salcedo, D., Cot-
Smith, K.: Cython: The Best of Both Worlds, Comput. Sci. Eng. trell, L., Griffin, R., Takami, A., Miyoshi, T., Hatakeyama, S.,
13, 31–39, https://doi.org/10.1109/MCSE.2010.118, 2011. Shimono, A., Sun, J. Y., Zhang, Y. M., Dzepina, K., Kim-
Breitenlechner, M., Fischer, L., Hainer, M., Heinritzi, M., mel, J. R., Sueper, D., Jayne, J. T., Herndon, S. C., Trim-
Curtius, J., and Hansel, A.: PTR3: An Instrument born, A. M., Williams, L. R., Wood, E. C., Middlebrook, A. M.,
for Studying the Lifecycle of Reactive Organic Car- Kolb, C. E., Baltensperger, U., and Worsnop, D. R.: Evolution of
bon in the Atmosphere, Anal. Chem., 89, 5824–5831, Organic Aerosols in the Atmosphere, Science, 326, 1525–1529,
https://doi.org/10.1021/acs.analchem.6b05110, 2017. https://doi.org/10.1126/science.1180353, 2009.
Cubison, M. J. and Jimenez, J. L.: Statistical precision of the in- Jokinen, T., Sipilä, M., Junninen, H., Ehn, M., Lönn, G., Hakala, J.,
tensities retrieved from constrained fitting of overlapping peaks Petäjä, T., Mauldin III, R. L., Kulmala, M., and Worsnop, D. R.:
in high-resolution mass spectra, Atmos. Meas. Tech., 8, 2333– Atmospheric sulphuric acid and neutral cluster measurements
2345, https://doi.org/10.5194/amt-8-2333-2015, 2015. using CI-APi-TOF, Atmos. Chem. Phys., 12, 4117–4125,
Ehn, M., Thornton, J. A., Kleist, E., Sipilä, M., Junninen, H., https://doi.org/10.5194/acp-12-4117-2012, 2012.
Pullinen, I., Springer, M., Rubach, F., Tillmann, R., Lee, B., Junninen, H., Ehn, M., Petäjä, T., Luosujärvi, L., Kotiaho, T., Kos-
Lopez-Hilfiker, F., Andres, S., Acir, I.-H., Rissanen, M., Joki- tiainen, R., Rohner, U., Gonin, M., Fuhrer, K., Kulmala, M., and
nen, T., Schobesberger, S., Kangasluoma, J., Kontkanen, J., Worsnop, D. R.: A high-resolution mass spectrometer to mea-
Nieminen, T., Kurtén, T., Nielsen, L. B., Jørgensen, S., Kjaer- sure atmospheric ion composition, Atmos. Meas. Tech., 3, 1039–
gaard, H. G., Canagaratna, M., Maso, M. D., Berndt, T., 1053, https://doi.org/10.5194/amt-3-1039-2010, 2010.
Petäjä, T., Wahner, A., Kerminen, V.-M., Kulmala, M., Kirkby, J., Duplissy, J., Sengupta, K., Frege, C., Gordon, H.,
Worsnop, D. R., Wildt, J., and Mentel, T. F.: A large source of Williamson, C., Heinritzi, M., Simon, M., Yan, C., Almeida, J.,
low-volatility secondary organic aerosol, Nature, 506, 476–479, Tröstl, J., Nieminen, T., Ortega, I. K., Wagner, R., Adamov, A.,
https://doi.org/10.1038/nature13032, 2014. Amorim, A., Bernhammer, A.-K., Bianchi, F., Breitenlech-
Eliuk, S. and Makarov, A.: Evolution of Orbitrap Mass Spec- ner, M., Brilke, S., Chen, X., Craven, J., Dias, A., Ehrhart, S.,
trometry Instrumentation, Annu. Rev. Anal. Chem., 8, 61–80, Flagan, R. C., Franchin, A., Fuchs, C., Guida, R., Hakala, J.,
https://doi.org/10.1146/annurev-anchem-071114-040325, 2015. Hoyle, C. R., Jokinen, T., Junninen, H., Kangasluoma, J., Kim, J.,
Glasius, M. and Goldstein, A. H.: Recent Discover- Krapf, M., Kürten, A., Laaksonen, A., Lehtipalo, K., Makhmu-
ies and Future Challenges in Atmospheric Organic tov, V., Mathot, S., Molteni, U., Onnela, A., Peräkylä, O.,
Chemistry, Environ. Sci. Technol., 50, 2754–2764, Piel, F., Petäjä, T., Praplan, A. P., Pringle, K., Rap, A.,
https://doi.org/10.1021/acs.est.5b05105, 2016. Richards, N. A. D., Riipinen, I., Rissanen, M. P., Rondo, L.,
Goldstein, A. H. and Galbally, I. E.: Known and Unexplored Or- Sarnela, N., Schobesberger, S., Scott, C. E., Seinfeld, J. H., Sip-
ganic Constituents in the Earth’s Atmosphere, Environ. Sci. ilä, M., Steiner, G., Stozhkov, Y., Stratmann, F., Tomé, A., Vir-
Technol., 41, 1514–1521, https://doi.org/10.1021/es072476p, tanen, A., Vogel, A. L., Wagner, A. C., Wagner, P. E., Wein-
2007. gartner, E., Wimmer, D., Winkler, P. M., Ye, P., Zhang, X.,
Goloborodko, A. A., Levitsky, L. I., Ivanov, M. V., and Hansel, A., Dommen, J., Donahue, N. M., Worsnop, D. R., Bal-
Gorshkov, M. V.: Pyteomics – a Python framework for tensperger, U., Kulmala, M., Carslaw, K. S., and Curtius, J.: Ion-
exploratory data analysis and rapid software prototyping induced nucleation of pure biogenic particles, Nature, 533, 521–
in proteomics, J. Am. Soc. Mass Spectr., 24, 301–304, 526, https://doi.org/10.1038/nature17953, 2016.
https://doi.org/10.1007/s13361-012-0516-6, 2013. Kovalchik, K. A., Moggridge, S., Chen, D. D. Y., Morin, G. B.,
Hallquist, M., Wenger, J. C., Baltensperger, U., Rudich, Y., Simp- and Hughes, C. S.: Parsing and Quantification of Raw Orbitrap
son, D., Claeys, M., Dommen, J., Donahue, N. M., George, C., Mass Spectrometer Data Using RawQuant, J. Proteome Res.,
Goldstein, A. H., Hamilton, J. F., Herrmann, H., Hoffmann, T., 17, 2237–2247, https://doi.org/10.1021/acs.jproteome.8b00072,
Iinuma, Y., Jang, M., Jenkin, M. E., Jimenez, J. L., Kiendler- 2018.
Scharr, A., Maenhaut, W., McFiggans, G., Mentel, Th. F., Kovalchik, K. A., Colborne, S., Spencer, S. E., Sorensen, P. H.,
Monod, A., Prévôt, A. S. H., Seinfeld, J. H., Surratt, J. D., Chen, D. D. Y., Morin, G. B., and Hughes, C. S.: RawTools:
Szmigielski, R., and Wildt, J.: The formation, properties and im- Rapid and Dynamic Interrogation of Orbitrap Data Files for Mass
pact of secondary organic aerosol: current and emerging issues, Spectrometer System Management, J. Proteome Res., 18, 700–
Atmos. Chem. Phys., 9, 5155–5236, https://doi.org/10.5194/acp- 708, https://doi.org/10.1021/acs.jproteome.8b00721, 2019.
9-5155-2009, 2009.
https://doi.org/10.5194/amt-14-2377-2021 Atmos. Meas. Tech., 14, 2377–2387, 20212386 R. Cai et al.: Orbitool: a new software tool for Orbitrap Krechmer, J., Lopez-Hilfiker, F., Koss, A., Hutterli, M., Stoer- Pellegrin, V.: Molecular formulas of organic compounds: the nitro- mer, C., Deming, B., Kimmel, J., Warneke, C., Holzinger, R., gen rule and degree of unsaturation, J. Chem. Educ., 60, 626, Jayne, J. T., Worsnop, D. R., Fuhrer, K., Gonin, M., and de https://doi.org/10.1021/ed060p626, 1983. Gouw, J. A.: Evaluation of a New Reagent-Ion Source and Riva, M., Ehn, M., Li, D., Tomaz, S., Bourgain, F., Perrier, S., and Focusing Ion-Molecule Reactor for use in Proton-Transfer- George, C.: CI-Orbitrap: An Analytical Instrument To Study At- Reaction Mass Spectrometry, Anal. Chem., 90, 12011–12018, mospheric Reactive Organic Species, Anal. Chem., 91, 9419– https://doi.org/10.1021/acs.analchem.8b02641, 2018. 9423, https://doi.org/10.1021/acs.analchem.9b02093, 2019a. Knuth, D.: Sorting by Merging, Sect. 5.2.4, in: The Art of Com- Riva, M., Rantala, P., Krechmer, J. E., Peräkylä, O., Zhang, Y., puter Programming 3: Sorting and Searching, 2nd edn., Addison- Heikkinen, L., Garmash, O., Yan, C., Kulmala, M., Worsnop, D., Wesley, Massachusetts, 1998. and Ehn, M.: Evaluating the performance of five different Lam, S. K., Pitrou, A., and Seibert, S.: Numba: A LLVM-Based chemical ionization techniques for detecting gaseous oxy- Python JIT Compiler, in: Proceedings of the Second Workshop genated organic species, Atmos. Meas. Tech., 12, 2403–2421, on the LLVM Compiler Infrastructure in HPC (LLVM ’15), As- https://doi.org/10.5194/amt-12-2403-2019, 2019b. sociation for Computing Machinery, New York, NY, USA, Arti- Riva, M., Brüggemann, M., Li, D., Perrier, S., George, C., Her- cle 7, 1–6, https://doi.org/10.1145/2833157.2833162, 2015. rmann, H. and Berndt, T.: The capability of CI-Orbitrap for Lee, C. P., Riva, M., Wang, D., Tomaz, S., Li, D., Per- gas-phase analysis in atmospheric chemistry: A comparison rier, S., Slowik, J. G., Bourgain, F., Schmale, J., Pre- with the CI-APi-TOF technique, Anal. Chem., 92, 8142–8150, vot, A. S. H., Baltensperger, U., George, C., and El Had- https://doi.org/10.1021/acs.analchem.0c00111, 2020. dad, I.: Online Aerosol Chemical Characterization by Extractive Shrivastava, M., Cappa, C. D., Fan, J., Goldstein, A. H., Guen- Electrospray Ionization–Ultrahigh-Resolution Mass Spectrom- ther, A. B., Jimenez, J. L., Kuang, C., Laskin, A., Martin, S. T., etry (EESI-Orbitrap), Environ. Sci. Technol., 54, 3871–3880, Ng, N. L., Petaja, T., Pierce, J. R., Rasch, P. J., Roldin, P., Se- https://doi.org/10.1021/acs.est.9b07090, 2020. infeld, J. H., Shilling, J., Smith, J. N., Thornton, J. A., Volka- Levitsky, L. I., Klein, J., Ivanov, M. V., and Gorshkov, M. V.: mer, R., Wang, J., Worsnop, D. R., Zaveri, R. A., Zelenyuk, A., Pyteomics 4.0: five years of development of a Python and Zhang, Q.: Recent advances in understanding secondary or- proteomics framework, J. Proteome Res., 18, 709–714, ganic aerosol: Implications for global climate forcing: Advances https://doi.org/10.1021/acs.jproteome.8b00717, 2018. in Secondary Organic Aerosol, Rev. Geophys., 55, 509–559, Li, H., Riva, M., Rantala, P., Heikkinen, L., Daellenbach, K., Krech- https://doi.org/10.1002/2016RG000540, 2017. mer, J. E., Flaud, P.-M., Worsnop, D., Kulmala, M., Villenave, E., Stark, H., Yatavelli, R. L. N., Thompson, S. L., Kimmel, J. R., Cu- Perraudin, E., Ehn, M., and Bianchi, F.: Terpenes and their oxi- bison, M. J., Chhabra, P. S., Canagaratna, M. R., Jayne, J. T., dation products in the French Landes forest: insights from Vocus Worsnop, D. R., and Jimenez, J. L.: Methods to extract molecu- PTR-TOF measurements, Atmos. Chem. Phys., 20, 1941–1959, lar and bulk chemical information from series of complex mass https://doi.org/10.5194/acp-20-1941-2020, 2020. spectra with limited mass resolution, Int. J. Mass Spectrom., 389, Lindinger, W., Hansel, A., and Jordan, A.: On-line monitoring 26–38, https://doi.org/10.1016/j.ijms.2015.08.011, 2015. of volatile organic compounds at pptv levels by means of Weber, R. J. M. and Zhou, J.: DIMSpy: Python pack- proton-transfer-reaction mass spectrometry (PTR-MS) medical age for processing direct-infusion mass spectrometry-based applications, food control and environmental research, Int. J. metabolomics and lipidomics data, Version v1.4.0, Zenodo, Mass Spectrom., 173, 191–241, https://doi.org/10.1016/S0168- https://doi.org/10.5281/zenodo.3764110, 2019. 1176(97)00281-4, 1998. Wennberg, P. O., Bates, K. H., Crounse, J. D., Dodson, L. G., Meija, J. and Caruso, J. A.: Deconvolution of isobaric interfer- McVay, R. C., Mertens, L. A., Nguyen, T. B., Praske, E., ences in mass spectra, J. Am. Soc. Mass Spectrom., 15, 654–658, Schwantes, R. H., Smarte, M. D., St Clair, J. M., Teng, A. P., https://doi.org/10.1016/j.jasms.2003.12.016, 2004. Zhang, X., and Seinfeld, J. H.: Gas-Phase Reactions of Isoprene Müller, M., Mikoviny, T., Jud, W., D’Anna, B., and Wisthaler, A.: and Its Major Oxidation Products, Chem. Rev., 118, 3337–3390, A new software tool for the analysis of high resolution PTR- https://doi.org/10.1021/acs.chemrev.7b00439, 2018. TOF mass spectra, Chemometr. Intell. Lab., 127, 158–165, Yao, L., Garmash, O., Bianchi, F., Zheng, J., Yan, C., Kontkanen, J., https://doi.org/10.1016/j.chemolab.2013.06.011, 2013. Junninen, H., Mazon, S. B., Ehn, M., Paasonen, P., Sipilä, M., Olsen, J. V., de Godoy, L. M., Li, G., Macek, B., Mortensen, P., Wang, M., Wang, X., Xiao, S., Chen, H., Lu, Y., Zhang, B., Pesch, R., Makarov, A., Lange, O., Horning, S., and Mann, M.: Wang, D., Fu, Q., Geng, F., Li, L., Wang, H., Qiao, L., Yang, X., Parts per million mass accuracy on an Orbitrap mass spectrome- Chen, J., Kerminen, V.-M., Petäjä, T., Worsnop, D. R., Kul- ter via lock mass injection into a C-trap, Mol. Cell. Proteomics, mala, M., and Wang, L.: Atmospheric new particle formation 4, 2010–2021, https://doi.org/10.1074/mcp.T500030-MCP200, from sulfuric acid and amines in a Chinese megacity, Science, 2005. 361, 278–281, https://doi.org/10.1126/science.aao4839, 2018. Orbitool: Analysis of online Orbitrap mass spectrometric data, Yuan, B., Koss, A. R., Warneke, C., Coggon, M., Sekimoto, K., and available at: https://orbitrap.catalyse.cnrs.fr, last access: 4 Febru- de Gouw, J. A.: Proton-Transfer-Reaction Mass Spectrometry: ary 2021. Applications in Atmospheric Sciences, Chem. Rev., 117, 13187– Pedregosa, F., Varoquaux, G., Gramfort, A., Michel, V., Thirion, B., 13229, https://doi.org/10.1021/acs.chemrev.7b00325, 2017. Grisel, O., Blondel, M., Prettenhofer, P., Weiss, R., Dubourg, V., Zhang, Y., Peräkylä, O., Yan, C., Heikkinen, L., Äijälä, M., Dael- Vanderplas, J., Passos, A., Cournapeau, D., Brucher, M., Per- lenbach, K. R., Zha, Q., Riva, M., Garmash, O., Junninen, H., rot, M., and Duchesnay, E.: Scikit-learn: Machine Learning in Paatero, P., Worsnop, D., and Ehn, M.: A novel approach for Python, J. Mach. Learn. Res., 12, 2825–2830, 2011. simple statistical analysis of high-resolution mass spectra, At- Atmos. Meas. Tech., 14, 2377–2387, 2021 https://doi.org/10.5194/amt-14-2377-2021
R. Cai et al.: Orbitool: a new software tool for Orbitrap                                                                       2387

  mos. Meas. Tech., 12, 3761–3776, https://doi.org/10.5194/amt-      Zubarev, R. A. and Makarov, A.: Orbitrap Mass Spectrometry, Anal.
  12-3761-2019, 2019.                                                  Chem., 85, 5288–5296, https://doi.org/10.1021/ac4001223,
Zhang, Y., Peräkylä, O., Yan, C., Heikkinen, L., Äijälä, M., Dael-     2013.
  lenbach, K. R., Zha, Q., Riva, M., Garmash, O., Junninen, H.,      Zuth, C., Vogel, A. L., Ockenfeld, S., Huesmann, R., and Hoff-
  Paatero, P., Worsnop, D., and Ehn, M.: Insights into atmo-           mann, T.: Ultrahigh-Resolution Mass Spectrometry in Real
  spheric oxidation processes by performing factor analyses on         Time: Atmospheric Pressure Chemical Ionization Orbitrap Mass
  subranges of mass spectra, Atmos. Chem. Phys., 20, 5945–5961,        Spectrometry of Atmospheric Organic Aerosol, Anal. Chem.,
  https://doi.org/10.5194/acp-20-5945-2020, 2020.                      90, 8816–8823, https://doi.org/10.1021/acs.analchem.8b00671,
                                                                       2018.

https://doi.org/10.5194/amt-14-2377-2021                                               Atmos. Meas. Tech., 14, 2377–2387, 2021
You can also read


