N myristoyltransferase 1 is necessary for lysosomal degradation and mTORC1 activation in cancer cells - Nature
←
→
Page content transcription
If your browser does not render page correctly, please read the page content below
www.nature.com/scientificreports
OPEN N‑myristoyltransferase‑1
is necessary for lysosomal
degradation and mTORC1
activation in cancer cells
Yu‑Chuan Chen1, Marian S. Navarrete2, Ying Wang3, Natalie C. McClintock4,
Reiko Sakurai3, Feng Wang5,8, Kathryn T. Chen4, Tsui‑Fen Chou5,6,7,8, Virender K. Rehan3,6,
Delphine J. Lee2,6,7 & Begoña Diaz 1,6,7*
N-myristoyltransferase-1 (NMT1) catalyzes protein myristoylation, a lipid modification that
is elevated in cancer cells. NMT1 sustains proliferation and/or survival of cancer cells through
mechanisms that are not completely understood. We used genetic and pharmacological inhibition
of NMT1 to further dissect the role of this enzyme in cancer, and found an unexpected essential role
for NMT1 at promoting lysosomal metabolic functions. Lysosomes mediate enzymatic degradation
of vesicle cargo, and also serve as functional platforms for mTORC1 activation. We show that NMT1
is required for both lysosomal functions in cancer cells. Inhibition of NMT1 impaired lysosomal
degradation leading to autophagy flux blockade, and simultaneously caused the dissociation of mTOR
from the surface of lysosomes leading to decreased mTORC1 activation. The regulation of lysosomal
metabolic functions by NMT1 was largely mediated through the lysosomal adaptor LAMTOR1.
Accordingly, genetic targeting of LAMTOR1 recapitulated most of the lysosomal defects of targeting
NMT1, including defective lysosomal degradation. Pharmacological inhibition of NMT1 reduced tumor
growth, and tumors from treated animals had increased apoptosis and displayed markers of lysosomal
dysfunction. Our findings suggest that compounds targeting NMT1 may have therapeutic benefit in
cancer by preventing mTORC1 activation and simultaneously blocking lysosomal degradation, leading
to cancer cell death.
Myristoylation consists of the transfer of the fatty acid myristic acid to proteins1, and is catalyzed in vertebrates
by two isoenzymes called N-myristoyltransferases (NMTs): N MT12 and N MT23. Myristoylation increases the
affinity of proteins for plasma and internal cell membranes and modulates protein activity by a number of
mechanisms1,4. NMT1 is essential for early embryonic d evelopment5, and deletion of both isoenzymes impairs
T cell development and activation in mice6. NMT1 expression is increased in cancer7, associates with poor
patient outcome8, and has been considered as a target for therapeutic i ntervention9. Accordingly, NMT1 activity
promotes proliferation and survival of ovarian and colon cancer c ells10, facilitates cancer cells survival through
AMPKβ-dependent regulation of m itophagy8, promotes Src-dependent cell cycle progression in prostate c ancer11,
and regulates p roteostasis12,13.
1
Division of Medical Hematology Oncology, Department of Medicine, The Lundquist Institute for Biomedical
Innovation at Harbor-UCLA Medical Center, Torrance, CA 90502, USA. 2Division of Dermatology, Department of
Medicine, The Lundquist Institute for Biomedical Innovation at Harbor-UCLA Medical Center, Torrance, CA 90502,
USA. 3Division of Neonatology, Department of Pediatrics, The Lundquist Institute for Biomedical Innovation
at Harbor-UCLA Medical Center, Torrance, CA 90502, USA. 4Division of Surgical Oncology, Department of
Surgery, Harbor-UCLA Medical Center, Torrance, CA 90502, USA. 5Division of Medical Genetics, Department of
Pediatrics, The Lundquist Institute for Biomedical Innovation at Harbor-UCLA Medical Center, Torrance, CA 90502,
USA. 6David Geffen School of Medicine at UCLA, Los Angeles, CA, USA. 7Jonsson Comprehensive Cancer Center,
UCLA, Los Angeles, CA, USA. 8Present address: Biology and Biological Engineering, California Institute of
Technology, Pasadena, CA, USA. *email: bdiaz@lundquist.org
Scientific Reports | (2020) 10:11952 | https://doi.org/10.1038/s41598-020-68615-w 1
Vol.:(0123456789)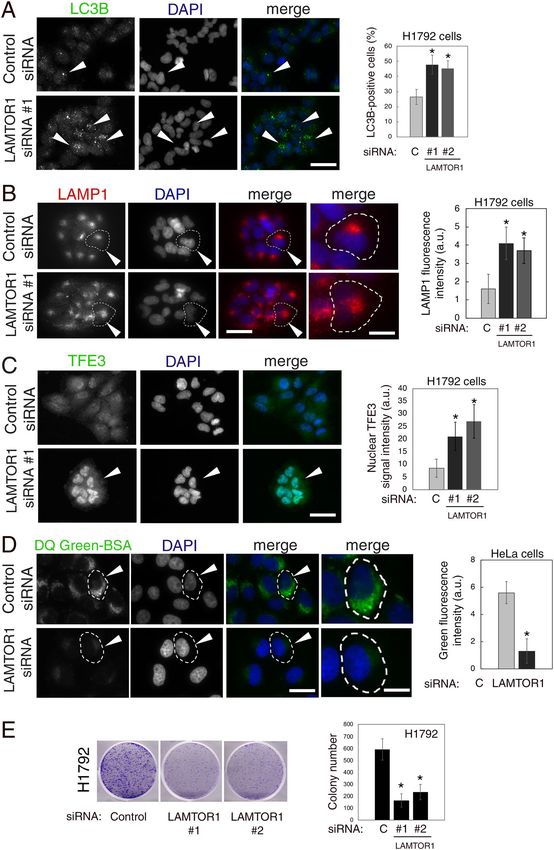
www.nature.com/scientificreports/

          Scientific Reports |   (2020) 10:11952 |   https://doi.org/10.1038/s41598-020-68615-w   2

Vol:.(1234567890)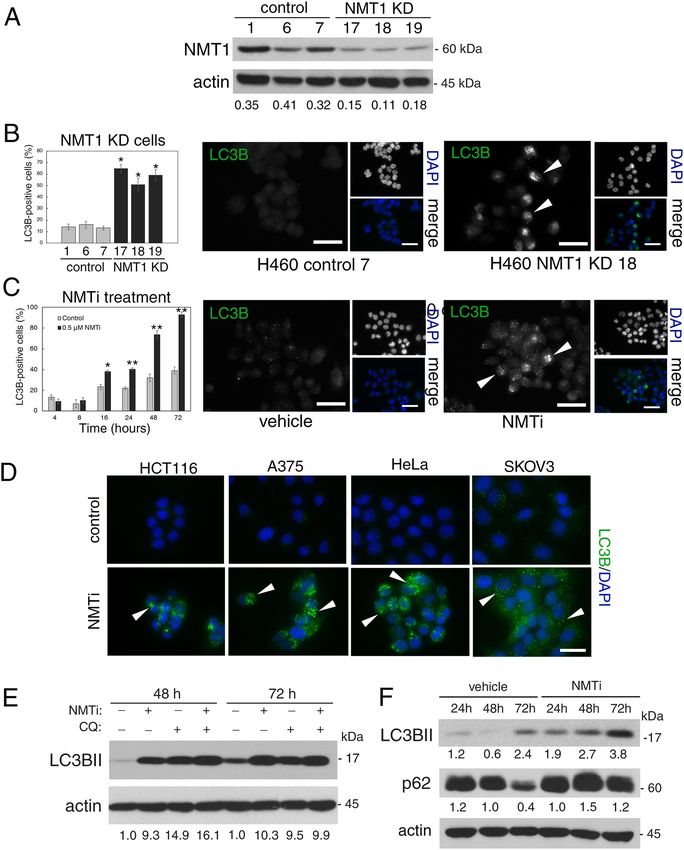
www.nature.com/scientificreports/
◂Figure 1. NMT1 activity is necessary to maintain the autophagic flux in cancer cells. (A) NMT1 expression in
control and NMT1 KD H460 clones. Numbers under each lane, densitometry values (arbitrary units) for NMT1
signal normalized to actin in one representative experiment from two independent experiments. (B) LC3B IF
in control and NMT1 KD H460 lines. DAPI, nuclei. Graph: average percent of LC3B-positive cells from two
independent experiments combined. At least 100 cells per condition and experiment were analyzed. Error bars,
SEM. *p < 0.005 (Student’s t test) with respect to controls. Right, representative LC3B staining in H460 control
and NMT1 KD lines. DAPI, nuclei. (C) LC3B IF in H460 cells treated with DMSO (vehicle) or 0.5 μM NMTi
for the indicated times. DAPI, nuclei. Graph: average percent of LC3B-positive cells from three independent
experiments combined. At least 80 cells per condition and experiment were analyzed. Error bars, SEM.
*p < 0.0005, **p < 0.0001 (Student’s t test). Right, representative pictures of LC3B and DAPI staining of H460
cells treated with DMSO or NMTi for 48 h. (D) LC3B IF in the indicated cancer cell lines treated with DMSO
(vehicle) or NMTi for 72 h. DAPI, nuclei. The experiment was repeated twice with similar results. (E) H460 cells
treated with 1 μM NMTi for the indicated times in culture and/or with 30 μM chloroquine (CQ) for 3 h prior
to processing for WB using an LC3B antibody. Actin was used as loading control. Numbers under each lane are
densitometry values (arbitrary units) for LC3BII signal normalized to actin and relative to the corresponding
24 h time point. One representative experiment from thee independent experiments is shown. (F) H460 cells
treated with 0.5 μM NMTi for the indicated times in culture. WB results for LC3BII, p 62SQSTM and actin (loading
control) are shown for one representative experiment from two independent experiments with similar results.
Numbers under each blot are densitometry values (arbitrary units) for LC3BII and p 62SQSTM signal normalized
to actin. Arrowheads, autophagic vesicles. Bar, 4 μm in (B), (C) and 3 μm in (D).
Lysosomes are complex multifunctional organelles with an essential role in cellular metabolism14. Lysosomal
hydrolases convert biological macromolecules into monomeric forms that can be catabolized to generate energy15.
Extracellular cargo is internalized through e ndocytosis16,17, whereas intracellular cargo derives from macroau-
tophagy (autophagy hereinafter), in which cellular macromolecules or organelles are routed to digestion18,19.
Lysosomes have also a central role in nutrient sensing and a nabolism14,15. Amino acid sensing and full activation
of mTORC1 by amino acids and growth factors occurs at the lysosomal surface, where mTORC1 is tethered by
a multiprotein complex named RAGULATOR20–25. The binding of RAGULATOR to the lysosome is mediated
by lipidation (myristoylation and palmitoylation) of its member LAMTOR1 (late endosomal/lysosomal adaptor,
MAPK and mTOR activator 1)21,26. mTORC1 facilitates protein, lipid, and nucleic acid synthesis, promoting cell
growth and supporting cell p roliferation27–32.
Because the coordination of catabolic and anabolic lysosomal functions is critical to maintain metabolic
homeostasis, a lysosomal autoregulatory mechanism is in place to increase lysosomal abundance in response to
starvation through the activity of transcription factors TFEB and TFE3. In the presence of nutrients, TFEB and
TFE3 are localized on the lysosomal surface through direct mTORC1 phosphorylation. Nutrient depletion and
mTORC1 inactivation leads to de-phosphorylation, nuclear translocation, and transcriptional activation of a
network of genes involved in lysosomal biogenesis and a utophagy33–36.
Oncogenic transformation is associated with elevated lysosomal abundance and activity, essential to maintain
the high metabolic demands and increased proliferation of cancer c ells37–39. Lysosomal-associated transcriptional
activity of TFEB and TFE3 is aberrantly activated in some cancers through constitutive nuclear localization,
which overrides the brake imposed by nutrient availability on lysosomal f unctions40,41. Due to their dependency
of lysosomal activity, cancer cells are particularly sensitive to perturbations in lysosomes. Because blocking a
single lysosomal metabolic function (for instance by treatment with chloroquine—which inhibits degradation—
or with mTOR inhibitors) often result in cellular adaptation, compounds that simultaneously block lysosomal
catabolic and anabolic functions are regarded as promising anti-cancer s trategies42.
Here, we report an unexpected essential role for NMT1 in the regulation of lysosomal degradation and
mTORC1 activation in cancer cells. Inhibition of NMT using a small compound decreased cancer cell viability
in vitro and in vivo through inhibition of mTORC1 and simultaneous blockade of lysosomal degradation, mostly
through inactivation of the lysosomal adaptor LAMTOR1. Our findings uncover an additional function for
NMT1 in cellular homeostasis, and a novel druggable lysosomal metabolic vulnerability of cancer cells.
Results
Targeting NMT1 slowed the autophagy flux in cancer cells. NMT1 facilitates mitophagy in cancer
c ells8, but its role in general autophagy is not known. We generated H460 (non-small cell lung carcinoma) cells
with reduced levels of NMT1 using lentiviral transduction of an NMT1-specific shRNA targeting sequence,
followed by clonal selection in the presence of puromycin. Control and knock-down (KD) clones generated in
parallel were selected for further analysis. Western blotting (WB) revealed that NMT1 protein expression was
reduced between 50 and 60% (Fig. 1A), and no compensatory induction of NMT2 expression was observed in
KD clones (Supplementary Fig. S1). Immunofluorescence (IF) for LC3B, a component of autophagosome mem-
branes, revealed a 2–3 fold increase in the percent of cells containing LC3B-positive puncta in all NMT1 KD
clones when compared with control clones (Fig. 1B). We verified these results using different targeting sequences
by transiently transfecting an NMT1 siRNA pool in H460 cells (Supplementary Fig. S1).
To achieve pharmacological inhibition of NMT1, we used the Trypanosoma brucei NMT inhibitor
DDD8564643, which also inhibits human NMT1 and 2 with high p otency44, and has been validated as a highly
specific NMT inhibitor45 . Previous studies in HeLa cells found decreased myristoylation after treatment with
0.5–1 μM DDD8564644 (referred to as NMTi hereinafter). We confirmed that 1 μM NMTi effectively decreased
Scientific Reports | (2020) 10:11952 | https://doi.org/10.1038/s41598-020-68615-w 3
Vol.:(0123456789)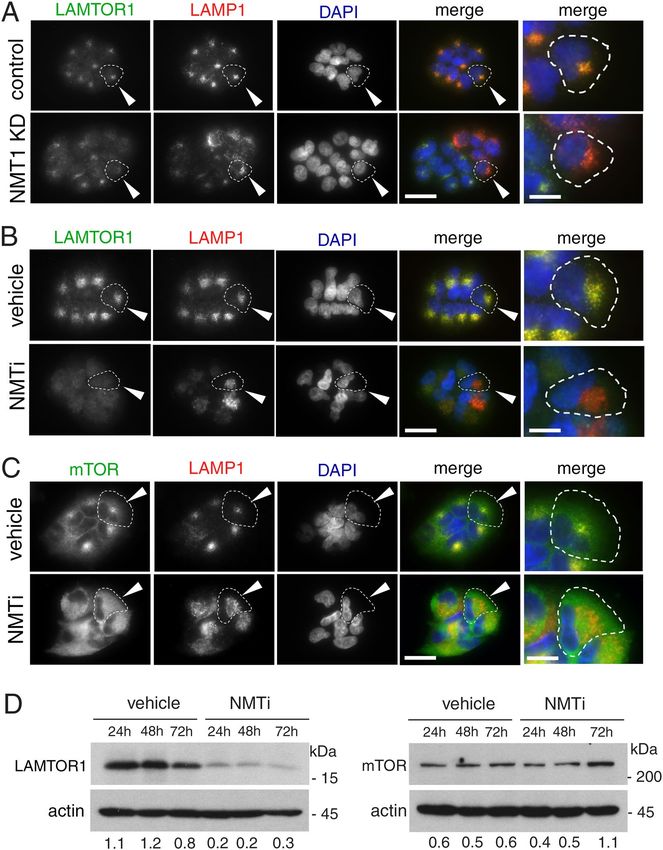
www.nature.com/scientificreports/
global myristoylation in H460 cells (Supplementary Fig. S1), and used NMTi at a concentration between 0.5 and
1 μM for subsequent experiments. Time-course experiments using NMTi treatment in H460 and H1792 cells
(lung adenocarcinoma) revealed a time-dependent increase in the fraction of cells containing LC3B-positive
puncta (Fig. 1C and Supplementary Fig. S1). Accumulation of LC3B-positive puncta was also observed in colon
(HCT116), melanoma (A375), cervical (HeLa) and ovarian (SKOV3) cancer cells treated with NMTi (Fig. 1D).
Elevated autophagosome content may be the result of increased autophagy or decreased autophagic flux. To
differentiate between the two, we combined NMTi treatment with chloroquine (CQ), an inhibitor of lysosomal
degradation that efficiently blocks the autophagic flux. Whereas treatment of H460 cells with CQ or NMTi alone
led to comparable levels of LC3BII accumulation, the combination treatment did not show an additive effect
(Fig. 1E). This indicated that the accumulation of LC3BII after NMT inhibition is mostly due to impairment of
the autophagy flux.
Consistent with nutrient depletion over time in culture, untreated cells had a time-dependent increase in
LC3BII-positive puncta by IF (Fig. 1C), and an increase in LC3BII abundance by WB (Fig. 1E). Accordingly,
total levels of the autophagosome adaptor p62SQSTM, which is degraded in the autolysosome during normal
autophagy46, decreased as LC3BII levels increased in H460 cells (Fig. 1F) and H1792 cells (Supplementary
Fig. S1). This was in contrast with cells treated with NMTi, in which the abundance of p62SQSTM remained elevated
despite increased accumulation of LC3BII (Fig. 1F and Supplementary Fig. S1), supporting the idea that NMTi
treatment impairs the autophagy flux in cancer cells. IF of H1792 cells with a p62SQSTM antibody confirmed these
results by revealing increased abundance of p62-positive puncta in cells treated with NMTi for 72 h (5.6 ± 1.3
per cell in control vs. 37.7 ± 4.1 in NMTi treated cells (Supplementary Fig. S1).
Inhibition of NMT1 decreased lysosomal degradation and caused accumulation of late endo‑
some/lysosomes. Lysosomes are the final destination of autophagosome cargo, where intracellular biologi-
cal macromolecules and organelles are enzymatically degraded. Because defective lysosomal degradation blocks
the autophagy flux, we evaluated the ability of cancer cells treated with NMTi to degrade internalized cargo in
lysosomes. We labeled cells with two bovine serum albumin (BSA) probes to monitor lysosomal degradation:
DQ-green BSA, which emits fluorescence only after proteolytic degradation at lysosomes, and AlexaFluor 549
BSA, which is constitutively fluorescent and served as a control for probe internalization. Incubation with both
BSA probes in the presence of NMTi treatment revealed decreased lysosomal degradation of DQ-green BSA
despite effective internalization of AlexaFluor 549 BSA (Fig. 2A). This indicated that NMT1 is necessary for
effective lysosomal degradation in cancer cells, in line with the observed delay in the autophagy flux, and the
accumulation of p62SQSTM in cells treated with NMTi.
We used IF with an antibody against the lysosome-associated membrane protein 1 (LAMP1), a marker of late
endosomes and lysosomes, to analyze the lysosomal compartment in cells with reduced NMT1. When compared
with control lines, NMT1 KD lines had a 40–50% increase in LAMP1-fluorescence intensity (Fig. 2B), which was
also detected in H1792 cells transfected with an NMT1 siRNA pool (Supplementary Fig. S2). Treatment with
NMTi also led to the accumulation of LAMP1-positive vesicles in H1792 (Fig. 2C), as well as in HCT116, A375,
HeLa and SKOV3 cancer cells (Supplementary Fig. S2). These results suggest increased lysosomal biogenesis in
cells lacking NMT1 activity.
Increased apoptosis and nuclear accumulation of TFE3 in cancer cells with decreased NMT1
activity. Treatment of H460 cells with NMTi for 48 h or longer induced apoptosis as detected by cleaved cas-
pase 3 staining (Fig. 3A), a finding in agreement with previous reports in other cancer lines12. The transcription
factor TFE3 responds to lysosomal dysfunction by nuclear translocation and transcriptional activation of genes
involved in lysosomal biogenesis as a pro-homeostatic and pro-survival mechanism34,40. To analyze whether
targeting NMT1 affects TFE3 subcellular distribution, we stained H460 NMT1 KD clones with a TFE3 specific
antibody. Consistent with previous reports in pancreatic c ancer41, we detected both cytoplasmic and nuclear
TFE3 localization in H460, H1792 and HeLa cells (Fig. 3B,C and Supplementary Fig. S3). Decreased NMT1
levels further increased the nuclear localization of endogenous TFE3 in all H460 KD clones (Fig. 3B). Similarly,
treatment with NMTi caused a time-dependent increase in the nuclear accumulation of endogenous TFE3 in
H1792 (Fig. 3C), and in HeLa cells (Supplementary Fig. S3). Next, we generated pools of H1792 and H460 stably
expressing TFE3-GFP, and subjected them to NMTi treatment. Using these overexpression assay, we confirmed
that TFE3-GFP was both cytoplasmic and nuclear in most cells, and that TFE3-GFP further accumulated in the
nucleus after 72 h of NMTi treatment (86.5 ± 4.3% treated vs. 15.4 ± 2.6% control for H1792 TFE3-GFP cells and
92.5 ± 4.4% treated vs. 14.7 ± 2.6% control for HeLa TFE3-GFP cells in one representative experiment, see Sup-
plementary Fig. S3).
To investigate whether TFE3 plays a functional role in the pro-apoptotic effects of NMTi treatment, we used
a TFE3 specific siRNA pool to decrease endogenous TFE3 expression, and treated cells 24 h after transfection
with NMTi for 48 h. Staining with cleaved caspase 3 revealed that H1792 cells with reduced levels of TFE3 were
about 2-fold more sensitive to NMTi-induced apoptosis than control cells, but did not show increased apoptosis
in vehicle-treated cells (Fig. 3D and Supplementary Fig. S3). This finding suggests that TFE3 nuclear accumula-
tion is part of a pro-survival response to lysosomal dysfunction in cancer cells treated with NMTi.
Inhibition of NMT1 decreased mTORC1 activation and proliferation of cancer cells. TFE3 is
retained on the lysosomal surface through direct phosphorylation by the mTORC1 complex, and translocates
to the nucleus upon mTORC1 inhibition. Accumulation of nuclear TFE3 after NMTi treatment suggests that
NMT1 inhibition causes mTORC1 inactivation. To test this hypothesis, we analyzed the phosphorylation status
of the mTORC1 targets P70S6K and 4EB-P1 using p(T389)P70S6K and p(T37/43)4EB-P1 specific antibodies.
Scientific Reports | (2020) 10:11952 | https://doi.org/10.1038/s41598-020-68615-w 4
Vol:.(1234567890)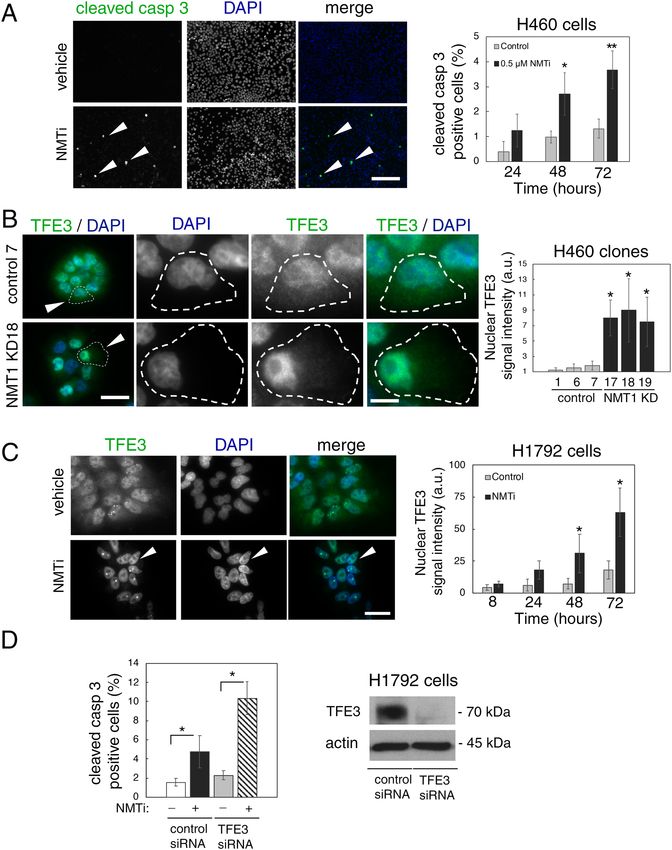
www.nature.com/scientificreports/

                            Figure 2.  NMT1 targeting decreased lysosomal degradation and increased lysosomal abundance in cancer
                            cells. (A) H460 cells were incubated with AlexaFluor594-BSA and DQ-Green-BSA for 18 h and then treated
                            with 1 μM NMTi or DMSO (vehicle) for 8 h. After fixation and mounting, cells were imaged to detect BSA
                            uptake (red fluorescence from Alexa 594-BSA) and BSA degradation (green fluorescence from cleaved
                            DQ-Green BSA). DAPI was used to label nuclei. Images show representative results of vehicle and NMTi treated
                            cells. Arrowheads (top), cell containing green fluorescence, indicative of intact lysosomal degradative activity.
                            Arrowheads (bottom), cell containing only red fluorescence, indicative of impaired lysosomal degradation
                            despite efficient uptake. Right, lysosomal degradation was quantified in three independent experiments (at
                            least 50 cells per condition and experiment), and represented as average and SEM of relative green vs. red
                            fluorescence. *p < 0.01 (Student’s t test). (B) Representative images of lysosome/late endosome detection by
                            LAMP1 IF in H460 control and NMT1 KD cell lines. DAPI was used to stain nuclei. Arrowheads, representative
                            cell outlined and magnified in the last column. Right, quantification of LAMP1-positive signal per cell from two
                            independent experiments combined. At least 25 cells were analyzed per condition and experiment. Graph shows
                            average ± SEM. *p < 0.01 (Student’s t test) for all KD clones with respect to each of the control clones. (C) H1792
                            cells were treated with 0.5 μM NMTi or DMSO control for 72 h and processed for LAMP1 IF. DAPI was used to
                            label nuclei. Images show representative results. Arrowheads, representative outlined cell magnified in the last
                            column. Right, quantification of LAMP1-positive signal per cell from two independent experiments combined.
                            At least 20 cells were analyzed per condition and experiment. Graph, average ± SEM. *p < 0.01 (Student’s t test).
                            Bar, 1 μm in (A); 4 μm and 1 μm in (B) and (C) (first 3 and last column respectively).

                            We treated H460 and H1792 cells with NMTi for 24–72 h and analyzed cell lysates using WB. Phosphorylation
                            of 4EB-P1 decreased after 48 h of treatment, and phosphorylation of P70S6K decreased after 72 h in both lines
                            when compared with control lysates (Fig. 4A and Supplementary Fig. S4). This indicated that NMT1 activity is
                            necessary to maintain basal levels of mTORC1 activation in cancer cells. Consistent with the role of mTORC1
                            at sustaining proliferation, NMTi treatment decreased H1792 and H460 cell proliferation in a dose and time-
                            dependent manner (Fig. 4B), and H460 NMT1KD clones (with about 50% reduction in NMT1 expression,
                            Fig. 1A), proliferated more slowly than their corresponding control lines (Supplementary Fig. S4). Furthermore,

Scientific Reports |   (2020) 10:11952 |               https://doi.org/10.1038/s41598-020-68615-w                                             5

                                                                                                                                        Vol.:(0123456789)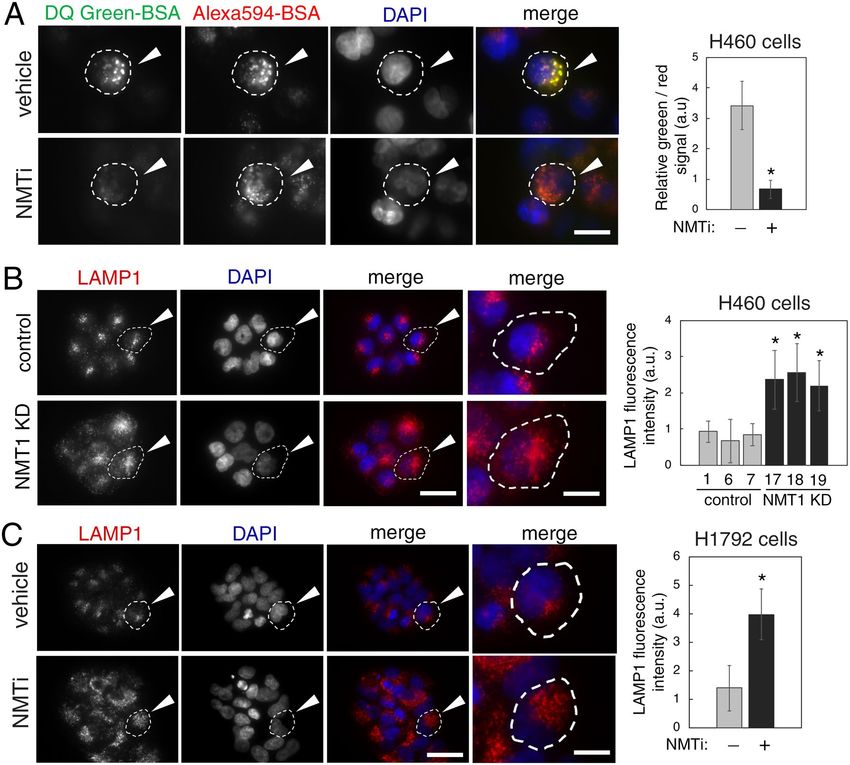
www.nature.com/scientificreports/

          Scientific Reports |   (2020) 10:11952 |   https://doi.org/10.1038/s41598-020-68615-w   6

Vol:.(1234567890)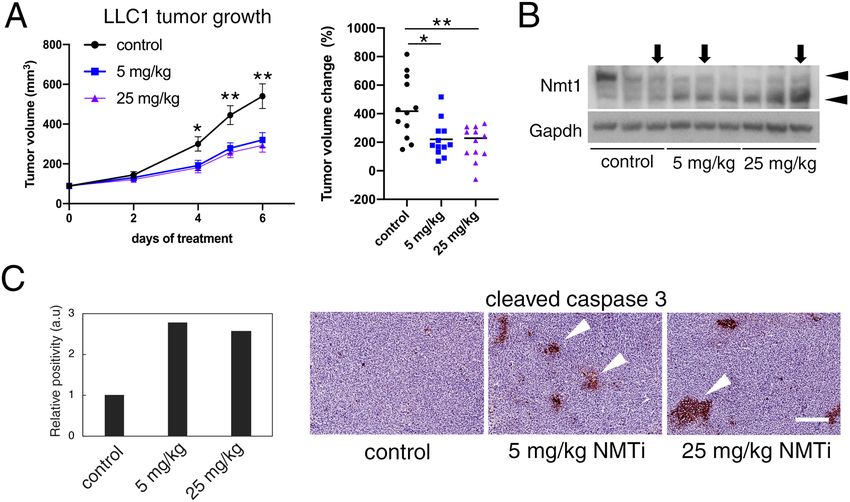
www.nature.com/scientificreports/
◂Figure 3. NMT1 targeting induced apoptosis and nuclear accumulation of TFE3 in cancer cells. (A) H460
cells treated with 0.5 μM NMTi or DMSO (vehicle) for the indicated periods of time stained with cleaved
caspase 3 antibody to detect apoptotic cells. DAPI was used to label nuclei. Left, representative images from
cells treated for 72 h. Arrowheads, cleaved caspase 3-positive cells. Percent of positive cells was quantified
from three independent experiments. At least 60 cells were analyzed per condition and experiment. Graph
shows results from combined experiments as average ± SEM. *p < 0.05, **p < 0.001 (Student’s t test). (B) H460
control and NMT1 KD lines stained with TFE3 antibody and DAPI to detect nuclei. Left, representative
images. Arrowheads in column 1 indicate cells magnified in pictures from column 2 to 4. Intensity of nuclear
TFE3 signal was quantified in two independent experiments, and at least 30 cells were analyzed per condition
and experiment. Graph shows data from combined experiments as average ± SEM. *p < 0.01 (Student’s t test).
(C) H1792 cells treated with 0.5 μM NMTi or DMSO (control) for the indicated times, stained with a TFE3
antibody and DAPI. Left, representative images from H1792 cells treated for 72 h. Arrowheads, cell with strong
nuclear TFE3 signal. Right, quantification of nuclear TFE3 signal intensity at each time point represented as
average ± SEM. *p < 0.001, **p < 0.0001 (Student’s t test) with respect to their relative DMSO control for one
representative experiment out of two independent experiments with similar results. (D) H1792 cells transfected
with non-targeting control or TFE3 siRNA for 72 h and treated with 0.5 μM NMTi or DMSO control for 48 h.
Cells were stained with cleaved caspase 3 antibody and DAPI. Quantification of apoptotic cells (at least 50 cells
per condition and experiment) from two independent experiments combined is represented as average ± SEM.
*p < 0.01 (Student’s t test). WB for with TFE3 in H1792 cell at 72 h after transfection is shown. Actin was used as
a loading control. Bar, 100 μm in (A), 5 μm in (B) and (C).
NMTi treatment decreased the colony-forming ability of H460 and H1792 cells in a dose-dependent manner
(Fig. 4C), and had a similar effect in HCT116, A375, HeLa and SKOV3 cells (Supplementary Fig. S4). The NMTi
IC50 values for these cells, analyzed using a viability test assay, were between 0.16 and 2.9 μM (Fig. 4D).
NMT1 targeting prevented lysosomal localization of LAMTOR1 and mTOR. Because myris-
toylation of the RAGULATOR complex member LAMTOR1 is necessary for lysosomal localization26 and
activation of mTORC121, we hypothesized that lack of LAMTOR1 myristoylation and lysosomal localization
would cause mTORC1 inhibition in cells with reduced NMT1 activity. First, we analyzed LAMTOR1 localiza-
tion in cells with reduced levels of NMT1. We co-stained H460 control and NMT1 KD clones with LAMP1 and
LAMTOR1 specific antibodies. Whereas LAMTOR1 co-localized with LAMP1 in 96.6 ± 3.1% of control cells,
as expected (Fig. 5A), it was largely absent from LAMP1-positive lysosomes, with only 5.8 ± 1.3% of NMT1 KD
H460 cells showing some co-localization. Transient transfection of NMT1 siRNA in H1792 cells also decreased
LAMTOR1 lysosomal localization in most cells (55.4 ± 5.3% cells, Supplementary Fig. S5). Then, we treated
cells with NMTi and analyzed LAMTOR1 and LAMP1 localization by IF. We observed that in control cells,
LAMTOR1 and LAMP1 signals co-localized in 92.5 ± 5.3%, whereas only 4.1 ± 1.3% of H1792 cells treated with
NMTi showed co-localization after 48 h of treatment (Fig. 5B), with LAMTOR1 being completely absent from
the LAMP1-positive compartment in the entire cell population at 72 h after treatment in H1792 and H460 cells
(Supplementary Fig. S5). LAMTOR1 was also absent from the LAMP1-positive compartment in HCT116, A375,
HeLa and SKOV3 cells treated with NMTi (Supplementary Fig. S5).
Next, we tested mTORC1 localization in the presence of NMTi. We treated H1792 cells with vehicle control
or NMTi (0.5 μM) for 72 h and stained them with LAMP1 and mTOR antibodies. Whereas mTOR preferentially
co-localized with LAMP1 in 86.4 ± 3.4% of control cells, it was widely cytoplasmic in 80 ± 5.5% of NMTi-treated
cells (Fig. 5C). These results confirmed that mTORC1 lysosomal localization in the presence of nutrients can be
prevented using an NMT inhibitor, and provide an explanation for mTORC1 inactivation after NMT inhibition.
We also noticed a general decrease in LAMTOR1 immunofluorescence signal in H460 and H1792 cells treated
with NMTi (Fig. 5B and Supplementary Fig. S5), which suggested decreased LAMTOR1 protein levels. To test
whether total LAMTOR1 protein expression was affected by NMTi treatment, we performed WB analysis of
NMTi-treated cells and observed a decrease (about 4-fold) in total LAMTOR1 protein levels as early as 24 h after
treatment and sustained for up to 72 h in H1792 and H460 cells (Fig. 5D and Supplementary Fig. S5). Immuno-
blotting for mTOR in H1792 and H460 cells treated with NMTi indicated a moderate increase in total mTOR
levels after 72 h of NMTi treatment (Fig. 5D and Supplementary Fig. S5), likely as a result of a compensatory
feed-back mechanism elicited by mTORC1 inactivation.
Collectively, these findings indicate that sustained NMT1 activity is necessary for LAMTOR1-dependent
lysosomal localization of mTORC1, and that lysosomal mTORC1 localization and activation can be effectively
disrupted with a small molecule inhibitor of NMT in cancer cells.
Silencing LAMTOR1 impaired lysosomal degradation and decreased colony formation in can‑
cer cells. Next, we silenced endogenous LAMTOR1 using two different siRNA oligo sequences, which effec-
tively decreased LAMTOR1 protein expression, and caused mTOR mis-localization in H1792 and HeLa cells, as
expected (Supplementary Fig. S6).
Similarly to NMT1 silencing, H1792 and HeLa cells depleted of LAMTOR1 showed accumulation of LC3B-
positive autophagosomes (Fig. 6A and Supplementary Fig. S6), increased abundance of LAMP1-positive lys-
osomes/late endosomes (Fig. 6B and Supplementary Fig. S6), and increased nuclear accumulation of TFE3
(Fig. 6C). The above effects of LAMTOR1 silencing might be due to mTORC1 inactivation, but are also compat-
ible with a defective autophagy flux. To investigate whether lysosomal degradation is affected by LAMTOR1
silencing, we incubated HeLa cells transfected with control or LAMTOR1 siRNA pool with DQ-Green BSA or
Scientific Reports | (2020) 10:11952 | https://doi.org/10.1038/s41598-020-68615-w 7
Vol.:(0123456789)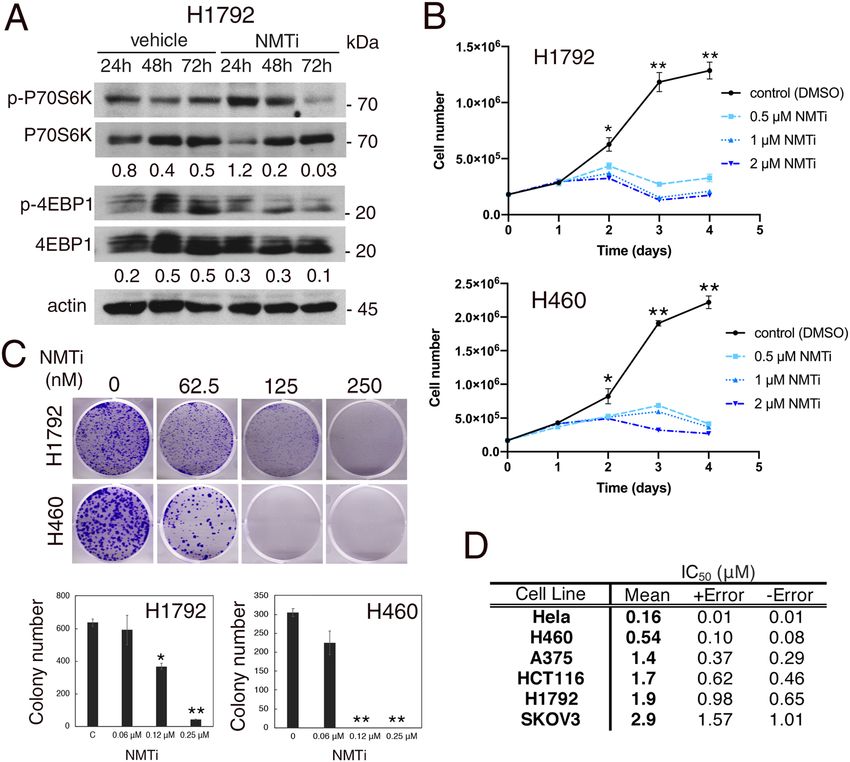
www.nature.com/scientificreports/
Figure 4. Inhibition of NMT decreased mTORC1 activation, proliferation and colony forming ability of
cancer cells. (A) WB analysis of H1792 cells treated with 0.5 μM NMTi for the indicated times using antibodies
against p(T389)p70S6K and p(T37/43)4E-BP1. Antibodies against total p70S6K and 4EB-P1 were used for
normalization, and actin was used as loading control. Numbers under each lane are densitometry values
(arbitrary units) for phospho- vs. total signal for each protein normalized to actin, in one representative
experiment (from two independent experiments with similar results). Uncropped membrane scans are shown
in Supplementary Figure S8. (B) Proliferation curves for H1792 and H460 cells treated with the indicated
concentrations of NMTi for the indicated periods of time (one representative experiment of three independent
experiments per cell line is shown). Total number of viable cells per plate for each time point and condition
are represented as average ± SEM. *p < 0.01 for 0.5 μM vs. control, and p < 0.005 for 1 and 2 μM vs. control.
**p < 0.000001 (Student’s t test) for treated (all dosages) vs. control. (C) H1792 and H460 cells were treated with
the indicated concentrations of NMTi for 7–10 days and colonies stained with crystal violet. Pictures, scans
of representative wells. Three wells per condition were quantified in three independent experiments per cell
line with similar results. Bottom, quantification of colony number per well in one representative experiment,
represented as average ± SEM. *p < 0.05, **p < 0.0001 (Student’s t test) for treated vs. control. (D) NMTi I C50
values were calculated at 72 h of treatment in the indicated cell lines using Cell Titer Glo assay.
AlexaFluor 549 BSA. Lysosomal degradation of DQ-Green BSA, but not global uptake of BSA, was impaired in
cells depleted of LAMTOR1 when compared with cells transfected with a non-targeting control siRNA (Fig. 6D
and Supplementary Fig. S6), suggesting that the inhibitory effects of NMT1 targeting on lysosomal degradation
are also largely mediated by inactivation of LAMTOR1. These findings also indicate that LAMTOR1 is neces-
sary to maintain lysosomal degradation and autophagy flux in cancer cells. Furthermore, LAMTOR1 silencing
reduced colony formation in H1792 cells (Fig. 6E), suggesting that this lysosomal adaptor is necessary for pro-
liferation and/or survival of H1792 cells.
Collectively, our results strongly suggest that NMT1 regulates lysosomal metabolic functions (mTORC1
activation and degradation) largely through modulation of the subcellular localization of the lysosomal adaptor
and NMT1 target LAMTOR1. Accordingly, targeting the NMT1–LAMTOR1 axis using NMTi simultaneously
inactivates mTORC1 and prevents lysosomal degradation, disrupting homeostasis and causing apoptosis in
cancer cells.
Pharmacological inhibition of NMT1 reduced tumor growth in a syngeneic mouse model of
cancer. The effects of NMTi treatment at decreasing lysosomal degradation and simultaneously inhibiting
mTORC1 suggest that this highly specific inhibitor of NMT could be efficacious against tumor growth in vivo.
Scientific Reports | (2020) 10:11952 | https://doi.org/10.1038/s41598-020-68615-w 8
Vol:.(1234567890)www.nature.com/scientificreports/
Figure 5. Targeting NMT1 impaired lysosomal localization of LAMTOR1 and mTOR and decreased
LAMTOR1 protein levels. (A) H460 control and NMT1 KD lines were stained with LAMTOR1 and LAMP1
antibodies along with DAPI to detect nuclei. Panel shows representative fluorescence microscopy images of the
indicated control and NMT1 KD clones. Three independent experiments were performed with similar results.
Arrowhead, outlined representative cell magnified in the last column. (B) H1792 cells were treated with 0.5 μM
NMTi or DMSO control (vehicle) for 48 h, and stained with LAMTOR1 and LAMP1 antibodies. DAPI was used
to stain nuclei. Panel shows representative fluorescence microscopy images from two independent experiments
with similar results. Arrowhead, outlined representative cell magnified in the last column. (C) H1792 cells
were treated with 0.5 μM NMTi or DMSO control (vehicle) for 48 h, and stained with mTOR and LAMP1
antibodies. DAPI was used to stain nuclei. Panel shows representative fluorescence microscopy images from
two independent experiments with similar results. Arrowhead, outlined representative cell magnified in the last
column. (D) Protein lysates from H1792 cells treated with 0.5 μM NMTi or DMSO (control) for the indicated
times were immunoblotted for LAMTOR1 and mTOR. Actin was used as loading control. Numbers under
each lane are densitometry values (arbitrary units) for LAMTOR1 or mTOR signal normalized to actin in one
representative experiment from two independent experiments with the same result. Uncropped scans are shown
in Supplementary Figure S8. Bars, 5 μm in (A)–(C) columns 1–4, and 1 μm in last column.
Scientific Reports | (2020) 10:11952 | https://doi.org/10.1038/s41598-020-68615-w 9
Vol.:(0123456789)www.nature.com/scientificreports/
Scientific Reports | (2020) 10:11952 | https://doi.org/10.1038/s41598-020-68615-w 10
Vol:.(1234567890)www.nature.com/scientificreports/
Figure 6. LAMTOR1 silencing decreased lysosomal degradation and impaired colony formation in cancer
▸
cells. (A) H1792 cells transfected with control or LAMTOR1 siRNAs for 72 h stained with an LC3B antibody
and DAPI. Arrowheads, autophagosomes. Graph: LC3B-positive cells (at least 80 cells per condition and
experiment) were quantified in two independent experiments. Results were combined and represented as
average ± SEM. *p < 0.01 (Student’s t test). (B) H1792 cells transfected with control or LAMTOR1 siRNAs
for 72 h stained with a LAMP1 antibody and DAPI. Arrowheads, outlined cell magnified in last column.
Graph: LAMP1-positive signal intensity was quantified in two independent experiments (at least 25 cells per
condition and experiment). Combined results are represented as average ± SEM. *p < 0.01 (Student’s t test). (C)
H1792 cells transfected with control or LAMTOR1 siRNAs for 72 h stained with a TFE3 antibody and DAPI.
Arrowhead, cell with strong nuclear TFE3 signal. Graph: Nuclear TFE3 signal intensity in two independent
experiments combined (at least 20 cells per condition on each experiment) represented as average ± SEM.
*p < 0.01 (Student’s t test). (D) HeLa cells transfected with control or LAMTOR1 siRNAs pool for 72 h incubated
with DQ-Green-BSA to detect lysosomal degradation. DAPI, nuclei. Images show representative results from
two independent experiments. Arrowheads, outlined cell magnified in last column. Graph: green fluorescent
intensity per cell (at least 15 cells per experiment and condition) quantified in two independent experiments
with similar results, shown as average ± SEM for one representative experiment *p < 0.01 (Student’s t test). Bar,
5 μm in (A) and (C); 5 μm in (B) (columns 1–3) and 1 μm in (B) (last column); 1 μm in (D) (columns 1–3) and
0.25 μm in (D) (last column). (E) Colony assay in H1792 cells transfected with control or LAMTOR1 siRNAs
for 6 days. Pictures, scans of representative wells. Three wells per condition were quantified in two independent
experiments with similar results. Graph: colony number per well in one representative experiment, represented
as average ± SEM. *p < 0.005 (Student’s t test) for each LAMTOR1 siRNA vs. control.
To test this hypothesis, we used a syngeneic model (Lewis lung carcinoma) in which subcutaneous tumors
were generated upon injection of LLC1 cells into the rear flanks of wild-type immunocompetent mice. Once
tumors were established, animals from both sexes were randomized into three experimental groups with an
average tumor volume of 90 mm3. Groups received daily intraperitoneal injections of NMTi (5 and 25 mg/kg)
or vehicle control (5% DMSO in saline) for the duration of the assay. Treatment with both NMTi dosages effec-
tively decreased tumor growth, with a 2-fold reduction in mean tumor volume change (Fig. 7A). WB analysis of
tumors protein extracts revealed cleavage of the Nmt1 protein in NMTi-treated animals (Fig. 7B), a known effect
of apoptosis and NMT inhibition12.
Next, we analyzed paraffin-embedded tumor sections by immunohistochemistry (IHC) using an antibody
against cleaved caspase 3 as a marker of apoptosis. The relative abundance of cleaved caspase 3-positive cells
increased 2-fold in tumors from treated animals (Fig. 7C).
To analyze whether NMTi treatment had systemic adverse effects, organs (liver, kidney and spleen) from
control and experimental animals were processed for H&E staining and histopathological examination. No
differences were found among groups (Supplementary Fig. S7), indicating that NMTi treatment did not induce
major toxicity to these organs under our experimental conditions. Furthermore, animal body weight followed a
similar trend in control and experimental animals throughout the course of the assay (Supplementary Fig. S7).
Taken together, our findings indicate that the NMT inhibitor DDD85646 is efficacious at decreasing tumor
growth in the presence of a functional immune system without inducing signs of systemic toxicity.
Tumors from animals treated with NMTi displayed markers of lysosomal dysfunction. To
investigate whether tumors from NMTi-treated animals show signs of impaired lysosomal function, we evalu-
ated the expression of autophagy-related proteins (LC3B and p62SQSTM), as well as markers of mTORC1 activation
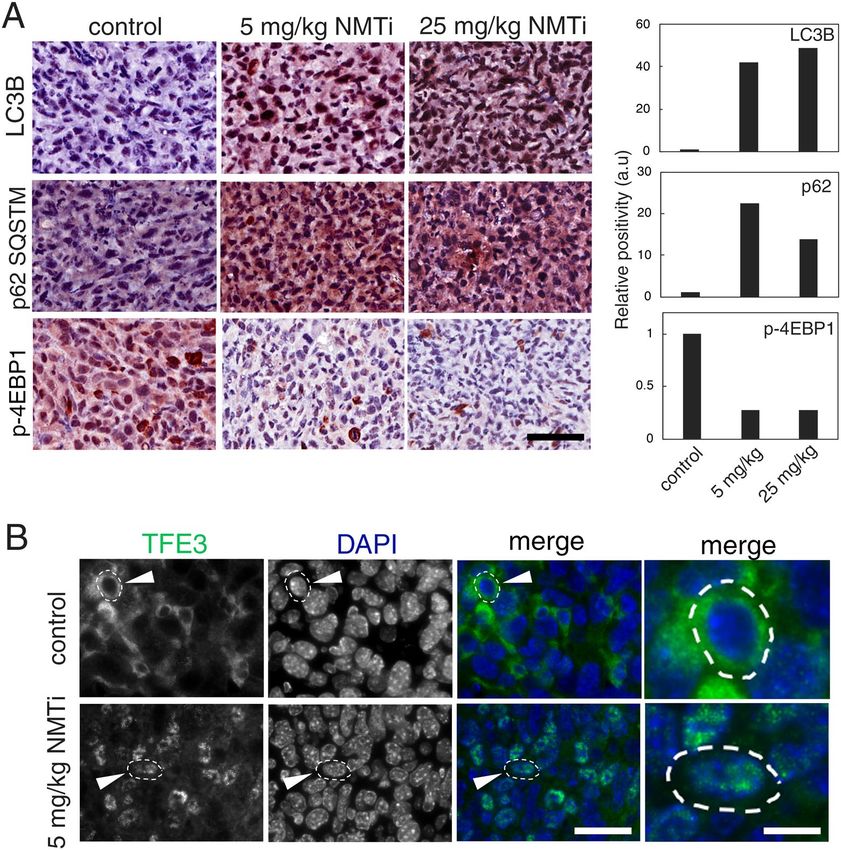
(phosphorylated 4E-BP1) in tumor sections using IHC. Tumors from treated animals had over 10-fold increase
in LC3B and p 62SQSTM staining intensity, suggesting that autophagic flux might be compromised (Fig. 8A). In
addition, phospho-4E-BP1 staining revealed a 5-fold decrease staining in tumors from NMTi-treated animals,
indicating diminished mTORC1 activation. Finally, staining with a TFE3 antibody revealed nuclear accumula-
tion of TFE3 in tumor cells (Fig. 8B). Our findings indicate the effectiveness of NMT1 inhibition at blocking
lysosomal metabolic functions in vivo, and suggest that the NMT inhibitor DDD85646 represents a novel class
of lysosomal targeting agent with promising therapeutic value in cancer.
Discussion
In this study we report that NMT1 is an essential regulator of lysosomal metabolic functions in cancer cells.
Inhibition of NMT1 impaired lysosomal degradation and inhibited mTORC1, leading to decreased cancer cell
proliferation, increased apoptosis and decreased tumor growth. Our findings are in agreement with previous
reports indicating that NMT1 is a cancer therapeutic t arget9–13, and support a general homeostatic function
of NMT1 in cancer that is beyond oncoprotein myristoylation, and which could be exploited for therapeutic
purposes in different cancer types.
Despite the number of target proteins susceptible of myristoylation by NMT144, we found that the deleterious
effects of targeting NMT1 on lysosomal function were largely attributed to the lysosomal adaptor LAMTOR1.
However, based on our experiments we cannot completely rule-out that additional NMT1 targets contribute to
lysosomal metabolic functions in cancer cells. Likewise, although NMT1 genetic targeting recapitulated most
of the effects of NMTi treatment in lysosomal function, and we did not observe increased NMT2 expression in
cells with reduced levels of NMT1, we cannot rule out that NMT2 plays a role in LAMTOR1 myristoylation, or
lysosomal functions in cancer cells. Overall, the effects of genetic targeting of NMT1 were not as efficient as NMTi
treatment in cancer cells, which might be explained by the fact that only a partial reduction of NMT1 expres-
sion was achieved by genetic targeting, likely due to the essential role of this gene in the cancer cells analyzed.
Scientific Reports | (2020) 10:11952 | https://doi.org/10.1038/s41598-020-68615-w 11
Vol.:(0123456789)www.nature.com/scientificreports/
Figure 7. Decreased tumor growth and increased tumor apoptosis in mice treated with NMTi. (A) LLC1
cells were subcutaneously implanted into the same number of male and female C57BL/6J mice. When tumors
reached an average size of ~ 90 mm3, animals were randomized into three groups (6 animals per group per
experiment in two independent experiments) to receive vehicle control (5% DMSO in saline) or two different
concentrations of NMTi (5 and 25 mg/kg) intraperitoneally daily. Data from both experiments were combined
(12 animals per group). Left: tumor volume represented as average ± SEM. *p = 0.003 for both NMTi dosages vs
control; **p = 0.002 for 5 mg/kg vs. control for days 5 and 6; and p = 0.001 for 25 mg/kg vs. control at days 5 and
6 (Student’s t test). Right, scatter dot plot representing percent tumor volume change for each individual animal
belonging to the indicated experimental groups. Line, mean. *p = 0.0065 for 5 mg/kg vs control; **p = 0.0023 for
25 mg/kg vs control (Mann–Whitney test). (B) Tumors from three different animals per experimental group
were analyzed by WB to detect Nmt1. Gapdh was used as a loading control. Arrowheads, full-length (upper)
and cleaved (lower) Nmt1. Tumors from animals used in (C) were marked with arrows. Uncropped membrane
scans are shown in Supplementary Figure S8. (C) Tumors corresponding to the indicated experimental groups
were stained for cleaved caspase 3. Percent positive cells was calculated for the entire tumor section using
Aperio software and represented normalized to control. Pictures correspond to representative regions of the
analyzed tumors. Arrowheads, cleaved caspase 3-positive cells. Bar, 100 μm.
Our finding that NMT1-mediated myristoylation of endogenous LAMTOR1 is necessary for mTORC1 locali-
zation and activation is in agreement with previous studies21, and confirms that active myristoylation is necessary
for the localization of endogenous LAMTOR1 to the endosome/lysosome compartment in cancer cells. It also
indicates that mTORC1 is a novel effector of NMT1 in cancer cells. This is in agreement with the finding that
mTOR inhibition increases NMT1 expression in breast cancer c ells47, possibly due to a compensatory mechanism
to increase LAMTOR1 myristoylation and restore mTORC1 activity in cells treated with mTOR inhibitors. We
observed that NMTi treatment not only prevented LAMTOR1 localization, but also decreased total LAMTOR1
protein levels. Further investigation is needed to elucidate the specific mechanisms leading to decreased abun-
dance of LAMTOR1 in the absence of NMT1 activity, but is is reasonable to speculate that it is due to protein
degradation based on the presence of an N-degron in non-myristoylated L AMTOR148.
We observed reduced LAMTOR1 lysosomal localization at 24 h after treatment with NMTi. However, phos-
phorylation of the mTORC1 substrates p70S6K and 4E-BP1 was not decreased until 48 h of treatment, suggesting
that functional mTORC1 can be temporarily maintained at lysosomes in a LAMTOR1-independent manner,
possibly through p 62SQSTM binding49.
mTORC1 inhibition is a well-known trigger of autophagy. However, mTORC1 inhibition after NMTi treat-
ment caused a blockade of the autophagy flux due to impaired lysosomal degradation. Whereas we cannot rule
out that mTORC1 inhibition by NMTi initially increases autophagy, the concomitant inhibition of lysosomal
degradation ultimately blocked the autophagy flux causing aberrant accumulation of autophagosomes and defec-
tive lysosomes.
Interestingly, LAMTOR1 depletion was sufficient to inhibit lysosomal degradation in cancer cells, a result
in agreement with a study in Lamtor1 null ( p18−/−) mouse embryo fi broblasts50. These findings underscore the
fact that LAMTOR1 has additional lysosomal metabolic functions beyond its role at tethering mTORC1 to the
lysosomal surface and facilitating its activation by amino acids. The specific mechanism by which NMT1 and
LAMTOR1 promote lysosomal degradation in cancer cells remains to be determined. In fibroblasts derived from
lamtor1-null embryos, lysosomal degradation is impaired due to defective lysosomal-late endosome f usion50.
Whether this or additional mechanisms are involved in cancer cells treated with NMTi remains to be investigated.
Scientific Reports | (2020) 10:11952 | https://doi.org/10.1038/s41598-020-68615-w 12
Vol:.(1234567890)www.nature.com/scientificreports/
Figure 8. Markers of lysosomal dysfunction in tumors from mice treated with NMTi. (A) Tumors
corresponding to the indicated experimental groups were stained for LC3B, p62, and p(T37/43) 4E-BP1.
The percent positive cells was calculated for the whole tumor section using Aperio software, and represented
as values normalized to control. Pictures correspond to representative regions of each tumor. Bar, 50 μm. (B)
Tumors from control and 5 mg/kg NMTi-treated mice were stained with a TFE3 antibody and imaged using a
fluorescent scope. Images are representative of the tumor sections (N = 2). Arrowhead, outlined cell magnified in
the last column. Bar, 28 μm in columns 1–3 and 0.3 μm in last column.
Depletion of LAMTOR1 was reported to increase lysosomal abundance without decreasing lysosomal degrada-
tion in cancer c ells51. This discrepancy might be due to differences in the models or the methodology employed.
We observed that LAMP1-positive vesicles appear more peripherally distributed in cells lacking NMT1 or
LAMTOR1 that in control cells. Whether this is a passive effect due to increased lysosomal abundance, or is
due to a more specific mechanism is currently unkown. The fact that Lamtor1-null mouse embryo fibroblasts
and wild-type mouse embryo fibroblasts treated with mTORC1 inhibitors have similar lysosomal aberrant dis-
tribution without lysosomal accumulation50 indicates that the changes in lysosomal localization that we observe
may be linked to NMT1-dependent regulation of mTORC1 activation.
Under conditions of nutrient availability, mTORC1 phosphorylation facilitates lysosomal localization of the
transcription factor TFE336. Under starvation or lysosomal dysfunction, TFE3 is dephosphorylated, translocates
to the nucleus, and activates a lysosomal-initiated transcriptional program that includes expression of genes
necessary for lysosomal b iogenesis34. This regulatory mechanism is altered in some cancers, where TFE3 is
41
constitutively nuclear . Accordingly, we detect partial constitutive localization of TFE3 in the nucleus of HeLa
and lung adenocarcinoma cells. Our finding that TFE3 further accumulates in the nucleus of cancer cells lack-
ing NMT1, LAMTOR1, or in cells treated with NMTi is consistent with both the inhibition of mTORC1 activity
by NMTi, and the autophagy blockade provoked by the lack of degradative lysosomal activity. It is possible that
the increased lysosome abundance observed in cells lacking NMT1 or LAMTOR1, is the result of an attempt
to restore lysosomal function through TFE3-induced lysosomal biogenesis. Consistent with this hypothesis,
we observed that cells lacking TFE3 were more sensitive to die in the presence of NMTi treatment than those
expressing TFE3. This is consistent with a role for TFE3 in tumor p rogression52, further indicating that TFE3 has
Scientific Reports | (2020) 10:11952 | https://doi.org/10.1038/s41598-020-68615-w 13
Vol.:(0123456789)www.nature.com/scientificreports/
unique functions in lysosomal homeostasis not fulfilled by TFEB. Despite the increased abundance in lysosomes
in the absence of NMT1 or LAMTOR1, we found that these are largely non-functional.
Our experiments silencing LAMTOR1 indicate that most of the effects of NMT1 inhibition on lysosomal
function are mediated through inhibition of LAMTOR1. We observed that LAMTOR1 silencing reduced colony
formation, suggesting that LAMTOR1 is necessary for proliferation and/or survival of these cells. This is in agree-
ment with previous findings showing p53-dependent apoptosis after LAMTOR1 depletion in cancer c ells51. Most
of the cells we used in this study are p53-deficient, suggesting additional pro-apoptotic mechanisms. Likewise,
we cannot rule-out that additional NMT targets besides LAMTOR1, and additional mechanisms (such as ER
stress12) are implicated in the pro-apoptotic effects of NMTi treatment.
The NMT inhibitor used in our study was originally discovered in a screen for trypanosomal NMT
inhibitors43, and subsequently confirmed as a potent and specific human NMT inhibitor in studies mapping the
human myristoylome44, comparing available NMT i nhibitors45, and evaluating the compound’s effect in cancer
cell proliferation, apoptosis and induction of ER stress12. While a single form of NMT exist in trypanosomes,
mammalian cells have two isoforms (NMT1 and NMT2), which are similarly inhibited by this compound44.
Whereas we cannot completely rule out a role for NMT2 in lysosomal metabolism, we observed that silencing
of NMT1 was sufficient to recapitulate the effects of NMTi treatment, indicating that NMT1 is likely the main
enzyme involved in regulating lysosomal functions in cancer cells.
Collectively, our results indicate that DDD85646 represents a novel class of lysosomal-targeting agent, which
causes simultaneous inactivation of mTORC1 and blockade of lysosomal degradation, leading to cancer cell
apoptosis. These therapeutically advantageous anti-cancer properties are shared with the quinacrine derivative
compound DQ661, which targets lysosomal Palmitoyl-protein thioesterase 1 (PPT1)42.
Pharmacological inhibition of NMT1 using DDD85646 reduced tumor growth in vivo, and tumors from
treated animals had increased apoptosis and expressed markers of lysosomal disfunction. Despite the roles of
NMT1 and NMT2 in immune cell a ctivation6, NMTi was effective at decreasing tumor growth in immunocom-
petent mice. Furthermore, NMTi treatment did not cause adverse systemic effects under the conditions tested,
indicating a window of therapeutic opportunity.
In summary, we show that NMT1 is a novel regulator of lysosomal function in cancer cells, and that lysosomal
degradation and mTORC1 activation can be simultaneously blocked by NMT inhibitors to limit tumor growth.
Material and methods
Cells. H460, H1792, HCT116, A375, HeLa, SKOV3, and LLC1 cells were obtained from ATCC and main-
tained at 37 °C and 5% or 10% CO2 in a humidified tissue culture incubator. Cells were grown in RPMI-1640
(H460, H1792, HCT116 and SKOV3) or DMEM (A375, HeLa and LLC1) obtained from Mediatech and sup-
plemented with 10% Fetal Bovine Serum (Fisher). Cells were regularly tested for mycoplasm infection using
MycoAlert mycoplasm detection kit (Lonza).
General reagents and inhibitors. DDD85646 (NMT inhibitor) was purchased from Aeobius (AOB 6657)
and used between 0.5 and 1 μM final concentration for most experiments. We verified batch purity by HPLC.
Chloroquine was from MP biochemicals, DMSO was from Sigma-Aldrich, Crystal Violet was from Fisher. Puro-
mycin and G418 were from Invivogen.
Primary antibodies. NMT1 antibody was from Novus Biologicals (NBP2-32168) and NMT2 antibody
from BD Transduction (611310). Antibodies against LC3B (clone D11), cleaved caspase-3 (9661), mTOR (clone
7C10), LAMTOR1 (clone D11H6), phospho-p70 S6 Kinase (Thr389) (9205), p70 S6 kinase (clone 49D7), phos-
pho-4E-BP1 (Thr37/46), 4E-BP1 (clone 53H11), and β-Actin (clone D6A8) were from Cell Signaling Technol-
ogy. p62SQSTM antibody (18420-1-AP) was from ProteinTech. Antibody against TFE3 (HPA023881) was from
Sigma Life Science. Antibody against LAMP1 (clone H4A3) to was from SouthernBiotech, and the antibody
against GAPDH (clone 6C5) was from Millipore Sigma.
RNAi. siRNA SMARTpools against human NMT1, LAMTOR1 and TFE3 were from Dharmacon, siRNA
oligos #1 and #2 targeting human LAMTOR1 correspond to Dharmacon ON-TARGET plus individual oligos
J-020916-17 and J-020916-19 respectively. Control non-targeting oligos were from Dharmacon. siRNA oligos
were transfected in Opti-MEM using Lipofectamine RNAimax (Thermo Fisher Scientific), and experiments
performed between 48 and 96 h after transfection. Effectiveness of KD was verified by WB on each experiment.
Human NMT1 targeting shRNA (TRCN0000035710) and non-targeting shRNA control were purchased from
Sigma-Aldrich as lentiviral transduction particles. Clonal selection by limited dilution was initiated 48 h after
infection in the presence of 2.5 μg/ml puromycin.
Immunofluorescence. Cells were grown on glass coverslips and fixed in 4% paraformaldehyde (Electron
Microscopy Sciences) for 15 min. For LC3B and LAMP1 staining, cells were subsequently fixed for 5 min in ice-
cold methanol. Cells were blocked and permeabilized using PBS containing 0.1% Triton X100 and 3% BSA for
1 h. Primary antibody was diluted in PBS containing 0.1% Triton X100 and 0.3% BSA and incubated overnight
at 4 °C. After washing in PBS containing 0.1% Triton X100, cells were incubated with anti-rabbit or anti-mouse
IgG conjugated with AlexaFluor 488 or AlexaFluor 594 (Thermo Fisher Scientific) (1:500) for 1 h. Coverslips
were mounted in Vectashield containing DAPI (Vector Labs). Immunofluorescence images were acquired using
a fluorescence AxioImager Zeiss microscope provided with a Zeiss AxioCam 503 camera and Zen Lite Software
(Zeiss). For quantification experiments, between 5 and 15 images per coverslip were obtained randomly. Images
Scientific Reports | (2020) 10:11952 | https://doi.org/10.1038/s41598-020-68615-w 14
Vol:.(1234567890)www.nature.com/scientificreports/
were exported as “TIF” and quantified using ImageJ 1.52p (NIH) or Zen Software (Zeiss). Adobe Photoshop was
used to assemble individual pictures into figure panels.
Lysosomal degradation assay. H460 cells were incubated in RPMI containing 1% FBS in the presence
of 0.5 μM NMT inhibitor or DMSO for 18 h and then labeled with AlexaFluor 594-BSA and DQ-green BSA
(10 μg/ml each, Thermo Fisher Scientific) in RPMI containing 1% FBS in the presence of 0.5 μM NMT inhibitor
or DMSO for 8 h. HeLa cells transfected with control non-targeting or LAMTOR1 siRNA pool were incubated
in DMEM containing 1% FBS for 18 h and labeled with 10 μg/ml AlexaFluor 594-BSA for 1 h, or incubated in
DMEM containing 1% FBS for 4 h and labeled with 10 μg/ml DQ-Green BSA for 18 h. After washing in PBS,
cells were incubated in RPMI containing 1% FBS for 30 min, fixed in 4% PFA (Electron Microscopy Sciences),
and mounted with Vectashield containing DAPI (Vector Labs). For quantification, images were randomly taken
at 40 × magnification.
Generation of TFE3‑GFP cell lines. pEGFP-N1-TFE3 was a gift from Shawn Ferguson (Addgene plas-
mid # 38120)33. H460 and H1792 cells were transfected with 8 μg of purified DNA using Lipofectamine 2000
(Thermo Fisher Scientific). 48 h after transfection cells were selected in 1 mg/ml G418 and surviving pools
expanded in culture in the presence of G418.
Western blotting. Proteins were extracted using standard RIPA lysis buffer containing freshly added pro-
tease and phosphatase inhibitors. Frozen tumors were grinded and homogenized prior to lysis. Western blotting
was performed using standard protocols. Briefly, membranes were blocked for 1 h at RT in 5% milk (BioRad)
and incubated overnight at 4 °C with the indicated antibody dilutions prepared as recommended by manufac-
turer. After washing in PBS containing 0.1% Tween 20, membranes were incubated with horseradish peroxidase-
conjugated anti-mouse or anti-rabbit IgG (GE Healthcare). Signal was developed using Supersignal WestPico
PLUS (Pierce) and films scanned as digital images. Adobe Photoshop software was used for quantification of
digital images.
Myristoylation assay. Global myristoylation was measured following a established method53. Briefly,
H460 cells grown overnight were washed with PBS to remove serum and pre-incubated for 1hour with Opti-
mem (Thermo Fisher Scientific) containing 1 μM NMT inhibitor or DMSO control. This was then replaced by
medium containing 1 μM NMT inhibitor or DMSO control and 25 μM of Alkynyl Myristic Acid (Click Chemis-
try tools) for 6 h in culture. Protein extracts were prepared using NP40-based lysis buffer and a total of 200 μg of
protein per experimental condition assayed in the presence of biotin-PEG3-azide using a Click Chemistry Pro-
tein Reaction Kit as indicated by the manufacturer (Click Chemistry Tools). Pellet resulting from the reaction
was resuspended in electrophoresis loading buffer, boiled and subjected to electrophoresis. Signal was detected
with streptavidin-HRP staining (Cell Signaling Technologies) and developed with Supersignal WestPico PLUS
(Pierce).
Cell proliferation and colony forming assay. For proliferation curves, the same number of cells were
plated in multiple plates, and treated 24 h after plating with the indicated amount of NMTi or DMSO control. At
each time point, cells were collected by trypsinization and stained with Trypan Blue (Fisher). Viable cells were
counted using a hemocytometer and mean values represented as a function of time. For colony forming assays,
between 500–1,000 cells per well were plated in 6-well plates. Cells were treated with the indicated amount of
NMTi or DMSO control 24 h after plating. After 6–10 days in culture, cells were stained with 0.1% crystal vio-
let in 30% MeOH for 30 min at RT. Plates were scanned to digital images, and ImageJ used to quantify colony
number.
IC50 calculation. Cells were seeded in 384-well white plates (Greiner) at 375 to 1,500 cells per well according
to the linear relationship measured from a standard curve of each cell line. 24 h after seeding, cells were treated
with NMT inhibitor (three fold dilution, eight dilution points, in duplicate). After 72 h of treatment, cell viability
was measured using CellTiter Glo Luminescent Cell Viability Assay (Promega), according to the manufacturer’s
description, and IC50 values were calculated using the percentage of growth of treated cells versus the DMSO
control with GraphPad Prism 7.0 software.
Tumor generation and NMTi treatment in a syngeneic mouse model of cancer. All animal work
was performed in strict accordance with an animal usage protocol approved by the Institutional Animal Care
and Use Committee (IACUC) of The Lundquist Institute at Harbor-UCLA Medical Center (Institutional IACUC
# 31364). C57BL/6J mice from both sexes (The Jackson Laboratory) were injected subcutaneously into the rear
right flank with 2 × 10⁶ LLC1 cells resuspended in sterile PBS. When tumors were palpable, electronic calipers
were used to measure tumor length (L), width (W) and height (H). Tumor volume was calculated using the
formula (L × W × H)/2. Animals were randomized into 3 groups with a mean tumor volume of ~ 90 mm3, which
received daily intraperitoneal injections of vehicle (5% DMSO in saline) or NMT inhibitor (5 and 25 mg/ml) for
the duration of the experiment. Animal body weight was monitored daily. Animals were euthanized, and tissues
harvested and immediately frozen in liquid nitrogen or fixed in 4% PFA. Tumor volume measurements from 2
independent experiments on a total of 12 animals (6 male and 6 female) per experimental group was analyzed
according to sex and no differences were found between sexes. Data from both experiments were pooled to cal-
culate mean tumor volume and percent volume change.
Scientific Reports | (2020) 10:11952 | https://doi.org/10.1038/s41598-020-68615-w 15
Vol.:(0123456789)You can also read


