Are There Thresholds in Glioblastoma Cell Death Responses Triggered by Temozolomide? - MDPI
←
→
Page content transcription
If your browser does not render page correctly, please read the page content below
International Journal of
           Molecular Sciences

Article
Are There Thresholds in Glioblastoma Cell Death
Responses Triggered by Temozolomide?
Yang He       and Bernd Kaina *
 Institute of Toxicology, University Medical Center, Obere Zahlbacher Str. 67, D-55131 Mainz, Germany;
 yanghe01@uni-mainz.de
 * Correspondence: kaina@uni-mainz.de; Tel.: +49-6131-17-9217; Fax: +49-6131-17-8499

 Received: 15 February 2019; Accepted: 22 March 2019; Published: 28 March 2019

 Abstract: Temozolomide (TMZ) is an alkylating agent used in the treatment of high-grade malignant
 glioma, notably glioblastoma multiforme, the most aggressive form of brain cancer. The drug induces
 a dozen DNA methylation adducts, including O6 -methylguanine (O6 MeG), which is the most toxic
 primary DNA lesion as it causes the formation of DNA double-strand breaks (DSBs) that trigger
 apoptosis. In p53 wild-type cells, TMZ activates p-p53ser15 and p-p53ser46, which have opposing
 dual functions regulating survival and death, respectively. Since the use of TMZ in a therapeutic
 setting is limited because of its side effects, the question arises as to the existence of threshold doses
 that activate the death pathway and start apoptosis. To determine whether there is a threshold for the
 TMZ-induced DNA damage response and exploring the factors regulating the switch between p53
 dependent survival and death, the glioblastoma lines LN-229 (deficient in MGMT) and LN-229MGMT
 (stably transfected with MGMT) were exposed to different doses of TMZ. p53 protein expression
 and phosphorylation levels of p-p53ser15 and p-p53ser46 were determined by Western blotting.
 Also, apoptosis, senescence and autophagy levels were checked after different doses of TMZ. The
 results show that pro-survival p-p53ser15 and pro-death p-p53ser46 were induced by O6 MeG in a
 specific dose- and time-dependent manner. p-p53ser15 was an early response while p-p53ser46 was
 activated at later times following treatment. Unexpectedly, the dose-response curves for total p53,
 p-p53ser15 and p-p53ser46 were linear, without an obvious threshold. O6 MeG induces apoptosis late
 after treatment as a linear function of TMZ dose. This was observed for both p53 proficient LN-229
 and p53 lacking LN-308 cells. A linear dose-response after TMZ was also observed for senescence
 and autophagy as well as γH2AX, an indicator of DSBs that are considered to be the downstream
 trigger of apoptosis, senescence and autophagy. LN-229MGMT cells were highly resistant to all
 measured endpoints because of repair of the critical primary lesion. Although LN-308 were less
 responsive than LN-229 to TMZ, they displayed the same TMZ-induced DSB level. The observed
 linear dose-responses are not compatible with the view that low DNA damage level evokes survival
 while high damage level activates death functions. The data bear important therapeutic implications
 as they indicate that even low doses of TMZ may elicit a cytotoxic response. However, since O6 MeG
 triggers apoptosis, senescence and autophagy in the same dose range, it is likely that the accumulation
 of senescent cells in the population counteracts the killing effect of the anticancer drug.

 Keywords: DNA damage; O6-alkylguanine; temozolomide; dose-response curves; time-response;
 glioblastoma; glioma; apoptosis; autophagy; senescence; p53

1. Introduction
     In cancer therapy, chemotherapeutics with genotoxic activity are being used routinely. It is
well known that these anticancer drugs induce DNA damage that triggers complex cellular DNA
damage responses (DDR), which determine the fate of the cell, making the decision between

Int. J. Mol. Sci. 2019, 20, 1562; doi:10.3390/ijms20071562                        www.mdpi.com/journal/ijms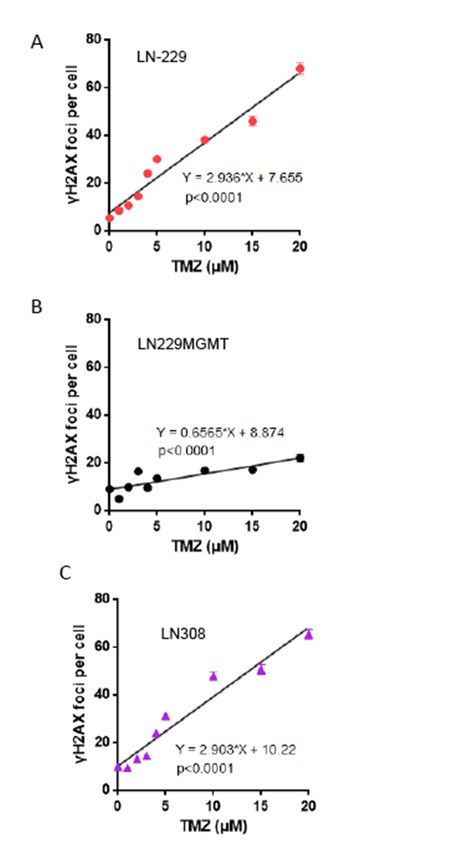
Int. J. Mol. Sci. 2019, 20, 1562                                                                    2 of 20

survival and death [1]. Key players involved in this scenario are the DDR kinases ATM, ATR and
DNA-PK, the checkpoint kinases CHK1, CHK2, the stress kinase HIPK2, and further downstream,
the transcription factor and tumor suppressor protein p53. During activation, p53 becomes
phosphorylated, liberates from its inhibitor MDM1, becomes stabilized and binds as a transcription
factor in a dimeric form to a p53 consensus sequence in the promoter of pro- and anti-apoptotic
genes [2]. In addition, p53 has other functions that are independent of transcriptional activation
of genes [3]. It is generally believed that low DNA damage levels activate pro-survival and high
damage levels activate pro-death genes and cellular functions [4–6]. For example, p53 stimulates the
transcription of p21, which results in cell cycle arrest, and DNA repair genes such as DDB2, which
enhances the repair capacity, leading to removal of toxic DNA lesions from DNA [7]. At high dose
levels p53 turns into a “killer” through activation of pro-death functions such as the proapoptotic
genes Bax, Bak and Fas [2]. Although this concept derived mostly from work with ionizing radiation
is reasonable, there is not much experimental proof of it for chemical genotoxins, notably anticancer
drugs. The concept implicates that there are threshold doses for cell death, i.e., low doses do not elicit
activation of apoptosis pathways while high doses do.
      A proof of this concept requires maximum understanding of the cell death pathways activated
by a given genotoxicant. A well-studied drug in this respect is temozolomide (TMZ), which is
used in first-line therapy for high-grade gliomas, including astrocytoma (WHO 0 3) and glioblastoma
multiforme (glioma WHO 0 4) [8]. The main target of TMZ is the nuclear DNA in which, similar to other
SN 1 alkylating agents, at least 12 nucleophilic sites can become methylated [9]. The major methylation
products are N-methylpurines such as N7-methylguanine, N3-methylguanine and N3-methyladenine,
while O-methylpurines are less frequent. Thus, O6 -methylguanine (O6 MeG) accounts for maximally
7% of the total methylations [9]. Although produced in minor amounts, the damage is highly genotoxic
and cytotoxic if not repaired by the suicide enzyme O6 -methylguanine-DNA methyltransferase
(MGMT) [10]. If cells are repair competent, O6 MeG is quickly removed from DNA. Under this
condition, cells become highly resistant to O6 -alkylating agents and higher doses of a methylating
agent are required to achieve a killing effect, which results from saturation of base excision repair and
repair by ALKB homologous proteins (ALKBH) [11]. Therefore, in the high dose setting, other lesions
than O6 MeG, which are less toxic, give rise to cell death. The doses of TMZ in a therapeutic setting
are very likely too low to achieve cell death resulting from non-repaired N-alkylations. Therefore,
with an achievable serum concentration of up to 50 µM TMZ, the O6 MeG response plays a key role in
determining tumor cell death.
      The mechanisms of O6 MeG triggered genotoxic responses have been described previously [11].
In brief, O6 MeG is a mutagenic mispairing lesion that results in mismatches with thymine that
are subject to mismatch repair (MMR). Reinsertion of thymine during MMR causes a futile MMR
cycle with gapped DNA that finally gives rise to DNA replication blockage and the formation of
replication-mediated DNA double-strand breaks (DSBs), which occurs in the post-treatment cell
cycle [12]. These events provoke the activation of ATR und ATM, and downstream CHK1 and CHK2,
respectively, as well as p53 phosphorylation [13].
      Upon genotoxic stress, p53 can be phosphorylated at different sites. p53 phosphorylated
at serine 15 (p53ser15) and serine 20 (p53ser20) results from ATM/ATR-CHK2/CHK1 activation,
while phosphorylation at serine 46 (p53ser46) results from activation of the kinase HIPK2 (for review,
see [14]). We have recently shown that this also occurs in glioblastoma cells upon treatment with TMZ.
We also showed that p53ser46 exerts a pro-apoptotic function as downregulation of HIPK2, the kinase
responsible for this phosphorylation, attenuated significantly the level of apoptosis in TMZ-treated
LN-229 glioblastoma cells [15].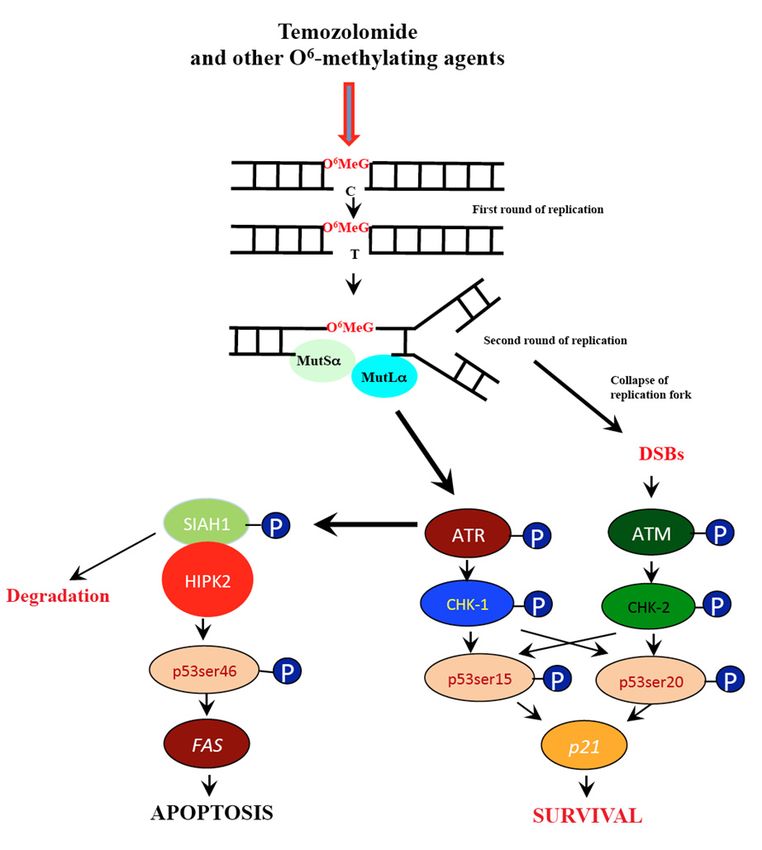
Int. J. Mol. Sci. 2019, 20, 1562                                                                  3 of 20

     In light of the hypothesis outlined above, according to which low doses elicit pro-survival and
high doses pro-death functions, we wondered whether the dose-response of key players of DDR shows
the hypothesized threshold. Here, we present data showing the non-existence of threshold doses
for γH2AX, p53ser15, p53ser46, apoptosis, autophagy and senescence in the p53 expressing LN-229
glioblastoma cell system.

2. Results

2.1. Dose Response and Time Dependence of p53, p-p53Ser15 and p-53Ser46 in Temozolomide Treated
Glioblastoma Cells
      To determine the dose-response of total p53, the pro-survival form p-p53Ser15 and the pro-death
form p-53Ser46, Western blot experiments were performed using the line LN-229. This glioblastoma
line bears p53 that harbours a point mutation, which however retains the trans-activating activity
of p53 [16]. Therefore, the line can be considered functionally p53 wild-type. LN-229 is MGMT
deficient [17]. We further used the isogenic line LN-229MGMT, which was stably transfected with
human MGMT cDNA and thus expresses MGMT [18], in order to find out whether the responses
observed are triggered by the specific TMZ-induced DNA damage O6 MeG. The p53 expression levels
were determined 24 and 72 h after the addition of TMZ to the medium of exponentially growing cells.
As shown in Figure 1A, the total p53 and p-p53ser15 protein levels went up with increasing TMZ
doses 24 h after treatment while the p-p53ser46 protein level remained nearly unaffected. With the
highest dose of TMZ in this experimental series (125 µM) the total p53 level was 3.7 times above the
control group while the expression level of p-p53ser15 reached 10.9 times above the control level where
p-p53Ser15 was only marginally detected (Figure 1A for a representative blot and for quantification
Figure 1C). The finding that, in contrast to p-53Ser15, p-p53ser46 was not induced 24 h after treatment
indicates that there is a sequential activation of pro-survival and pro-death factors in glioblastoma
cells exposed to TMZ. In LN-229MGMT, we did not observe any significant increase in p53, p-p53ser15
and p-p53ser46 (Figure 1A, right panel), demonstrating that the effects observed were triggered by the
O6 MeG lesion, which is specifically repaired by MGMT.
      After 72 h TMZ treatment, LN-229 cells displayed increasing signals of p53 and p-p53ser46
(Figure 1B), p-p53ser15 also increased above the control, although this was moderate compared to
p53 and p-p53ser46 (Figure 1B and for quantification Figure 1D). With the highest dose tested, total
p53 accumulated 13.1 times over the control, p-p53ser46 reached 8.9 times, and p-p53ser15 was 5.2
times the control level. In LN-229MGMT cells, p-53Ser46 was not enhanced and p-p53ser15 was only
slightly activated, very likely due to residual amounts of non-repaired O6 MeG (Figure 1B, right panel).
Overall, the data revealed that p-p53Ser15 is an early response and p-53Ser46 a late response triggered
by the TMZ-induced lesion O6 MeG.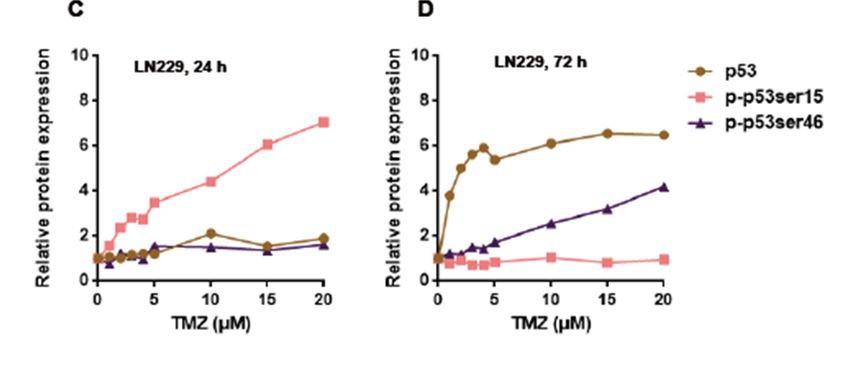
representative blot and for quantification Figure 1C). The finding that, in contrast to p-53Ser15,
p-p53ser46 was not induced 24 h after treatment indicates that there is a sequential activation of
pro-survival and pro-death factors in glioblastoma cells exposed to TMZ. In LN-229MGMT, we did
not observe any significant increase in p53, p-p53ser15 and p-p53ser46 (Figure 1A, right panel),
demonstrating
Int. J. Mol. Sci. 2019,that the effects observed were triggered by the O6MeG lesion, which is specifically
20, 1562 4 of 20
repaired by MGMT.
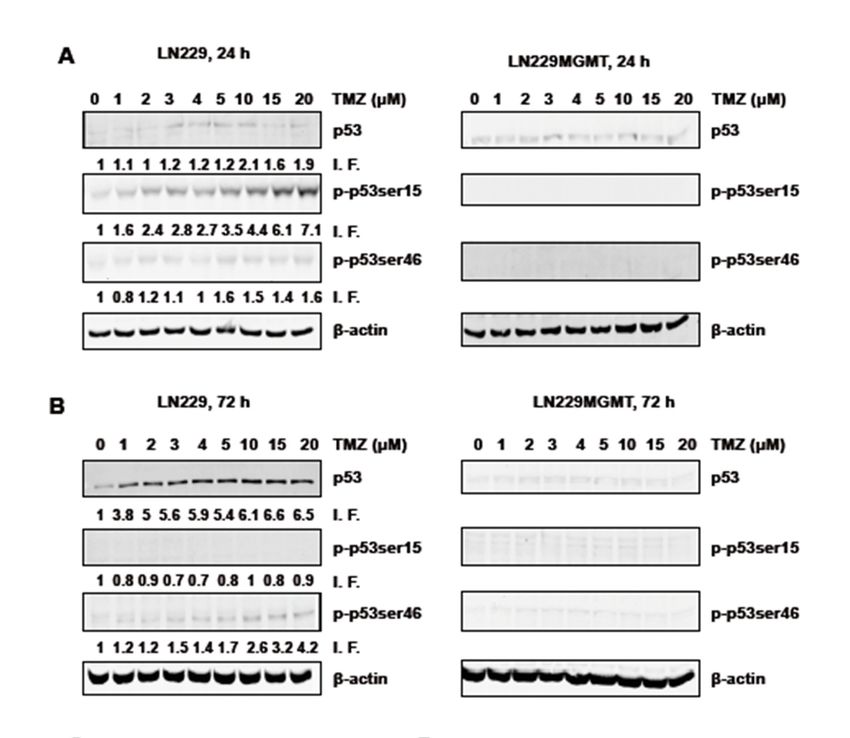
Figure 1. p53 expression and phosphorylation levels of p-p53ser15 and p-p53ser46 in LN-229 and
LN-229MGMT cells treated with doses of TMZ up to 125 µM. (A) LN-229 and LN-229MGMT cells
were exposed to doses of TMZ between 0 and 125 µM. 24 h later cells were harvested and p53 protein
expression, phosphorylation levels of p53ser15 and p53ser46 (p-p53ser15 and p-p53ser46) were detected
by Western blot. (B) LN-229 and LN-229MGMT cells were exposed to different doses of TMZ (0 µM-125
µM), 72 h later p53 protein expression, phosphorylation levels of p53ser15 and p53ser46 were detected
by Western blot. HSP90 was used as the loading control. I.F. means induction factor. (C) Relative
expression levels of total p53, p-p53ser15 and p-p53ser46 in LN-229 cells 24 h and (D) 72 h after addition
of TMZ to the medium. The blots were quantified using the Odyssey image analysis system with
ImageJ software and plotted on a liner scale.
2.2. Dose Response and Time-Course of Apoptosis Induction
To compare the sequence of anti- and pro-apoptotic p53 with cell death induction, we measured
apoptosis and necrosis in LN-229 and LN-229MGMT after TMZ treatment in a dose-range up to
125 µM by AV/PI staining and flow cytometry. Although 72 h after exposure to TMZ, the p-p53ser46
level was significantly enhanced (Figure 1B), the apoptosis level stayed low and was not significantly
above the control level (Figure 2A). Apoptosis in LN-229 started to increase 96 h after TMZ exposure,
and reached its maximum at 120 and 144 h (Figure 2A,E,F). This confirms previous observation
that O6 MeG triggered apoptosis is a late response. Of note, the cells were kept in an exponentially
growing state throughout the whole examination period. Apoptosis in LN-229 reached a saturation
level at >50 µM, presumably because of other endpoints that were concomitantly induced such as
senescence and autophagy [19]. Necrosis (defined as AV+PI+) was only marginally induced (Figure 2C),
supporting our previous finding that O6 MeG is a powerful apoptotic lesion. In LN-229MGMT cells,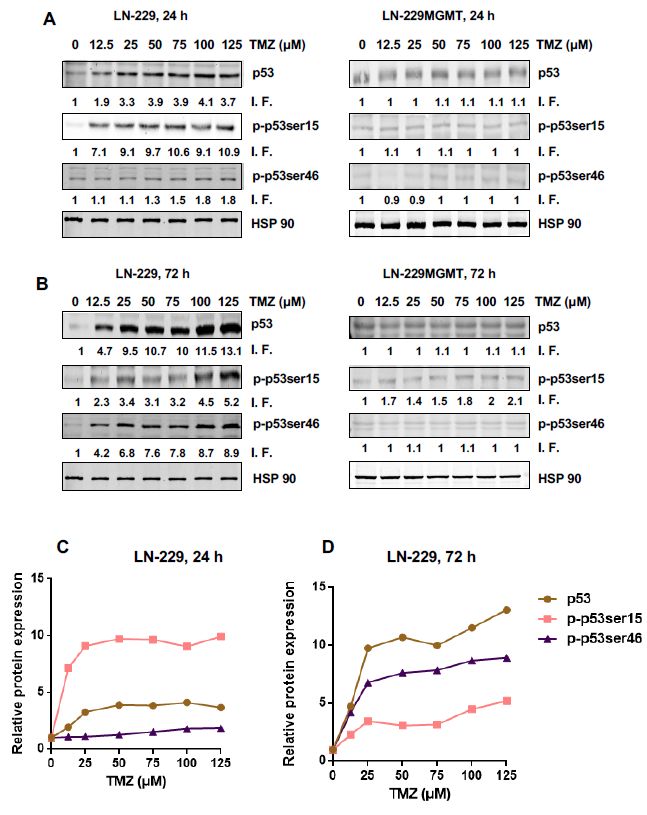
Int. J. Mol. Sci. 2019, 20, 1562                                                                                                    5 of 20

neither apoptosis nor necrosis was induced with all doses and time points assayed (Figure 2B,D),
Int. J. Mol. Sci. 2019, 20, x FOR
                               6 PEER REVIEW                                              5 of 20
demonstrating that O MeG was responsible for the cytotoxic effects observed.

      Figure 2.
      Figure     Apoptosis and
              2. Apoptosis      and necrosis
                                        necrosis levels
                                                  levels in
                                                          in LN-229
                                                             LN-229 and
                                                                      and LN-229MGMT
                                                                            LN-229MGMT cells   cells after
                                                                                                      after TMZ
                                                                                                            TMZ treatment
                                                                                                                   treatment with
                                                                                                                               with
      doses up to
      doses      to 125   µM.(A,B)
                     125µM.       (A and Apoptosis   and (C,D)
                                            B) Apoptosis      andnecrosis
                                                                   (C and induced
                                                                            D) necrosisby TMZ     in LN-229
                                                                                            induced     by TMZ andinLN-229MGMT
                                                                                                                      LN-229 and
      cells, detected by
      LN-229MGMT           AV/PI
                        cells,         double-staining
                                detected                   and flow cytometry.
                                             by AV/PI double-staining               Data cytometry.
                                                                             and flow     were obtained  Data72,were
                                                                                                                 96, 120 and 144
                                                                                                                      obtained   72,h
      after  TMZ   exposure.       Data    were  analysed     using  BD  FACSDiva       and  the
      96, 120 and 144 h after TMZ exposure. Data were analysed using BD FACSDiva and the Prism     Prism   software.   p-values   of
      < 0.05 are p-values
      software.  marked as   of *,< p0.05
                                       < 0.01
                                          are as **, p < as
                                              marked     0.001
                                                            *, pas *** and
                                                                < 0.01      p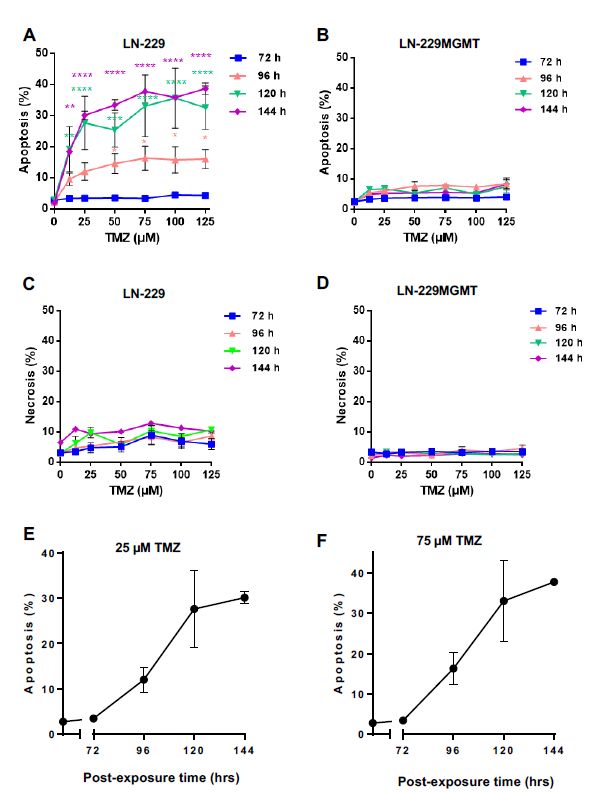
Int. J. Mol. Sci. 2019, 20, 1562                                                                                        6 of 20

factor p-p53ser15 is phosphorylated first (and quite early) compared to the pro-death factor p-p53ser46,
Int. J. Mol. Sci. 2019, 20, x FOR PEER REVIEW                                                     6 of 20
which gets activated at a later stage.

       Figure 3. p53 expression and phosphorylation levels of p-p53ser15 and p-p53ser46 in LN-229 and
      Figure   3. p53 expression
       LN-229MGMT       cells treatedandwithphosphorylation
                                              low doses of TMZ  levels
                                                                    (up ofto p-p53ser15
                                                                             20 µM). (A) and    p-p53ser46
                                                                                           LN-229            in LN-229 cells
                                                                                                   and LN-229MGMT         and
      LN-229MGMT
      were exposed tocells      treated
                          different      withoflow
                                      doses     TMZdoses   of hTMZ
                                                      and 24     later(up
                                                                        cellstowere
                                                                                20 µM).
                                                                                    lysed(A)   LN-229
                                                                                            onto       and protein
                                                                                                 the plates, LN-229MGMT
                                                                                                                      extracts
      cells
      werewere     exposed
             obtained    and to   different
                              total          doses and
                                     p53 protein   of TMZ    and 24 hand
                                                        p-p53ser15        later cells werewere
                                                                              p-p53ser46     lyseddetected
                                                                                                   onto theby plates, protein
                                                                                                                 Western   blot
      extracts
       analysis.were    obtained
                  (B) The   same was andperformed
                                          total p53 72protein
                                                        h after and
                                                                 TMZp-p53ser15        and p-p53ser46
                                                                         treatment. β-actin    was usedwere      detected
                                                                                                         as loading         by
                                                                                                                       control.
      Western
       I.F. meansblot  analysis.factor,
                    induction      (B) The  sameiswas
                                         which          performed
                                                   related             72 h after TMZ
                                                             to the non-exposed            treatment.
                                                                                       control.  (C,D) β-actin
                                                                                                       Relative  was  used as
                                                                                                                   expression
      loading
       levels ofcontrol.   I.F. means
                 p53, p-p53ser15      andinduction
                                          p-p53ser46 factor,  whichcells
                                                       in LN-229       is related
                                                                            24 and 72to hthe non-exposed
                                                                                          after              control.
                                                                                                TMZ treatment.         (C,were
                                                                                                                   Blots    D)
       quantified
      Relative      and analysed
                expression     levelswith  ImageJ
                                       of p53,     software.and
                                                p-p53ser15     Data   from representative
                                                                   p-p53ser46                  experiments
                                                                                  in LN-229 cells   24 and 72 arehshown.
                                                                                                                   after TMZ
      treatment. Blots were quantified and analysed with ImageJ software. Data from representative
       Originally, we
      experiments         suspected that the dose-response for the pro-apoptotic p-p53ser46 would show a
                      are shown.
 threshold. This, however, was not the case. As revealed by the quantification in Figure 3C,D, there is a
 linear increase inwe
      Originally,    the amount of
                       suspected    p53,
                                  that thep-p53Ser15  and for
                                           dose-response  p-p53Ser46.   The totalp-p53ser46
                                                              the pro-apoptotic   p53 level already
                                                                                              would reached
                                                                                                     show a
 saturation This,
threshold.   with ahowever,
                    dose of 5was   Thethe
                               µM.not   increase of p-p53ser15
                                           case. As revealed by(24
                                                                theh)quantification
                                                                      and p-p53ser46in (72 h) was
                                                                                       Figure     linear
                                                                                               3C,D,     over
                                                                                                     there is
athe whole
   linear    dose range
           increase       tested.
                     in the  amount of p53, p-p53Ser15 and p-p53Ser46. The total p53 level already
reached saturation with a dose of 5 µM. The increase of p-p53ser15 (24 h) and p-p53ser46 (72 h) was
linear over the whole dose range tested.
      It is also interesting that after 72 h, the p-p53Ser15 dropped to the control level (Figure 3D),
indicating this is an early and transient response compared to p-53Ser46, which is a late (Figure 3D,
see also Figure 1) and presumably also long-lasting response.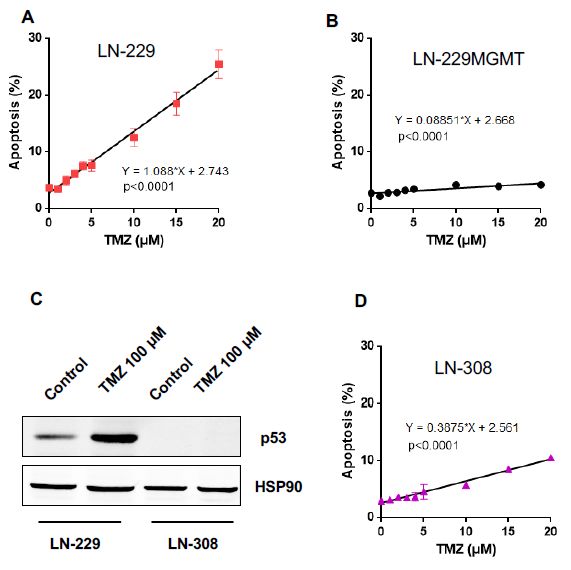
Int. J. Mol. Sci. 2019, 20, 1562                                                                                  7 of 20

       It is also interesting that after 72 h, the p-p53Ser15 dropped to the control level (Figure 3D),
indicating      this
 Int. J. Mol. Sci.    is 20,
                   2019, an xearly  and REVIEW
                              FOR PEER   transient response compared to p-53Ser46, which is a late (Figure73D,       of 20
see also Figure 1) and presumably also long-lasting response.
 2.4. Is There a Threshold in Apoptosis Induction?
2.4. Is There a Threshold in Apoptosis Induction?
         Having shown that p-p53Ser46 increases linearly with dose, we measured the dose-response of
       Having
 apoptosis (and    shown     that p-p53Ser46
                        necrosis)   in LN-229increases
                                                 cells in thelinearly
                                                                 same with   dose,range
                                                                       low dose    we measured
                                                                                         (0-20 µMthe dose-response
                                                                                                    TMZ).  As shownofin
apoptosis
 Figure 4A,    (and
                  therenecrosis)   in LN-229
                          is a linear increasecells
                                                (bestinfit)
                                                         theinsame    lowof
                                                                the level  dose  range (0–20
                                                                             apoptosis        µMany
                                                                                        without    TMZ).  As shown
                                                                                                     obvious          in
                                                                                                               threshold
Figure
 dose. 4A,Thethere
                 dose isthat
                           a linear  increase
                                displayed      (best fit) in increase
                                            a significant     the level above
                                                                         of apoptosis  without
                                                                                the control     anywas
                                                                                             level  obvious  threshold
                                                                                                        2.5 µM.   Again,
dose.
 necrosisThe was
              dosenot thatsignificantly
                            displayed a induced
                                          significant increase
                                                    (not  shown)  above
                                                                     and the control
                                                                          MGMT       level wascells
                                                                                  expressing   2.5 µM.
                                                                                                    wereAgain,  necrosis
                                                                                                         effect-negative
was   not significantly
 (Figure    4B).             induced (not shown) and MGMT expressing cells were effect-negative (Figure 4B).

       Figure4.4.TMZ-induced
      Figure      TMZ-inducedapoptosis
                                 apoptosisasasaafunction
                                                 functionofofdose
                                                              doseofofTMZ
                                                                       TMZdose
                                                                             doseininLN-229,
                                                                                      LN-229,LN-229MGMT
                                                                                              LN-229MGMTand   and
      p53
       p53 lacking LN-308 cells. (A) Apoptosis as measured 120 h after TMZ exposure asa afunction
          lacking  LN-308 cells. (A) Apoptosis   as measured   120  h after TMZ   exposure as   functionofofdose
                                                                                                             dose
      in LN-229 cells and (B) LN-229MGMT cells. Data are the mean of three independent experiments.
       in LN-229 cells and (B) LN-229MGMT cells. Data are the mean of three independent experiments. (C)
      (C) LN-229 and LN-308 cells were exposed to 100 µM TMZ, protein extracts were collected 72 h later
       LN-229 and LN-308 cells were exposed to 100 µM TMZ, protein extracts were collected 72 h later and
      and the p53 protein expression was detected by Western blot. HSP90 was used as loading control.
       the p53 protein expression was detected by Western blot. HSP90 was used as loading control. (D)
      (D) Apoptosis in LN-308 cells as a function of dose of TMZ measured 120 h after TMZ treatment. Linear
       Apoptosis in LN-308 cells as a function of dose of TMZ measured 120 h after TMZ treatment. Linear
      regression analysis was done as described in Materials and Methods.
       regression analysis was done as described in Materials and Methods.

     To explore the possibility that p53 is responsible for the lack of a no-effect threshold,
       To explore the possibility that p53 is responsible for the lack of a no-effect threshold, another
another glioma cell line, LN-308, was introduced in this step of analysis. LN-308 is completely
 glioma cell line, LN-308, was introduced in this step of analysis. LN-308 is completely lacking p53
lacking p53 (Figure 4C) due to gene deletion [16]. It is also MGMT deficient (Supplementary Materials,
 (Figure 4C) due to gene deletion [16]. It is also MGMT deficient (Supplementary Materials, Figure
Figure S3). Nevertheless, in order to avoid any effects caused by residual MGMT not detectable by the
 S3). Nevertheless, in order to avoid any effects caused by residual MGMT not detectable by the
assays, we routinely pre-treated the cells with O6 BG. 6The data shown in Figure 4D revealed that LN-308
 assays, we routinely pre-treated the cells with O BG. The data shown in Figure 4D revealed that
 LN-308 cells are more resistant than LN-229 to TMZ-induced apoptosis. The best fit of the
 dose-response curve was linear and did not reveal a threshold.
       To verify the data, colony formation assays were employed, which are considered to be highly
 sensitive for measuring reproductive cell death. After exposing LN-229, LN-229MGMT and LN-308
 cells plated on dishes to TMZ and allowing them to grow for about two weeks, the formed colonies
Int. J. Mol. Sci. 2019, 20, 1562 8 of 20
cells are more resistant than LN-229 to TMZ-induced apoptosis. The best fit of the dose-response curve
was linear and did not reveal a threshold.
To verify the data, colony formation assays were employed, which are considered to be highly
Int. J. Mol. Sci. 2019, 20, x FOR PEER REVIEW 8 of 20
sensitive for measuring reproductive cell death. After exposing LN-229, LN-229MGMT and LN-308
cells
wereplated
counted.on dishes to TMZfraction
The survival and allowing
declinedthem to grow for about
dose-dependently two weeks,
in LN-229 and the formed
LN-308. Forcolonies
LN-229
were
cells,counted.
the survivalThe curves
survival fraction
did declined
not show dose-dependently
a shoulder in LN-229 and
(Figure 5), supporting LN-308.
the view thatFor LN-229
there is no
cells, the survival
threshold curves did
for the induction of not
cell show
death ainshoulder
this line. (Figure 5), supporting
In the dose range used, the view that there
LN-229MGMT cellsiswere
no
threshold for the induction
strongly protected againstofTMZ-induced
cell death in this
cell line. In the
death, dose range
showing only used, LN-229MGMT
a slight decline in cells
their
were
colony-forming ability (Figure 5). For LN-308 cells, the survival curve displayed decline
strongly protected against TMZ-induced cell death, showing only a slight in their
only a marginal
colony-forming
shoulder (Figureability 5 and(Figure 5). For LN-308
Supplementary Material,cells, the S4).
Figure survival curve
Overall, thedisplayed only athe
data confirmed marginal
results
shoulder
obtained (Figure 5 and Supplementary
in the apoptosis assays. Material, Figure S4). Overall, the data confirmed the results
obtained in the apoptosis assays.
Figure 5. Survival (colony formation) as a function of TMZ dose in LN-229, LN-229MGMT and
Figure 5. Survival (colony formation) as a function of TMZ dose in LN-229, LN-229MGMT and p53
p53 lacking LN-308 cells. Colony survival assays with LN-229, LN-229MGMT and LN-308 cells
lacking LN-308 cells. Colony survival assays with LN-229, LN-229MGMT and LN-308 cells exposed
exposed to different concentrations of TMZ. Regression lines are the best fit and drawn following
to different concentrations of TMZ. Regression lines are the best fit and drawn following computer
computer analysis.
analysis.
2.5. Dose-Response of TMZ-Induced Senescence and Autophagy
2.5. Dose-Response of TMZ-Induced Senescence and Autophagy
In a previous work, we showed that TMZ induces not only apoptosis, but also senescence and
In a previous
autophagy in LN-229work, we[19].
cells showed that TMZ
Therefore, we induces
wondered notwhether
only apoptosis,
senescencebut and
also autophagy
senescence and
are
autophagy in LN-229 cells [19]. Therefore, we wondered whether senescence and
induced in the same dose range as apoptosis and whether there is a threshold in the dose-response autophagy are
inducedFor
curves. in the same dosesenescence
comparison, range as apoptosis and whether
and autophagy there
were also is a threshold
determined in the
in p53 dose-response
deficient LN-308
curves. For comparison, senescence and autophagy were also determined in
cells. Senescence induced by TMZ increased as a linear function of dose (Figure 6A). Similarp53 deficient LN-308
to
cells. Senescence induced by TMZ increased as a linear function of dose (Figure
apoptosis, MGMT protected against TMZ-induced senescence (Figure 6B), indicating the primary 6A). Similar to
apoptosis,
trigger is O6MGMT
MeG. Inprotected against
LN-308 cells, the TMZ-induced senescence
slope of the senescence (Figure
curve was 6B),
lowerindicating the primary
than in LN-229 cells,
trigger is O 6MeG. In LN-308 cells, the slope of the senescence curve was lower than in LN-229 cells,
and therefore, comparatively high doses of TMZ have to be used to significantly induce senescence.
and therefore,ofcomparatively
Extrapolation high curves
the dose-response doses of TMZ have
indicated theto be used to significantly
non-existence of a threshold induce senescence.
(Figure 6C).
Extrapolation of the dose-response curves indicated the non-existence of a threshold (Figure 6C).Int. J. Mol. Sci. 2019, 20, 1562 9 of 20
Int. J. Mol. Sci. 2019, 20, x FOR PEER REVIEW 9 of 20
Figure 6. TMZ-induced senescence in LN-229, LN-229MGMT and LN-308 cells. (A) LN-229,
(B)
FigureLN-229MGMT
6. TMZ-inducedand (C) LN-308 cells
senescence were exposed
in LN-229, to TMZ in and
LN-229MGMT the dose range
LN-308 of 0–20
cells. (A) µM. 96 h later
LN-229, (B)
cells were collected, stained with C FDG for 15 min, and analysed by flow cytometry. Regression
LN-229MGMT and (C) LN-308 cells12were exposed to TMZ in the dose range of 0–20 µM. 96 h later lines
represent
cells the best fitstained
were collected, of data with
obtained.
C12FDG for 15 min, and analysed by flow cytometry. Regression
lines represent the best fit of data obtained.
The autophagy response was similar to senescence. TMZ induced more autophagy in LN-229
thanThe
in LN-308
autophagy cells (Figure was
response 7A,C), while
similar to LN-229MGMT
senescence. TMZ showed
induced nomore
response at all (Figure
autophagy 7B).
in LN-229
Taken together, the results show that p53 proficient LN-229 cells are more sensitive than
than in LN-308 cells (Figure 7A and 7C), while LN-229MGMT showed no response at all (Figure 7B). p53 deficient
LN-308together,
Taken cells as tothe
TMZ-induced
results showapoptosis,
that p53senescence
proficientand autophagy.
LN-229 No threshold
cells are was observed
more sensitive than p53for
these endpoints
deficient LN-308 in LN-229
cells as to and LN-308 cells.
TMZ-induced apoptosis, senescence and autophagy. No threshold was
observed for these endpoints in LN-229 and LN-308 cells.Int. J. Mol. Sci. 2019, 20, 1562 10 of 20
Int. J. Mol. Sci. 2019, 20, x FOR PEER REVIEW 10 of 20
Figure 7. TMZ-induced autophagy in LN-229, LN-229MGMT and LN-308 cells. (A) LN-229,
Figure 7. TMZ-induced autophagy in LN-229, LN-229MGMT and LN-308 cells. (A) LN-229, (B)
(B) LN-229MGMT and (C) LN-308 cells were exposed to TMZ in the dose range of 0-20 µM. 96 h
LN-229MGMT
later cells were and (C) LN-308
collected cells were
and analysed. Theexposed to TMZ
results were in the
shown bydose
Cytorange of 0-20 µM.
ID fluorescence 96 change
fold h later
cells were collected and analysed. The results were shown by Cyto ID fluorescence fold
and compared with control samples. Control samples in the three cell lines were set to 1. change and
compared with control samples. Control samples in the three cell lines were set to 1.
2.6. Dose-Response of TMZ-Induced DNA Double-Strand Breaks
2.6. Dose-Response of TMZ-Induced DNA Double-Strand Breaks
The endpoints we have assessed are triggered by the primary lesion O6 MeG, whose processing
givesThe
riseendpoints
to DSBs thatweare
have assessed to
considered arebetriggered
the ultimateby the primary
trigger of p53 lesion O6MeG, and
stabilization whosecellprocessing
death [13].
gives rise to
Therefore, DSBs that
different cellare considered
death responses to could
be thebe ultimate trigger
the result of p53 stabilization
of differences and cell death
in DSB formation. Thus,
[13]. Therefore,
the more different
sensitive cell death
p53 proficient responses
LN-229 could
cells might be the
exhibit result
better 6
O ofMeGdifferences
processing inresulting
DSB formation.
in DSBs
Thus, the more
than LN-308 sensitive
cells p53 proficient
upon treatment withLN-229
TMZ. To cells mightthis
explore exhibit better O6the
hypothesis, MeG processing
γH2AX resulting
foci assay was
in DSBs
used, thanisLN-308
which cells upon
an accepted treatment
indicator of DSBs with TMZ.
[20,21]. Tocells
The explore this hypothesis,
(LN-229, LN-229MGMT the and
γH2AX foci
LN-308)
assay was used,
were treated with which is anTMZ
0-20 µM accepted
and, 72indicator
h later,of DSBs
the γH2AX[20,21].
fociThe
were cells (LN-229, and
determined LN-229MGMT
quantified.
and
The LN-308)
γH2AX fociwereintreated
LN-229with 0-20 aµM
showed TMZ
liner and, 72
increase h later,
with dose the γH2AX
of TMZ foci were
(Figure determined
8A) and no thresholdand
quantified. The γH2AX foci in LN-229 showed a liner increase with dose of
was obvious. In LN-229MGMT cells, DSBs were not induced at significant level in the whole dose TMZ (Figure 8A) and no
threshold
range (Figure was8B).
obvious. In LN-229MGMT
In LN-308, the DSB frequency cells, was
DSBs were
very not induced
similar to LN-229. at The
significant
increaselevel
was in the
linear
whole dosenorange
and, again, (Figure
threshold 8B).
could beIn LN-308,
detected the DSB
(Figure frequency
8C). The similarwas very similar
frequencies of DSBstoinLN-229.
LN-229 Theand
increase was linear
LN-308 indicate thatand, again, no
sensitivity thresholdbetween
differences could bethedetected (Figure
cell lines are the8C). The of
result similar frequencies
downstream of
events
DSBs in LN-229
triggered by DSBs,andpresumably
LN-308 indicate
throughthatp53.
sensitivity differences between the cell lines are the result
of downstream events triggered by DSBs, presumably through p53.Int. J. Mol.
Int. J.Sci.
Mol. Sci. 20,
2019, 1562
2019, 20, x FOR PEER REVIEW 11 of 20
11 of 20
Figure 8. γH2AX foci as a function of dose of TMZ in LN-229, LN-229MGMT and LN-308 cells.
Figure 8. γH2AX foci as a function of dose of TMZ in LN-229, LN-229MGMT and LN-308 cells. Cells
Cells were exposed to TMZ in the dose range of 0-20 µM. 72 h later cells were fixed, stained for γH2AX
were exposed to TMZ in the dose range of 0-20 µM. 72 h later cells were fixed, stained for γH2AX
and foci were quantified by the Metafer system in (A) LN-229, (B) LN-229MGMT and (C) LN-308 cells.
and foci were quantified by the Metafer system in (A) LN-229, (B) LN-229MGMT and (C) LN-308
Data are the mean of several experiments and were assessed by linear regression analysis.
cells. Data are the mean of several experiments and were assessed by linear regression analysis.
3. Discussion
3. Discussion
The DNA methylating agent temozolomide is a first-line drug in the treatment of high-grade
malignantThe DNAIt methylating
glioma. is effective inagent
inducing temozolomide
cell death ifisthea first-line
tumor lacks drug in theortreatment
MGMT expressesof high-grade
it at low
level, i.e., < 30 fmol/mg protein [22]. These tumors are defined as “methylated” because of MGMT it at
malignant glioma. It is effective in inducing cell death if the tumor lacks MGMT or expresses
low CpG
promoter level,methylation,
i.e., < 30 fmol/mg protein [22].
which correlates These tumors
with silencing are defined
of the gene [23] andas “methylated”
deficient because of
or low MGMT
protein expression and enzyme activity [24]. Since O MeG induced by TMZ (and other methylating or
MGMT promoter CpG methylation, which correlates
6 with silencing of the gene [23] and deficient
low MGMT
anticancer drugs)protein
is a toxic expression
DNA damage, and enzyme activity [24]. Since
it is understandable O6MeGdeficiency
that MGMT induced by(determined,
TMZ (and other
methylating anticancer drugs) is a toxic DNA damage, it is understandable
e.g., by promoter methylation) leads to responsiveness of the tumor [25,26]. Despite these well-known that MGMT deficiency
(determined, e.g., by promoter methylation) leads to responsiveness
relationships, the prognosis of glioblastoma, which account for up to 70% of high-grade malignant of the tumor [25,26]. Despite
glioma,these well-known
is bleak relationships,
as the median length the prognosis
of survival of glioblastoma,
is only 14.6 months (12.6 whichand account for up in
23.4 months tothe70% of
MGMT-unmethylated and MGMT-methylated subgroups, respectively) [27]. Although recent phase and
high-grade malignant glioma, is bleak as the median length of survival is only 14.6 months (12.6
23.4 months
III clinical in the that
trials showed MGMT-unmethylated
the median overalland MGMT-methylated
survival for adult patients subgroups,
with newly respectively)
diagnosed [27].
Althoughcan
glioblastoma recent
reach phase
up to III20
clinical
months trials showed
in the thatcohorts,
control the median overallasurvival
indicating trendingfor adult patients
increase in
with newly diagnosed glioblastoma can reach up to 20 months
median overall survival, the prognosis is still bad with 5-year overall survival rates of less in the control cohorts, indicating
than a
trending
10% (for increase
references seein[28]).
median overall with
Treatment survival,
TMZthe prognosis
occurs daily is still different
along bad with schedules
5-year overall survival
[29–32].
rates of less than 10% (for references see [28]). Treatment with TMZ
The serum concentration of TMZ has been determined to be in the range of up to 30 µM, with a half-life occurs daily along different
schedules [29–32]. The serum concentration of TMZ has been determined to be in the range of up toInt. J. Mol. Sci. 2019, 20, 1562 12 of 20
of about 2 h [33–38]. In a therapeutic setting with a single oral dose of 150 mg/m2 , the peak plasma
concentration was, on average, 28.4 µM (5.5 µg/mL) and the brain interstitium concentration 1.5 µM
(0.3 µg/mL) [39]. In another study TMZ was determined following oral 200 mg/m2 TMZ, with a
plasma peak level of 72 µM and a cerebrospinal fluid level of 9.9 µM [40]. Thus, the TMZ concentration
at the target organ seems to be rather low and it is reasonable to suppose, notably in view of the high
recurrence rate, that the TMZ level is not high enough in order to exert a killing effect on residual
(post-operative) glioblastoma cells. This notion is fueled by the supposition that at low dose levels cell
death is not induced, which goes back to the general paradigm that low DNA damage levels induce
survival functions, whereas high DNA damage levels activate cellular death pathways [1–6]. This
view implies that DNA damage thresholds do exist that regulate the balance between life and death.
This work was aimed at proving or disproving this widely accepted hypothesis.
First, we have shown that in LN-229 and LN-308 glioblastoma cells, which are functionally
wild-type and mutant for p53, respectively [16], the amount of DSB (γH2AX foci) increases as a linear
function of dose. TMZ does not need metabolic activation. It spontaneously decomposes, yielding
carbenium ions that methylate DNA dose-dependently. From this it is reasonable to conclude that
O6 MeG is induced as a linear function of dose. The linear dose-response for DSBs indicates that the
rate of conversion of O6 MeG into DSB is independent on dose, and there is no defense at low dose
levels that prevents the formation of DSBs in LN-229 and LN-308 cells. In this model system, we
determined about 60 DSBs with a dose of 20 µM TMZ. The amount of O6 MeG induced under these
conditions is not known.
We further show in Western blot experiments that p53, p-p53ser15 and p-p53ser46 increase up
to a saturation level as a linear function of dose. This was a surprising finding since it collides
with the view that low DNA damage triggers survival and high DNA damage triggers death
functions. Upon TMZ treatment, p-p53ser15 results from ATR (ATM) and downstream CHK1 (CHK)
activation [41], which is likely the result of blocked replication forks and DSBs formed on collapsed
forks. The linear dose-response suggests that even low O6 MeG and DSB levels induced by TMZ are
able to activate the DNA damage checkpoint kinases that phosphorylate 53 at serine 15. Unexpectedly,
p-p53ser46 was also generated at low dose levels without a detectable threshold. p-p53ser46 results
from activation of the stress kinase HIPK2 [42]. The pathway of HIPK2 activation in general [43] and
following TMZ in glioblastoma cells, including LN-229, has been described [15]. The available data
suggest that primarily ATR and following secondary activation, also ATM, phosphorylate SIAH1,
the inhibitor of HIPK2 [44,45]. This leads to degradation of SIAH1 and liberation and stabilization
of HIPK2, which in turn phosphorylates p53 at serine 46 (see Figure 9). The linearity of p-p53ser46
accumulation indicates that ATR (ATM) is able to phosphorylate SIAH1 and thus liberate HIPK2 even
at very low TMZ doses.
We have shown that p-p53ser15 and p-p53ser46 become activated following TMZ treatment in
a sequential order, with early activation of p-p53ser15 and late activation of p-p53ser46. p-p53ser15
becomes detectable 24 h after treatment and declines a day later, indicating that this is a transient
response. p-p53ser46 was detected 3 days after treatment and was still detectable when cells started to
undergo apoptosis. This is in line with the pro-apoptotic role of this phosphorylated form of p53.Int. J. Mol. Sci. 2019, 20, 1562 13 of 20
Int. J. Mol. Sci. 2019, 20, x FOR PEER REVIEW 13 of 20
Figure 9. Pathways triggered by O66 -methylguanine (a simplified schema). 6O6 MeG is processed
Figure 9. Pathways triggered by O -methylguanine (a simplified schema). O MeG is processed by
by MMR resulting in replication blockage and the formation of free DSBs. This gives rise to ATR
MMR resulting in replication blockage and the formation of free DSBs. This gives rise to ATR and
and ATM and downstream p53 activation. The kinase HIPK2 becomes activated following SIAH1
ATM and downstream p53 activation. The kinase HIPK2 becomes activated following SIAH1
phosphorylation, which in turn activates p53ser46 that targets the promoter of several pro-apoptotic
phosphorylation, which in turn activates p53ser46 that targets the promoter of several pro-apoptotic
genes. Although p-p53ser15 can transcriptionally activate DNA repair genes such as DDB2, which is
genes. Although p-p53ser15 can transcriptionally activate DNA repair genes such as DDB2, which is
involved in nucleotide excision repair, there is no evidence yet that p53 upregulates DNA repair genes
involved in nucleotide excision repair, there is no evidence yet that p53 upregulates DNA repair
(as an immediate-early response) that are of importance for temozolomide resistance.
genes (as an immediate-early response) that are of importance for temozolomide resistance.
In accordance with this is the finding that apoptosis (Figure 4) and reproductive death (Figure 5)
Similar to apoptosis, DNA damage-induced senescence (Figure 6) and autophagy (Figure 7)
of LN-229 cells do not display a clear no-effect threshold. Cell death appears to be a linear function of
were induced as a linear function of the dose of TMZ. In MGMT expressing cells, TMZ was
the dose of TMZ. It is known that p-p53ser46 binds to the promoter of pro-apoptotic genes, including
ineffective in inducing these effects (doses up to 50 µM) suggesting that they were triggered by
the death receptor FAS (alias CD95/APO1), and thus stimulates its transcription [46]. This was recently
O6MeG. Previously, we have shown that senescence and autophagy are regulated by the same
shown to occur upon TMZ in LN-229 cells [15]. Obviously, there is no threshold for p-p53ser46
upstream damage response pathway that regulates apoptosis [19]. The linearity for these endpoints
transactivation activity in this cell system.
indicates that pro- and anti-death functions are induced simultaneously at each dose level. From the
Similar to apoptosis, DNA damage-induced senescence (Figure 6) and autophagy (Figure 7) were
therapeutic point of view, the finding points to the need of inhibiting the pro-survival functions
induced as a linear function of the dose of TMZ. In MGMT expressing cells, TMZ was ineffective in
senescence and autophagy in a way that cells preferentially enter the death pathway.
inducing these effects (doses up to 50 µM) suggesting that they were triggered by O6 MeG. Previously,
Finally, we observed that the p53 deficient glioblastoma cell line, LN-308 is more resistant to the
we have shown that senescence and autophagy are regulated by the same upstream damage response
induction of apoptosis by TMZ. This finding is compatible with our previous observations according
pathway that regulates apoptosis [19]. The linearity for these endpoints indicates that pro- and
to which MGMT deficient p53wt glioma cells are more sensitive to the cytotoxic (apoptotic) effect of
anti-death functions are induced simultaneously at each dose level. From the therapeutic point of view,
TMZ than MGMT deficient p53 mutated cells that lack the transactivation activity of p53 [47]. The
the finding points to the need of inhibiting the pro-survival functions senescence and autophagy in a
p-53 independent apoptotic pathway of glioblastoma cells is bound on the endogenous
way that cells preferentially enter the death pathway.
mitochondrial pathway, which seems to be more refractory than the p53 regulated death receptor
Finally, we observed that the p53 deficient glioblastoma cell line, LN-308 is more resistant to the
pathway [18]. Of note, p53 also stimulates the mitochondrial cell death route by supporting the
induction of apoptosis by TMZ. This finding is compatible with our previous observations according
translocation of BAX to the outer mitochondrial membrane and sequestering Bcl-2, leading to
to which MGMT deficient p53wt glioma cells are more sensitive to the cytotoxic (apoptotic) effect of
cytochrome C release and apoptosome formation [48,49]. It is therefore reasonable to conclude that
TMZ than MGMT deficient p53 mutated cells that lack the transactivation activity of p53 [47]. The p-53
p53-driven apoptosis rests on both p-p53ser46 promoter activation and exacerbation of
independent apoptotic pathway of glioblastoma cells is bound on the endogenous mitochondrial
mitochondrial damage through cytoplasmatic p53.
pathway, which seems to be more refractory than the p53 regulated death receptor pathway [18].
Of note, p53 also stimulates the mitochondrial cell death route by supporting the translocation of
4. Conclusions and Implications
BAX to the outer mitochondrial membrane and sequestering Bcl-2, leading to cytochrome C release
Although weformation
and apoptosome are aware[48,49].
that this
It isstudy needs
therefore extensiontotoconclude
reasonable other cellthat
lines and tumor
p53-driven models,
apoptosis
LN-229 provides an example where the paradigm that low doses activate survival
rests on both p-p53ser46 promoter activation and exacerbation of mitochondrial damage through and high doses
death functions
cytoplasmatic does not apply. Regarding DNA repair, it is known that p-p53ser15 triggers the
p53.
activation of DNA repair genes, which causes protection against genotoxins [7]. According to our
experience with different cell types and genotoxins, the most robust p53-stimulated repair genesInt. J. Mol. Sci. 2019, 20, 1562 14 of 20
4. Conclusions and Implications
Although we are aware that this study needs extension to other cell lines and tumor models,
LN-229 provides an example where the paradigm that low doses activate survival and high doses
death functions does not apply. Regarding DNA repair, it is known that p-p53ser15 triggers the
activation of DNA repair genes, which causes protection against genotoxins [7]. According to our
experience with different cell types and genotoxins, the most robust p53-stimulated repair genes encode
DDB2 and XPC as well as the translesion polymerase Pol eta (Pol H) [50]. However, these genotoxic
stress-inducible repair proteins are not involved in the repair of TMZ-induced DNA methylation
damage. A reasonable candidate for causing a threshold is MGMT. Thus, from work that included
bacteria to humans, it became clear that MGMT mediated DNA repair gives rise to a mutagenic
and toxic threshold [11,51,52]. However, a search for an adaptive response in brain cancer cells
revealed that MGMT is not inducible by TMZ, which is clearly different from rodent cells in which
MGMT was shown to be upregulated following genotoxic stress [53] in a p53 dependent manner [54].
Therefore, lack of induction of repair of O6 MeG in glioma cells is surely a contributing factor for the
non-existence of a threshold. If ATR/ATM becomes activated even with low damage levels and also
triggers senescence, autophagy and apoptosis, the important question arises as to the mechanism that
makes the switch between the pathways. This is clearly an attractive area of future research.
In view of the limited amount of cell lines used in this study, it is too early for clinical implications.
Nevertheless, the data may be taken to indicate that even a low dose of TMZ is able to elicit a cytotoxic
response in p53 wild-type and MGMT lacking tumors. Of note, a prerequisite for O6 MeG induced
cytotoxicity is cell proliferation. If a fraction of tumor cells is released in a senescent state, it will no
longer be subjected to O6 MeG triggered apoptosis. This might especially be the case if cells are treated
repetitively. Therefore, on the basis of the results presented here, the metronomic dose protocol (drug
application at low and frequent doses) bears beneficial effects by exacerbating cytotoxicity, but also
adverse effects since the fraction of non-proliferating (senescent) cells might be increasing with each
consecutive treatment dose. It should also be considered that TMZ is usually given concomitantly
with ionizing radiation (usually 2 Gy per treatment), which may additionally ameliorate the fraction
of non-proliferating tumor cells. If the arrest state is transient, it is conceivable that the fraction of
senescent cells at the end of therapy contributes to recurrence, which is usually the unfortunate case
for glioblastomas. Again, we are aware of the limitations of the study, which rests on comparison of
only three cell lines (LN-229, LN-220MGMT and LN-308). It provides, however, an example of lack of
threshold doses in cell death responses (γH2AX, p53ser15 and p53ser46, apoptosis, autophagy and
senescence) if MGMT is lacking. The data warrant further studies with a larger set of well-defined cell
lines, stem cells and tumors in situ prior to and after therapy.
5. Materials and Methods
5.1. Cell Lines and Culture Conditions
The human glioma cell line LN-229 was purchased from American Type Culture Collection
(ATCC), the human glioma line LN-308 were a generous gift from Prof. Dr. M. Weller (Laboratory of
Molecular Neuro-oncology, University of Zurich, Switzerland). Upon receipt, the cells were amplified
for cryopreservation in liquid-N2 and freshly thawed cell stocks were used for every battery of
tests. LN-229, LN-308 and the LN-229MGMT transfected cells [19] were cultured in DMEM (Gibco,
Life Technologies Corporation, Paisley, UK) supplemented with 10% FBS and penicillin/streptomycin
(PAA Laboratories, GmbH, Cölbe, Germany). Cells were maintained at 37◦ C in a humidified 5%
CO2 atmosphere.Int. J. Mol. Sci. 2019, 20, 1562 15 of 20
5.2. Cell Seeding and Growth
Cells were cultured in DMEM supplemented with 10% fetal bovine serum. Cells were seeded 24 h
before any treatment to settle down and get ready for knockdown and treatments. Seeding density
was such that exponential cell growth was ensured for the whole experimental period.
5.3. Drugs and Drug Treatment
The MGMT inhibitor O6 -benzylguanine (O6 BG, Sigma-Aldrich, Steinheim, Germany) was
dissolved in DMSO to a stock concentration of 10 mM, aliquoted and stored at −20 ◦ C. To inactivate
any residual MGMT, 1 h before the addition of TMZ O6 BG was added to the medium. The final
concentration of O6 BG in DMEM was 10 µM. Temozolomide was a generous gift of Dr Geoff Margison
(University of Manchester, UK). Stocks were dissolved in dimethyl sulfoxide (DMSO, Carl Roth
GmbH, Karlsruhe, Germany), diluted in two parts sterile dH2 O to a concentration of 35 mM, aliquoted
and stored at −80 ◦ C until use. After thawing, the stock solution was sonicated for 10 s to help
TMZ dissolution. Cells were exposed to TMZ by directly adding the aqueous TMZ stock solution to
the medium.
5.4. Colony Survival Assays
Cells were seeded in 6 cm dishes, treated 1 day later with TMZ and left to grow in a CO2 incubator
until colonies appeared (microscopic control). Colonies were fixed in methanol and stained (1.25%
Giemsa, 0.125% crystal violet). The plating efficiency represents the number of colonies formed in the
control sample/ number of cells seeded in the control sample × 100%, and the surviving fraction is
the number of colonies after treatment/number of cells seeded x PE. Colonies containing more than
about 50 cells were scored.
5.5. Apoptosis/Necrosis Flow Cytometry
For the determination of apoptosis and necrosis the annexin V/propidium iodide (AV/PI) assay
coupled with flow cytometry analysis was used. In brief, for harvest cells in the supernatant were
collected in a 15 mL tube, samples were washed twice with PBS and detached with trypsin/EDTA
solution. They were washed twice in PBS and 50 µL 1× binding buffer and 2.5 µL Annexin V/FITC
(Miltenyi Biotec GmbH, Bergisch Gladbach, Germany) were added to each sample. Following 15 min
incubation in the dark on ice, 430 µL 1x binding buffer and 1 µg/mL PI (Sigma-Aldrich, Steinheim,
Germany) were added to the cells. Data acquisition was done by a FACS Canto II flow cytometer
(Becton Dickinson GmbH, Heidelberg, Germany). Annexin V positive cells were classified as apoptotic
while annexin V and PI double-positive cells were classified as necrotic/late-apoptotic. The data were
analysed using the BD FACSDiva software. A representative plot of control and treated cells is shown
in Supplementary Materials, Figure S1.
5.6. Whole-Cell Protein Extracts
Cells were washed twice with PBS and 300-600ul RIPA buffer was added to each sample.
The cells were scraped off and transferred to pre-cooled tubes, vortexed and put on ice. Sonication
was employed for disrupting cells (3 × 10 pulses) and samples were centrifuged (10 min at 4 ◦ C,
14,000 rpm) to obtain the protein extract in the supernatant. Protein concentration was determined
by Bradford. The extraction buffer and RIPA buffer recipes were as follows: Extraction buffer:
20 mM tris(hydroxymethyl)aminomethane [TRIS] HCl pH 8.5, 1 mM EDTA, 5 % glycerine, 1 mM
β-mercaptoethanol, 10 µM dithiothreitol [DTT], 1 x protease inhibitor cOmpleteTM . RIPA buffer:
50 mM Tris (pH 8), 150 mM NaCl, 1 mM EDTA, 1% NP-40, 0.5% sodium deoxycholate, 0.1% SDS.
This buffer was stored at 4 ◦ C before use. Prior to use, freshly prepared PMSF 100 mM stock (10 µL),
Na3 VO4 200 mM stock (10 µL), DTT 1 M stock (2 µL) and 7x protease inhibitor (142.9 µL) were added
to 835 µl RIPA buffer to get 1 mL working buffer.Int. J. Mol. Sci. 2019, 20, 1562 16 of 20
5.7. Western Blot
Following the separation of proteins by sodium dodecyl sulphate polyacrylamide gel
electrophoresis (SDS-PAGE) and transfer to nitrocellulose membranes, the following antibodies were
used: Anti-β-actin (Abcam; Ab8227), anti-HSP90 (Cell Signaling Technology, Frankfurt, Germany;
No. 4874), anti-p53 (Santa Cruz Biotechnology, Heidelberg, Germany; sc-126), anti-phospho-p53 (Ser15)
(Cell Signaling Technology; No. 9284), anti-phospho-p53 (Ser46) (Becton Dickinson; No. 558245),
anti-MGMT (Sigma-Aldrich; HPA032136). Proteins were detected using the Odyssey 9120 Infrared
Imaging System (Li-Cor Biosciences, Lincoln, Nebraska, USA). The membrane was dried at room
temperature in the dark and scanned with Odyssey. Image J was used for the quantification.
5.8. Autophagy Assay
The Cyto-ID kit (ENZO Life Sciences, Lörrach, Germany) was used for quantifying autophagy.
Cells were seeded in 6 cm dishes, being careful that cells were confluent when harvesting.
The supernatant from each sample was transferred to a 15 mL tube, cells were rinsed with PBS
and trypsinized with 1 mL trypsin-EDTA and taken up in 1 mL fresh medium, which was transferred
to a 15 mL tube for centrifugation (1000 rpm, 5 min). The pellet was resuspended in 2 mL PBS, washed
again in PBS and resuspended in 0.25 mL DMEM with 5% FBS without phenol red and 0.25 mL diluted
Cyto-ID solution was added to each sample. After resuspension, the samples were incubated 30 min
at 37 ◦ C in the dark. After centrifugation (1500 rpm, 5 min), the supernatant was discarded and
the pellet was resuspended in 1 mL assay buffer. Samples were centrifuged (1500 rpm, 5 min) and
resuspended in 0.5 mL assay buffer and transferred into FACS tubes. FACS Canto was employed for
the measurement. The data were analysed using the BD FACSDiva software.
5.9. The γH2AX Foci Assay
For measuring DSBs, the γH2AX foci assay was employed. The cells were seeded in 6 cm dishes
in plates containing sterile cover slips. When harvesting, the medium was discarded, the samples were
washed twice with PBS and cells were fixed in ice cold methanol:aceton (7:3 stored at −20 ◦ C), kept on
4 ◦ C for exactly 9 min. The fixation solution was removed, samples were rinsed three times with PBS
and 2 mL PBS was added to each dish to keep the cover slips wet. The cover slip was put into a 3 cm
dish (the cells side up), blocked with blocking buffer (5% BSA in PBS with 0.3% Triton X-100) for 1 h,
the other cover slip was stored at 4 ◦ C as a backup. The blocking buffer was removed, 50 µl of γH2AX
antibody (Cell Signaling; Cat. No. 9718s) (1:1.000 dilution of γH2AX in PBS with 0.3% Triton X-100)
was added on the cover slip for overnight incubation at 4 ◦ C. After 3 times PBS washing, 50 µL of the
secondary antibody (Alexa Fluor® 488, rabbit green, 1:500 of Alexa Fluor® 488 in PBS with 0.3% Triton
X-100) was added to the cells on the cover slip and incubated at room temperature in the dark for 2 h,
followed by three times washing with PBS. The secondary antibody (Alexa Fluor® 488) was from Life
Technologies, Carlsbad, USA. DAPI-Vectashield (Vector Laboratories, Burlingame, CA, USA) and the
solution (1.5 µL of 1 mg/mL DAPI was added in 1 mL Vectashield mounting medium, and vortexed
thoroughly) was prepared freshly for staining. 20 µL of the DAPI-Vectashield solution was dropped
on the center of one slide, the cover slip was put on the DAPI-Vectashield solution and sealed by nail
oil. The slides were kept in the dark at room temperature for 10 min to dry. The γH2AX foci numbers
were determined using the Metasystem finder version 3.1. Representative pictures of foci are shown in
Supplementary Materials, Figure S2.
5.10. Senescence Measurements with C12 FDG Staining
Premature senescence was determined using C12 FDG and flow cytometry quantification. In brief,
C12 FDG is a substrate of SA-β-galactosidase. Upon cleavage it produces a green fluorescence,
which can be detected by FACS. Bafilomycin A1 is an inhibitor of vacuolar type H+ -ATPase (V-ATPase).
It blocks lysosomal acidification and also increases the pH of lysosomes [55]. Bafilomycin A1Int. J. Mol. Sci. 2019, 20, 1562 17 of 20
(Sigma-Aldrich, Steinheim, Germany) was dissolved in DMSO at 0.1 mM stock solution and stored at
−20 ◦ C. The working concentration was 100 nM. C12 FDG (Sigma-Aldrich, Steinheim, Germany) was
dissolved in DMSO (20 mM stock solution) and stored at -20 ◦ C. The stock solution was diluted with
fresh medium to get a 2 mM working solution. Cells were seeded and treated 96 h before the assay
was performed. They were incubated with 100 nM bafilomycin A1 for 1 h and thereafter with 33 µM
C12 FDG for 2 h. All the procedures after C12 FDG incubation were operated avoiding light. The samples
were rinsed with PBS three times, 30s each, harvested with trypsin-EDTA and resuspended in serum
containing medium together with the cells in the supernatant. They were collected by centrifugation
at 4 ◦ C, 100–250 g, 5 min. The pellet was resuspended in 0.4–0.5 mL PBS (4◦ C) and cells (titer of about
1 × 10⁶ /mL) were measured in a FACS Canto II flow cytometer.
5.11. Statistical Analysis
If not clarified specifically, data points show the means of at least three independent experiments
and the standard deviation from mean as error bars. For comparison, two-way ANOVA was employed,
the calculated p-values are displayed: p-value < 0.05 *, p-value < 0.005 **, p-value < 0.001 ***,
p-value < 0.0001 ****. GraphPad Prism software was used for statistical analysis and graph plotting.
Supplementary Materials: Supplementary materials can be found at http://www.mdpi.com/1422-0067/20/7/
1562/s1.
Author Contributions: Conceptualization, B.K.; Funding, Y.H. and B.K.; Experimental design, Y.H. and B.K.;
Experimental performance, Y.H.; Data evaluation, Y.H. and B.K.; Figures and Statistics, Y.H.; Methodology, Y.H.
and B.K.; Supervision, B.K.; Writing primary draft results, Y.H.; Writing, review and editing, B.K.
Funding: This research was funded by the International PhD programme of the Institute of Molecular Biology,
University of Mainz, supported by the Boehringer Ingelheim Foundation. It was further supported by the
Deutsche Forschungsgemeinschaft (DFG KA724).
Acknowledgments: Yang He was affiliated with and supported by the International PhD programme on Gene
Regulation, Epigenetics and Genome Stability, Johannes Gutenberg-University of Mainz, Germany. The work was
financially supported by grants of the Deutsche Forschungsgemeinschaft to B.K. (DFG KA724). We gratefully
acknowledge assistance by G. Nagel and the valuable experimental advice and support by Wynand P. Roos.
Conflicts of Interest: The authors declare no conflict of interest. The funders had no role in the design of the
study; in the collection, analyses, or interpretation of data; in the writing of the manuscript, or in the decision to
publish the results.
References
1. Roos, W.P.; Thomas, A.D.; Kaina, B. DNA damage and the balance between survival and death in cancer
biology. Nat. Rev. Cancer 2016, 16, 20–33. [CrossRef] [PubMed]
2. Horvath, M.M.; Wang, X.; Resnick, M.A.; Bell, D.A. Divergent evolution of human p53 binding sites:
Cell cycle versus apoptosis. PLoS Genet. 2007, 3, e127. [CrossRef]
3. Vousden, K.H.; Prives, C. Blinded by the light: The growing complexity of p53. Cell 2009, 137, 413–431.
[CrossRef] [PubMed]
4. Oren, M. Decision making by p53: Life, death and cancer. Cell Death Differ. 2003, 10, 431–442. [CrossRef]
[PubMed]
5. Zhang, X.P.; Liu, F.; Cheng, Z.; Wang, W. Cell fate decision mediated by p53 pulses. Proc. Natl. Acad. Sci.
USA 2009, 106, 12245–12250. [CrossRef]
6. Zhang, X.P.; Liu, F.; Wang, W. Two-phase dynamics of p53 in the DNA damage response. Proc. Natl. Acad.
Sci. USA 2011, 108, 8990–8995. [CrossRef] [PubMed]
7. Christmann, M.; Kaina, B. Transcriptional regulation of human DNA repair genes following genotoxic stress:
Trigger mechanisms, inducible responses and genotoxic adaptation. Nucleic Acids Res. 2013, 41, 8403–8420.
[CrossRef]
8. Villano, J.L.; Seery, T.E.; Bressler, L.R. Temozolomide in malignant gliomas: Current use and future targets.
Cancer Chemother. Pharmacol. 2009, 64, 647–655. [CrossRef]
9. Beranek, D.T. Distribution of methyl and ethyl adducts following alkylation with monofunctional alkylating
agents. Mutat. Res. 1990, 231, 11–30. [CrossRef]You can also read