Spatial Variability of Beach Impact from Post-Tropical Cyclone Katia (2011) on Northern Ireland's North Coast - MDPI
←
→
Page content transcription
If your browser does not render page correctly, please read the page content below
water
Article
Spatial Variability of Beach Impact from Post-Tropical
Cyclone Katia (2011) on Northern Ireland’s
North Coast
Giorgio Anfuso 1, * , Carlos Loureiro 2,3 , Mohammed Taaouati 4 , Thomas Smyth 5
and Derek Jackson 6
 1   Department of Earth Sciences, Faculty of Marine and Environmental Sciences, University of Cádiz,
     Polígono del Río San Pedro s/n, 11510 Puerto Real, Spain
 2   Biological and Environmental Sciences, Faculty of Natural Sciences, University of Stirling, Stirling,
     Scotland FK9 4LA, UK; carlos.loureiro@stir.ac.uk
 3   Geological Sciences, School of Agricultural, Earth and Environmental Sciences,
     University of KwaZulu-Natal, Durban 4001, South Africa
 4   Department of Exact Sciences, National School of Architecture, Tetouan 93000, Morocco;
     mtaaouati@gmail.com
 5   Department of Biological and Geographical Sciences, School of Applied Sciences,
     University of Huddersfield, Huddersfield HD1 3DH, UK; T.AG.Smyth@hud.ac.uk
 6   School of Geography & Environmental Sciences, Ulster University, Coleraine, Co. Londonderry,
     Northern Ireland BT52 1SA, UK; d.jackson@ulster.ac.uk
 *   Correspondence: giorgio.anfuso@uca.es; Tel.: +34-956016167

 Received: 17 March 2020; Accepted: 9 May 2020; Published: 13 May 2020

 Abstract: In northern Europe, beach erosion, coastal flooding and associated damages to engineering
 structures are linked to mid-latitude storms that form through cyclogenesis and post-tropical cyclones,
 when a tropical cyclone moves north from its tropical origin. The present work analyses the
 hydrodynamic forcing and morphological changes observed at three beaches in the north coast of
 Northern Ireland (Magilligan, Portrush West’s southern and northern sectors, and Whiterocks), prior to,
 during, and immediately after post-tropical cyclone Katia. Katia was the second major hurricane of
 the active 2011 Atlantic hurricane season and impacted the British Isles on the 12–13 September 2011.
 During the Katia event, offshore wave buoys recorded values in excess of 5 m at the peak of the storm
 on the 13 September, but nearshore significant wave height ranged from 1 to 3 m, reflecting relevant
 wave energy dissipation across an extensive and shallow continental shelf. This was especially so
 at Magilligan, where widespread refraction and attenuation led to reduced shore-normal energy
 fluxes and very minor morphological changes. Morphological changes were restricted to upper beach
 erosion and flattening of the foreshore. Longshore transport was evident at Portrush West, with
 the northern sector experiencing erosion while the southern sector accreted, inducing a short-term
 rotational response in this embayment. In Whiterocks, berm erosion contributed to a general beach
 flattening and this resulted in an overall accretion due to sediment influx from the updrift western
 areas. Taking into account that the post-tropical cyclone Katia produced £100 m ($157 million,
 2011 USD) in damage in the United Kingdom alone, the results of the present study represent a
 contribution to the general database of post-tropical storm response on Northern European coastlines,
 informing coastal response prediction and damage mitigation.

 Keywords: wave energy; Hurricane Katia; longshore transport; dissipative

Water 2020, 12, 1380; doi:10.3390/w12051380                                           www.mdpi.com/journal/water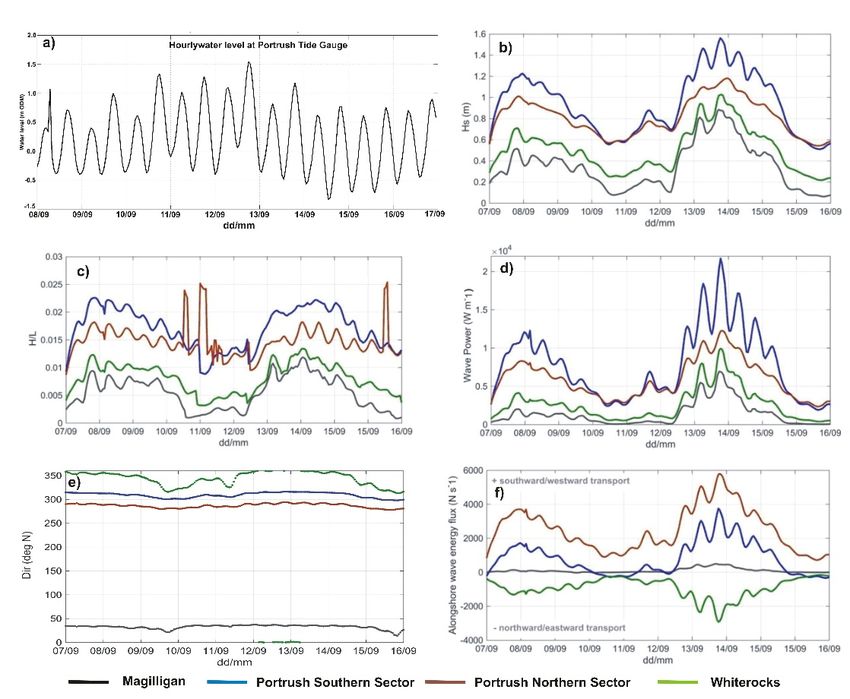
Water 2020, 12, 1380 2 of 17
Water 2020, 12, x 2 of 17
1. Preamble: Katia Cyclone Description
1. Preamble:Katia’s
Hurricane Katia Cyclone
formation Description
was instigated by a wide low-pressure system on the 28th of
August 2011, offshore of the
Hurricane Katia’s formation was western coast of Africa
instigated by a(Figure 1). The lowsystem
wide low-pressure pressureon thesystem28th moved
of
westward
August and, onoffshore
2011, 29 August, acquired
of the westernsufficient
coast of Africaconvective
(Figureintensity
1). The low to be designated
pressure systemasmoved a tropical
depression
westwardwhen and,it was
on 29located
August,about 695 sufficient
acquired km southwest of theintensity
convective south westernmost
to be designated Cape as Verde
a tropicalIslands
depression when it was accessed
(https://www.nhc.noaa.gov, located about
on 18695 Aprilkm2020).
southwest of the southmoved
The depression westernmost
to the Cape Verde
west-northwest
Islands
for the next 24 (https://www.nhc.noaa.gov,
h and gradually strengthened, accessed on 18 April
becoming 2020). storm
a tropical The depression
on 30 August moved aboutto the
787 km
southwest of the Cape Verde Islands. The cyclone maintained a west-northwest trajectory on
west-northwest for the next 24 h and gradually strengthened, becoming a tropical storm 30
at around
August about 787 km southwest of the Cape Verde Islands. The cyclone maintained a
27.8 km h−1 for the next two days and steadily strengthened to reach hurricane intensity on the
west-northwest trajectory at around 27.8 km h−1 for the next two days and steadily strengthened to
Saffir-Simpson Hurricane Wind Scale by 1 September when it was located about 2176 km east of the
reach hurricane intensity on the Saffir-Simpson Hurricane Wind Scale by 1 September when it was
Leeward Islands.
located aboutAfter
2176 achieving
km east of hurricane
the Leeward status, Katia
Islands. turned
After northwest
achieving and continued
hurricane status, Katia to turned
strengthen
and reached
northwest hurricane category
and continued to 4 status onand
strengthen 5 September with wind
reached hurricane peak intensity
category 4 status on of 5220 km h−1 and
September
a central
withlowwind pressure of 942of
peak intensity mb 220when
km hthe−1 andhurricane
a central waslow located
pressure about
of 942 870 km south
mb when of Bermuda.
the hurricane
Such was
extreme
locatedconditions
about 870 lasted
km south oneofday only and
Bermuda. Suchthe hurricane
extreme thenlasted
conditions slowed onedown
day only andand gradually
the
hurricane then slowed down and gradually turned north-east on
turned north-east on 9 September (Figure 1). After this, the wind field expanded and weakened. 9 September (Figure 1). After this,
Whenthe wind
Katia wasfield expanded
located aboutand 650 kmweakened.
northwest When Katia was itlocated
of Bermuda, turnedabouttoward 650thekmeast-northeast
northwest of and
Bermuda,
increased it turned
in speed, toward the east-northeast
to approximately and increased
92 km h−1 , arriving in speed,
over the to approximately
cold sea-surface 92 km h(22
temperatures
−1, ◦
C)
arriving over the cold sea-surface temperatures (22 °C) of the North Atlantic Ocean. The
of the North Atlantic Ocean. The combination of cold water and strong vertical wind shear favoured
combination of cold water and strong vertical wind shear favoured the quick transition from a
the quick transition from a hurricane status into a powerful post-tropical low-pressure system by 1200
hurricane status into a powerful post-tropical low-pressure system by 1200 UTC 10 September
UTC 10whenSeptember
it was locatedwhenaboutit was463located about 463 km
km south-southeast of south-southeast
Cape Race, Newfoundland. of Cape Race,
On 11Newfoundland.
September,
On 11Katia
September, Katia cyclone, a large and powerful post-tropical
cyclone, a large and powerful post-tropical storm, turned north-east towards storm, turned north-east
the northern towards
the northern British Isles with an average velocity of 85 km h −1 . The post-tropical cyclone reached the
British Isles with an average velocity of 85 km h . The post-tropical cyclone reached the northern
−1
northern
coastcoast of Scotland
of Scotland on 12on 12 September
September and produced
and produced sustained
sustained gale-forcegale-force windsmost
winds across acrossof most
the of
BritishIsles
the British Islesand
andhurricane-force
hurricane-force wind windgustsgustsininScotland,
Scotland, Northern
Northern Ireland,
Ireland,andandnorthern
northern England
England
with average
with average windwind speedspeedfromfrom
101101to to
188188 kmkmh−1 h−1 with
with peak
peak values
valuesofof212 212km kmh−1hrecorded
−1 recorded in North
in North
Wales. On the 13 September the cyclone continued north-eastward and dissipated over North
Wales. On the 13 September the cyclone continued north-eastward and dissipated over the the North
Sea. In Europe, the post-tropical cyclone Katia impacted numerous locations, downing trees,
Sea. In Europe, the post-tropical cyclone Katia impacted numerous locations, downing trees, bringing
bringing down power lines, and leaving thousands without electricity. In the United Kingdom the
down power lines, and leaving thousands without electricity. In the United Kingdom the storm was
storm was responsible for two deaths and caused approximately £100 m ($157 million 2011 USD) in
responsible
damagefor [1].two deaths and caused approximately £100 m ($157 million 2011 USD) in damage [1].
Figure 1. Track of Katia cyclone obtained from NOAA [1].
Figure 1. Track of Katia cyclone obtained from NOAA [1].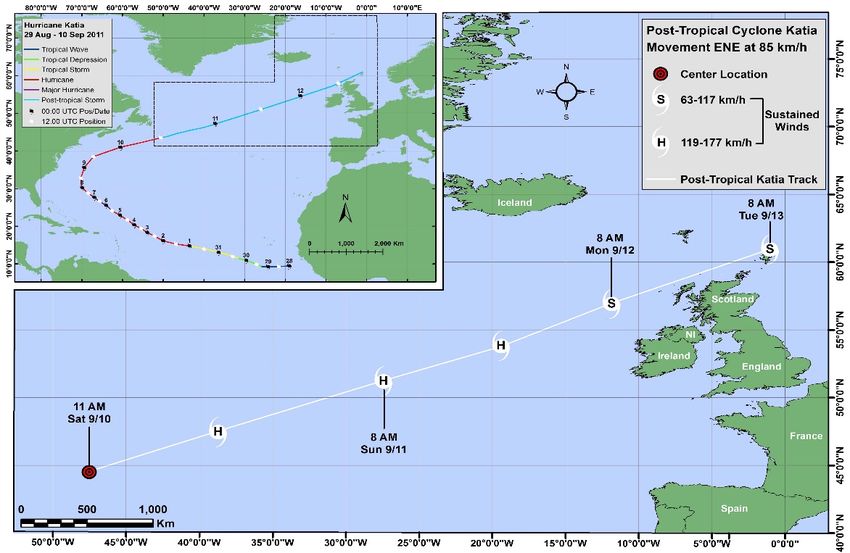
Water 2020, 12, 1380                                                                                 3 of 17

2. Introduction
     Coastal development continues to increase and some 50% of the world’s coastline is currently
under pressure from excessive development [2,3], mainly in the form of tourism, one of the world’s
largest industries [4,5]. In Europe, the rapid expansion of urban artificial surfaces in coastal zones
during the 1990–2000 period [6], has occurred in the Mediterranean and South Atlantic areas, namely
Portugal (34% increase) and Spain (18%), followed by France, Italy and Greece. Ireland, a more
peripheral holiday beach destination, has also had significant development of urban artificial surfaces
in the coastal zones. In Northern Ireland, in 2018, 2.8 million visitors and over 2 million Northern
Ireland residents took an overnight trip to the region, spending an unprecedented £968 million,
£42 million more compared with 2017 [7].
     Activities related with tourism can be significantly affected by the impacts of storms and hurricanes,
producing damages to recreational and protective structures, with associated reduction of beach width
and general aesthetics [8]. Over the past century, several storms and hurricanes have caused vast
economic loses along with large numbers of deaths along the world’s coastlines [9]. According to
Dolan and Davis [10], the most powerful storms that have struck the Atlantic coast of USA, occurred
on the 7–9 March 1962 (the “Ash Wednesday” storm), 7–11 March 1989, and on the 28 October–1
November 1991 (the “All Hallows’ Eve”).
     Morton and Sallenger [11] investigated hurricanes and tropical cyclones that impacted the Gulf
of Mexico and the Atlantic coast of USA, evaluating damages and washover penetration linked to
hurricanes Carla (1961), Camille (1969), Frederic (1979), Alicia (1983) and Hugo (1989). According to
Sallenger [12], the greatest coastal changes are recorded when the beach system completely submerges
in an inundation regime: it can take place locally on a barrier island, incising a new inlet, as happened
during Hurricane Isabel (2003) in North Carolina, Charley and Ivan in Florida (2004), and Katrina
(2005) in Alabama. Additionally, inundation can submerge tens of kilometres of coast as occurred on
the Bolivar Peninsula (TX, USA) during hurricane Ike (2008) and in Louisiana during Rita and Katrina
events in 2005.
     In northern Europe, damages to coastal structures, beach erosion and flooding inundation are
often associated with mid-latitude (or extratropical) storms that form through cyclogenesis in the
mid-latitude westerly wind belt and, secondly, post-tropical cyclones that form when a tropical cyclone
moves north from its tropical origin [13].
     In terms of the effects of mid-latitude storms, Bonazzi et al. [14] reconstructed spatial maps of
peak gust footprints for 135 of the most important damaging events in 15 European countries in the
past four decades, i.e., 1972–2010. The most important storms were 87J, Daria, Vivian, Anatol, Lothar,
Martin, Erwin/Gudrun, Kyrill, Emma, Klaus and Xynthia. They observed 64% of events used in
their analysis occurred during North Atlantic Oscillation positive phase (NAO+) months and their
inter-annual variability, described by the NAO, modulated the main orientation of the storm tracks
and the frequency of storm events.
     On the Atlantic edge of Europe, Anfuso et al. [15] characterized, using the Storm Power Index [10],
the distribution of storms in the Gulf of Cadiz during the 1958–2001 period and, highlighted particularly
stormy years, e.g., years characterized by more storms and extended storm durations. Rangel-Buitrago
and Anfuso [16] and Anfuso et al. [15] also observed the most powerful stormy years in Cadiz occurred
every 5–6 years (e.g., in 1995–1996, 2002–2003, 2009–2010) with a 7–8-year periodicity recorded by
Ferreira et al. [17] and Almeida et al. [18] in Faro (Southern Portugal).
     The energetic conditions recorded in the Cadiz Gulf area during the 1995–1996 period also
corresponded with similar weather conditions observed over the same period in Wales (UK) by
Phillips [19] and Phillips and Crisp [20]. Dodet et al. [21] highlighted a highly unusual sequence
of extratropical storms over the 2013–2014 winter period along Europe’s Northeast Atlantic region,
incorporating wave analysis over the period 2002–2017 for the northwest of Ireland, the Bay of Biscay
and west of Portugal and beach erosion/recovery in five beaches in SW England, Brittany and the Bay
of Biscay (France) that were surveyed on a monthly basis for more than 10 years. That winter recorded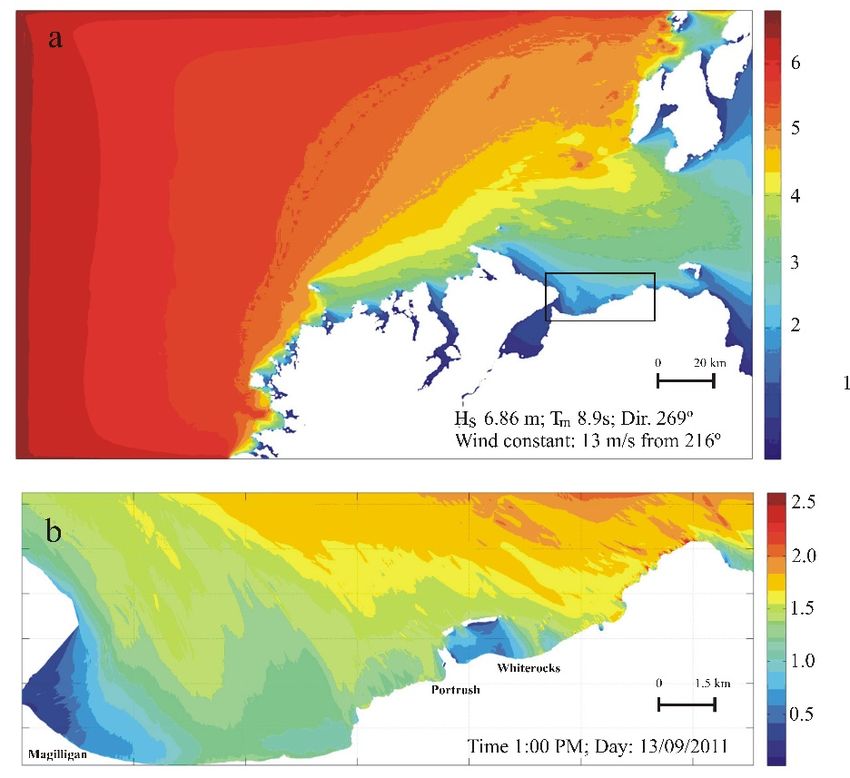
Water 2020, 12, 1380 4 of 17
the most energetic conditions along the Atlantic coast of Europe since at least 1948 [22] resulting in
most of western Europe’ coastlines being severely impacted [23–25] albeit with the exception of beaches
in NW Northern Ireland (this field site).
Santos et al. [26] examined waves around UK that exceeded the 1 in 1-year return level analysed
from 18 different buoy records for the period from 2002 to mid-2016, de-clustered into 92 distinct storm
events. The majority of events were observed between November and March, with large inter-annual
differences in the number of events per season associated with the West Europe Pressure Anomaly.
The 2013/2014 storm season represented an outlier in terms of the number of wave events, their
temporal clustering and return levels.
The strength and position of extratropical cyclones is influenced largely by the pattern of
atmospheric circulations over the North Atlantic Basin, which, in turn, are reflected in the signal and
strength of the North Atlantic Oscillation Index [27]. However, Atlantic tropical cyclones that move
northward from the tropics and undergo extratropical transition may also cause high-impact weather
events in Western Europe [28]. Tropical cyclones generated in the Atlantic basin drift westward at
tropical latitudes within the easterly Trade winds, and migrate northward affecting the east coast
of the US. Usually once every 1–2 years, these cyclones move eastward undergoing extratropical
transition and reach western Europe as post-tropical storms often with hurricane force-winds [29].
In Northwest Ireland, the earliest reported high-magnitude event was the ‘Night of the Big Wind’,
which was probably the tail-end of a hurricane reported in January 1839. Cooper and Orford [30]
described the occurrence and impacts of post-tropical cyclones on the British Isles using historical and
contemporary information. Examining the period between 1922 and 1998, they identified nine major
tropical cyclones that traversed the Atlantic and impacted the British Isles. MacClenahan et al. [31]
identified Hurricane Debbie (September 1961) as the largest storm that impacted Ireland during the
second half of the 20th Century. Recently, Guisado-Pintado and Jackson [32,33] described the effects of
the post-tropical Storm Ophelia (2018) and Storm Hector (2019) in Ireland’s NW Donegal coast.
The post-tropical cyclone Katia impacted the British Isles during the 12–13 September 2011 causing
£100 m ($157 million, 2011 USD) in damage. The present work analyses what, if any, morphological
changes occurred during the Katia cyclone in three beaches in the north coast of Northern Ireland,
taking into account that storm-induced waves persisted until the 15 September, a couple of days after
the cyclone dissipation. The importance of the present study lies in the necessity of understanding and
predicting morphological changes associated with the impacts of hurricanes and intense post-tropical
storms that, while infrequent, can sometimes have significant impacts on exposed coastal areas of the
British Isles and cause relevant economic losses [30]. The behaviour of these coastal systems can be
greatly affected in the future due to observed and modelled changes in frequency and intensity of
extreme storms, and particularly the poleward migration of the maximum intensity of tropical cyclones
as a result of global climate changes [34]. There is also concern that a possible change in hurricane
tracks could lead to such destructive events impacting more frequently Southern European coasts,
resulting in potentially more dramatic responses [35,36]. The results of the present study contributes
to our understanding of beach and coastal response to post-tropical storm events along the coast of
Northern Ireland and adds information to the general database of storm response on coastlines of this
nature, informing damage mitigation and coastal response prediction.
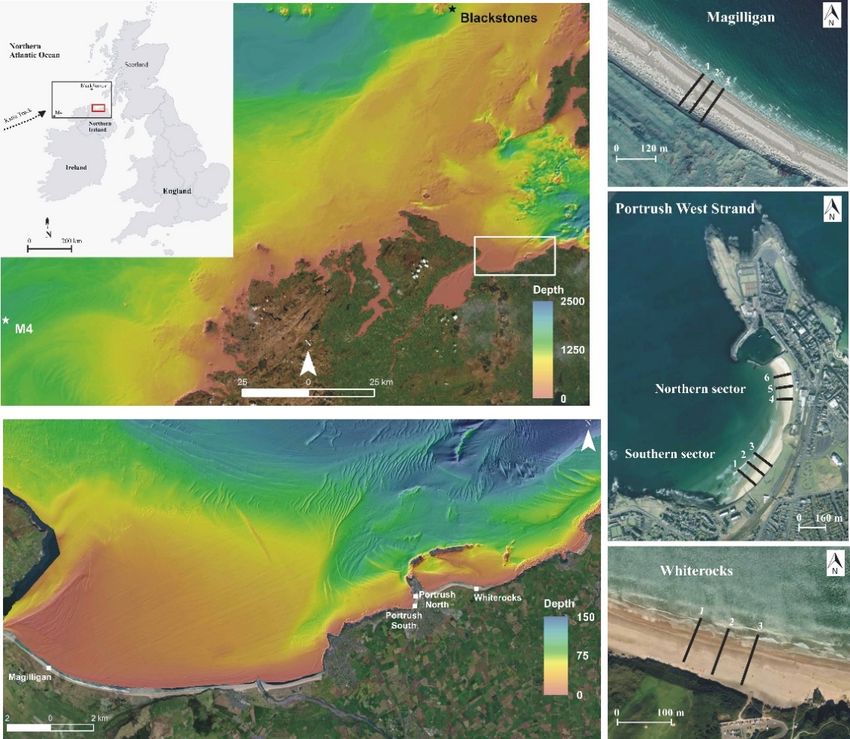
3. Study Area
This paper examines the morphological change in three sandy beach sites, Magilligan Strand,
Portrush (West Strand) and Whiterocks (eastern section of Curran Strand) (Figure 1, Table 1).
These beaches are located on a high wave energy, microtidal, 20 km section of Northern Ireland’s
northern coastline [37,38]. Magilligan Strand, the most westerly beach studied, is part of a 10 km long,
dissipative beach that stretches from Magilligan Point in the west to Downhill in the east. The area
of beach monitored at Magilligan has been accreting since 1980 [39] and is backed by large dunes,
approximately 10 m in height, which are densely vegetated with Ammophila arenaria.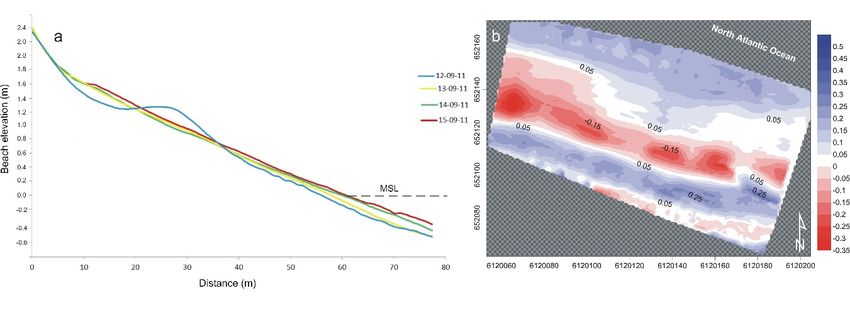
Water 2020, 12, 1380                                                                                                      5 of 17

                                    Table 1. Main attributes of selected sites.

        Site Name      Sand Grain   Beach Slope   Tidal Range
                                                                 Beach Type              Local Geomorphology
         Location      Size (mm)      (tan β)         (m)
                                                                Intermediate to    Extensive dune systems, tidal inlet,
        Magilligan        0.17        0.0375          1.6
                                                                  dissipative               sand ridge plain
         Portrush                                                                 Modified dunes, human modification
                         0.186        0.0320          1.5         Dissipative
         northern                                                                      (sea wall) along coastline
        Whiterocks       0.197        0.0352          1.5        Intermediate     Extensive dune system behind beach

     West Strand (Portrush) is an 850 m long, concave shaped beach bounded by basalt headlands to
the northeast and southwest. Two sectors have been investigated within this pocket beach, one at the
northern and one at the southern part and respectively noted as ‘Portrush southern’ and ‘Portrush
northern’ sectors. The beach has undergone significant development beginning in 1825 when a jettied
harbour was constructed against the north eastern headland [40]. In the 1960s, a promenade and car
park were constructed on the dune complex behind the beach and a recurved seawall constructed on
the back beach replaced the natural foredune. This development resulted in significant lowering of the
beach surface elevation [41].
     Whiterocks beach is located at the easternmost extremity of Curran Strand and is the most easterly
study site investigated. Curran Strand is a 3 km long beach constrained by a basalt headland to the
west and chalk cliffs to the east. The beach is convex in shape due to the sheltering effect of the Skerries
islands located approximately 1.5 km offshore, however wave refraction around the islands produces
high energy waves at the eastern extremity of the beach. The section of beach monitored at Whiterocks
is backed by chalk boulders and a single steep vegetated foredune ranging from 6–25 m in height
behind which a golf course has been constructed.
     High-resolution multibeam bathymetric data for this coastline, collected in the framework of
the Joint Irish Bathymetric Survey completed in September 2008, demonstrates an irregular and
dynamic configuration of the continental shelf and shoreface of the North Coast of Northern Ireland,
with tidal banks and sand waves indicating complex flow patterns and active sediment transport
pathways (Figure 2). The substratum of the shelf and shoreface of this coastal area is predominantly
composed of fine to medium sand sediments, with most exposed bedrock and stony outcrops close to
the shore [42]. A wide and relatively flat shoreface extends for over 6 km with depths of less than 15 m
offshore Magilligan beach, flanked by the Tuns Bank, a large ebb-delta associated with the Foyle River.
The shoreface of Portrush beach is much narrower and steep, with a relatively linear configuration and
reaching depths in excess of 18 m approximately 1.2 km seaward of the beach. The offshore shelf and
shoreface at Whiterocks presents a complex configuration, influenced by the presence of the Skerries
islands and their influence on wave, tidal and sediment transport fluxes. The most exposed section
of Whiterocks shoreface is relatively similar to Portrush beach, reaching depths in excess of 20 m
approximately 2 km seaward of the beach.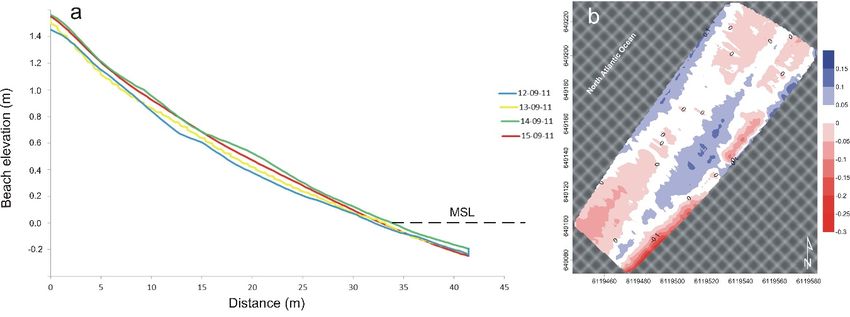
Water 2020, 12, 1380 6 of 17
Water 2020, 12, x 6 of 17
Figure 2. Location map with used grid for wave propagation and offshore buoys.
Figure 2. Location map with used grid for wave propagation and offshore buoys.
4. Methodology Table 1. Main attributes of selected sites.
SiteAName Sand Grainprogram
beach monitoring Beach Slope Tidal to investigate the impacts of storm Katia by
was undertaken
Beach Type Local Geomorphology
surveying beach morphology before, during and after(m)
Location Size (mm) (tan β) Range the storm. Surveys were conducted at Magilligan
Intermediate Extensive dune systems, tidal inlet,
from 7 to 14 September
Magilligan 0.17 2011 while0.0375
surveys at Portrush
1.6 West Strand (at two sectors) and at Whiterocks
to dissipative sand ridge plain
beach took place between the 12 and 15 September 2011. Beach morphological changes Modified were
dunes,determined
human
Portrush
through topographic 0.186surveys extending
0.0320 from the 1.5back beach to low water
Dissipative level using
modification (seaawall)
differential
along
northern
GPS (Trimble 4400) with 1–3 cm accuracy. Survey data were used to quantify the impact coastline of Katia on
Whiterocks 0.197
beach morphology and volumetric0.0352
changes at each1.5sector. Cross-shore
Intermediate Extensive dune system behind beach
profiles were also extracted and
their vertical morphological variability analysed to identify the main active zones [43,44].
4. Methodology
Morphological and volumetric variations were compared with nearshore wave forcing to assess
the process-response
A beach monitoring relationships
programinwas the monitored
undertakenbeaches, using the
to investigate thenearshore
impacts wave power,
of storm wave
Katia by
steepness and alongshore wave energy flux. These parameters
surveying beach morphology before, during and after the storm. Surveys were conducted at have been extensively used for
exploring
Magilliganmorphological changes in
from 7 to 14 September wave-dominated
2011 while surveys beaches
at PortrushandWest
found to be(at
Strand relevant indicators
two sectors) and
to
at understand
Whiterocks beach beacherosion and accretion
took place between [45].
the 12 Here,
andwe15computed
September wave
2011.forcing
Beachindicators based
morphological
on shallow
changes werewater wave parameters
determined obtained from
through topographic high-resolution
surveys extending fromnearshore wave
the back modelling
beach using
to low water
SWAN [46,47].
level using SWAN was GPS
a differential implemented
(Trimble using
4400)awith
nested modelling
1–3 scheme
cm accuracy. and forced
Survey data in the western
were used to
and northern
quantify the boundaries
impact of Katia with observed
on beachwave parameters
morphology andmeasured at the
volumetric M4 offshore
changes at each buoy (55◦
sector.
N, 10◦ W), maintained
Cross-shore profiles were by the
alsoIrish Marineand
extracted Institute, and themorphological
their vertical Blackstones buoy (56◦ 03’ N,
variability 7◦ 03’ W)
analysed to
operated
identify the by main
CEFAS (Figure
active 2). [43,44].
zones Waves were initially propagated over a large-scale computational grid
with Morphological
a resolution of 250 andmvolumetric
and using the 2018 EMODnet
variations bathymetry
were compared dataset
with [48] that
nearshore extended
wave forcingfrom
to
the buoy
assess thelocations all the wayrelationships
process-response into the north incoast region (Figures
the monitored 2 andusing
beaches, 3a), inthe
order to obtain
nearshore the
wave
boundary
power, wave conditions
steepnessfor and
a finer resolutionwave
alongshore run focused
energyon theThese
flux. study parameters
area (Figureshave2 and 3b).extensively
been The model
was
usedrunfor with an hourly
exploring timestep from
morphological 00:00in
changes onwave-dominated
the 7 September beaches
2011 to 23:00 on the to
and found 16 be
September
relevant
2011. The nested
indicators nearshorebeach
to understand wave erosion
runs were performed
and accretionusing[45]. aHere,
5 m high-resolution
we computedcomputational
wave forcing
indicators based on shallow water wave parameters obtained from high-resolution nearshore wave
modelling using SWAN [46,47]. SWAN was implemented using a nested modelling scheme and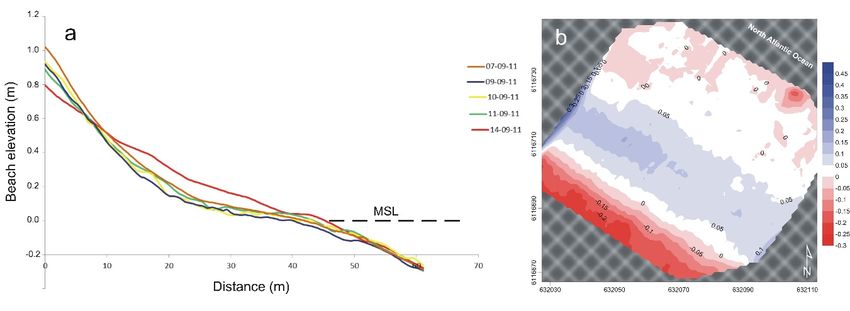
Wave conditions differed significantly between the offshore location where the wave records
were obtained in the western coasts of Ireland and Scotland, and the nearshore areas adjacent to the
monitored sites on the north coast of Northern Ireland (Figure 3).
Storm waves generated by the Katia post-tropical cyclone lasted until the 15 September, two
days
Water after
2020, the cyclone dissipated. Significant wave heights ranged from 1 to 3 m in the nearshore
12, 1380 7 of 17
region, while offshore the wave buoys recorded values in excess of 5 m at the peak of the storm on
13 September 2011. Significant wave attenuation across the wide and irregular shelf and shoreface
domain, implemented
of Northern Ireland iswith a detailed
evident from thebathymetric
exposed open gridocean
based on JIBS of
locations multibeam
the buoysdataset for the
to the relatively
North Coast (Figure 2). The nearshore runs were performed for the exact same time
sheltered north coast area (Figures 2 and 3a,b). Considering in higher detail the variability within period indicated
above, usingcoast
the north wavehighspectra obtainedgrid
resolution from the large-scale
(Figure 3b), it isrun. The nested
observed runs considered
that wave heights also variable
change
water levels obtained from the hourly records of Portrush Tide Gauge. SWAN
significantly between the western, more protected area, towards the eastern more exposed one. was implemented
inWater
third levels
generation,
recorded2D during
stationary mode,atusing
the storm a JONSWAP
Portrush’s spectral
tidal gauge and shape to represent
modelled the wave
wave characteristics
field, directional discretization in regularinclasses ◦
of4.5 Maximum
and frequency
in each investigated site are presented Figure waterdiscretization in 33 logarithmic
levels were recorded on the 13
distributed
September 2011 (Figure 4a), with a storm surge effect ranging between 0.2 and 0.5etmal.
classes between 1 and 0.03 Hz. Following Loureiro et al. [49] and Matias [50], SWAN
induced by the
runs
lowused default parameters
atmospheric for wave
pressure during the growth,
passage whitecapping
of the storm on dissipation, depth-induced
the 13 September. Nearshorebreaking
wave
according to the β-kd model for surf-breaking [51], triad and quadruplet
heights, even during the most energetic period of the storm, recorded between the 13 and 14 wave-wave interactions.
Outputs
September fromand SWAN provided
shown wave conditions
in Figures 3 and 4b, forare the nearshore
relatively low,area in eachfrom
ranging survey site, extracted
around 0.8 m in
for a single point in front of the
Magilligan to around 1.6 m in Portrush. beach in 4 to 5 m water depth.
Figure3. 3.Modeled
Figure Modeledwave
waveheights
heights(m)
(m)for
forpeak
peakoffshore
offshorestorm
stormconditions
conditions(a)(a)and
andnearshore
nearshorewave
wave
heights
heights(m)
(m)(b) during
(b) above
during offshore
above wave
offshore conditions.
wave conditions.
Based on SWAN
This pattern outputs, wave
is confirmed forcing
by the indicators
comparison fortime
of the analyzing
series process-response relationships
for the different sites of interest;
were computed assuming the shallow water approximations for linear wave
wave heights during storm Katia were not considerably high, having undergone significant theory following
Komar [52]. and
attenuation Wave power (Pas
dissipation s ) they
provides an indication
propagated throughofthe
theshallow
rate atandwhich energyshelf
irregular is transferred
of the north
bycoast
moving waves and
of Ireland. Thisis is
widely recognized
particularly as an important
noticeable parameter
for Magilligan, for exploring
fronted by a wide wave-induced
and shallow
morphological
shoreface, and change in sandypartially
Whiterocks, beaches protected
(e.g., [45,52]). Wave
by the power was
Skerries computed
islands, while according
the more to:exposed
Northern and Southern sectors of Portrush experienced more energetic conditions. Wave steepness
Ps = ECg (1)
where E is wave energy, computed according to:
E = (1/8) ρ g Hs 2 (2)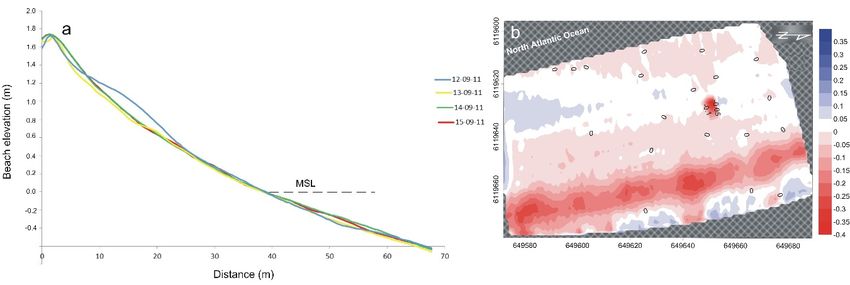
Water 2020, 12, 1380                                                                                8 of 17

where ρ is water density (1025 kg/m3 ), g gravitational acceleration (9.81 m/s) and Hs is nearshore wave
height. Wave group velocity (Cg ), was also obtained using the shallow water approximation:
                                                      √
                                               Cg =       gh                                           (3)

where h is the water depth. Wave steepness (Ls ) was determined according to:
                                                       √
                                              Ls = T       gh                                          (4)

where T is the nearshore wave period.
     Recognizing the importance of wave direction in combination with wave energy in driving
longshore sediment transport and alongshore variable morphological changes during energetic
conditions, particularly along indented or embayed coastlines (e.g., [45,53]), the alongshore component
of the wave energy flux was also computed according to Komar’s [52] approximation, given by:

                                          Pl = Ps sin αb cos αb                                        (5)

where αb is the wave breaking angle, determined according to the nearshore wave direction and
beach orientation.
     Wave steepness, obtained from the ratio of wave height (Hs ) with wave length (Ls ) was also
computed for analyzing process-response relationships, considering the established association among
high steepness waves (H/L > 0.02), offshore sediment transport and beach erosion in contrast to
low steepness waves (H/L < 0.02), that are associated with onshore sediment transport and beach
accretion [54].

5. Results

5.1. Wave Energy Spatial and Temporal Distribution
      Wave conditions differed significantly between the offshore location where the wave records
were obtained in the western coasts of Ireland and Scotland, and the nearshore areas adjacent to the
monitored sites on the north coast of Northern Ireland (Figure 3).
      Storm waves generated by the Katia post-tropical cyclone lasted until the 15 September, two days
after the cyclone dissipated. Significant wave heights ranged from 1 to 3 m in the nearshore region, while
offshore the wave buoys recorded values in excess of 5 m at the peak of the storm on 13 September 2011.
Significant wave attenuation across the wide and irregular shelf and shoreface of Northern Ireland is
evident from the exposed open ocean locations of the buoys to the relatively sheltered north coast area
(Figures 2 and 3a,b). Considering in higher detail the variability within the north coast high resolution
grid (Figure 3b), it is observed that wave heights also change significantly between the western, more
protected area, towards the eastern more exposed one. Water levels recorded during the storm at
Portrush’s tidal gauge and modelled wave characteristics in each investigated site are presented in
Figure 4. Maximum water levels were recorded on the 13 September 2011 (Figure 4a), with a storm
surge effect ranging between 0.2 and 0.5 m induced by the low atmospheric pressure during the passage
of the storm on the 13 September. Nearshore wave heights, even during the most energetic period of
the storm, recorded between the 13 and 14 September and shown in Figures 3 and 4b, are relatively low,
ranging from around 0.8 m in Magilligan to around 1.6 m in Portrush.
water level during the most energetic wave conditions. The influence of wave direction on
morphological changes experienced in the four beaches during the storm, explored through the
angle of approach and alongshore wave energy flux, indicate that relevant southward fluxes were
experienced in the more exposed Portrush Northern and Southern sectors, while at Whiterocks
alongshore fluxes were easterly directed. In Magilligan, waves arrived fully refracted and shore
Water 12, 1380 negligible alongshore wave energy fluxes (Figure 4e,f).
2020, inducing
normal, 9 of 17
Figure
Figure 4. Waterlevels
4. Water levels(a)(a)at at
thethe Portrush
Portrush tide tide gauge
gauge were were reported
reported as values
as values above Ordnance
above Ordnance
Datum Malin
Datum Malin (equivalent
(equivalenttoto Mean
Mean SeaSea
Level). Wave
Level). height
Wave (b), wave
height (b), steepness (c), wave(c),
wave steepness power (d),
wave power (d),
wave direction (e) and alongshore wave energy flux (f) at different investigated
wave direction (e) and alongshore wave energy flux (f) at different investigated sites. sites.
This pattern is confirmed by the comparison of the time series for the different sites of interest;
wave heights during storm Katia were not considerably high, having undergone significant attenuation
and dissipation as they propagated through the shallow and irregular shelf of the north coast of Ireland.
This is particularly noticeable for Magilligan, fronted by a wide and shallow shoreface, and Whiterocks,
partially protected by the Skerries islands, while the more exposed Northern and Southern sectors
of Portrush experienced more energetic conditions. Wave steepness (Figure 4c) displays significant
spatial variability, while temporal changes largely reflected the variation in wave height during the
surveyed period (Figure 4b). Lowest values were recorded in the most sheltered location, Magilligan,
where the steepness ranged from ca. 0.002, during less energetic conditions (i.e., 11–12 September) to
ca. 0.007 during more energetic conditions (i.e., 8–10 and 13–15 September periods). Steeper waves
were observed at Portrush southern sector (Figure 4c), with values of ca. 0.015 and 0.025 for less and
more energetic conditions, respectively. Such an increase in wave steepness, on the order of 0.05,
from lower to moderate steepness conditions, was also observed in the other study sites (Figure 4c).
Spatial and temporal variability in wave power also reflected the changes in nearshore wave
height, with distinct differences recorded among the different surveyed locations. The lowest values
were observed at Magilligan whilst the highest were found at Portrush southern sector (Figure 4d).
The dependence of nearshore wave power on water depth is particularly evident in Portrush southern
sector, with clear temporal variation associated with the tide-induced changes in water level during
the most energetic wave conditions. The influence of wave direction on morphological changes
experienced in the four beaches during the storm, explored through the angle of approach and
alongshore wave energy flux, indicate that relevant southward fluxes were experienced in theWater 2020, 12, x 10 of 17
Water 2020, 12, 1380 10 of 17
5.2. Morphological and Volumetric Beach Changes
more 5.2.1. Magilligan
exposed Portrush Northern and Southern sectors, while at Whiterocks alongshore fluxes were
easterly directed.
During theIn 7–10
Magilligan,
September waves
2011,arrived fully
the beach refracted
showed and
limited shore normal,
elevation changes inducing negligible
(on the order of
alongshore wave
5–10 cm), energy
which werefluxes
largely(Figure 4e,f).
uniform along both the cross-shore, i.e., along the dry beach and the
foreshore and the longshore direction (Figure 5a). Volumetric variation indicates some general
5.2. Morphological
beach erosionand Volumetric
(Table 2). The Beach
surveyChanges
carried out on the 14th, i.e., after the most energetic waves
impacted the beach (Figure 4b,d), showed longshore uniform erosion in the dry beach, with vertical
5.2.1. erosion
Magilligan
of ca. 10 cm, and an equivalent accretion at the central part of the beach according to a
beach pivoting
During the 7–10 mechanism.
September Volumetric
2011, thechanges reflected alimited
beach showed general,elevation
very small, accretion
changes (Figure
(on 5b, of
the order
Table 2), with an alongshore uniform pattern consistent with the shore normal waves that impacted
5–10 cm), which were largely uniform along both the cross-shore, i.e., along the dry beach and the
this beach during the storm (Figure 4e,f).
foreshore and the longshore direction (Figure 5a). Volumetric variation indicates some general beach
erosion (Table 2).2.The
Table surveyvariation
Volumetric carried(mout on thesurveys
3) between 14th, and
i.e.,atafter theofmost
the end energetic
the monitoring waves impacted
program.
the beach (Figure 4b,d), showed longshore uniform erosion in the dry beach, with vertical erosion of
Location/Date 7 to 9 September 9 to 10 10 to 11 11 to 14 Whole Period 7th to 14th
ca. 10 cm, and an equivalent accretion
Magilligan −184.3
at the central
+82.9
part
+20.7
of the+50.9
beach according to a beach pivoting
+64.4
mechanism.Location/date
Volumetric changes reflected a general, very
12 to 13 September 13 to 14 14 to 15 small, accretion
- (Figure 5b,
Whole Period 12th Table 2), with an
to 15th
alongshore uniform pattern consistent with the shore normal waves that impacted this beach during
Portrush southern −1.1 +512.3 −226.9 - +123.9
Portrush northern −432.6 +253.5 +9.5 - −233.3
the storm (Figure 4e,f).
Whiterocks +316.5 +158.6 +109.2 - +623.2
Figure
Figure 5. Profile
5. (a) (a) Profile 2 evolutionand
2 evolution and(b)
(b)3D
3D morphological
morphological changes
changesat at
Magilligan.
Magilligan.
2. Volumetric variation 3
Table
5.2.2. Portrush, Southern Sector (m ) between surveys and at the end of the monitoring program.
During the initial 7phases
Location/Date of the storm,
to 9 September 9 tothe
10 beach presented
10 to 11 11very
to 14 small morphological
Whole and
Period 7th to 14th
volumetric changes (Figure−184.3
Magilligan 6 and Table 2) with+82.9 a shore+20.7
normal directed
+50.9 energy flux +64.4
(Figure 4f). A
uniform accretion along
Location/date 12 tothe cross-shore profile
13 September 13 to 14 of ca.1410 cm was recorded
to 15 - on the
Whole 14 12th
Period September
to 15th
(Figure 6a) and
Portrush southerncorresponded with
−1.1 a volumetric
+512.3 increase of
−226.9 512.3 m 3 (Table 2). This was linked to
- +123.9
thePortrush
sediment supply from −432.6
northern +253.5 sector+9.5
the Portrush northern due to northerly- approaching waves that
−233.3
Whiterocks +316.5 +158.6 +109.2 +623.2
induced a southward directed flux (Figure 4f). During the last stages -of the storm, approximately 5
cm of vertical erosion was observed in different parts of the profile, especially in the central and
5.2.2. lower
Portrush,
partsSouthern
(Figure 6aSector
and Table 2) probably due to the reduction of sediment inputs availability
from the northern sector. Overall, from the 12 to 15 September, the beach presented a vertical
During the initial phases of the storm, the beach presented very small morphological and
accretion of 10–15 cm especially in the central-upper part (Figure 6b) associated with a volumetric
volumetric
accretionchanges
of 123.9(Figure 6 and
m3, likely dueTable 2) withsupplied
to sediment a shore fromnormalthe directed
northern energy fluxrecorded
sector that (Figure 4f).
A uniform
erosionaccretion
(Figure 7).along the cross-shore
The uppermost part ofprofile
the beach of ca. 10 cm
showed was recorded
different behavior,on
as the 14 September
its dynamic is
(Figure 6a) and
strongly corresponded
affected by a backing with a volumetric
concave increase of 512.3 m3 (Table 2). This was linked to
concrete seawall.
the sediment supply from the Portrush northern sector due to northerly approaching waves that
induced a southward directed flux (Figure 4f). During the last stages of the storm, approximately
5 cm of vertical erosion was observed in different parts of the profile, especially in the central and
lower parts (Figure 6a and Table 2) probably due to the reduction of sediment inputs availability from
the northern sector. Overall, from the 12 to 15 September, the beach presented a vertical accretion of
10–15 cm especially in the central-upper part (Figure 6b) associated with a volumetric accretion of
123.9 m3 , likely due to sediment supplied from the northern sector that recorded erosion (Figure 7).Water 2020, 12, 1380 11 of 17
The uppermost part of the beach showed different behavior, as its dynamic is strongly affected by a
backing concave concrete seawall.
Water 2020, 12, x 11 of 17
Figure 6. (a) Profile 2 evolution and (b) 3D morphological changes at Portrush Southern Sector.
5.2.3. Portrush, Northern Sector
The main morphological and volumetric changes were recorded in the first stages of the storm,
i.e., on the 13th September (Figure 7a and Table 2). A well-developed berm, 20–30 cm in height
present along the whole sector investigated, was completely eroded with a sediment loss of
approximately 432.6 m3 (Table 2). The berm was essentially transported southward to feed the
southern sector of this pocket beach and, to a lesser extent, the middle and lower part of the profile
(Figure 7a). This is the result of a relevant (2000 N/s) southward directed wave energy flux, forced
by northerly approaching waves observed during that period (Figure 4e,f). In the following surveys
only very small changes, of few centimetres, were observed. Overall, the beach recorded 30–35 cm
of vertical erosion (Figure 7a,b) along the upper part, through the erosion of the berm, which
corresponded
6. (a)to
FigureFigure a volumetric
6.Profile
(a) Profile change
2 evolution
2 evolution and of
and −233.3
(b)
(b) 3D m3 (Table 2). changes
3Dmorphological
morphological changesatatPortrush
PortrushSouthern Sector.
Southern Sector.
5.2.3. Portrush, Northern Sector
The main morphological and volumetric changes were recorded in the first stages of the storm,
i.e., on the 13th September (Figure 7a and Table 2). A well-developed berm, 20–30 cm in height
present along the whole sector investigated, was completely eroded with a sediment loss of
approximately 432.6 m3 (Table 2). The berm was essentially transported southward to feed the
southern sector of this pocket beach and, to a lesser extent, the middle and lower part of the profile
(Figure 7a). This is the result of a relevant (2000 N/s) southward directed wave energy flux, forced
by northerly approaching waves observed during that period (Figure 4e,f). In the following surveys
only very small changes, of few centimetres, were observed. Overall, the beach recorded 30–35 cm
of vertical erosion (Figure 7a,b) along the upper part, through the erosion of the berm, which
corresponded to a volumetric change of −233.3 m3 (Table 2).
FigureFigure
7. (a)7.Profile
(a) Profile 2 evolution
2 evolution and(b)
and (b)3D
3Dmorphological
morphological changes
changesat at
Portrush Northern
Portrush Sector.
Northern Sector.
5.2.3. 5.2.4.
Portrush, Northern Sector
Whiterocks
Prior to
The main the storm, the and
morphological beachvolumetric
presented achanges
well-developed berm, ca.in
were recorded 30–40 cm instages
the first heightof(Figure
the storm,
i.e., on the 13th September (Figure 7a and Table 2). A well-developed berm, 20–30 cm changes
8a). During the first stages of the storm, on the 13 September, relevant morphological in heighttook
present
place linked to the erosion of the berm and the landward and seaward transport
along the whole sector investigated, was completely eroded with a sediment loss of approximately of the eroded sand
according to a process of beach flattening—but no net erosion was recorded (Table 2), this
432.6 m3 (Table 2). The berm was essentially transported southward to feed the southern sector of this
indicating a supply of sediments from the western part of Curran strand driven by eastward
pocket beach and, to a lesser extent, the middle and lower part of the profile (Figure 7a). This is the
alongshore wave energy fluxes under low energy westerly approaching waves (Figure 4e,f). No
resultrelevant
of a relevant (2000 N/s)
morphological southward
changes directed
took place wave energy
in following days andflux, forced was
accretion by northerly approaching
recorded along all
wavesthe observed during that period (Figure 4e,f). In the following surveys only very
profile (Figure 8a and Table 2). Overall, at the end of the storm, the beach recorded a volumetric small changes, of
few centimetres, weremobserved.
accretion of 632.2 3 visible onOverall, the beach
the dry beach and atrecorded
the lower30–35 cm of
foreshore vertical
(Figure 8b).erosion (Figure 7a,b)
along the upper part,
Figure 7. (a)through the erosion
Profile 2 evolution and of
(b) the berm, whichchanges
3D morphological corresponded
at PortrushtoNorthern
a volumetric
Sector. change of
−233.3 m3 (Table 2).
5.2.4. Whiterocks
5.2.4. Whiterocks
Prior to the storm, the beach presented a well-developed berm, ca. 30–40 cm in height (Figure
8a). During
Prior the firstthe
to the storm, stages
beachof the storm, on
presented the 13 September,berm,
a well-developed relevant
ca. morphological changes
30–40 cm in height took 8a).
(Figure
place linked to the erosion of the berm and the landward and seaward transport of the eroded sand
During the first stages of the storm, on the 13 September, relevant morphological changes took place
according to a process of beach flattening—but no net erosion was recorded (Table 2), this
linked to the erosion of the berm and the landward and seaward transport of the eroded sand according
indicating a supply of sediments from the western part of Curran strand driven by eastward
to a process of beach flattening—but no net erosion was recorded (Table 2), this indicating a supply of
alongshore wave energy fluxes under low energy westerly approaching waves (Figure 4e,f). No
sediments from the western changes
relevant morphological part of Curran strand
took place driven by
in following eastward
days alongshore
and accretion wave energy
was recorded fluxes
along all
underthe
low energy
profile westerly
(Figure 8a andapproaching waves
Table 2). Overall, (Figure
at the end of 4e,f). No the
the storm, relevant morphological
beach recorded changes
a volumetric
took place in following
accretion of 632.2 mdays and
3 visible onaccretion wasand
the dry beach recorded alongforeshore
at the lower all the profile
(Figure(Figure
8b). 8a and Table 2).
Overall, at the end of the storm, the beach recorded a volumetric accretion of 632.2 m3 visible on the
dry beach and at the lower foreshore (Figure 8b).Water 2020, 12, 1380 12 of 17
Water 2020, 12, x 12 of 17
Figure 8. (a) Profile 2 evolution and (b) 3D morphological changes at Whiterocks.
Figure 8. (a) Profile 2 evolution and (b) 3D morphological changes at Whiterocks.
6. Discussion
6. Discussion
The Northern and Western coasts of Ireland are classified as high-energy coastlines and are often
The Northern and Western coasts of Ireland are classified as high-energy coastlines and are
affected by energetic storms and the tail-end of a small number of Atlantic Hurricanes [32,33,55–57].
often affected by energetic storms and the tail-end of a small number of Atlantic Hurricanes
The effects of someThe
[32,33,55–57]. of these
effectsevents
of somehaveofbeenthese described
events have by different authors [32,55–60],
been described by differentbut the specific
authors
impacts
[32,55–60], but the specific impacts of a recent post-tropical cyclone on Northern Irish beaches haveso far.
of a recent post-tropical cyclone on Northern Irish beaches have not been investigated
Coastal
not morphological
been investigated so far.changes investigated in this paper were related to the effects of the
post-tropical cyclone
Coastal Katia that changes
morphological impacted the coast ofinNorthern
investigated this paperIreland from the
were related to 12
thetoeffects
the 15ofSeptember
the
2011post-tropical
with sustained cyclone
winds Katia
of ca.that km h−1 and
95 impacted the offshore
coast of waves Northern Irelandoffrom
in excess 5 m in theheight.
12 to The the 15 cyclone
September 2011 with sustained winds of ca. 95 km h −1 and offshore waves in excess of 5 m in height.
originated as a tropical depression over the eastern Atlantic on 29 August, strengthened into a tropical
stormThethecyclone
following originated
day andas than a developed
tropical depression over thebyeastern
into a hurricane Atlantic becoming
1st September, on 29 August, a Category
strengthened into a tropical storm the −1 following day and than developed into a hurricane by 1st
4 hurricane with winds of 225 km h by 4 September moving eastward towards the east coast
September, becoming a Category 4 hurricane with winds of 225 km h−1 by 4 September moving
of USA and downgraded to a post-storm cyclone one day before reaching the British Isles on the
eastward towards the east coast of USA and downgraded to a post-storm cyclone one day before
12–13 September
reaching 2011. Isles on the 12–13 September 2011.
the British
The Theearliest reported
earliest reported high-magnitude
high-magnitudeevent eventininthe theNorthwest
Northwest of of Ireland
Irelandwas wasthe the‘Night
‘Nightofofthe the Big
Wind’,
Bigwhich
Wind’,was whichprobably the tail-end
was probably of a hurricane
the tail-end of a hurricane that hitthatIreland in January
hit Ireland 1839.
in January More
1839. Morerecently,
an analysis
recently,of aninstrumental storm records
analysis of instrumental storm since
recordsthe since1950s [60], identified
the 1950s [60], identified Hurricane
Hurricane Debbie
Debbieas the
as the largest storm that impacted Ireland during the second half of
largest storm that impacted Ireland during the second half of the 20th Century [31,60,61]. Hurricane the 20th Century [31,60,61].
Hurricane
Debbie movedDebbie
west acrossmoved thewest acrossstill
Atlantic themaintaining
Atlantic stillhurricane-force
maintaining hurricane-force winds and
winds and affecting Ireland
affecting Ireland in September 1961, with winds of
−1 up to 181 km
in September 1961, with winds of up to 181 km h for more than 5 h along the west of Ireland [60]. h −1 for more than 5 h along the
west of Ireland [60]. Furthermore, Guisado-Pintado and Jackson [32,33] mentioned the effects of
Furthermore, Guisado-Pintado and Jackson [32,33] mentioned the effects of Hurricane Charley (1986),
Hurricane Charley (1986), which was considered a post-tropical storm when it reached the south
which was considered a post-tropical storm when it reached the south coast of Ireland, and described in
coast of Ireland, and described in detail the effects of the extratropical storm Ophelia. This event,
detail the effectsas
re-classified of athe extratropicalstorm
“post-tropical” stormbut Ophelia. This event,
being previously re-classified
a Category as a “post-tropical”
3 hurricane [61], reachedstorm
but being previously a Category 3 hurricane [61], reached the
the western coast of Ireland on the 16 October 2017, triggering a nationwide severe western coast of Ireland on the 16 October
weather
2017,warning
triggering a nationwide severe weather
and causing substantial coastal flooding. warning and causing substantial coastal flooding.
During storm
During Katia,
storm offshore
Katia, offshorewavewavebuoys
buoys recorded
recordedvalues valuesininexcess
excessof of55m matatthe
thepeak
peak ofof the
the event
event but nearshore
but nearshore significant significant
wave height waveranged
height from
ranged from
1 to 3 m, 1 to 3 m, reflecting
reflecting relevant relevant
wavewave energy energy
reduction
reduction
linked linked
to a variety of to a variety of
dissipation dissipation
processes, thatprocesses,
is: although that offshore
is: although offshoreinconditions
conditions the exposed in the
Atlantic
exposed Atlantic section of the coast were very energetic, when
section of the coast were very energetic, when waves propagate and refract to reach the study waves propagate and refract to areas
reach the study areas (Figure 2), they dissipate significant amounts of energy due to bottom friction,
(Figure 2), they dissipate significant amounts of energy due to bottom friction, refraction and diffraction
refraction and diffraction along the wide, shallow and irregular shelf and shoreface, and indented
along the wide, shallow and irregular shelf and shoreface, and indented coastline [56]. This was
coastline [56]. This was particularly noticeable at Magilligan, as this area is protected towards the
particularly
west by anoticeable
resistant rockyat Magilligan,
headland and as this area is protected
the shoreline is situatedtowards
on the lee theside
west by aInnishowen
of the resistant rocky
headland
Peninsula that prevents the arrival of large amounts of wave energy from the SE, SW prevents
and the shoreline is situated on the lee side of the Innishowen Peninsula that or NW the
arrival of large[57].
quadrants amounts
Finally, ofatwave energybecause
Magilligan, from the of SE,
the SW wideorshoreface
NW quadrantsadjacent[57]. Finally,
to it and at Magilligan,
its long-term
because of the with
association widea large
shoreface
ebb-deltaadjacent
(Tuns to it and
Bank), bottomits long-term association
friction dissipation with a large
and refraction ebb-delta
are more
significant than at other sites examined here and the waves arrived almost
(Tuns Bank), bottom friction dissipation and refraction are more significant than at other sites examined perfectly shore parallel.
here and the waves arrived almost perfectly shore parallel. This leads to a very small angle of approach
and minimal alongshore wave energy fluxes. As a result, at Magilligan, there was limited wave forcing
over the whole period, both in terms of wave height and power, but also reduced wave steepnessWater 2020, 12, 1380 13 of 17
and almost insignificant alongshore fluxes. Specifically, with respect to other locations, wave power
observed here was the lowest (i.e., 5 × 10³ kW m−1 during the peak of the storm), much smaller
than what was observed during the last phases of Ophelia storm (20 × 103 kW m−1 ) [32]. As a result,
only minor morphological changes were recorded at Magilligan with erosion of the upper beach and
flattening of the foreshore, a trend similar—but with much smaller vertical morphological variations—to
the one observed at Five Finger Strand in NW Ireland [32].
Less significant nearshore wave refraction favoured higher (compared to Magilligan) wave height
and wave power values in Portrush and Whiterocks. Wave power ranged from 10 to 20 × 103 kW m−1
and presented a clear longshore component, predominantly southward at both Portrush sectors and
eastward at Whiterocks. Hence, longshore transport was evident at Portrush sectors that are included
within a morphological sediment cell [9] enclosed by a harbour, in the northern end, and a headland in
the southern end. The northern sector presented erosion while the southern sector accreted, probably
from a point of pivoting in beach planform located in between the two sectors as observed at other
morphological cells [9,62], which is consistent with a short-term rotational response identified in small
embayments in various other settings [63–65] and in other studies of large embayed beaches [66–68].
At Whiterocks, a trend similar to the one noted at Portrush was observed. Berm erosion took
place by means of a general beach flattening and this resulted in an overall accretion due to an influx of
sediment from the western section of the beach.
Overall, storm Katia produced relatively limited impacts on the beaches of the north coast of
Northern Ireland. This was also noted by Guisado-Pintado and Jackson [32] and Cooper et al. [56] that
indicated that, to have a relevant impact on dissipative beaches of Northern Ireland, storms need to be
directed onshore and coincide with high tide, rendering storm duration and offshore intensity of less
importance. Katia, which reached approximately 96 km h−1 presented much lower intensity that Debbie
(181 km h−1 ), but was marginally higher than Ophelia (gusts of 74 km h−1 ) and had a longer duration
than the previous events. This was not reflected in terms of morphological changes since during
Katia the storm track and prevailing wind directions, which are relevant aspects in determining storm
damages [23], were from the SW and W directions, while the beaches investigated are mainly exposed
to N, NW and NE quadrants. Interestingly, this was also the case for previous hurricane/post-tropical
cyclones Debbie and Ophelia. As observed by Cooper et al. [56], Northern Irish coasts facing NE and
N are more susceptible to lower magnitude and longer duration storms, characterised by short sea
waves, from a northerly direction. Further, as reported by Cooper et al. [56] and Guisado-Pintado
and Jackson [32,33] and confirmed by this study, morphological changes produced on the coast were
very localized and dependant on nearshore wave propagation driving cross and alongshore energy
fluxes, since the volume and direction of transport during storm impact was highly site-specific.
A similar trend, i.e., changes in the direction of longshore transport and morphological and volumetric
(positive/negative) modalities of beach response to storms impacts, was recorded in SW England during
the 2013–2014 storm winter season [69]. At Magilligan and Whiterocks, erosion processes did not
greatly affect the dry beach and did not impact at all on the frontal dunes since this depends on storm
peak coincidence with high tidal levels [32,56,65]. As observed by Cooper et al. [56] at Magilligan,
the formation of the local dune escarpment is relatively rare and is typically associated with storms that
occur at or close to high tide, with predicted tidal elevations of 2.1 m (high spring tide). During Katia
storm, maximum water elevation was 1.4 m (high neap tide). The upper beach in Portrush, which
is backed by a concrete concave seawall, experienced more relevant vertical changes, especially at
the southern sector where the upper beach connects directly with the seawall and the backshore
is inexistent.
7. Conclusions
Despite offshore wave buoys values in excess of 5 m wave height at the peak of the post-tropical
cyclone Katia on the 13 September 2011, nearshore significant wave height ranged from 1 to 3 m.
This was due to the dissipation processes experienced by waves as they propagate and refract alongYou can also read