Probabilistic cyclone and swell-driven inundation hazard assessment: Lenakel, Tanna, Vanuatu - Geoscience, Energy and Maritime Division of the ...
←
→
Page content transcription
If your browser does not render page correctly, please read the page content below
Probabilistic cyclone and
       swell-driven inundation
       hazard assessment:
       Lenakel, Tanna, Vanuatu

       Geoscience, Energy and Maritime Division of the Pacific Community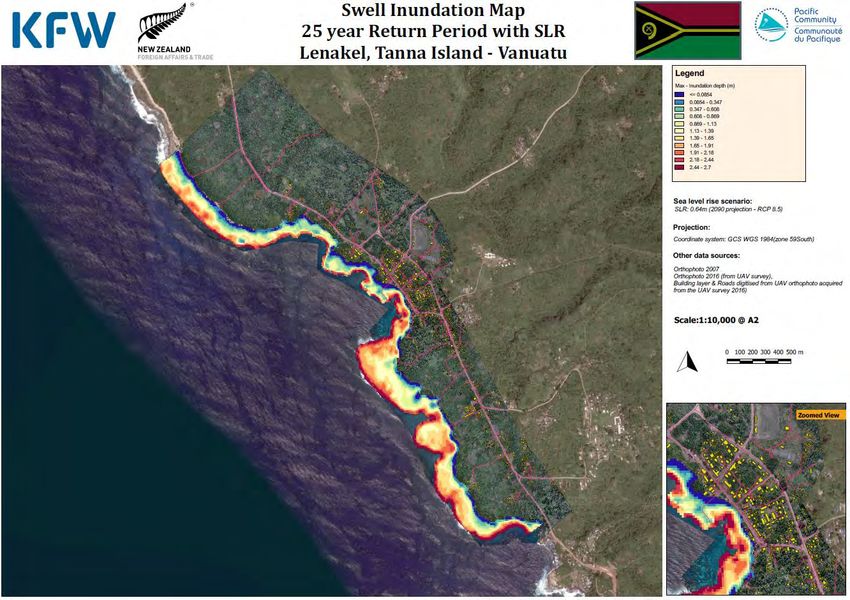
Probabilistic cyclone and swell-driven
   inundation hazard assessment:
      Lenakel, Tanna, Vanuatu
 Herve Damlamian, Moritz Wandres, Judith Giblin, Naomi Jackson, Zulfikar Begg,
  Poate Degei, Salesh Kumar, Jens Kruger, Tony Kanas, Rodhson Aru, Noel Naki

        Geoscience, Energy and Maritime Division of the Pacific Community

                                 Suva, Fiji, 2019
© Pacific Community (SPC) 2019
All rights for commercial/for profit reproduction or translation, in any form, reserved. SPC authorises the partial
reproduction or translation of this material for scientific, educational or research purposes, provided that SPC
and the source document are properly acknowledged. Permission to reproduce the document and/or translate
in whole, in any form, whether for commercial/for profit or non-profit purposes, must be requested in writing.
Original SPC artwork may not be altered or separately published without permission.

                                                Original text: English
                                Pacific Community Cataloguing-in-publication data
                                           Technical report no. SPC00062

Damlamian, Herve
Probabilistic cyclone and swell-driven inundation hazard assessment: Lenakel, Tanna, Vanuatu / Herve Damlamian,
Moritz Wandres, Judith Giblin, Naomi Jackson, Zulfikar Begg, Poate Degei, Salesh Kumar, Jens Kruger, Tony Kanas,
Rodhson Aru and Noel Naki

   1. Floods – Risk assessment – Vanuatu.
   2. Natural disasters – Risk assessment – Vanuatu.
   3. Sea level – Vanuatu.
   4. Climatic changes – Vanuatu.
   5. Coastal zone management – Vanuatu.
   6. Cyclones – Vanuatu.
   7. Ocean waves – Vanuatu.
   8. Oceanography – Vanuatu.
   9. Water waves – Vanuatu.

I. Damlamian, Herve II. Wandres, Moritz III. Giblin, Judith IV. Jackson, Naomi V. Begg, Zulfikar
VI. Degei, Poate VII. Kumar, Salesh VIII. Kruger, Jens IX. Kanas, Tony X. Aru, Rodhson XI. Naki, Noel
XII. Title XIII. Pacific Community

551.4637099595 									AACR2

ISBN : 978 982 00 1216 5

                               Prepared for publication at SPC’s Suva Regional Office,
                                          Private Mail Bag, Suva, Fiji, 2019
                                             www.spc.int | spc@spc.int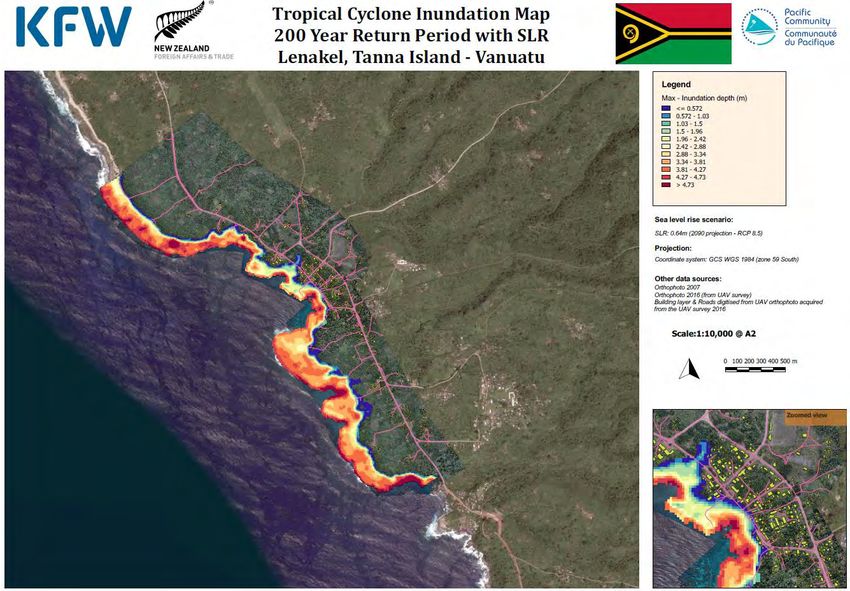
Probabilistic cyclone and swell-driven inundation hazard assessment, Lenakel, Tanna, Vanuatu
TABLE OF CONTENTS
ACKNOWLEDGMENTS ............................................................................................................................ vi
EXECUTIVE SUMMARY .......................................................................................................................... vii
I. INTRODUCTION ................................................................................................................................ 1
I.1 Background ................................................................................................................................ 1
I.2 Project objectives and activities ................................................................................................ 1
I.3 Purpose of this report................................................................................................................ 2
II. Cyclone-driven inundation probabilistic hazard assessment .......................................................... 2
II.1 Vanuatu cyclone threat profile .................................................................................................. 2
II.2 Methodology ............................................................................................................................. 3
II.3 Inundation hazard based on an extreme historical event ......................................................... 3
II.4 Stochastic, parametric and dynamic modelling approach ........................................................ 4
II.5 A new methodology .................................................................................................................. 4
II.5.1 Stochastic modelling........................................................................................................... 6
II.5.2 Tropical cyclone parameterisation and modification......................................................... 9
II.5.3 Cyclone wind field modelling ........................................................................................... 11
II.5.4 Meta-modelling of cyclone offshore wave condition ...................................................... 11
II.5.5 Offshore water level ......................................................................................................... 12
II.5.6 Meta-modelling of cyclone driven inundation ................................................................. 14
II.5.7 Inundation map with associated return period ............................................................... 15
II.5.8 Hazard under climate change ........................................................................................... 16
II.5.9 Probabilistic hazard map based on inundation depth...................................................... 17
II.6 Model calibration .................................................................................................................... 17
III. Swell-driven inundation hazard assessment ................................................................................ 19
III.1 Background .............................................................................................................................. 19
III.2 Methodology ........................................................................................................................... 20
III.2.1 Generate past ocean conditions off Lenakel. ................................................................... 22
III.2.2 Multivariate extreme value analysis ................................................................................ 24
III.2.3 Meta-modelling for swell inundation scenario ................................................................ 25
III.2.4 Inundation map with associated return period ............................................................... 25
IV. Coastal hazard and town planning workshop .............................................................................. 25
V. Conclusion ..................................................................................................................................... 27
VI. References .................................................................................................................................... 28
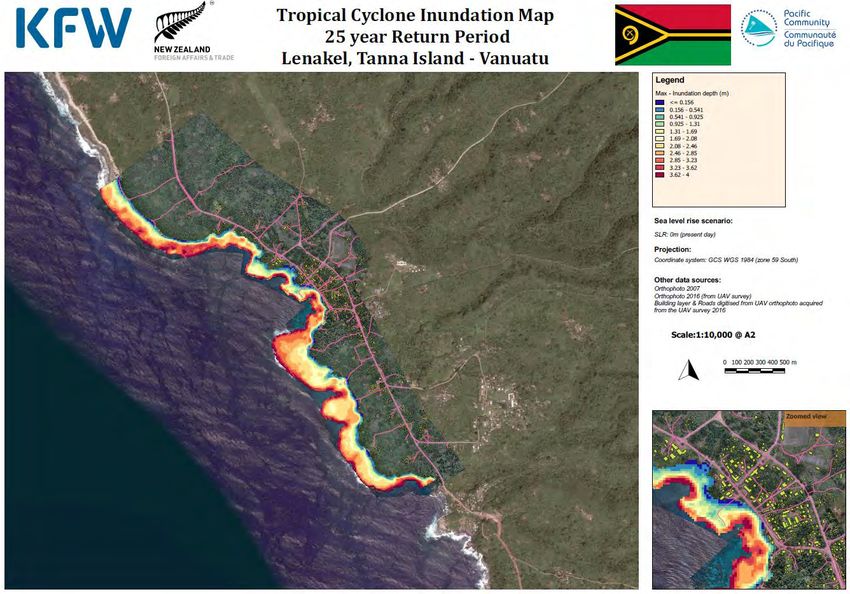
VII. ANNEX A: Tropical cyclone-driven inundation hazard maps ...................................................... 31
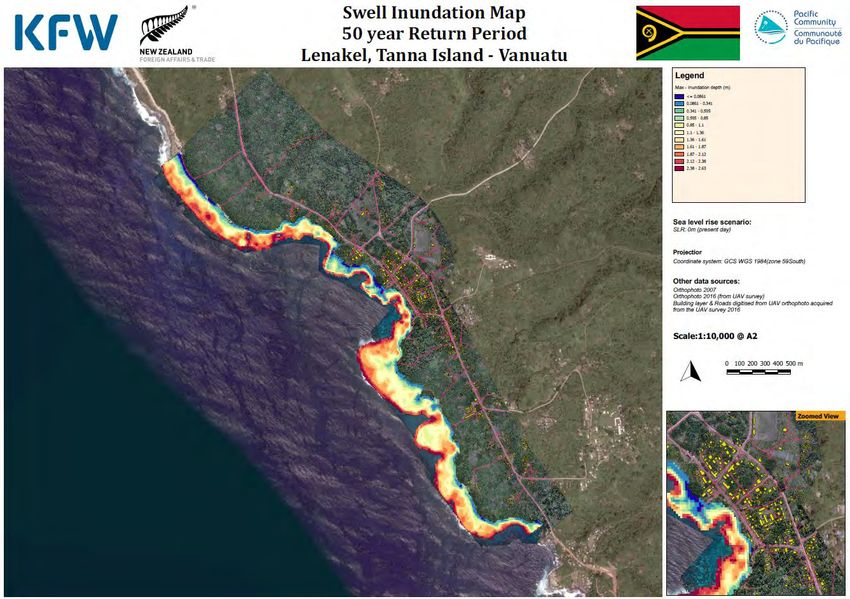
VIII. ANNEX B: Swell-driven inundation hazard maps ....................................................................... 40
IX. ANNEX C: Participants at the July 2018 KFW Hazard and Risk Workshop, and agenda ............... 49
Pacific Community: Geoscience, Energy and Maritime Division iii
Probabilistic cyclone and swell-driven inundation hazard assessment, Lenakel, Tanna, Vanuatu

LIST OF FIGURES
Figure 1: Historical tropical cyclones that passed within 4 degree (~400 km) of Lenakel between 1916
and 2016 (source: IBTrACS database https://www.ncdc.noaa.gov/ibtracs). The orange circle
represents the 4-degree radius centered on Lenakel. The cyclone tracks are represented in grey lines
and thick black lines for tracks outside and inside the 4-degree radius respectively. The green tracks
represent the paths of the 1956 cyclones. ............................................................................................. 2

Figure 2: Landmark in Lenakel representing inundation extent from 1956 tropical cyclone (with a 15–
20 m run-up) ........................................................................................................................................... 3

Figure 3: New methodology to assess cyclone inundation hazard, with techniques in blue and tools
in orange ................................................................................................................................................. 6

Figure 4: IBTrACS data quality. The figure shows the percentage of missing data (red) and number of
cyclone tracks in the historical database (blue) since 1900. .................................................................. 7

Figure 5: Tropical cyclone genesis probability generated by TCRM for Lenakel, Tanna ........................ 7

Figure 6: Correlation between tropical cyclone forward speed (right) and central pressure (left)
between time=t-1 and time=t based on tropical cyclone events around Lenakel from 1950 until 2017
................................................................................................................................................................ 8

Figure 7: 100-year return period cyclonic wind hazard for Vanuatu, based on 10,000 years of
synthetic tracks ....................................................................................................................................... 8

Figure 8: Extreme value analysis of tropical cyclone wind speed at Lenakel, Vanuatu, based on
10,000 years of synthetic tracks. The result does not consider effect from the topography and land
cover. ...................................................................................................................................................... 9

Figure 9: Cyclone parameterisation following Mendez et al. 2017 with γ: azimuth, δ: angle of
entrance, ν: forward speed, and Pmin: minimum pressure ................................................................... 10

Figure 10: Cyclone track modification. The figure shows an example of 300 cyclone tracks before
(top) and after parameterisation (bottom). ......................................................................................... 10

Figure 11: Snapshot of the wind field generated by a synthetic cyclone using Holland’s parametric
model (Holland 1980). The yellow circle represents the 4-degree radius centred on Lenakel. The
dashed line represents the associated (modified) cyclone track. ........................................................ 11

Figure 12: Meta-model to approximate 10,000 years of cyclone-driven offshore wave condition off
Lenakel .................................................................................................................................................. 12

Figure 13: Empirical distribution of Lenakel tide level for the month of January ................................ 13

Figure 14: Monthly empirical distribution of the mean sea level off Lenakel, based on HYCOM 20
years hindcast for June (right) and November (left)............................................................................. 14

Figure 15: Meta-model to approximate 10,000 years of cyclone driven inundation based on ocean
offshore condition (Hs, Tp, Theta, Uwind, Vwind, WL) ........................................................................ 14

Figure 16: Peak over threshold on the 10,000 years of inundation depth data generated on the
beach in front of Lenakel's market ....................................................................................................... 15

Pacific Community: Geoscience, Energy and Maritime Division                                                                                                    iv

Probabilistic cyclone and swell-driven inundation hazard assessment, Lenakel, Tanna, Vanuatu

Figure 17: Return period for tropical cyclone-driven inundation depth (m) along the beach in front of
Lenakel market. The yellow dashed line shows the range of inundation depth attributed to a 50 year
return period event within a 95% confidence interval. The red dashed line shows the range of
inundation depth attributed to a 100 year return period event within a 95% confidence interval. ... 16

Figure 18: Probabilistic inundation map showing the likelihood of Lenakel experiencing inundation
depths greater than 0.25 m. ................................................................................................................. 17

Figure 19: Oceanographic instrument deployment's location (Red: Virtuoso, Blue: TWR, Orange:
AWAC). .................................................................................................................................................. 18

Figure 20: Wave data recorded by the AWAC off Lenakel ................................................................... 19

Figure 21: Mean wave height (colour-coded) and direction (black arrows) based on 30 years global
wave hindcast developed with BoM (ref. SPC WACOP website: http://wacop.gsd.spc.int) ................ 20

Figure 22: 99th Percentile wave height across the pacific region based on ~30 years hindcast wave
information developed by BoM – ref. SPC WACOP website: http://wacop.gsd.spc.int). .................... 20

Figure 23: Methodology using bivariate extreme value analysis in Damlamian et al. 2015 ................ 21

Figure 24: New methodology based on multivariate extreme value analysis and meta-modelling,
adapted from Gouldby et al. 2014 ........................................................................................................ 22

Figure 25: Snapshot of the 500 m resolution hindcast wave model of Tanna during the May 1996
swell event ............................................................................................................................................ 23

Figure 26: Snapshot of the HYCOM global circulation model hindcast zoomed around Vanuatu ....... 23

Figure 27: Analysis of the water level record at the Lenakel tide gauge. Raw data were used to
extract tidal harmonics and tidal residual using T_Tide. The tidal residual was decomposed into
storm surge and mean level of the sea using an orthogonal wavelet filter. ........................................ 24

Figure 28: Vanuatu stakeholders undertaking risk assessment by identifying key assets and hazard
zones, using transparent paper overlayed on a probabilistic inundation map .................................... 26

Figure 29: Risk matrix ........................................................................................................................... 26

Figure 30: Risk category attributed to some key Lenakel assets, July 2018 Coastal Hazard Workshop
.............................................................................................................................................................. 28

Pacific Community: Geoscience, Energy and Maritime Division                                                                                                    v
Probabilistic cyclone and swell-driven inundation hazard assessment, Lenakel, Tanna, Vanuatu ACKNOWLEDGMENTS This report was prepared under the the SPC Recovery Support for Tropical Cyclone Pam project funded by the KfW Bank Group. Many people assisted during field surveys and data processing and contributed to the compilation of the report. The authors extend their appreciation and gratitude to the following organisations and individuals: Vanuatu Land and Surveys Department Lenakel Town Council Fernando Mendez and Ana Rueda from the University of Cantabria. Pacific Community: Geoscience, Energy and Maritime Division vi
Probabilistic cyclone and swell-driven inundation hazard assessment, Lenakel, Tanna, Vanuatu

EXECUTIVE SUMMARY

Coastal hazards such as tsunami, storm tides and wave-driven flooding frequently challenge
coastal settlements, infrastructure and ecosystems in the Pacific region. Climate variability
and change, including sea-level rise trends and changes in weather patterns, are also likely
to add pressure on coastal communities. If not planned for, coastal processes can damage
public and private assets and facilities. Local governments and municipalities often carry the
burden of managing such risks.

The report of the post-disaster needs assessment (Esler 2015) carried out for Vanuatu after
Tropical Cyclone (TC) Pam in 2015 highlighted the need for multi-hazard mapping of urban
areas and for action plans to identify safe areas for future growth. The report also
emphasised the importance of having a sound scientific basis for predicting hazards.

In 2016, the Pacific Community (SPC) started working on a component entitled Multi-hazard
mapping to inform improved resilience of coastal communities, Lenakel under the SPC TC
Pam Recovery Project funded by the German Development Bank (KfW). This component
was designed to develop coastal hazard maps to identify vulnerable areas in Lenakel, Tanna,
and provide tools and training for the dissemination of the information, both at the central
and provincial government level.

Sound and robust methodologies, combining stochastic, parametric, dynamic and meta-
modelling, have been implemented to assess the inundation hazard from tropical cyclones
and from the co-occurrence of swell and high-water level.

This study highlights the relatively low vulnerability of Lenakel to a metocean-driven
inundation hazard. However, the risk assessment exercise undertaken by Vanuatu central
and provincial government stakeholders during a coastal hazard and planning workshop
stressed that key assets, such as the wharf and the market, were facing a high risk.

The results of the study should guide future development plans of Lenakel so that the
number of assets within the hazard prone areas remains relatively low.

Pacific Community: Geoscience, Energy and Maritime Division                                    vii

Probabilistic cyclone and swell-driven inundation hazard assessment, Lenakel, Tanna, Vanuatu
I. INTRODUCTION
I.1 Background
In December 2015, the Government of the Federal Republic of Germany, through the KFW
Banking Group, signed an agreement with SPC for the delivery of a project designed to
provide support to Pacific Islands affected by TC Pam.
The project, SPC Recovery Support for Tropical Cyclone Pam, is implemented through 42
packages involving a mix of advisory services, field activities and investments to support
recovery from the cyclone in affected parts of Vanuatu, Tuvalu, Kiribati and Solomon
Islands. The project is structured in two phases. Phase 1 comprises technical capacity
support for damage assessments in the immediate aftermath of the cyclone. Phase 2 is
significantly longer, involving implementation of a combination of multi-sector activities
targeted at specific recovery needs identified by each country.
I.2 Project objectives and activities
Vanuatu is highly vulnerable to natural hazards either from geophysical or hydro-
meteorological hazards. The post-disaster needs assessment (PDNA) report (Esler 2015)
emphasises that a mid- to long-term reconstruction effort is to be driven by improving
resilience in all sectors.
The PDNA highlights the need for multi-hazard mapping of urban areas and action plans to
identify safe areas for future growth. The report also mentions the importance of having a
sound scientific basis for predicting hazards and a reliable forecasting system.
The Geoscience, Energy and Maritime Division of SPC proposed to assist the multi-hazard
mapping effort already under way in Port Vila and Luganville (World Bank MDRR project) by
undertaking a similar activity in an appropriate location, Lenakel, Tanna (population of
about 14,000 people). The study aims to identify the probable risk of coastal inundation
from tsunamigenic earthquake, cyclone and the co-occurrence of large swell with possible
high storm tide level. The study also investigates the possible exacerbation of the
inundation risk inherent from sea-level rise. Community members were engaged to provide
information and data, and to participate in the development of response plans.
Through this project SPC aimed to deliver:
geospatial baseline data used in cross-sector activities, e.g. topography,
bathymetry;
hazard maps to identify low hazard-prone land suitable for future growth;
tools and training for the dissemination of the information, both at the central
and provincial government level; and
a support response plan for the municipality and adjacent communities.
Pacific Community: Geoscience, Energy and Maritime Division 1Probabilistic cyclone and swell-driven inundation hazard assessment, Lenakel, Tanna, Vanuatu
I.3 Purpose of this report
This report describes the methodology and results of the probabilistic swell-driven
inundation hazard assessment undertaken for Lenakel, Tanna Island, Vanuatu. The report
also outlines the training that was conducted in August 2018 to promote the use of hazard
information to support planning decisions.
II. Cyclone-driven inundation probabilistic hazard assessment
II.1 Vanuatu cyclone threat profile
According to the annual world risk report published by the United Nations University’s
Institute for Environment and Human Security, Vanuatu has been considered, for four years
running, the most disaster-prone country in the world as it is highly exposed to a wide range
of hazards, such as earthquakes, tsunami and cyclones.
Vanuatu is located at the centre of the Pacific tropical belt, which is known for the frequent
occurrence of tropical cyclones driving damaging winds, rains and extreme ocean
conditions, leading to inundation events. Between 1990 and 2011, Vanuatu experienced at
least twenty tropical cyclones: almost one each year (Pacific Catastrophe Risk Assessment
and Financing Initiative [PCRAFI], Country Risk Profile, 2011).
PCRAFI (2011) reports that Vanuatu is expected to incur, on average, USD 48 million worth
of damage per year due to earthquakes and tropical cyclones. In March 2015, TC Pam
caused widespread damage across the country. According the post-disaster need
assessment damage, loss and needs in the aftermath of TC Pam was estimated at USD 450
million; 64% of Vanuatu’s GDP.
Figure 1: Historical tropical cyclones
that passed within 4 degree (~400 km)
of Lenakel between 1916 and 2016
(source: IBTrACS database
https://www.ncdc.noaa.gov/ibtracs).
The orange circle represents the 4-
degree radius centered on Lenakel. The
cyclone tracks are represented in grey
lines and thick black lines for tracks
outside and inside the 4-degree radius
respectively. The green tracks represent
the paths of the 1956 cyclones.
Pacific Community: Geoscience, Energy and Maritime Division 2Probabilistic cyclone and swell-driven inundation hazard assessment, Lenakel, Tanna, Vanuatu
Lenakel town has experienced numerous cyclones over the last hundred years. According to
the International Best Track Archive for Climate and Stewardship (IBTrACS,
https://www.ncdc.noaa.gov/ibtracs/), 151 tropical cyclones passed within a 4-degree radius
(~400 km) from Lenakel between 1916 and 2016 (Error! Reference source not found.).
Witness accounts and landmarks of past tropical cyclones can easily be found (Figure 2) in
Lenakel. However, their use in this study is limited due to: (i) the lack of understanding of
local seismic activity over the last 100 years, which potentially led to a significant uplift of
the coastal zone; and (ii) the potential inaccuracy of the historical hazard information. The
landmark from the 1956 tropical cyclone event represents, on today’s topography, a run-up
greater than 15 m. The most damaging cyclone that passed near Tanna Island in 1956 was a
category 2 cyclone named Agnes (as per IBTrACS). It is unlikely that a cyclone of category 2
generated the necessary extreme ocean condition to drive an inundation run-up of 15 m.
For comparison, TC Pam, a category 5 cyclone, generated a run-up as high as 7 m northeast
of Efate (Damlamian 2017).
Figure 2: Landmark in Lenakel representing inundation extent from 1956 tropical cyclone (with a 15–20 m run-
up)
II.2 Methodology
Various methodologies are being used to assess inundation hazard from tropical cyclones.
II.3 Inundation hazard based on an extreme historical event
One of the simplest methodologies consists of assessing tropical cyclone hazard solely by
investigating known historical events. The limitation of such a methodology resides in the
relative short tropical cyclone historical records compared to the high variability of tropical
cyclone genesis and behaviour.
Pacific Community: Geoscience, Energy and Maritime Division 3Probabilistic cyclone and swell-driven inundation hazard assessment, Lenakel, Tanna, Vanuatu
As part of the EU-funded project – Supporting Disaster Risk Reduction in Pacific Overseas
Countries and Territories – the French Polynesia government requested SPC to map cyclone
wave inundation models for five atolls in the Tuamotu Archipelago, with the aim of
including this information in future development plans and risk prevention solutions
(Damlamian et al. 2013). To ensure consistency in the French Polynesia’s risk prevention
plans, SPC was required to focus on a predefined characteristic cyclone event, based on the
most extreme event experienced during the last 25 years. A 12 m wave height, combined
with a 1 m storm surge occurring at spring high tide, characterises the ocean condition
generated by tropical cyclone Nisha-Orama in 1983 off Anaa atoll. It completely wiped out
the village.
This methodology limits the usability of the hazard data, as the likelihood of the predefined
characteristic event is unknown. The produced inundation hazard being extreme, a risk
reduction solution would require major investment. Without perspective on the likelihood
of such a disaster, the information is unlikely to become actionable.
II.4 Stochastic, parametric and dynamic modelling approach
As part of the Australian funded project, Assessing Vulnerability and Adaptation to Sea-level
Rise: Lifuka Island, Ha’apai, Tonga, under the Pacific Adaptation Strategy Assistance
Programme, SPC undertook a probabilistic tropical cyclone-driven inundation hazard
assessment for Lifuka island (Kruger 2013).
The methodology for the assessment can be summarised as shown below:
generation of a large number of synthetic cyclone tracks (1000 years of cyclone)
based on a stochastic approach;
estimation of the ocean condition for each track using a parametric wave modelling;
development of probabilistic scenarios; and
inundation hazard mapping using dynamic modelling.
The primary limitation inherent to this methodology resides in the use of a parametric wave
model to estimate the offshore wave condition generated by each cyclone. While dynamic
wave modelling can provide satisfying offshore cyclone wave information, the required
computational time to simulate thousands of cyclones was deemed unpractical and fell
outside the project timeline. Therefore, the Young parametric wave model (Young &
Burchell 1996), a widely used and computationally efficient model to estimate cyclone wave
in open ocean, was used, despite its inability to account for geomorphological interference
(shallow bathymetry features, sheltering of islands, etc.).
II.5 A new methodology
The challenge in assessing the likelihood of tropical cyclone-driven inundation hazard
resides in:
the high variability of cyclone events characterised by a range of parameters, such as
its origin, its potentially complex path, the changing minimum barometric pressure
and cyclone forward speed;
Pacific Community: Geoscience, Energy and Maritime Division 4Probabilistic cyclone and swell-driven inundation hazard assessment, Lenakel, Tanna, Vanuatu
the small historical database relative to the variability and occurrence of cyclone
events which prevents the direct use of historical data to define the probability of
extremes (i.e. looking at the last 50–100 years of historical events does not provide
reliable access to 25 years, 50 years or 100 years return period event).
the likelihood of the inundation event should be assessed as a compound event,
depending not only on the cyclone characteristics driving wave height, period and
direction and on storm surge (wind set-up and inverted barometric pressure) but
also on the tide and the mean level of the sea;
the probability of an inundation hazard event should not be based on offshore ocean
condition but on the inundation hazard itself (i.e. flood depth); and
the high uncertainty of the changing behaviour of cyclones under climate change.
A new and innovative methodology, tailored to fronted reef shoreline, was developed as
part of this project. This methodology was largely inspired by the hazard mapping work
being carried out under the project Advancing Best Practices for the Analysis of the
Vulnerability of Military Installations in the Pacific Basin to Coastal Flooding under a
Changing Climate by the University of Cantabria and the United State Geological Survey as
part of the US Department of Defence project.
The methodology that combines stochastic, parametric and dynamic and meta-modelling
can be broken down into eight primary steps (Figure 3).
Pacific Community: Geoscience, Energy and Maritime Division 5Probabilistic cyclone and swell-driven inundation hazard assessment, Lenakel, Tanna, Vanuatu
Figure 3: New methodology to assess cyclone inundation hazard, with techniques in blue and tools in orange
II.5.1 Stochastic modelling
As mentioned above, the historical tropical cyclone database cannot be used directly to
assess the return period of a tropical cyclone hazard. In order to increase the robustness of
the statistical analysis, the historical database needs to be expanded. Following a stochastic
approach (Emanuel et al. 2006, Rumpf et al. 2007) a large number of synthetic tropical
cyclone events are generated using Geoscience Australia open source Tropical Cyclone Risk
Model. The main steps of this process are listed below.
Analyse the statistical behaviour of historical cyclones (extracted from the
International Best Track Archive for Climate Stewardship (IBTrACS), described via the
means, variance and autocorrelation of the following parameters: intensity and
location information, speed, bearings and genesis locations (Figure 5, Figure 6). The
study considered historical tropical cyclones from 1950 to 2018 based on data
quality analysis of the IBTrACS database (Figure 4).
Pacific Community: Geoscience, Energy and Maritime Division 6Probabilistic cyclone and swell-driven inundation hazard assessment, Lenakel, Tanna, Vanuatu
Generate 10,000 years of cyclone tracks (>16,000 cyclones) that share the same
statistical behaviour as the 1950–2018 dataset.
Generate the wind field for each of the 10,000 years of tropical cyclone tracks using
Holland’s parametric wind model (Holland 1980).
Generate a probabilistic hazard map based on the 10,000 years of ttropical cyclone
wind by fitting a generalised extreme value distribution at each grid point across the
domain (Figure 7, Figure 8).
Figure 4: IBTrACS data quality. The figure shows the percentage of missing data (red) and number of cyclone
tracks in the historical database (blue) since 1900.
Figure 5: Tropical cyclone genesis probability generated by TCRM for Lenakel, Tanna
Pacific Community: Geoscience, Energy and Maritime Division 7Probabilistic cyclone and swell-driven inundation hazard assessment, Lenakel, Tanna, Vanuatu
Figure 6: Correlation between tropical cyclone forward speed (right) and central pressure (left) between time=t-
1 and time=t based on tropical cyclone events around Lenakel from 1950 until 2017
Figure 7: 100-year return period cyclonic wind hazard for Vanuatu, based on 10,000 years of synthetic tracks
Pacific Community: Geoscience, Energy and Maritime Division 8Probabilistic cyclone and swell-driven inundation hazard assessment, Lenakel, Tanna, Vanuatu
Figure 8: Extreme value analysis of tropical cyclone wind speed at Lenakel, Vanuatu, based on 10,000 years of
synthetic tracks. The result does not consider effect from the topography and land cover.
II.5.2 Tropical cyclone parameterisation and modification
The primary difference between the methodology used for mapping tropical cyclone hazard
in Lifuka Island in 2012 (II.4) and this study resides in how the large cyclone database
(10,000 years of tracks) is dealt with. Instead of estimating offshore wave with an
inadequate cyclone parametric model, the methodology is based on a recent but already
widely used technique in physical oceanography named meta-modelling. The reliability of
this technique, which is detailed in (II.5.4), lies in the ability to select representative
scenarios.
To organise the cyclone database, tracks passing within four degrees of Lenakel are
parameterised, following Mendez et al. 2017 (Figure 9). The four parameters describing
each cyclone are:
Pmin: minimum central pressure, the minimum pressure along the track while the
cyclone is within a 4-degree radius of Lenakel;
v: forward speed, the mean forward speed of the cyclone within a 4-degree radius of
Lenakel;
γ: azimuth, the angle defined, based on the track entrance point into and exit point
from the 4-degree circle centred on Lenakel. For cases where either the entrance
point or the exit point does not exist (tropical cyclone initiates or ends within a 4-
degree of Lenakel), the mean track direction within the 4-degree radius is used;
δ: angle of entrance into the 4-degree circle centred on Lenakel.
This parameterisation leads to significant modification of the cyclone tracks (Error!
Reference source not found.) with a constant minimum pressure, forward speed and
direction within the area of interest, as well as a necessary adjustment in temporal space.
Pacific Community: Geoscience, Energy and Maritime Division 9Probabilistic cyclone and swell-driven inundation hazard assessment, Lenakel, Tanna, Vanuatu
Figure 9: Cyclone parameterisation following Mendez et al. 2017 with γ: azimuth, δ: angle of entrance, ν:
forward speed, and Pmin: minimum pressure
Figure 10: Cyclone track
modification. The figure
shows an example of 300
cyclone tracks before
(top) and after
parameterisation
(bottom).
Pacific Community: Geoscience, Energy and Maritime Division 10Probabilistic cyclone and swell-driven inundation hazard assessment, Lenakel, Tanna, Vanuatu
II.5.3 Cyclone wind field modelling
For each modified tropical cyclone track, a time-varying two-dimensional wind and pressure
fields is calculated, based on a cyclone wind parametric model (Holland 1980). In 2016, SPC
allocated programme funds into the in-house development of TCwindgen; an open source
and computationally efficient tool to generate a cyclone wind field
(https://github.com/CyprienBosserelle/TCwindgen) and export it as a wave model
formatted input.
The parametric model was set up to generate a wind field with a 0.04 degree resolution and
a 30-minute timestep. A batch file was created to loop through all the tracks, format the
input files (modified tracks and parameter files) and generate wind input files to SWAN via
TCwindgen.
Figure 11: Snapshot of the wind field generated by a
synthetic cyclone using Holland’s parametric model
(Holland 1980). The yellow circle represents the 4-
degree radius centred on Lenakel. The dashed line
represents the associated (modified) cyclone track.
II.5.4 Meta-modelling of cyclone offshore wave condition
Because physical process-based models are computationally intensive, their use in
computing offshore wave condition for a large sample of events (>16,000 cyclone tracks)
raises practical challenges (Gouldby et al. 2014). Meta-models (or models of models) are
being increasingly used in the physical oceanography field (Camus et al. 2011a; Camus et al.
2011b ; Camus et al. 2014; Gouldby et al. 2014 ; Rueda et al. 2016 ; Rueda et al. 2019) as an
alternative to overcome these challenges.
The meta-model to estimate offshore cyclone wave off Lenakel for 10,000 years of tropical
cyclone is composed of a four-variable predictor (Pmin, v, γ, δ) and a three-variable
predictand (Hs, Tp, Theta). The development of the meta-model can be described in three
steps (Figure 12).
Pacific Community: Geoscience, Energy and Maritime Division 11Probabilistic cyclone and swell-driven inundation hazard assessment, Lenakel, Tanna, Vanuatu 1. The careful selection of representative scenarios (or designed points) from the entire cyclone database. Based on the investigation of the performance of various clustering technics (K-Means, Self-Organising Map, Maximum Dissimilarity Algorithm [MDA]) found in Camus et al. 2011, 500 cyclone tracks where selected, using an MDA. The performance of the meta-model is highly dependent on the selected scenarios. The benefit of the MDA resides in its ability to select points within the population data covering the edge of the domain, in turn making it highly efficient for interpolating in spaces of high dimensionality. 2. The physical process-based modelling of the selected scenarios. Offshore wave is computed for the selected representative cyclone events using SWAN, a third- generation spectral wave model developed by Delft University of Technology (Booij et al. 1999). SWAN has been used in non-stationary mode, forced by the moving wind field (varying in space and time) predicted by the Holland wind field model (previous section). The resolution of the wave model is about 2 km. 3. The reconstruction of predictand (Hs, Tp, Theta) for the 10,000 years of tropical cyclone. Following Camus, 2011 and Gouldby et al. 2014, the relationship between the set of representative predictors (i.e. Pmin, v, γ, δ) and their predictand (i.e Hs, Tp, Theta) is approximated by a radial basis function (RBF). The trained RBF is then used to reconstruct the offshore wave condition for the 10,000 years of cyclone events. Figure 12: Meta-model to approximate 10,000 years of cyclone-driven offshore wave condition off Lenakel II.5.5 Offshore water level Cyclone-driven inundation needs to be assessed as a compound event. The inundation event is not only dependent on the wave and storm surge (inverted barometric pressure and wind set-up) induced by the cyclone but is also modulated by the tide and the mean level of the sea (MLoS). In this study, the offshore water level for each synthetic cyclone is defined as a combination of the inverted barometric pressure, a tide level and an MLoS. II.5.5.1 Inverted barometric pressure Inside a cyclone, the barometric pressure at the ocean surface can drop to extremely low levels. As a result, the ocean surface responds hydrostatically and rises. This phenomenon is called the inverted barometric pressure. Pacific Community: Geoscience, Energy and Maritime Division 12
Probabilistic cyclone and swell-driven inundation hazard assessment, Lenakel, Tanna, Vanuatu
As the cyclone central pressure is set to constant within a four degree radius from Lenakel,
the inverted barometric pressure is calculated for each cyclone as follow (Eum & Series
2016):
)
II.5.5.2 Tide level
A tide level was given to each synthetic track following these steps:
tide gauge data analysis; a permanent tide gauge was set up in Lenakel by the Japan
International Cooperation Agency in 2016. The tide gauge data were used to:
o extract tidal harmonics from the tide gauge data using MATLAB T_TIDE toolbox
(https://www.eoas.ubc.ca/~rich/#T_Tide);
o predict long-term tidal level for Lenakel (100 years);
map the monthly empirical tidal level distribution for Lenakel;
retrieve what month each synthetic tropical cyclone passes near Lenakel from the
database; and
attribute a random tidal level to each synthetic tropical cyclone following the
monthly empirical tidal level distribution.
Figure 13: Empirical distribution of Lenakel tide level for the month of January
II.5.5.3 Mean sea level
As the Lenakel tide gauge record goes back only two years, the in situ mean level of the sea
(MLoS) recorded does not provide adequate information on the range of anomalies that can
be induced by climate variability (e.g. ENSO) or mesoscale eddies.
MLoS information off Lenakel was extracted from HYCOM (Chassignet et al. 2007) re-
analysis global hindcast model, providing ocean surface elevation at 0.08 degree resolution
from 1992 to 2012 (20 years). The 20 years hindcast data are analysed to map the monthly
empirical MLoS distribution. A random MLoS is then attributed to each synthetic tropical
cyclone following its monthly empirical distribution.
Pacific Community: Geoscience, Energy and Maritime Division 13Probabilistic cyclone and swell-driven inundation hazard assessment, Lenakel, Tanna, Vanuatu
Figure 14: Monthly empirical distribution of the mean sea level off Lenakel, based on HYCOM 20 years hindcast
for June (right) and November (left)
II.5.6 Meta-modelling of cyclone driven inundation
Following a similar process to that in II.5.4, a meta-model is created to approximate
inundation depth from the 10,000 years of cyclone-driven offshore ocean condition off
Lenakel. The meta-model is composed of a six-variable predictor (Hs, Tp, Theta, Wspd, Wdir,
offshore water level) and a predictand (inundation depth) every 10 m within coastal zone
(Figure 15).
Five hundred representative cyclone-driven sea states are selected via the MDA. A 10 m
resolution XBEACH-GPU model (https://github.com/CyprienBosserelle/xbeach_gpu),
calibrated using in situ wave and water level data, is used to simulate inundation for the 500
representative scenarios. Finally, an RBF is used to reconstruct the 10,000 years of cyclone-
driven inundation depth for each 10 m grid cell on land.
Figure 15: Meta-model to approximate 10,000 years of cyclone driven inundation based on ocean offshore
condition (Hs, Tp, Theta, Uwind, Vwind, WL)
Pacific Community: Geoscience, Energy and Maritime Division 14Probabilistic cyclone and swell-driven inundation hazard assessment, Lenakel, Tanna, Vanuatu
II.5.7 Inundation map with associated return period
One advantage of this methodology resides in the ability to quantify the likelihood of a
tropical cyclone-driven inundation event based on the actual hazard (i.e. inundation depth)
instead of the driver (i.e. the offshore ocean condition).
As inundation depth is expected to vary across the coastal zone. The estimated return
period of the inundation hazard can vary, depending on the area of the coastal zone the
analysis focuses on. The analysis can be performed in at least two ways;
by performing an extreme value analysis on an appropriately selected grid cell; and
by creating a simple inundation depth response function (i.e. weighted average of
inundation depth from a set of grid cells) and performing an extreme value analysis
on the response function’s output.
In this study, a single grid cell to estimate the likelihood of the inundation hazard was
considered. An extreme value analysis (EVA) was undertaken, based on 10,000 years of
inundation depth information generated on the beach in front of Lenakel’s market.
The EVA consists of : (i) selecting the maxima using a peak over threshold (Figure 16); and
(ii) fitting the selected maxima to a generalized pareto distribution (Figure 17).
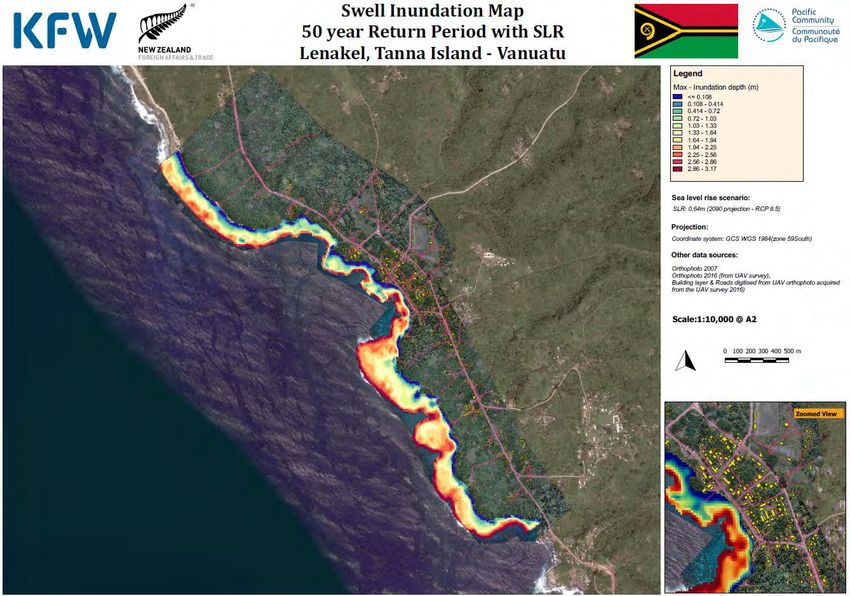
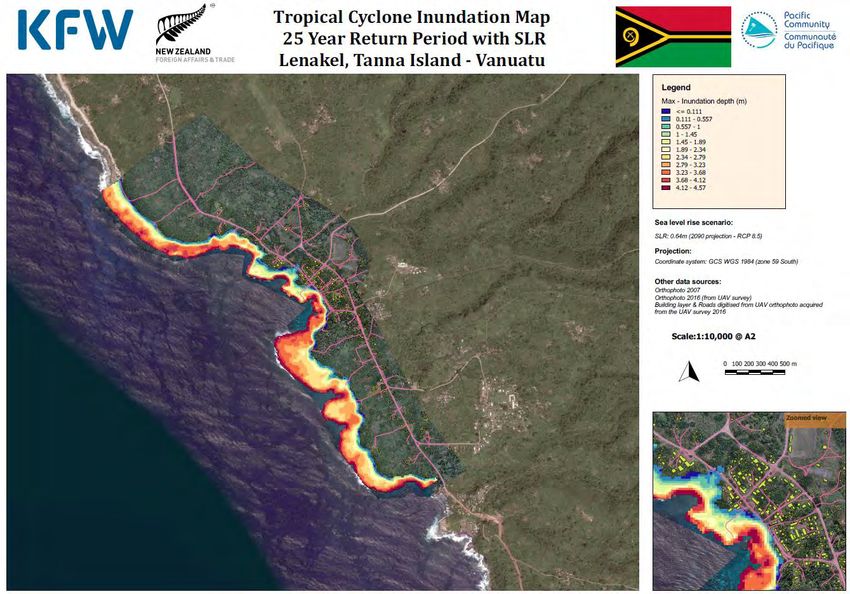
For each return period (RP) (i.e. 20 year RP, 50 year RP, 100 year RP, 200 year RP), a range of
inundation depth is selected, following the 95% confidence interval as shown in Figure 17.
The range of inundation depth is linked, via the meta-model descried in II.5.6, to a set of
tropical cyclone-driven ocean conditions (Hs, TP, Theta, Wspd, Wdir, WL). For each RP, the
corresponding set of ocean conditions is used to force the XBEACH-GPU model of Lenakel.
The resulting maximum inundation depth for each ocean condition is then aggregated into
an inundation hazard map with an associated return period.
Figure 16: Peak over threshold on the 10,000 years of inundation depth data generated on the beach in front of
Lenakel's market
Pacific Community: Geoscience, Energy and Maritime Division 15Probabilistic cyclone and swell-driven inundation hazard assessment, Lenakel, Tanna, Vanuatu
Figure 17: Return period for tropical cyclone-driven inundation depth (m) along the beach in front of Lenakel
market. The yellow dashed line shows the range of inundation depth attributed to a 50 year return period event
within a 95% confidence interval. The red dashed line shows the range of inundation depth attributed to a 100
year return period event within a 95% confidence interval.
II.5.8 Hazard under climate change
The Fifth Assessment Report of the Intergovernmental Panel on Climate Change (IPCC 2013)
provides projections of future changes for four greenhouse gas concentration trajectories,
called Representative Concentration Pathways (RCPs).
The RCPs are labelled according to the range of radiative forcing values in the year 2100
relative to pre-industrial values:
RCP2.6 applies a radiative forcing value of +2.6 W/m2 and represents a low forcing
level;
RP4.5 and RCP6 apply radiative forcing values of +4.5 and +6.0 W/m2 and represent
stabilisation scenarios; and
RCP8.5 applies a radiative forcing value +8.5 W/m2 and represents a high forcing
level.
AR5 predictions of changes in tropical cyclone statistics show:
The total annual frequency of tropical storms to potentially decrease (between 0 and
60%); and
The annual frequency of high intensity cyclones (Category 4 and 5) to globally
increase between 0 and 30%. There is, however, not enough supporting data in the
South Pacific region for a specific prediction.
Pacific Community: Geoscience, Energy and Maritime Division 16Probabilistic cyclone and swell-driven inundation hazard assessment, Lenakel, Tanna, Vanuatu
With little confidence in the projected behaviour of cyclones around Vanuatu, this study
only considers climate change-driven potential exacerbation of the inundation hazard in
relation to sea-level rise (SLR).
The study considered an SLR of 0.64 m: the 2090 projected SLR for Vanuatu under RCP8.5
scenario (BOM and CSIRO 2014). The scenarios associated with each return period are re-
computed after increasing the water level at the model offshore boundary by 0.64 cm.
The cyclone-driven inundation hazard maps with and without SLR are shown in ANNEX A.
II.5.9 Probabilistic hazard map based on inundation depth
In II.5.7, probabilistic inundation hazard is characterised by the inundation depth mapped
for a fixed likelihood (e.g. 20, 50, 100 years return period). This is the standard output from
a probabilistic inundation hazard assessment.
With meta-modelling, however, this study gives access to a database of 10,000 years of
inundation map, in turn providing an opportunity to map for the probability in any place on
land of experiencing an inundation depth exceeding a given threshold. This new packaged
hazard information can prove to be more adequate to support decision makers on urban
planning and other risk prevention solutions.
For each grid cell on land, the 10,000 years of inundation depth data are used to compute
the probability of exceeding a given inundation depth (e.g. 0.25 m, 0.5 m, 1 m) (Figure 18).
Figure 18: Probabilistic inundation map showing the likelihood of Lenakel experiencing inundation depths
greater than 0.25 m.
II.6 Model calibration
Pacific Community: Geoscience, Energy and Maritime Division 17Probabilistic cyclone and swell-driven inundation hazard assessment, Lenakel, Tanna, Vanuatu
An XBEACH-GPU model was calibrated, using in situ oceanographic data. Six oceanographic
instruments were deployed in Lenakel (Figure 19) recording data for a four- to six-month
period (from February 2017 to July 2017). It includes:
two RBRvirtuosos, recording continuously at 1 Hz;
three RBR TWRs, recording 2048 seconds burst at 1 Hz every three hours; and
one AWAC, recording 2048 seconds burst at 1 Hz every three hours.
Over the deployment period, two wave events with wave height exceeding three metres
(Hs>3 m) were recorded (Figure 20). Four events were selected to carry out the calibration
process. These events are characterised by a high wave (Hs>3m) with offshore water level
ranging from mid to high level.
Pressure data were processed into an hourly wave set-up, wave height and wave period for
short and infragravity waves.
More than 400 XBEACH_GPU runs were computed during the calibration process, with
varying friction coefficient (Cf, fw), eddy viscosity (nuh) and the wave breaking parameter
(gamma).
The best overall performance was achieved with Cf=0.01, fw=0.25, gamma=0.55 and
nuh=0.25, giving a root mean square (RMS) error across the four selected events of:
0.09 m for the wave set-up,
0.02 m for the Infragravity wave height, and
0.055 m for the short wave height.
It is to be noted that the RMS error is only indicative and might not reflect the modelling
error when simulating extreme waves (Hs>10 m).
Figure 19: Oceanographic instrument deployment's location (Red: Virtuoso, Blue: TWR, Orange: AWAC).
Pacific Community: Geoscience, Energy and Maritime Division 18Probabilistic cyclone and swell-driven inundation hazard assessment, Lenakel, Tanna, Vanuatu
Figure 20: Wave data recorded by the AWAC off Lenakel
III. Swell-driven inundation hazard assessment
III.1 Background
The island of Tanna in the southern part of Vanuatu is exposed to the ocean swells. The
mean wave condition map in Figure 21 shows large waves generated by extra-tropical
storms within the southern ocean storm belt, between -40° and -60° latitude. As these high
waves travel away from the storm, they become swells characterised by a long wave period
and, in turn, a high wave power. Swell events in Tanna Island can be relatively severe, with a
99th percentile wave height greater than 3.5 m (Figure 22).
Under the European-funded Wave and Coast in the Pacific (WACOP) project, a wave climate
report based on hindcast wave model data from Trenham 2013 was developed for Lenakel
for an offshore location. The wave climate offshore Lenakel is moderate and dominated by
southern swells (Hs=1.3, Tp=12.58s, Dm=188°) with the most energetic swells reaching
Lenakel between March and August (Bosserelle C. et al. 2015).
Swells can travel long distances across the Pacific and can cause high impact inundation
events on the coastal zone, as described in Hoeke et al. 2013. An inundation event is
triggered by the non-linear interaction between the offshore wave condition, the offshore
water level condition and the coastal geomorphology. Thus, a probabilistic swell-driven
inundation hazard assessment requires investigation of the possible offshore ocean
conditions (wave and water level), as well as the translation of these offshore conditions
into inundation run-up information.
Pacific Community: Geoscience, Energy and Maritime Division 19Probabilistic cyclone and swell-driven inundation hazard assessment, Lenakel, Tanna, Vanuatu
Figure 21: Mean wave height (colour-coded) and direction (black arrows) based on 30 years global wave
hindcast developed with BoM (ref. SPC WACOP website: http://wacop.gsd.spc.int)
Figure 22: 99th Percentile wave height across the pacific region based on ~30 years hindcast wave information
developed by BoM – ref. SPC WACOP website: http://wacop.gsd.spc.int).
III.2 Methodology
In recent years, methodologies used for inundation hazard assessment (Figure 23) in the
Pacific region have been restricted to quantifying the likelihood of an offshore ocean
condition characterised by the co-occurrence of two variables; usually wave height and total
water level (Stephens & Gorman 2010; Damlamian et al. 2015). While this methodology is
commonly used, it can lead to an underestimation of extreme events. Using a single variable
to characterise offshore total water level means that the extreme values are heavily biased
towards the historical co-occurrence of its independent components (tide, storm surge and
Pacific Community: Geoscience, Energy and Maritime Division 20Probabilistic cyclone and swell-driven inundation hazard assessment, Lenakel, Tanna, Vanuatu the mean level of the sea. Similarly, for the wave, this methodology characterised an extreme ocean wave condition using wave height (a representative wave period and wave direction can be predefined). The methodology implemented as part of the KfW project was initially designed by Heffernan & Tawn 2004 and adapted and extended by Gouldby et al. 2014 for coastal inundation application (Figure 24). The method was introduced to the Oceanography Team of SPC during a one-week collaboration workshop with the University of Cantabria (UoC) in December 2016 and tested with data previously collated for Bonriki (Kiribati, Tarawa atoll) under the Bonriki Inundation Vulnerability Assessment project using a 1D inundation model. Figure 23: Methodology using bivariate extreme value analysis in Damlamian et al. 2015 Pacific Community: Geoscience, Energy and Maritime Division 21
Probabilistic cyclone and swell-driven inundation hazard assessment, Lenakel, Tanna, Vanuatu

Figure 24: New methodology based on multivariate extreme value analysis and meta-modelling, adapted from
                                          Gouldby et al. 2014

III.2.1 Generate past ocean conditions off Lenakel.

Past ocean conditions are characterised by six variables: wave height, wave period, wave
direction, tide, storm surge and the mean level of the sea.

Pacific Community: Geoscience, Energy and Maritime Division                                          22
Probabilistic cyclone and swell-driven inundation hazard assessment, Lenakel, Tanna, Vanuatu
III.2.1.1 Wave condition
A 500 m resolution wave model centred on Tanna Island and including the islands of
Eromango, Anatom, Futuna and Aniwa was created using the open source SWAN model
(Booij et al. 1999). The model was nested onto a global hindcast wave model (Trenham
2013) to produce 38 years of high resolution wave information from 1979 to 2016 around
Tanna Island (Figure 25).
Figure 25: Snapshot of the 500
m resolution hindcast wave
model of Tanna during the
May 1996 swell event
Figure 26:
Snapshot of the
HYCOM global
circulation model
hindcast zoomed
around Vanuatu
Pacific Community: Geoscience, Energy and Maritime Division 23Probabilistic cyclone and swell-driven inundation hazard assessment, Lenakel, Tanna, Vanuatu III.2.1.2 Offshore water level condition Tidal harmonics were extracted, based on an analysis of the tide gauge records at the Lenakel wharf (Figure 27). As the tide gauge in Lenakel was recently installed (2016), a longer record of mean level of the sea and storm surge (i.e. inverted barometric pressure) offshore Lenakel was extracted from a 20-year hindcast circulation model: HYCOM (Chassignet et al. 2007) (Figure 26). Figure 27: Analysis of the water level record at the Lenakel tide gauge. Raw data were used to extract tidal harmonics and tidal residual using T_Tide. The tidal residual was decomposed into storm surge and mean level of the sea using an orthogonal wavelet filter. III.2.2 Multivariate extreme value analysis A response function (Stockdon et al. 2006) was used to estimate run-up from the hindcast ocean condition constructed by combining wave and water level data offshore Lenakel. It is to be noted that the response function used to convert ocean condition into run-up is not appropriate to a reef-fronted island environment. While a tailored response function should be used in the future, such as HYCREWS (Rueda et al. 2019), the run-up information is used only to separate the 30% highest historical run-up events from the ocean condition time series. The selected 30% historical events are then de-clustered into their six components: wave height, wave period, wave direction, tide, storm surge and mean level of the sea. The statistical behaviour of each variable and their inter-dependency are mapped to drive a Monte Carlo simulation. The Monte Carlo simulation was used to generate 10,000 years of high sea state ocean condition off Lenakel. Pacific Community: Geoscience, Energy and Maritime Division 24
Probabilistic cyclone and swell-driven inundation hazard assessment, Lenakel, Tanna, Vanuatu

  III.2.3 Meta-modelling for swell inundation scenario

   As physical-based dynamic inundation modelling is computationally expensive, it is
  impractical to attempt simulating a large sample (10000 years) of inundation events. Thus,
  as described in II.5.6, a meta-model following Camus et al. (2011) is created. The meta-
  model for Lenakel’s swell-driven inundation estimates inundation depth according to
  offshore ocean conditions characterised by four variables; wave height, wave period, wave
  direction and the total water level (sum of the tide, mean level of the sea and storm surge).
  The model was trained using 500 inundation scenarios simulated with Xbeach-GPU.

  III.2.4 Inundation map with associated return period

  Following the process described in II.5.7, a swell-driven inundation map was computed for
  20-year, 50-year, 100-year and 200-year return periods.

  Wave projection for Vanuatu under the changing climate was computed by BOM & CSIRO
  2014 for the years 2035 and 2090. The 2090 projected change under RCP8.5 shows a mean
  change in wave height of 0.1 m for the December-March season and no change for the
  June-December season. The projected wave climate also shows no significant change in
  terms of wave period (decrease of 0.1s 0.2s) and wave direction. Thus, similar to II.5.8,
  climate change-driven exacerbation of Lenakel’s swell inundation hazard is only considered
  in relation to sea level rise (SLR). An SLR of 0.64 m is used and represents the projected SLR
  for Vanuatu by 2090 under RCP8.5.

  The swell-driven inundation hazard maps with and without SLR are shown in ANNEX A.

IV.           Coastal hazard and town planning workshop

  This component of the KfW project was designed to develop coastal hazard maps to identify
  vulnerable areas in Lenakel, Tanna, and provide tools and training for the dissemination of
  the information, both at the central and provincial government level.

  In July 2018, SPC organised a two-day workshop on managing coastal hazards, with a focus
  on town planning and zoning in Lenakel, Vanuatu.

  Expected outcome

  The focus of this training workshop was on professional development and was designed to
  improve the understanding of coastal dynamics and impacts on settlements, infrastructure
  and ecosystems, and to develop skills for the application of coastal hazard information to
  town planning and coastal development.

  It is anticipated that the workshop will contribute toward identifying the development of a
  coastal hazards strategy for the municipality of Lenakel by applying the ISO 31000 risk
  assessment framework to coastal zone management.

  A simple risk assessment methodology following a semi-qualitative approach was
  introduced to provincial and central government officers as a tool to convert hazard data
  into actionable information. The methodology, based on the settlement planning work

  Pacific Community: Geoscience, Energy and Maritime Division                                    25
You can also read