POVERTY IN AUSTRALIA 2020 - ACOSS AND UNSW SYDNEY PART 2: WHO IS AFFECTED? - Australian ...
←
→
Page content transcription
If your browser does not render page correctly, please read the page content below
ACOSS AND UNSW SYDNEY

POVERTY IN AUSTRALIA 2020
PART 2: WHO IS AFFECTED?
ACOSS Partners

ISSN: 1326 7124                                                                                                                                 B B & A MILLER
ISBN: 978 0 85871 068 9
                                                                                                                                               FOUNDATION
Poverty in Australia 2020: Part 2 - Who is affected? is published by the Australian Council of Social Service, in
partnership with the University of New South Wales

Locked Bag 4777
Strawberry Hills, NSW 2012
Australia                                                                                                                DAVID
                                                                                                                         MORAWETZ’S
Email: info@acoss.org.au                                                                                                 SOCIAL JUSTICE FUND
Website: www.acoss.org.au

© 2020, ACOSS and UNSW Sydney

This publication is copyright. Apart from fair dealing for the purpose of private study, research, criticism or
review, as permitted under the Copyright Act, no part may be reproduced by any process without written
permission. Enquiries should be directed to the Publications Officer, Australian Council of Social Service.
Copies are available from the address above.

This report is the latest in the Poverty in Australia series, part of the Poverty and Inequality Partnership
between ACOSS and UNSW Sydney. Find out more at
http://povertyandinequality.acoss.org.au

It was drafted by Dr Peter Davidson from needtoknow consulting, based on analysis by Associate Professor
Bruce Bradbury, Dr Trish Hill and Dr Melissa Wong.

This report should be referenced (or cited) as follows: Davidson, P., Bradbury, B., Hill, T., and Wong, M. (2020),
Poverty in Australia 2020: Part 2, Who is affected? ACOSS/UNSW Poverty and Inequality Partnership Report
No. 4, Sydney: ACOSS.

ACOSS and UNSW Sydney would like to thank those individuals who generously shared their stories for this
report.
                                                                                                                                               HART LINE
All photos © Austockphotos (except those on p.7)
                                                                                                                                               AND RAETTVISA
                                                                                                                                               SUB-FUNDS OF
All photos are representative only, except for those of Dr Cassandra Goldie and Professor Carla Treloar.

2      POVERTY IN AUSTRALIA 2020, Part 2: Who is affected?                                                                                                       3
Glossary                                                                           Contents
ABS                           Australian Bureau of Statistics
                                                                                   Foreword                                                      7
ACOSS                         Australian Council of Social Service
                                                                                   Executive Summary                                             9
After housing costs
                              Disposable income minus housing costs
income
                                                                                   Introduction                                                  15

Before housing cost           Disposable income (without any deduction of          1. About this Report                                          18
income                        housing costs)
                                                                                   2. How poverty is measured in this report                     20
CPI                           Consumer Price Index
                                                                                   3. People in poverty in 2017                                  22
ES                            Energy Supplement
                                                                                   4. Poverty rates and profiles in 2017: Detailed break-downs   32
FTB                           Family Tax Benefits
                                                                                   4.1    Age                                                    32
GFC                           Global Financial Crisis
                                                                                   4.2    Gender                                                 35
Main earner                   See Reference person
                                                                                   4.3    Family type                                            37
                              Newstart Allowance (now called JobSeeker
NSA
                              Payment)
                                                                                   4.4    Main income source of household                        38

                              Organisation for Economic Co-operation and
OECD                                                                               4.5    People relying on social security payments             39
                              Development
                                                                                   4.6    Labour force status                                    45
PP                            Parenting Payment
                                                                                   4.7    People with disability                                 48
                              50% of median household after (or before) housing
Poverty line
                              costs income
                                                                                   4.8    Country of birth                                       50

                              Measure of the average depth of poverty for those
Poverty gap                                                                        4.9    Housing tenure                                         51
                              living below the poverty line

                                                                                   4.10   Location                                               53
RA                            Rent Assistance

                                                                                   4.11   Aboriginal and Torres Strait Islander people           53
                              Selected by the ABS to represent the household.
                              This term is used as a proxy for ‘highest income-    Supplementary report: Poverty in households with
                              earner’. Where the reference person is a member of                                                                 55
                                                                                   female and male main earners compared
                              a couple, in 95% of cases the reference person has
Reference person                                                                   Families with children                                        55
                              a higher income than their partner, in 4% of cases
                              they have equal income, and in 1% the reference
                              person has a lower income. Also referred to as       Families without children                                     56
                              ‘main earner’.

UNSW Sydney                   University of New South Wales, Sydney

4     POVERTY IN AUSTRALIA 2020, Part 2: Who is affected?                                                                                             5
Figures and Tables                                                                                Foreword
FIGURES                                          Figure 16: Profile of poverty by labour
                                                 force status of household reference              As we write this Foreword, we are in the grip of the COVID-19 global pandemic
Figure 1: Rate of poverty by age (% of           person (% of people in poverty), 50%             crisis.
                                            33   median income poverty line
people)
                                                    (a) all people                          46    The devastation of COVID-19 has confronted us all with the serious weaknesses
Figure 2: Profile of poverty by age (% of
people in poverty), 50% median income 33            (b) employed fulltime                   48    in our social protection systems. Globally and domestically, people living in
poverty line                                        (c) employed parttime                   48    poverty and without a safe place to call home have been shown to be at far
Figure 3: Rate of poverty among                  Figure 17: Rate of poverty among adults
                                                                                                  greater risk of being hit by the multiple effects of the COVID pandemic, in
children up to 15 years (% of children),    34   with a disability (% of adults), 50%       49    health, social and economic terms.
50% median income poverty line                   median income poverty line
Figure 4: Profile of poverty among               Figure 18: Profile of poverty by disability
                                                                                                  As one of the wealthiest countries in the world, Australia already had an
children up to 15 years (% of children
                                            34   status (% of adults in poverty), 50%        49   unacceptably high rate of poverty amongst its communities. As we reported
in poverty), 50% of median income                median income poverty line                       in January 2020, as at 2017, there were already 3.24 million people (13.6%)
poverty line
                                                 Figure 19: Rate of poverty by country of         including 774,000 children (17.7%) living below the poverty line. That is one in 8
Figure 5: Rate of poverty by gender (%           birth (% of adults), 50% median income     50    people, including one in six children.
of men and women), 50% median               36   poverty line
income poverty line
                                                 Figure 20: Profile of poverty by country         When the COVID pandemic hit, a further estimated 594,000 people lost paid
Figure 6: Profile of poverty by gender           of birth (% of adults in poverty), 50%     50    work1, with too many at risk of falling well below the poverty line, at a time
(% of men and women in poverty), 50%        37   median income poverty line
of median income poverty line                                                                     when we needed everyone to be secure, and have a safe place to live.
                                                 Figure 21: Rate of poverty by housing
Figure 7: Rate of poverty by family type         tenure (% of people), 50% median           52    Too often, the experience of poverty has a largely hidden face. After decades of
(% of people), 50 % median income           37   income poverty line
poverty line                                                                                      demonising and blaming people for their own circumstances, people affected
                                                 Figure 22: Profile of poverty by housing         by poverty have often been silenced and stereotyped in an attempt to divert us
Figure 8: Profile of poverty by family           tenure (% of people in poverty), 50%       53
type (% of people in poverty), 50%          38                                                    from our collective responsibility to end poverty and make sure everyone has
                                                 median income poverty line
median income poverty line                                                                        enough food and a safe place to live, every day, and every night.
                                                 Figure 23: Poverty rates and gaps
Figure 9: Rate of poverty by main                among Aboriginal and Torres Strait         54
household income source (% of people), 38                                                         With the impacts of COVID-19, the human face of people lining up outside
                                                 Islander people, by region, in 2016
50% median income poverty line                                                                    Centrelink brought the experience of falling below the poverty line into stark
                                                 Figure A1: Rate of poverty by gender             and confronting view.
Figure 10: Profile of poverty by main            of household reference person (% of all
household income source (% of people                                                        57
                                            39   people), 50% median income poverty
in poverty), 50% median income                   line                                             This report, the second in our 2020 series, presents you with full reality of the
poverty line                                                                                      different experiences of poverty as at 2017. Becoming unemployed is clearly
                                                 Figure A2: Profile of poverty by gender
Figure 11: Rate of poverty by income             of household reference person (% of all          one.
support payment received by                                                                 58
                                                 people in poverty), 50% median income
household reference person (% of            40   poverty line                                     Based on the latest data from the Australian Bureau of Statistics (ABS), this
people), 50% median income poverty                                                                report identifies and tells the story of the different circumstances that can lead
line
                                                                                                  to people living in poverty in Australia. Although the data is from the 20172
Figure 12: Profile of poverty by                                                                  period, prior to the current COVID-19 pandemic, this report provides a baseline
income support payment received                  TABLES
by household reference person (% of         40                                                    against which to measure changes in the profile of poverty in Australia flowing
people in poverty), 50% median income            Table 1: Poverty Lines by family type,           from the crisis and the policy response.
poverty line                                     2017 ($pw after tax, including social      21
                                                 security payments)                               This report follows the “Poverty in Australia 2020: Part 1 – Overview”, published
Figure 13: Poverty gaps: average gap
between the total disposable income              Table 2: Rates of poverty - percentages          in February 2020. The third report in the series will be on poverty trends. This
of those below the poverty line and         41   of people from different groups living     23
                                                 below poverty lines in 2017 (%)
                                                                                                  is the latest report from the ACOSS/UNSW Poverty and Inequality Partnership,
the relevant poverty line in 2017 ($ per
week), 50% median income poverty line
                                                                                                  a 5-year partnership providing leading research into poverty and inequality
                                                 Table 3: Profile of poverty - percentages
                                                 and numbers of people below poverty
                                                                                                  in Australia combined with advocacy for change to end poverty in Australia.
Figure 14: Social security rate structure                                                  28
in January-March 2018: maximum rates             lines who belong to different groups in          UNSW Sydney partnership researchers
                                            42   2017
of payment for different family types
with no private income ($ per week)              Table 4: Comparison of selected social
Figure 15: Rate of poverty by labour             security payments and poverty lines ($     44
force status of household reference         46   per week, January-March 2018)
person (% of people)

                                                                                                  1   ABS (2020): Labour Force, Australia, Apr 2020. Cat no 6202.0. Australian Bureau of Statistics, Canberra, 2020.
                                                                                                  2   Data is from the 2017-18 period. This has been simplified to 2017 throughout the report.

6    POVERTY IN AUSTRALIA 2020, Part 2: Who is affected?                                                                                                                                                               7
Executive Summary
include the academic lead, Associate Professor Bruce Bradbury, Senior             This report, Part 2 of Poverty in Australia 2020, provides the human face of
Research Fellow Trish Hill and Research Fellow Melissa Wong from the Social       poverty in Australia and explains who is most affected and at risk. Looked at
Policy Research Centre; Professors Bill Randolph and Hal Pawson and Dr Edgar      through the varied aspects of life – our age, gender, family relationships, paid
Liu from City Futures Research Centre; Professors Mark Harris and Evelyne de      work and sources of income, disability and other characteristics - the report
Leeuw and Associate Professor Margo Barr from the Centre for Primary Health       provides an insight into who really lives in poverty, and the nature of that
Care and Equity; and Professor Brendan Edgeworth and colleagues from the          experience.
Faculty of Law. ACOSS partners include Anglicare Australia; Australian Red
Cross; the Australian Communities Foundation Impact Fund (and two sub-funds
– Hart Line and Raettvisa); the BB & A Miller Foundation; the Brotherhood of St   We need to understand poverty before COVID-19 hit in order
Laurence; cohealth; the David Morawetz Social Justice Fund; Good Shepherd         to understand the pandemic’s effects
Australia New Zealand; Mission Australia; the St Vincent de Paul Society; the
Salvation Army; and The Smith Family. We sincerely thank all partners for their   The report is informed by data from the 2017 ABS Survey of Income and
support and contributions to this report.                                         Housing, so it provides us with a solid understanding of the experience of
                                                                                  poverty in Australia before COVID-19 hit. The dramatic effects of COVID-19 are
We would also like to thank UNSW Vice Chancellor Ian Jacobs and UNSW              starting to be understood, with Treasury estimating3 that from February to July
Deputy Vice-Chancellor Equity, Diversity and Inclusion Professor Eileen Baldry    2020, unemployment will double from just over 5% of the paid workforce to
for their support of this partnership, and the ACOSS Board and President for      10% or more, with many others facing income reductions. The extent to which
their continued encouragement of this work.                                       poverty increases as a result of COVID-19 will largely be driven by the extent
                                                                                  to which employment opportunities begin to again open up, and the adequacy
Lastly, we would like to acknowledge the team that worked directly on this
                                                                                  of social protections available to support people without paid work. In the
report from ACOSS and UNSW Sydney: Dr Peter Davidson, Associate Professor
                                                                                  short term, Government intervention is protecting many more people from
Bruce Bradbury, Senior Research Fellow Trish Hill; Research Fellow Melissa
                                                                                  poverty, with the Coronavirus Supplement4 for allowance recipients introduced
Wong, Jacqueline Phillips and Penny Dorsch.
                                                                                  in May 2020. The Supplement roughly doubles the incomes of people receiving
                                                                                  JobSeeker Payment (formerly Newstart Allowance) and Youth Allowance for
                                                                                  people who are unemployed or students, and increases the rate of Parenting
                                                                                  Payment by approximately 60%, at least until September 20205. Further, the
                                                                                  JobKeeper Payment puts a floor of $750 per week under the wages of millions
                                                                                  of people employed by, or stood down from, businesses experiencing a sharp
                                                                                  decline in turnover.
                                                                                  Future ACOSS/UNSW Poverty and Inequality Partnership reports will explore
                                                                                  the impacts of these changes over time. The current report provides a baseline
                                                                                  against which to measure changes to poverty pre and post COVID-19.

                                                                                  Being unemployed remains the greatest risk to living
                                                                                  in poverty
                                                                                  The report confirms that as at 2017 being unemployed and of working age
                                                                                  remains the greatest poverty risk factor, with two-thirds (66%) of people in
                                                                                  households where the main income-earner is unemployed living in poverty. This
                                                                                  is a direct result of the historically very low rate of unemployment payments in
                                                                                  Australia. In January 2018 (mid-point of the ABS Survey period) the single rate
                                                                                  of Youth Allowance (plus Rent Assistance and Energy Supplement) was $164pw
                                                                                  below the poverty line and Newstart Allowance (plus these supplements) was
                                                                                  $117pw below.

    Dr Cassandra Goldie                           Professor Carla Treloar         3    Frydenberg, Josh (2020): Media release: Jobkeeper payment supporting millions of jobs 14 April 2020. Available: https://ministers.treasury.gov.au/ministers/josh-frydenberg-2018/
                                                                                  media-releases/jobkeeper-payment-supporting-millions-jobs
                                                                                  4    Frydenberg, Josh; Morrison, Scott (2020): Media release: Supporting Australian workers and business 22 March 2020. Available: https://ministers.treasury.gov.au/ministers/josh-
                                                                                  frydenberg-2018/media-releases/supporting-australian-workers-and-business
                                                                                  5    Services Australia (2020): A guide to Australian Government payments Services Australia, Canberra, 2020

8   POVERTY IN AUSTRALIA 2020, Part 2: Who is affected?                                                                                                                                                                                                                    9
The very high proportion of public housing tenants living in poverty (58%)
reflects the highly disadvantaged profile of these tenants and the failure of
social security and housing policy settings to meet their basic needs, including
housing, without being driven into poverty.
While those of working age are at greater risk of poverty than older people,
over 65s who are living in private rental face a relatively high risk of poverty
(41%). We will explore the role of housing tenure on poverty rates in the
forthcoming Partnership report Poverty, Property and Place: A geographic
analysis of poverty after housing costs in Australia by Bill Randolph, Edgar Liu
and Bruce Bradbury.
Rent Assistance
$78/week (family with 2 children)
Relying on social security rather than a wage means being
about five times more likely to live in poverty
Households relying mainly on social security payments are approximately five
$550/week $440/week
times more likely to experience poverty (36%) than those relying mainly on
wages and salaries (7%). The highest poverty rates are found in households
where the main earner receives Newstart Allowance (57%), the consequence average 2 Bedroom Flat average 2 Bedroom Flat
of being unemployed with few resources6. This also again reflects the grossly in Sydney in Melbourne
inadequate level of the Newstart (JobSeeker) payment which has been the
focus of a decade long campaign to Raise the Rate of the unemployment
payment. Families with children with a female main income earner are
more than twice as likely to be in poverty as those with a
male main income earner
Renters are almost twice as likely to live in poverty as home More generally, the biggest differences in poverty rates between households
owners with public housing tenants at greatest risk in which the main earner is female, compared with male, is in families with
Australia’s housing affordability crisis again reveals itself in this report, with children. The average poverty rate among people in families with children
renters most at risk of poverty when it comes to different types of housing where the main earner is female is 23%, compared with 10% where the main
conditions. Not surprisingly, the role of housing in aggravating poverty rates is earner is male (which is the more common arrangement).7 In contrast, among
greatest for those renting privately. Taking housing costs into account increases households without children, the average poverty rate where the main earner is
the rate of poverty among people renting privately by 10 percentage points female is 12%, compared with 10% where the main earner is male.
(from 9% to 19%), compared with an increase of 5 percentage points (from 4% Over a third of people in sole parent families in which the main earner is female
to 9%) among home-purchasers and a reduction of 8 percentage points (from live in poverty (37%) compared with 18% in sole parent families in which the
17% to 9%) among home-owners. This points to both high rents (especially in main earner is male, and 10% in partnered families where the main earner is
metropolitan areas) and the inadequacy of incomes (including Rent Assistance). male. This is a startling finding in a country as wealthy as Australia and is a
major contributor to our high child poverty rate (18%).
6 Note that in March 2020, Newstart Allowance (NSA) was renamed JobSeeker Payment. NSA is received by people in all family types, while Parenting Payment (PP) is received by the
main carer of a child aged 7 years or less, whether in a sole parent or couple family.
7 This calculation excludes the ‘other families’ category in Figure A1, which includes families with and without children.
10 POVERTY IN AUSTRALIA 2020, Part 2: Who is affected? 11
Poverty in wage-earning households is concentrated in
                 Gender gap                                                            families with children
                 Among sole parent families where the main earner is
                 female, the rate of poverty is 37% compared with 18% in               The costs of children dramatically change the adequacy of people’s wages in
                 sole parent families where the main earner is male.                   protecting families from poverty.
                                                                                       While rates of poverty are lower in households where the main income-earner
                                                                                       is employed (9%) compared with 66% where the main earner is unemployed, a
                                                                                       large proportion of people in poverty (38%) are in wage-earning households.8
                                                                                       Of these 38% of all people in poverty, 72% are in families with children.9
                                                                                       Underemployment also increases the risk of poverty. Among people in
                                                                                       households headed by a person employed part-time, 15% live in poverty.
                                                                                       Moreover, 36% of wage-earning households in poverty are headed by someone
                                                                                       in part-time employment.10

                                                                                       The solutions to poverty remain clear
                       37%
                       poverty rate
                                                            18%
                                                           poverty rate
                                                                                       This report presents a challenge to policy makers to ensure that, as lock-downs
                                                                                       to prevent the spread of COVID-19 are eased, the incomes and wellbeing of
                                                                                       people at risk of poverty are secured. Specifically, it points to the need to:

Almost half the children in single parent families live in                                   •       Set a serious goal of full employment;
poverty
Overall, the risk of poverty for children in sole parent families is more than three         •       Commit to a flexible employment and training guarantee to improve the
times that for children in couple families. For children in sole parent families, a                  employment prospects of people unemployed long-term;
staggering 44% now live below the poverty line.
                                                                                             •       Permanently lift social security payments (including supplements) to
                                                                                                     above the poverty line to shield people from poverty when they cannot
                                                                                                     secure employment. We cannot go back to the $40 a day Newstart (now
                  Children in sole parent families                                                   JobSeeker) payment;
                  Children in sole parent families are 3 times more likely to
                  live in poverty than children in couple families                           •       Increase Rent Assistance so that it offers real support to people renting
                                                                                                     privately in different rental markets around the country;

                                                                                             •       Build more social housing to improve the supply of secure and affordable
                                                                                                     homes, especially for people at risk of homelessness.

                        44%
                        poverty rate
                                                            13%
                                                           poverty rate

                                                                                       8    This reflects in part the greater number of people in households headed by an employed as distinct from unemployed person.
                                                                                       9    That is, over a third of people in poverty are in wage-earning households.
                                                                                       10    The 72% and 36% figures reported here are not mutually exclusive since many households headed by part-time wage-earners do not have dependent children.

12   POVERTY IN AUSTRALIA 2020, Part 2: Who is affected?                                                                                                                                                                                               13
Introduction

                                                           This report examines the profile of those living below the poverty line in
                                                           Australia.
                                                           It is primarily focused on those living on after-tax household incomes below
                                                           50% of the median (middle) level – the most commonly-used poverty line
                                                           internationally. We take account of wide variations in housing costs by
                                                           deducting them from both the poverty line and household incomes. For
                                                           comparison, we also publish results using the higher 60% of median household
                                                           income poverty line used by the European Union in a number of places in this
                                                           report and on the ACOSS/UNSW Sydney Poverty and Inequality in Australia
                                                           website.
                                                           This report builds on the Overview published in February, which found that:

                                                                 •      The before housing poverty line (50% of median income, before deducting
                                                                        housing costs) for a single adult is $457 per week (pw). Larger households
                                                                        have higher poverty lines. For example, for a couple with two children, the
                                                                        poverty line is $960pw.

                                                                 •      The after housing poverty line is $374 for a single adult. After deducting
                                                                        their housing costs from their incomes, we found that 3.24 million people
                                                                        are living below this poverty line in Australia. This is 14% of the population or
                                                                        over one in eight people.

                                                                 •      The average ‘poverty gap’ is $282 pw. This is the difference between the
                                                                        incomes of people in poverty in various types of families and the poverty
                                                                        line deducting housing costs.11

                                                           Who faces the highest risk of poverty?
                                                           The following groups have poverty rates well above average:
                                                                 •      People in households whose reference person (usually the main income-
                                                                        earner)12 is unemployed (66%);
                                                                 •      Public housing tenants (58%) (reflecting the highly targeted nature of public
                                                                        housing and its scarcity);
                                                                 •      People in households whose reference person is of working age and out of
                                                                        the labour force (45%);
                                                                 •      Children in sole parent households (44%);
                                                                 •      People in households whose reference person receives Youth Allowance
                                                                        (43%), Newstart Allowance (57%), Parenting Payment (54%), or Disability
                                                                        Support Pension (41%);
                                                                 •      People aged 65 years and over who are not home owners or purchasers
                                                                        (39%).13

                                                           13   This is mainly people who are renting their housing, and also includes some whose housing status is neither home owner/purchaser nor renter.
14   POVERTY IN AUSTRALIA 2020, Part 2: Who is affected?                                                                                                                                                       15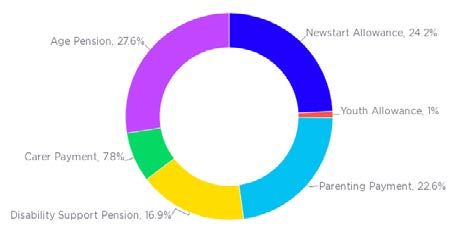
Who are the largest groups among people in poverty?                                                •      Some groups have much lower rates of employment than the overall
                                                                                                          population aged 15-64 years (74% of whom are employed):
Groups with a high share of all people in poverty include:14
      •      Women and girls15 (53%);                                                                     They include sole parents (59%), people with disability (48%), and recent
                                                                                                          migrants from North Africa and the Middle East (30%). This is due to factors
      •      People in households whose main income is social security (51%);                             such as disability, caring roles, and discrimination.16
      •      People of working age – 25-64 years (45%);                                            •      Even before taking account of housing costs, income support payments
      •      People in households whose reference person is of working age and in paid                    (especially for single people) were well below the poverty line in January 2018
             employment (38%);                                                                            (the mid-point of the financial year of the ABS survey).
      •      People with disability (37%);                                                                The single rate of Youth Allowance (plus Rent Assistance and Energy
      •      People in households whose reference person is under 65 years old and not                    Supplement) was $164 pw below the poverty line, Newstart (plus these
             in the labour force - that is, not undertaking paid work or actively seeking                 supplements) was $117 pw below, while the single pension (plus Pension and
             paid work for reasons such as study, retirement, disability etc. (35%);                      Energy Supplements) was closer to it, but still $10 pw below.17
      •      Couple households with children (34%);                                                •      The cost of housing makes the greatest difference to poverty among private
                                                                                                          tenants.
      •      People in households whose reference person receives Age Pension (28%),
             Newstart Allowance (24%), or Parenting Payment (23%).
                                                                                                          Taking housing costs into account increases the rate of poverty among people
This is either due to their large share of the overall population (for example                            renting privately by 10 percentage points (from 9% to 19%), compared with an
wage earning households and couples with children), and/or their elevated                                 increase of 5 percentage points (from 4% to 9%) among home-purchasers and
rates of poverty (for example, people relying mainly on social security and                               a reduction of 8 percentage points (from 17% to 9%) among home-owners.18
people with disability).
                                                                                                   •      Rent Assistance payments for tenants with low incomes are well targeted
                                                                                                          to those in poverty, but poverty is still high among households receiving it
                                                                                                          (32% among private tenants and 43% among community housing tenants).
                                                                                                          This is due to the low rates of Rent Assistance compared with actual rents.
Why do some groups face a much higher risk of poverty than                                                For example, in January 2018 maximum rates of Rent Assistance ($67pw for
others?                                                                                                   singles without children and $78pw for singles with 2 children) were well
                                                                                                          below median rents for one and two bedroom flats in Sydney ($490pw and
Since the poverty measure used here is benchmarked to median (middle)                                     $550pw respectively) and Melbourne ($360pw and $440pw respectively).19
household incomes and takes account of housing costs, the level of household
incomes and housing costs have an impact on poverty.
                                                                                            Families with children where the main earner is female face a higher risk of
The following factors influence poverty rates:                                              poverty. Among sole parent families where the main income earner is female,
      •      People in households without paid employment face a much higher risk of        the rate of poverty is 37% compared with 18% in families where the main income
             poverty than those with earnings, while families on low wages with children    earner is male, and 13% in partnered families with children.20
             to support are among the largest groups in poverty

             Where the household reference person is unemployed, 66% of household
             members are in poverty, and where that person is not in the labour force
             45% are in poverty, compared with 9% where the reference person is
             employed

             On the other hand, since a much higher proportion of all people live in
             households supported by one or more wage-earners, and wages and
             family payments often fail to cover the costs of children, 27% of all people
             in poverty live in families with children with at least one wage-earner to
             support them.
                                                                                            16    ABS (2018), Labour Force, Australia detailed (January 2018); ABS (2019) Survey of disability, ageing and carers, 2018; ABS (2017), Labour force status and Other Characteristics of
                                                                                            Families, June 2017. Note that data for people with disability and sole parents were not available for January 2018. The figure for recent migrants from North Africa and the Middle East refers to
                                                                                            employment status 5-10 years after settlement in Australia.
                                                                                            17   Most pension recipients own their homes, so do not receive Rent Assistance.
                                                                                            18    Here we compare poverty rates ‘before housing costs’ and ‘after housing costs’, as explained in the next section of this report.
                                                                                            19    Housing NSW (2018) op.cit. ; Department of Human Services Victoria (2018) op.cit.
14   These groups are not mutually exclusive.                                               20    As discussed later, we use the ‘reference person’ identified by the ABS as a proxy for the person with the highest income in the household. Where the reference person is a member of a
15   ‘Girls’ in this context means fmales aged over 15 and under 18                         couple, in 95% of cases the reference person has a higher income than their partner.

16        POVERTY IN AUSTRALIA 2020, Part 2: Who is affected?                                                                                                                                                                                                                           17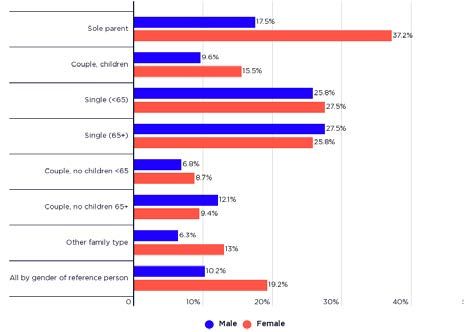
1. About this Report
This is Part 2 of the Poverty in Australia 2020 report, which is the latest in
the Poverty in Australia series, part of the Poverty and Inequality Partnership
between ACOSS and UNSW (Sydney).21
Poverty in Australia 2020 updates estimates of poverty from our previous
reports.
Part 1 (overview) of Poverty in Australia 202022, published in February 2020,
revealed the proportion of all people and children living in poverty in 2017-18
(referred to as 2017 throughout the report for simplicity), the latest year for
which household incomes data are available from the ABS, and trends in overall
poverty levels from 1999 to 2017.
Part 2 breaks the overall figures down to show how rates of poverty vary
among different demographic groups and people with different sources of
income, and also charts the profile of those in poverty in 2017 (for example,
which groups comprise the majority of those living in poverty). It also examines
the reasons some groups face a greater risk of poverty than others.
The third and final part will examine trends in poverty among different groups
from 1999 to 2017.
This information contributes to a better understanding of the extent of poverty,
the circumstances of financially vulnerable and disadvantaged people in
Australia, and the main factors influencing poverty levels.
More details about how the poverty estimates are calculated can be found
on the Methodology Page of the poverty and inequality website at http://
povertyandinequality.acoss.org.au/methodology.                                                     REBECCA’S STORY
                                                                                                   I am a single mother earnestly seeking work for the past years!! (there are just no
                                                                                                   employers willing to take a chance on me - I’m qualified for Business Administration,
                                                                                                   but everyone wants experienced workers...). I receive no child support. I pay $450 rent
                                                                                                   fortnightly, and $65 electricity (I always owe as I simply do not have the money to pay
                                                                                                   on time). I do not drive (I have no-one who can teach me, and at $60 an hour I cannot
                                                                                                   afford lessons). After I pay for food - and I cannot afford to eat fresh fruit/vegetables or
                                                                                                   non-processed meat etc. as it is simply too expensive (and taxis - in regional NSW the
                                                                                                   buses are very unreliable) I have approx $50 remaining, which I spend on medication.
                                                                                                   We do not have the internet, or a decent computer as I cannot afford it - which is an
                                                                                                   issue as my son is in Year 8 and ALL work (including homework) is completed online...
                                                                                                   Teachers simply do not think to accommodate for students where this is not possible.
                                                                                                   My main worry is money. How will I survive? I have never taken my son on holiday (it’s
                                                                                                   an impossible dream) and I can’t give him the basics that others have, which has led
                                                                                                   to bullying and mental health issues for him. I can’t even buy clothes - this winter I will
                                                                                                   freeze (all my clothes are 5 years or older and are quickly becoming worn out) and
                                                                                                   will have to rely on my son’s father to clothe him. I am terrified of the future - when he
                                                                                                   leaves, how will I afford to live??? It honestly scares me to death - when my son leaves
                                                                                                   school, I will be homeless (I already live in some of the cheapest housing in my town, but
                                                                                                   on Newstart alone, I couldn’t even afford that...)
                                                                                                   The public housing in my town is absolutely full, and the waiting list is long... Unless I
21   The companion publication, ‘Inequality in Australia’ profiles income and wealth inequality.
22   Available to download at: http://bit.ly/PovertyOverview                                       miraculously find work, I am screwed.
18         POVERTY IN AUSTRALIA 2020, Part 2: Who is affected?                                                                                                                             19
2. How poverty is measured in this report Table 1: Poverty Lines by family type, 2017 ($pw after tax)
For the purpose of this report, people are in poverty when their household’s 50% of median 60% of median 50% of median 60% of median
disposable income falls below a level considered adequate to achieve an income, before income, before income, after- income, after-
acceptable standard of living. Rather than measure living standards directly housing costs housing costs housing costs housing costs
(for example, by asking people whether they have to go without necessities), (BHC) (BHC) (AHC) (AHC)
we set a benchmark for the adequacy of household incomes of one-half (50%) Lone person $457 $548 $370 $444
of the median or ‘middle’ household disposable income. This is the ‘poverty
line’. For comparative purposes, we also report the number of people who Couple only $686 $823 $555 $665
fall below a higher poverty line set at 60% of median household disposable
Sole parent,
income in Tables 2 and 3 and, for other measures, on the ACOSS/UNSW Sydney $731 $877 $592 $710
Poverty and Inequality Partnership website.23 In this way, we measure poverty 2 children
by comparing the spending capacity of people with low incomes with that of
Couple,
‘middle Australia’. $960 $1152 $776 $932
2 children
It does not follow that these poverty measures are simply measuring overall
inequality, or that poverty cannot be eliminated while income inequality exists.
It can be eliminated by lifting the lowest incomes (including social security Note: The main poverty line used in this report is 50% of median income, after housing costs.
payments, paid working hours and minimum wages) to at least half the median
level. We can also see the direct impact of policy changes on poverty levels, for We report the results of this research in three ways. First, we report the
example the drop in poverty amongst older people associated with the increase percentage of individuals belonging to different groups in households living
in pensions in 2009. below the 50% of median income poverty line, after housing costs.25 This gives
us estimates of the rate of poverty for each group (for example, the risk that
People’s spending power is affected by more than their incomes. This report children in sole parent families will be living in poverty).
also takes account of two factors that have a large impact on the ability of a
household to live decently at a given level of income. Second, we report the percentage of all individuals living below the 50% of
median income poverty line, after housing costs, that belong to different
First, we adjust (or ‘equivalise’) disposable incomes to take account of family groups. This gives us estimates of the profile of poverty for each group (for
size. Clearly, a couple with two children needs more money to achieve the same example, the percentage of all individuals in poverty who are children).
living standard than a single person living alone. Poverty lines are adjusted in
this way, as illustrated in Table 1. So the 50% of median income poverty line Third, we calculate ‘poverty gaps’ for people living below the poverty line. This
for a single person is $457pw in 2017, and for a couple with two children is tells us about the depth or severity of poverty: how far below the poverty line
$960pw. are those living in poverty? The poverty gap is expressed in dollars per week
and as a percentage of the after housing poverty line.
Second, we take account of variations in the largest fixed cost of most low-
income households: housing. At a given level of income, outright homeowners Further detail of the methods used to produce the estimates in this report is
can achieve a much higher standard of living than most tenants or people with contained in the Methodology Page of the poverty and inequality website,
mortgages because their housing costs are lower. This is especially important available at http://povertyandinequality.acoss.org.au/methodology/
when measuring poverty among older people.
To take housing costs into account, a separate set of ‘after housing costs’
(AHC) poverty lines is used (last two columns of Table 1). These are calculated
by subtracting housing costs from disposable income before calculating the
median, so they are lower than the ‘before housing costs’ poverty lines. In 2017
the after-housing costs poverty line for a single adult is $370pw (compared
with $457pw ‘before housing’). The poverty status of each household is
established by deducting its housing costs from its disposable income and
comparing the remaining amount with the after-housing costs poverty line. All
references to the ‘poverty line’ in this report refer to the 50% of median income
after housing costs poverty line, unless otherwise stated.24
23 The 50% of median income poverty line is used by the OECD, while the higher 60% of median income poverty line is used by the European Union. We differ from the OECD approach
by also subtracting housing costs from after-tax income. (Some of the published results from the OECD also use a different adjustment for household size). Australia does not currently
have an official national poverty line, despite our obligation under the Sustainable Development Goals to ‘by 2030, reduce at least by half the proportion of men, women and children of all
ages living in poverty in all its dimensions according to national definitions. See: https://www.un.org/sustainabledevelopment/poverty/.
24 To compare poverty lines with community incomes, such as social security payments, we use the before-housing costs (BHC) poverty lines. 25 The data used are from the latest ABS Survey of Income and Housing (2017). We exclude from the survey sample households reporting zero or negative incomes and self-employed
households, since their reported incomes may not be good indicators of their living standards. Estimates of the total number of people who are below the poverty line (as opposed to the
poverty rate) compensate for these exclusions by inflating the estimates by the ratio of the total population to the non-excluded population. For the overall estimate of poverty numbers,
this is equivalent to assuming that the excluded households (e.g. self-employed households) have the same poverty rate as those not excluded.
20 POVERTY IN AUSTRALIA 2020, Part 2: Who is affected? 213. People in poverty in 2017 Regrettably, the ABS survey on which these data are based does not identify
Aboriginal and Torres Strait Islander people. A separate study by Markham &
As Part 1 of this report revealed, (available at: http://bit.ly/PovertyOverview) Biddle (2017), estimated that 31% of Aboriginal and Torres Strait Islander people
after taking account of housing costs, more than one in eight people (13.6%) are living in poverty, based on the 50% of median income poverty line, but
live below the 50% of the median income poverty line (Table 2). The poverty without taking account of housing costs.28
rate among children is much higher, at more than one in six (17.7%). In total,
there are 3.24 million people in poverty, including 774,000 children (Table 3).26
Table 2: Rates of poverty - percentages of people from different groups living
For comparison, Tables 2 and 3 also include results when the higher 60% of below poverty lines in 2017, after housing costs (%)
median income poverty line (used by the European Union) is adopted. These
figures are not included in the rest of the report but are published on the
ACOSS/UNSW Sydney Poverty and Inequality Partnership website. 2017
We now look beyond the overall numbers to compare the rate and the profile of
poverty among different groups in the population. All people (1) 50% of median 60% of median
The poverty rate (Table 2) refers to the risk of poverty among people drawn All 13.6 21.0
from each group (for example sole parents). The profile of poverty (Table 3)
refers to the share of each group in the population of people in poverty.
By age (1) 50% of median 60% of median
Looking at poverty from these two perspectives yields different results. For
example, the rate of poverty is higher for sole parent families (at 35%) than Under 15 years 17.7 25.7
for couples with children at 11% (Table 4). There are, however more couples
with children than sole parents overall, so a higher proportion of people below 15 – 24 years 13.9 19.3
the poverty line come from partnered families: 34% from couple families with
25 – 64 years 11.8 17.2
children compared to 18% from sole parent families (Table 5) when using the
50% poverty line. 65 years +, owner/purchaser 10.0 24.1
Table 2 shows that the following groups face an elevated risk of poverty (20% 65 years +, renting 41.0 58.1
or more), compared with the overall rate of 13.2%:
• People in households whose reference person (usually the main income- Children (1) 50% of median 60% of median
earner) is unemployed (66%);
• Public housing tenants (58%) – reflecting the highly targeted nature of Children in sole parent households 44.2 56.1
public housing and its scarcity; Children in couple households 12.7 19.7
• People in households whose reference person receives Newstart Allowance
(57%), Parenting Payment (54%), Youth Allowance (43%) or Disability Children in other households 6.5 20.1
Support Pension (41%);
All children 17.7 25.7
• People aged 65 years and over who do not own/purchase their home (41%)27
• People in households whose reference person is of working age and out of By gender (1) 50% of median 60% of median
the labour force (45%);
• Children in sole parent households (44%); All men & boys 13.1 20.0
• People in households whose main income is social security (36%);
• Single people without children (27%). All women & girls 14.1 21.9
By gender of household reference
50% of median 60% of median
person (3)
Male 10.2 16.5
Female 19.2 28.4
28 This estimate is derived from 2016 Census data, using a before-housing poverty measure and the same equivalence scale as the present study. This is likely to result in a lower poverty
26 Part 1 of this year’s Poverty in Australia report examined some of the main drivers of our overall level of poverty, and also reported on ‘poverty gaps’: the average gap between the rate than the method used in this study because before-housing poverty rates are generally lower. Further, the relatively high level of non-declaration of income among Aboriginal and
incomes of those below the poverty and the poverty line itself. Find out more at http://povertyandinequality.acoss.org.au Torres Strait Islander census respondents reduces estimated poverty rates (Markham F & Biddle N (2017): Income, poverty and inequality - Census Paper 2 Centre for Aboriginal Economic
27 This is mainly people who are renting their housing, and also includes some whose housing status is neither home owner/purchaser nor renter. Policy Research, Australian National University, Canberra).
22 POVERTY IN AUSTRALIA 2020, Part 2: Who is affected? 23By family type (2) 50% of median 60% of median By labour force status (3) 50% of median 60% of median Single, no children (15-64 years) 26.6 33.8 Employed part time Single, no children (65 years+) 26.4 54.6 Single with children 10.6 30.4 Sole parent 35.2 46.9 Couple with children 20.0 27.7 Couple, no children (15-64 years) 7.4 10.9 All 15.2 25.9 Couple, no children (65 years+) 11.3 21.3 Not in labour force 65+ 16.1 32.1 Couple, children 11.1 17.1 Others Other family type 9.0 14.4 Unemployed 65.9 75.7 By main income source (2) 50% of median 60% of median Not in labour force
Adults, by country of birth (4)                                                               50% of median                                60% of median

 Australia                                                                                     11.3                                         17.9

 Major English-speaking country                                                                9.7                                          15.9

 Other country                                                                                 17.5                                         27.1

 All adults                                                                                    12.7                                         19.9

Notes: (1) Refers to all persons in the survey with this characteristic (2) Refers to persons in
households with this characteristic (3) Refers to persons in households where the reference
person (see footnote) has this characteristic (4) Refers to adults with this characteristic.29

Table 3 shows the profile of people living below the two poverty lines - that is,
the percentage of people below the poverty line belonging to each group.
Groups comprising a relatively high share of all people in poverty include:30
       •      Women and girls (53%);
       •      People in households whose main income is social security (51%);
       •      People of working age – 25-64 years (45%);
       •      People in households whose reference person is of working age and in paid
              employment (38%);
       •      People with disability (37%);
       •      People in households whose reference person is under 65 years old and not
              in the labour force (35%);
       •      Couple households with children (34%);
       •      People in households whose reference person receives Age Pension (28%),
              Newstart Allowance (24%), or Parenting Payment (23%).

These groups either have relatively high poverty rates (such as people in
households whose main income is social security) and/or they are a large
proportion of the overall population (such as wage-earning households and
couples with children).                                                                                                                                                                      AIDEN’S STORY
Table 3 also shows the total number of people in poverty in each group.31                                                                                                                    When I was on Youth Allowance I received $540 a fortnight - I was living in a share
                                                                                                                                                                                             house paying $295 a fortnight. I switched over to Newstart in January and I got
                                                                                                                                                                                             $40 more a fortnight taking it up to $580/fortnight.
                                                                                                                                                                                             I need to buy medication for asthma, depression and anxiety. Then there are bills,
                                                                                                                                                                                             so there’s very little left over for food. I was eating once a day - mostly instant
                                                                                                                                                                                             noodles.
                                                                                                                                                                                             I was working in childcare, and studying a diploma in early childhood education
                                                                                                                                                                                             until early this year. The centre closed when the government acquired the land to
                                                                                                                                                                                             upgrade the road. I lost my job and my study placement.
                                                                                                                                                                                             In March JobSeeker came in and now I get $1137 fortnight. I’m eating properly now.
                                                                                                                                                                                             I’ve been able to buy new clothes, and shoes, for the first time in years, and afford
                                                                                                                                                                                             all my medications. I’ve been able to save and pay my bills on time. I’ve been able
29    Includes community housing tenants.
                                                                                                                                                                                             to pay off debts I owed for previous bills - for electricity and gas.
30    These groups are not mutually exclusive.
31    Note however, that total estimates of people in poverty derived from data in this table exclude self-employed people and people in households with zero or negative income, so would
be lower than those in table 2 (so we haven’t included the total figures). The reason for this is explained in the Methodology Paper.

26          POVERTY IN AUSTRALIA 2020, Part 2: Who is affected?                                                                                                                                                                                                                27
Table 3: Profile of poverty - percentages and numbers of people below poverty
Households, by family type, cont. 50% of 60% of 50% of 60% of
lines who belong to different groups in 2017, after housing costs (2) median median median median
PROFILE OF POVERTY NUMBERS IN POVERTY Couple, no children (15-64
6.5 6.2 174 000 257 000
(% of all people below (No. of people below poverty years)
poverty lines) lines, excl. self employed)
Couple, no children (65 years+) 7.3 8.8 195 000 367 000
50% of 60% of 50% of 60% of
By age (1)
median median median median Couple, children 33.9 33.7 913 000 1 402 000
Under 15 years 23.9 22.5 643 000 936 000 Other 13.6 14.0 366 000 582 000
15 – 24 years 13.1 11.8 353 000 490 000 All people in poverty 100.0 100.0 2,689,000 4,158,000
25 – 64 years 45.3 42.8 1 217 000 1 779 000 50% of 60% of 50% of 60% of
By main income source (2)
median median median median
65 years +, owner/purchaser 10.4 16.3 281 000 676 000
Wage and salary 37.8 40.1 1 016 000 1 666 000
65 years +, renting 7.3 6.7 196 000 277 000
Social security payments 50.8 51.3 1 365 000 2 133 000
All people in poverty 100.0 100.0 2 689 000 4 158 000
Other income 11.4 8.6 307 000 360 000
50% of 60% of 50% of 60% of
Children (1)
median median median median All people in poverty 100.0 100.0 2,689,000 4,158,000
Children in sole parent By social security payment type 50% of 60% of 50% of 60% of
41.4 36.1 266 000 338 000
households (3) median median median median
Children in couple households 57.1 60.7 367 000 568 000
Newstart Allowance 24.2 17.6 301 000 354 000
Children in other households 1.5 3.2 10 000 30 000
Youth Allowance 1.0 0.6 13 000 13 000
All children in poverty 100.0 100.0 643,000 936 000
Parenting Payment 22.6 18.4 281 000 370 000
50% of 60% of 50% of 60% of
By gender (1)
median median median median
Disability Support Pension 16.9 13.9 97 000 183 000
Carer Payment 7.8 9.1 210 000 280 000
All men and boys 47.1 46.6 1 266 000 1 938 000
Age Pension 27.6 40.3 343 000 809 000
All women and girls 52.9 53.4 1 423 000 2 220 000
All people in poverty in
Household reference person
46.9 49.2 1 262 000 2044 000 households whose reference 100.0 100.0 1 244 000 2 009 000
(male)
person receives income support
Household reference person
53.1 50.8 1 427 000 2114 000 As a percentage of all people in
(female) 46.3% 48.3% 2,689,000 4,158,000
poverty
All people in poverty 100.0 100.0 2,689,000 4,158,000
50% of 60% of 50% of 60% of
By labour force status (3)
50% of 60% of 50% of 60% of median median median median
Households, by family type (2)
median median median median
Employed fulltime 24.4 26.2 655 000 1 091 000
Single, no children (15-64 years) 11.6 9.6 312 000 397 000
Single with children 6.1 5.8 40 000 63 000
Single, no children (65 years+) 9.1 12.2 246 000 508 000
Couple with children 72.1 74.4 473 000 812 000
Sole parent 18.0 15.5 483 000 644 000
Other 21.7 19.8 142 000 216 000
28 POVERTY IN AUSTRALIA 2020, Part 2: Who is affected? 2950% of 60% of 50% of 60% of 50% of 60% of 50% of 60% of
By labour force status, cont. (3) Adults, by country of birth (4)
median median median median median median median median
Employed part time 13.9 15.3 375 000 637 000 Australia 59.3 59.4 1 213 000 1 915 000
Single with children 9.3 15.7 35 000 100 000 Major English-speaking country 7.6 7.9 155 000 255 000
Couple with children 50.5 41.2 189 000 262 000 Other country 33.2 32.6 679 000 1 052 000
Other 40.2 43.1 151 000 275 000 All adults in poverty 100.0 100.0 2 046 200 3 222 000
Employed 38.3 41.6 1 030 000 1 728 000 Note: Totals exclude self-employed and people in households with zero or negative income, so do
not add up to our estimate of 3.24m people overall (an estimate which includes these groups).
Unemployed 8.0 5.9 215 000 247 000
(1) Refers to all persons in the survey with this characteristic (2) Refers to persons in households
Not in labour force, under 65 with this characteristic (3) Refers to persons in households where the reference person has this
18.7 24.2 941 000 1 179 000
years characteristic (4) Refers to adults with this characteristic.32
Not in labour force, 65 years + 35.0 28.3 503 000 1 005 000
32 See the definition of reference person in footnote 10
All people in poverty 100.0 100.0 2,689,000 4,158,000
50% of 60% of 50% of 60% of FREYA’S STORY
By housing status (2)
median median median median
I started Uni in March 2019 and was receiving Youth
Owner without a mortgage 16.6 22.0 447 000 915 000 Allowance getting $300/fortnight. I was living with my
mother and caring for her and paying $450/fortnight in
Owner with a mortgage 27.5 26.7 740 000 1 110 000 rent - so I’ve always had to work to make ends meet.
Private rent 36.8 34.8 988 000 1 448 000 I was working in a cafe about 25-30 hours/week -
making about $200/week - which was the most I could
with Rent Assistance 23.5 22.2 632 000 924 000 earn before Centrelink started reducing my Youth
Allowance payments. My shifts were 5am-10am four
without Rent Assistance 13.3 12.6 356 000 525 000 days a week and all day Sunday - and then going to uni
Public rent 12.5 10.0 337 000 417 000 fulltime, so it was exhausting and not sustainable.
I have osteo-arthritis in my hip from an injury which has
Other: 6.5 6.4 176 000 268 000
caused a lot of pain and expense. I rely on painkillers
with Rent Assistance 2.7 2.4 73 000 101 000 and anti-inflammatory medication to be able to work,
as in hospitality you need to be on your feet for hours.
without Rent Assistance 3.8 4.0 103 000 166 000 I was told I need a hip replacement, but on Medicare I’d
be on a waiting list for more than two years. When the
All people in poverty 100.0 100.0 2,689,000 4,158,000 COVID shutdown hit, the bar I worked in closed and I
50% of 60% of 50% of 60% of lost my job. I didn’t qualify for JobKeeper because I had
Adults, by disability status only been in that job for two months.
median median median median
Disability, core activity But I did get the COVID Supplement and that brings my
36.7 38.6 752 000 1 243 000 total payment to $1100/fortnight, and now I can afford
restriction
private health insurance of $50/week, which means I
Disability, no core activity
14.4 15.6 295 000 502 000 can qualify for hip replacement surgery within a year.
restriction
All with a disability 22.3 23.0 457 000 741 000
All without a disability 63.3 61.4 1 295 000 1 979 000
All adults in poverty 100.0 100.0 2 046 200 3 222 000
30 POVERTY IN AUSTRALIA 2020, Part 2: Who is affected? 314. Poverty rates and profiles in Figure 1: Rate of poverty by age (% of people)
2017: detailed break-downs
This chapter examines the level and profile of poverty among different groups
in the population in 2017 in more depth, along with brief analysis of factors
contributing to poverty among each group. These data are shown in summary
form in Tables 2 and 3 above.
Note that, unlike Tables 1 and 2, data in this chapter do not include results
using the higher 60% of median income poverty line. For readers who wish to
compare the higher 60% of income poverty line, these data can be found at
http://povertyandinequality.acoss.org.au
4.1 Age
The average rate of poverty declines with age (Figure 1).
The rate of poverty among children (discussed in detail in the next section) Figure 2: Profile of poverty by age (% of people in poverty), 50% median
is 18% based on the 50% of median income poverty line. Contributing income poverty line
factors include the impact of caring responsibilities on parents’ employment
participation, the direct costs of children (as measured using the equivalence
scale), and the adequacy of Government financial assistance to families,
including income support and Family Tax Benefits.
The poverty rate among young people (15-24 years) is also above average at
14%. Young people who are not living with their parents, and are unemployed
or under-employed, are more likely to be in poverty. In 2018, 30% of people
aged 15 to 25 years were underutilised in the labour force (unemployed, under-
employed or marginally attached to the labour force).33
Among people aged 25 to 64 years, poverty rates are somewhat lower (at 12%).
People 65 years and over who own or are buying their home are less likely to
experience poverty than the rest of the population when the 50% poverty line
is used (10%) This difference reflects the close proximity of the Age Pension
to the 50% of median income poverty line before-housing costs are taken
into account (see Table 5 below).To illustrate the profound impact of housing
costs on poverty rates among older people, Figure 1 also shows the poverty
rate among the 10% of older people who rent their homes is over four times
that for older people who own or are purchasing their home (at 41% and 10%
respectively).34
Child poverty
Turning to the age profile of those in poverty (Figure 2) the largest age group
As indicated, 18% of all children are living in households experiencing poverty
below the poverty line is people of working age (25-64 years), at 45% of all
(Figure 3).
people in poverty. This reflects their high share (53%) of the overall population.
10% of people aged 65 and over in poverty are home-owners or purchasers The risk of poverty is highest for children in sole parent families (44%). The risk
compared with 7% who are renting.35 of poverty for children in sole parent families is more than three times that for
children in couple families (44% compared with 13%).
Factors contributing to the higher rates of child poverty in sole parent families
33 Foundation for Young Australians (2019), The new work reality. Melbourne.
include reliance on a single parental income and lower employment levels
34 Australian Bureau of Statistics (2016): Census of population and housing: Reflecting Australia – stories from the Census, 2016, ABS, Canberra. Available: https://www.abs.gov.au/
ausstats/abs@.nsf/Lookup/by%20Subject/2071.0~2016~Main%20Features~Ageing%20Population~14. This includes a smaller group that is neither renting nor owning/purchasing their
among sole parents (due to a combination of their sole caring responsibilities,
home (such as boarding house residents and people living rent free in granny flats). Poverty rates by housing tenure across all age groups are examined later.
35 This is because 90% of the older population are home owners or purchasers
child care availability, and limited family-friendly employment options).
32 POVERTY IN AUSTRALIA 2020, Part 2: Who is affected? 33In June 2017, 59% of sole parents with dependent children were employed 4.2 Gender
compared with 94% of couple households with children in which at least one
partner was employed.36 This means a higher proportion of sole parents rely on Figure 5 shows that women are more likely to live in households below the
social security payments, which generally sit below the poverty line. Poverty poverty line than men (14.1% as against 13.1% for men).
among sole parent families without paid work deepens when the youngest child
Figure 6 shows that a majority of individuals in poverty (including children) are
reaches eight years and the parent is transferred from Parenting Payment to
women or girls (52.9%).
Newstart (now JobSeeker) Allowance.37
This report adopts the conventional approach to poverty research and focusses
Nevertheless, most children in poverty are in couple families, (57%) since
on household incomes. While beyond the scope of this study, it is worth noting
a much greater share (82%) of all children live in these families.38 However,
that if we focussed instead on differences in personal incomes between men
children in sole parent families are over-represented at 41% of all children in
and women, the gaps between them are likely to be much larger.39
poverty respectively (Figure 4).
39 In 2016-17, men spent twice as long as women in paid work and women spent twice as long as men in unpaid work. Just over one in five (22%) Australian men aged 20-74 years
was not in the paid labour force in 2016-17, compared with one in three women in this age group (34%). Almost half of employed women worked part time (45%), compared with 16% of
Figure 3: Rate of poverty among children up to 15 years (% of children), 50%
employed men, and the average female hourly wage was 89% of the average male wage (non-managerial adult hourly ordinary time cash earnings). Men aged 55-64 in 2015-16 had a much
higher average superannuation balance than women the same age: $310,145 compared with $196,409. (ABS (2017): Gender indicators, Australia, September 2017, Catalogue No 4125.0).
median income poverty line
CARYN’S STORY
The Newstart payment of $540/fortnight was barely enough money to pay essentials.
I’m 63 years old and can’t get the pension until April 2023. I’ve been lucky that my bank
manager put me on interest only repayments for my mortgage two years ago, so I just pay
$500/fortnight to keep the roof over my head.
My bills have always been my priority, especially the mortgage, because I have to have
somewhere to live. I was homeless with my daughter when my marriage broke up 20 years
ago, we lived in the car and then a hostel. I never want to be homeless again.
On Newstart each fortnight I was $350 short to pay my mortgage and all the household
utilities - electricity, gas, rates, water, insurance, car rego. There was never enough money
for food – I haven’t been to a supermarket in seven years. I make sure I get milk and bread,
but meat and vegetables are not regular in my household. I’ll have a meal once a day, or
every couple of days. I can go a week just on
Figure 4: Profile of poverty among children up to 15 years (% of children in milk or milk shakes.
It’s not surviving, it’s just existing.
I now have Osteoarthritis in my left leg,
and I often don’t have enough money for
medication. Some weeks I have to choose
between buying a bottle of milk and a pack
of painkillers - how bad is it that? I have
another friend who is on the pension and
sometimes we share a pack of Panadol.
With the extra Coronavirus payment I
now get $1100 a fortnight, which is just
enough to cover the mortgage ($500/
fortnight) and $386 a fortnight for other
bills and commitments, and to buy food and
poverty), 50% of median income poverty line: medication.
I would like to say to Scott Morrison and
36 ABS (2017), Labour force status and Other Characteristics of Families, June 2017 .
Josh Frydenberg: ‘You’ve got no idea how
37 Baxter J et al (2012): ‘Parental joblessness, financial disadvantage and the wellbeing of parents and children’ Occasional Paper No. 48, Department of Families, Housing, Community people like myself are really struggling to
Services and Indigenous Affairs, Canberra.
38 ABS (2017), op cit. just exist, not live.’
34 POVERTY IN AUSTRALIA 2020, Part 2: Who is affected? 35You can also read