Spatial structure in migration routes maintained despite regional convergence among eastern populations of Swainson's Thrushes
←
→
Page content transcription
If your browser does not render page correctly, please read the page content below
Bégin-Marchand et al. Movement Ecology              (2021) 9:23
https://doi.org/10.1186/s40462-021-00263-9

 RESEARCH                                                                                                                                          Open Access

Spatial structure in migration routes
maintained despite regional convergence
among eastern populations of Swainson’s
Thrushes
Camille Bégin-Marchand1* , André Desrochers2, Philip D. Taylor3,4, Junior A. Tremblay1,2, Lucas Berrigan4,
Barbara Frei5,6, Ana Morales7 and Greg W. Mitchell8,9

  Abstract
  Background: Migratory connectivity links the different populations across the full cycle and across the species
  range and may lead to differences in survival among populations. Studies on spatial and temporal migratory
  connectivity along migration routes are rare, especially for small migratory animals.
  Methods: We used an automated radio-telemetry array to assess migratory connectivity en route and between
  early and later stages of the fall migration of the eastern populations of Swainson’s Thrush, and to assess the
  variation of migration pace between consecutive detection from the different receiving stations along the
  migratory journey. We tracked 241 individuals from across eastern Canada to determine if populations were mixing
  around the Gulf of Mexico. We also tested the influence of tagging longitude, latitude and age on migration pace.
  Results: Migration routes varied and converged towards the northeast coast of the Gulf of Mexico, but in this
  region, populations maintained finer-scale spatial structure. Migration pace increased as birds progressed south,
  independent of age and tagging site.
  Conclusions: We showed that for songbirds, migratory connectivity can be maintained at fine spatial scales despite
  the regional convergence of populations, highlighting the importance of detailed spatial tracking for identification
  of population specific migration routes. Overall, our study provides a portrait of migratory movements of eastern
  Swainson’s Thrush and a framework for understanding spatial structure in migration routes for other species.
  Keywords: Migration pace, Migratory connectivity, Motus, Neotropical migrants, Radio-telemetry

Background                                                                            cycle [55]. Research on migratory connectivity often
Migratory connectivity describes the movements and                                    limits its scope to the breeding and wintering periods
locations of migratory birds across seasons. More pre-                                [14]. Studies linking breeding populations to specific
cisely, it describes where and when different populations                             geographic locations along migration routes are rarer
of a species do or do not converge during the full annual                             [29, 50], particularly for small migratory animals. The
                                                                                      strength of migratory connectivity between the breeding
* Correspondence: camille.begin.marchand@gmail.com                                    grounds and along migration routes is likely driven by
1
 Wildlife Research Division, Environment and Climate Change Canada, 1550
d’Estimauville, Québec, QC G1J 0C3, Canada                                            both proximate and ultimate drivers, including geo-
Full list of author information is available at the end of the article                graphic breeding origin, age, sex, body condition and
                                                                                      evolutionary history [44, 47, 8, 50]. Although individuals

                                       © The Author(s). 2021 Open Access This article is licensed under a Creative Commons Attribution 4.0 International License,
                                       which permits use, sharing, adaptation, distribution and reproduction in any medium or format, as long as you give
                                       appropriate credit to the original author(s) and the source, provide a link to the Creative Commons licence, and indicate if
                                       changes were made. The images or other third party material in this article are included in the article's Creative Commons
                                       licence, unless indicated otherwise in a credit line to the material. If material is not included in the article's Creative Commons
                                       licence and your intended use is not permitted by statutory regulation or exceeds the permitted use, you will need to obtain
                                       permission directly from the copyright holder. To view a copy of this licence, visit http://creativecommons.org/licenses/by/4.0/.
                                       The Creative Commons Public Domain Dedication waiver (http://creativecommons.org/publicdomain/zero/1.0/) applies to the
                                       data made available in this article, unless otherwise stated in a credit line to the data.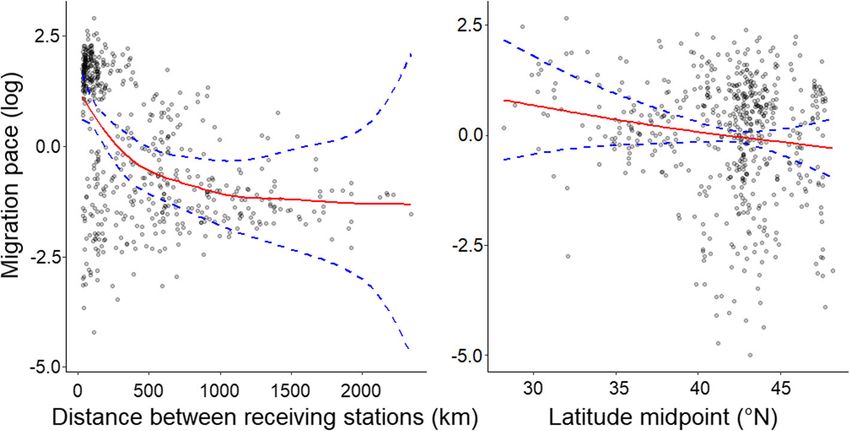
Bégin-Marchand et al. Movement Ecology   (2021) 9:23                                                          Page 2 of 11

from populations with broad longitudinal breeding dis-        hand, such as Motus, provide at least some tracking in-
tributions have different migration routes, at least ini-     formation on almost all individuals tagged and currently
tially, they might converge regionally at important           offers finer-scale spatial tracking information.
refuelling or resting areas [4, 21, 37]. Importantly, it is     Our overall objective was to evaluate the spatial and
unclear whether birds maintain their original popula-         temporal components of migratory connectivity during
tion spatial structure at finer spatial scales within re-     the migration period for eastern populations of Swain-
gions when they aggregate in specific migratory               son’s thrushes and evaluate whether the individuals
routes or stopover sites. Furthermore, another import-        maintained their original population structure through-
ant aspect of migratory connectivity that is currently        out their migration routes. Based on other studies using
understudied is the temporal linkage of individuals,          various intrinsic and extrinsic markers or citizen science
i.e. whether the individuals of the same species are          (described above), we expected that migratory connect-
found at a specific stopover site during the same             ivity would decrease as the birds approach the Gulf of
period of time. Understanding the spatial and tem-            Mexico, i.e. that migration routes would initially differ
poral migratory connectivity of populations during            along a longitudinal gradient and later converge near the
migration can help identify “bottlenecks” that are            Florida peninsula [30, 37]. We also expected that migra-
most likely to affect the survival of entire breeding         tion pace would slow as birds approached the Gulf of
populations, or alternatively, sub-populations [20, 29,       Mexico in the southern United States as they potentially
37, 55].                                                      stopover for longer periods to fuel in preparation to
   The Swainson’s Thrush (Catharus ustulatus) is a long-      undertake an overwater flight to reach their wintering
distance migrant whose breeding range extends from            grounds [4, 5, 37]. We also predicted that, regardless of
western to eastern Canada and portions of the northern        tagging site, adult birds would migrate at a faster pace
United States [33, 51]. Migratory connectivity has been       than juvenile birds given previous knowledge of migra-
shown to be very strong with respect to migration routes      tion routes and a propensity for adults to have a better
for western populations of inland (C. u. ustulatus) and       foraging proficiency [59] and to select more favorable
coastal (C. u. swainsoni) Swainson’s thrush [16, 28, 47].     weather conditions for migration relative to juvenile
However, differences among eastern populations with           birds [15, 39, 58].
respect to migration routes are less clear [5, 30]. Banding
data [8], stable isotope analysis [8], genetic markers [47,   Methods
8] and citizen scientist observations [30, 51] all suggest    Study sites and radio-telemetry array
that eastern populations of Neotropical migrants, includ-     We gathered data on 392 individuals from six bird ob-
ing Swainson’s Thrush, overwinter in Central America          servatories and research stations distributed within the
and northern South America, and likely migrate along          northeastern range of Swainson’s Thrush that were fitted
an eastern migration route converging in the southeast-       with Motus tags between 2014 and 2018. Data from the
ern states, north of the Gulf of Mexico. However, the ac-     eastern Great Lakes (Bruce Peninsula Bird Observatory,
curacy of the migratory movements currently described         hereafter ‘BPBO’: 45.25, − 81.30), southwestern Quebec
are not sufficient to assess migratory connectivity at        (McGill Bird Observatory, hereafter ‘MBO’: 45.43, − 73.94),
finer spatial scales during the migration period.             southeastern Quebec (Parc national des Monts-Valin, here-
   The miniaturization of tracking devices and the            after ‘MV’, 48.61, − 70.83 and Forêt Montmorency, here-
development of automated telemetry networks is now            after ‘FM’, 47.37, − 71.10), the Quebec-Labrador peninsula
allowing researchers to track migratory movements of          (Observatoire d’Oiseaux de Tadoussac, hereafter
small animals at both broad and fine spatial scales [35,      ‘OOT’, 48.16, − 70.83) and the Maritimes (Atlantic
36, 45, 52]. The Motus network is a collaborative radio-      Bird Observatory, hereafter ‘ABO’, 43.45, − 65.82)
telemetry array distributed mainly across the American        were included in the analysis. Individuals were cap-
continent, and mostly in eastern North America [52]. In       tured during fall migration (BPBO, MBO, OOT) or
the last decade, Motus has been used to study move-           directly on their breeding site (FM, MV, ABO). We
ment behavior at regional and continental scales [3, 5,       used different Lotek Avian nanotag models (Lotek,
10, 27, 48]. While geolocators and other archival tags        Newmarket, ON) with distinct burst intervals and es-
have revolutionized our understanding of migration            timated lifespan across years and sites of capture (see
routes and timing, unfortunately, they only provide in-       Supplementary material: Table S2). Together, the
formation on individuals that survived their entire mi-       nanotag and harness weighed less than 4% of the
gration, potentially biasing our understanding of             mean body mass of all captured individuals. This
migration routes to highly philopatric and high quality       mass has been shown not to affect the migration be-
individuals or individuals that took the safest/best migra-   havior of other Catharus species [43, 54]. We re-
tion routes. Automated telemetry networks on the other        moved false detections due to random noise or static
Bégin-Marchand et al. Movement Ecology   (2021) 9:23                                                          Page 3 of 11

near receiving stations within the radio-telemetry           in location latitude at final locations mask this spatial
array, following the method of Crewe et al. [60]. We         structure when only evaluated using a distance ap-
retained detections from the beginning of August to          proach. Second, there could be a situation where migra-
the end of November, between the tagging site and            tion routes cross each other, but where longitudinal
the tip of the Florida peninsula, and excluded detec-        spatial structure (migratory connectivity) is maintained.
tions within 100 km from the tagging site to test for        Again, a distance based approach for derivation connect-
fall migratory movements. Birds captured on their            ivity may mask this spatial structure.
breeding site at the ABO were surrounded by a high             To evaluate migratory connectivity en route, we aggre-
concentration of receiving stations and Swainson’s           gated receiving stations into latitude-longitude cells at 3
Thrush are known to engage in extensive post-                different degree scales (0.01 × 0.01, 0.1 × 0.1 and 1 × 1
breeding movements in this area [6], thus we re-             degree) and noted the presence/absence of every individ-
moved detections within 300 km of the tagging site to        ual for every cell [5]. We built a matrix (individual x in-
exclude post-breeding movements [6].                         dividual) to calculate a Bray-Curtis dissimilarity index
                                                             (0 = individuals are detected at the same cells, 1 = indi-
Differences in migration routes                              viduals are detected at a completely different set of cells)
We estimated (1) spatial migratory connectivity between      [23] with the R package vegan [42]. For this analysis, we
early and later stages of migration and (2) spatial migra-   performed the partial Mantel test [31, 32, 49] to deter-
tory connectivity en route, as well as (3) temporal migra-   mine the correlation between the individual matrix and
tory connectivity en route. Migratory connectivity can be    the tagging location, and to control for year of capture,
estimated by performing a Mantel test [1, 14, 31], which     as the number and position of receiving stations varied
consists of testing the correlation between distance         between 2014 and 2018. To estimate the variation of mi-
matrices from individuals at the origin site to the final    gratory connectivity en route, i.e. at different stages dur-
destination. The resulting Rm varies between 0 (absence      ing the migratory journey between tagging location and
of migratory connectivity among populations) and 1           southeastern U.S, we reproduced the analysis for 16 in-
(strong migratory connectivity, i.e. complete spatial seg-   tervals of 5°latitude between 45°N and 25°N, shifted by
regation of the different populations).                      one degree at each interval (e.g.45–31°N, 44–30°N, 43–
  To compare spatial migratory connectivity between          29°N, …, 29–25.). We performed 10,000 permutations
the early and later stages of migration in Canada and the    for each partial Mantel test [31] and calculated a 95%
U.S., we calculated the geographic distance between in-      confidence interval based on 100 bootstrap samples (see
dividuals at their tagging location (i.e. near or on their   Supplementary material: Table S1 for more information
breeding site) and the geographic distance between indi-     on the result of each interval). To evaluate the temporal
viduals at their last detection [1, 14]. Only individuals    migratory connectivity, we used the same method de-
with at least one detection south of 30°N (south of          scribed above used for spatial migratory connectivity en
northern Florida) were included in this analysis. We         route but we used the Julian dates of detection within
tested the correlation between distances and performed       the latitude interval in of latitude-longitude cells [29].
a Mantel test using 10,000 permutations to determine           Last, to further evaluate the spatial structure of the last
whether distance between individuals at tagging loca-        detections in northern Florida and provide more spatial
tions were correlated with distances between individuals     context to our results from above, we also fitted a multi-
near the Florida peninsula. Analysis were performed          variate multiple regression model of the last detection
with the R package MigConnectivity [14].                     latitude and longitude as a function of tagging longitude
  In addition to evaluating migratory connectivity be-       and year of capture.
tween the early and later stages of migration, we also
evaluated migratory connectivity en route using a differ-    Differences in migration pace
ent approach than that described above (see [5]). Im-        The radio-telemetry receiving array did not allow us to
portantly, while the method described above evaluates        calculate exact in flight ground speeds because detection
connectivity based on correlations of distances between      range and distance between receiving stations were vari-
populations at two points in time, the method described      able. In addition, we cannot assume that movements be-
below accounts for where animals are located geograph-       tween receiving stations were linear. The farther apart
ically in space during migration. This is important, be-     the receiving stations are from one another, the less we
cause despite a potential lack of correlation in distances   can infer the bird’s behavior between them (stopover
between individuals from different populations, there        duration and number, average flight speed, distance trav-
still may be spatial structure present. Consider two ex-     elled, etc.). Thus, we calculated, based on sequential de-
amples. First, there could be situation where migratory      tections between two receiving stations (hereafter
connectivity is maintained longitudinally, but differences   ‘segments’), a migration pace (km/h) using the distance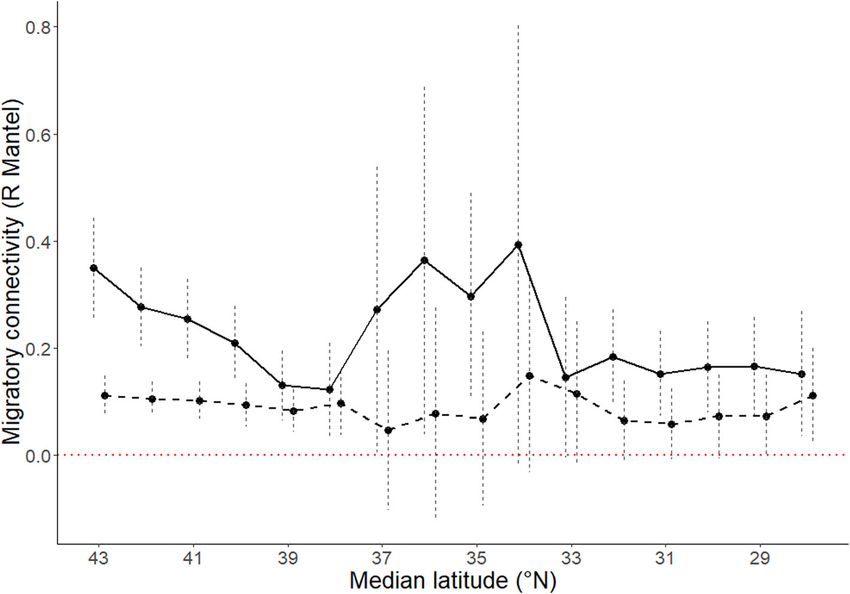
Bégin-Marchand et al. Movement Ecology               (2021) 9:23                                                                     Page 4 of 11

between receiving stations and the time elapsed between                            and latitude had an effect on migration pace (log) (see
the reception of the strongest signal at each receiving                            Table 1 for details on model specification). We included
station within an hour [5, 27]. Thus, we limited the                               year of capture (2014 to 2018) and bird ID as random ef-
underestimation of the distance travelled due to the vari-                         fects. We compared each of the four models using
ation of the detection range among the different receiv-                           second-order Akaike’s Information Criterion adjusted
ing stations [52]. To exclude local movements during                               for small sample sizes (AICc )[26]. AICc is a measure of
stopover [38, 53] and simultaneous detections that result                          model performance, which compares the maximum like-
in unrealistically high migration pace measures, we cal-                           lihood estimates of the models, while penalizing for in-
culated migration pace between detections a minimum                                creasing complexity. Models were ranked according to
of 30 min apart and from two different receiving stations                          the strength of support for each model, using measures
located a minimum of 30 km apart. For each segment,                                of the difference between each candidate model and the
we calculated the midpoint between both receiving sta-                             most informative model (with the lowest AICc) [2].
tions to assess the detection latitude and longitude for                           AICc values were derived using the MuMIn package
each segment. Given that density of the telemetry net-                             [61]. As with our model of migration longitude, we visu-
work is highly variable among regions, bias might be in-                           ally assessed residuals plot of the global model and our
troduced into our measurement of migration pace. For                               best-fitting model (lowest AICc) to assess model fit. We
example, stationary periods like resting or stopover will                          performed model averaging on all four models to test
lower migration pace to a greater extent when receiving                            for the influence of each variable included in our com-
stations are nearby [5]. To illustrate this, consider one                          peting models on migration pace.
hypothetical bird flying at a constant ground speed of
50 km/h which makes an 8-h stop along a 100 km seg-
ment between two stations, yielding a migration pace of                            Results
10 km/h. Now consider another bird with the same                                   Migration routes of eastern Swainson’s Thrush
ground speed making a 30-h stop along a 1000 km seg-                               Of 391 Swainson’s Thrushes tagged in eastern Canada
ment, yielding at a migration pace 20 km/h. The latter                             between 2014 and 2018, we obtained 567 detections (n)
pace is twice as high, despite a stopover lasting more                             for 241 individuals during their fall migration (detected/
than three times that of the first bird. Thus, the inter-                          tagged): eastern Great Lakes (BPBO, 46/49 individuals),
pretation of the migration pace to determine stopover or                           southwestern Quebec (MBO: 55/76 individuals), south-
stationary periods depends on the distance travelled and                           eastern Quebec (MV: 8/8 individuals, and FM: 7/49 indi-
not only on the resulting migration pace itself as a 8-h                           viduals), the Quebec-Labrador peninsula (OOT:, 67/102
stopover period likely has a different ecological function                         individuals) and the Maritimes (ABO: 58/108 individ-
than a staging period > 24-h [4, 37]. Furthermore, birds                           uals). The remaining 151 individuals were not detected
are more likely to exhibit stationary periods as the dis-                          beyond 100 km from their tagging site (300 km for ABO
tance travelled increases, which would have the effect of                          individuals) and were removed from further analysis. In-
decreasing migration pace. Considering those two biases,                           dividuals exhibited a longitudinal gradient divided into
we included the distance between receiving stations as a                           different migration routes between the Appalachian
covariate.                                                                         Highlands and the Atlantic plains (Fig. 1). More specific-
  To analyze migration pace data we built four GAMMs                               ally, individuals tagged at both extremes (west: Great
with the R package mgcv [56] to test which variables, in-                          Lakes i.e. BPBO, east: Atlantic Canada i.e. ABO) were
cluding detection latitude (midpoint), tagging longitude,                          detected by a completely different set of receiving sta-
age (juveniles vs adults) and the interaction between age                          tions before reaching southerner states.

Table 1 Selection of 4 generalized additive models (GAMs) to describe the influence of latitude, tagging longitude, age and the
interaction between age and latitude on migration pace (log) and their relative weight according to Akaike’s criterion. Bird ID and
year of capture were random effects (re) and distance between receiving stations was included as a covariate. The strongest model
(bold) is the full model and the fourth is the null model
Model                                                                                                 AIC       Delta   Model          AIC
                                                                                                                AIC     likelihood     weight
s(tagging longitude) + s(latitude) + age + s(latitude, by = age, m = 1) + s(distance) +               1898.97 0.0       1.0            0.56
s(year(re)) + s(bird ID (re))
s(tagging longitude) + s(latitude) + s(distance) + s(year(re)) + s(bird ID (re))                      1899.72   0.75    0.69           0.39
s(latitude, by = age, m = 1) + age + s(distance) + s(year(re)) + s(bird ID (re))                      1903.75   4.78    0.09           0.05
s(distance) + s(year(re)) + s(bird ID (re))                                                           1908.13   9.15    0.01           0.01
Bégin-Marchand et al. Movement Ecology (2021) 9:23 Page 5 of 11 Fig. 1 Number of birds detected in the Motus network from different tagging locations (solid black circles). Receiving stations were aggregated in cells of 1 × 1 degree. Every individual was counted only once per receiving station. Empty cells are receiving stations with no detections and colored cells represent the number of individuals detected per cell Migratory connectivity a statistically significant dissimilarity index near the Flor- Our migratory connectivity analysis based on distances ida peninsula (e.g. Figure 2, latitude interval: [32,27[, between tagging locations and distances between final rM = 0.17, 95% CI = [0.08, 0.25]). Observations roughly detection locations around Florida was not significant between southern Virginia and northern Florida did not (rM = 0.04 ± 0.04, 95% CI = [− 0.02, 0.12]). This suggests include enough receiving stations for a robust statistical that migrating Swainson’s Thrushes spatially converged interpretation, as expressed by the large 95% confidence around the Florida peninsula, but that distances between intervals (Fig. 2). The size of the latitude-longitude detections at receiving stations around Florida was not squares (0.01, 0.1 and 1 degree) did not change the vari- dependent of the distances between birds at the begin- ation of migratory connectivity along latitude, so we only ning of their tracking. Similarly, our assessment of retained the results for squares of size 1 × 1 degree. spatial migratory connectivity en route, accounting for More information regarding the number of individuals spatial locations of detections, suggests that migratory and detections included in every test (interval) is avail- connectivity decreased swiftly as individuals progressed able in Supplementary material (Table S1). south, and stabilized around 33°N, i.e. roughly near Our multivariate multiple regression supported the Georgia and South Carolina (Fig. 2). However, different finding from our en route analysis, where we found a sig- from our connectivity analysis based on distance, our as- nificant correlation between final detection latitude and sessment of migratory connectivity en route also sug- tagging location (adjusted R2 = 0.18, p = 0.04), however, gested that spatial structure in migration routes was we did not find a relationship between the detection lon- maintained around the Florida peninsula as indicated by gitude and tagging location (adjusted R2 = − 0.01, p = 0.5,
Bégin-Marchand et al. Movement Ecology (2021) 9:23 Page 6 of 11
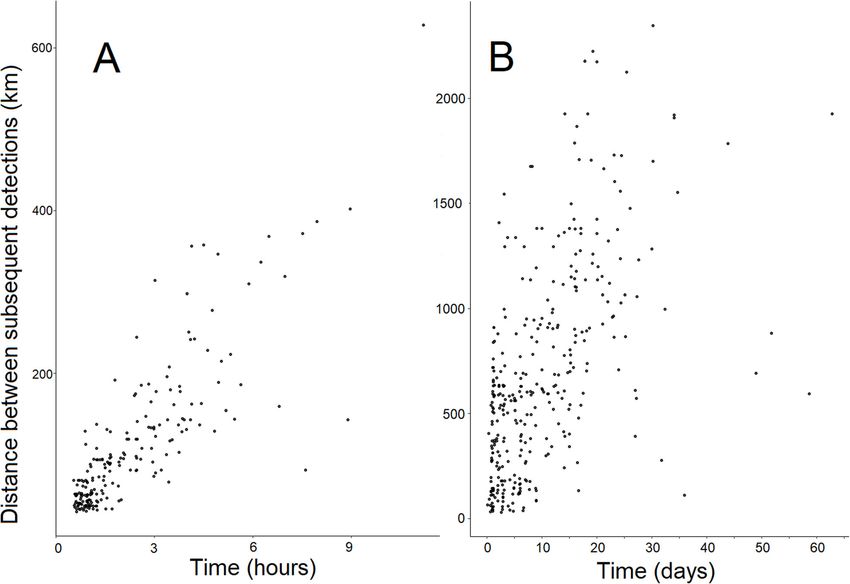
Fig. 2 Variation of the spatial (continuous line) and temporal (hatched line) migratory connectivity (Mantel Rm statistic) en route between tagging
sites along a latitudinal gradient of cells of 1 × 1 degree (values close to 0 = weak migratory connectivity, values close to 1 = strong migratory
connectivity). Populations converged near the Florida peninsula but maintained a finer scale spatial structure (continuous line). We calculated the
median latitude of the 16 intervals of 5°N tested. Observations between 37 and 33 °N did not include enough receiving stations for a robust
statistical interpretation. Populations maintained a temporal segregation (hatched line) in the early stages of migration, but no differences
associated to the origin was found south of 38°N, despite a slight increase, but weak connectivity, in the last detections south of 30°N. Vertical
bars represent 95% confidence limits based on 100 bootstrap samples. The read horizontal line represents the y-intercept = 0
n = 32). Specifically, birds tagged at more western loca- 146.2 km/h (23 ± 24.4 km/h [Mean ± SD]). We detected
tions (BPBO) were detected in southern Florida more so 209 segments occurring on the same day (Fig. 3a), in-
than birds from more eastern locations (ABO, (β = 0.1 ± cluding one daytime segment (mean = 53.3 km/h,
0.04, p = 0.02). range = 10.7–146.2 km/h); and 343 segments more than
Our assessment of temporal migratory connectivity one day apart (Fig. 3b, mean = 6 km/h, range = 0.13–
suggests that migratory connectivity was significant, but 62.6 km/h).
weak and stable until the birds reached North Carolina We evaluated four generalized additive mixed
(median = 38°N, Fig. 2). Migratory connectivity was not models (GAMM) to test the influence of tagging
significant during the subsequent migration route, sug- longitude, age and the interaction between age and
gesting no differences in the timing of the different pop- latitude on migration pace (log), including distance
ulations, but it did increase slightly at more southern between receiving stations as a covariate and year and
latitudes near the Florida peninsula. Overall, are tem- bird ID as random effects (n = 552). The full model
poral connectivity analysis suggests that the different explained 25.4% of the deviance (R2 adjusted = 0.24).
populations had a different migration timing at the be- After performing multi-model inference on all models,
ginning of their route and again, just before crossing or age, the interaction between age and latitude, and tag-
circumventing the Gulf of Mexico. ging longitude had no significant effect on migration
pace. Migration pace decreased swiftly with increasing
Migration pace along a latitudinal gradient distance between receiving stations for short segments
Of the 241 individuals detected during fall migration, 5 distances (< 1000 km) and leveled off for longer
individuals had segments < 30 km and/or < 30 min and segments distances (− 1.26 ± 0.5, p = 0.02, Fig. 4), sug-
were removed from the migration pace analysis. Hence, gesting a lack of variation of migration pace for lon-
the radio-telemetry network recorded 552 segments (i.e. ger segments. Opposite to our prediction, when
sequential detections between two receiving stations lo- controlling for the distance between receiving sta-
cated a minimum of 30 km and 30 min apart) from 236 tions, birds migrated more slowly at more northern
individuals, including 107 juveniles and 129 adult Swain- latitudes, i.e. closer to their breeding range (− 0.21 ±
son’s Thrushes. Migration pace ranged between 0.13 and 0.1, p = 0.03, Fig. 4).Bégin-Marchand et al. Movement Ecology (2021) 9:23 Page 7 of 11 Fig. 3 Time (a: hours, b: days) between successive detections in relation to distance between stations (km)) and migration pace (km/h) of 553 segments from 236 Swainson’s Thrushes for segments within the same day (a) and > 1 day (b). Migration pace is the result of the distance and the time elapsed between two receiving stations. The migration pace does not indicate the ground speed of the birds as the distance between receiving stations is not representative of the distance traveled by the bird Discussion coast of the Gulf of Mexico as observed in western pop- Despite converging through the same area north of the ulations [16, 46, 47]. Unfortunately, the Motus network Gulf of Mexico, Swainson’s thrush populations from array did not cover the coast of Georgia and Alabama across eastern Canada tended to maintain population and thus, we do not know whether some birds crossed specific migration routes. While we expected a decrease the Gulf of Mexico further west. of migratory connectivity due to a general convergence We found evidence that migrating Swainson’s thrushes of birds north of the Gulf of Mexico given presumed mi- maintained population spatial structure near the Florida gration routes, we did not expect to find local spatial Peninsula, however, evidence for this structure varied structure within migration routes in and around Florida. depending on the connectivity analysis carried out. The This finding is important, as it provides evidence for a connectivity analysis based on distances between loca- certain degree of local spatial structure despite regional tions (e.g., [14, 29, 50]) suggested a lack of spatial struc- convergence in migratory songbird sub-populations. ture, whereas our analysis of migratory connectivity en Broadly, the birds from the easternmost tagging site route (e.g., [5]) provides evidence of spatial structure. (ABO) migrated along the Atlantic coast while the west- The latter results was also supported by our multivariate ernmost individuals (BPBO) adopted an inland route analysis, which showed finer scale spatial structure along and were not detected near coastal receiving stations. latitude but not longitude around the Florida Peninsula. Interestingly, given the absence of detections along the Had we focused our analysis on a distance based meas- coast of Texas and Louisiana, most birds likely under- ure of migratory connectivity only, we would have took an overwater flight toward the Yucatán peninsula missed the latitudinal structure observed around Florida. or the Caribbean rather than a route following the west We suggest that the suite of methods that we used in
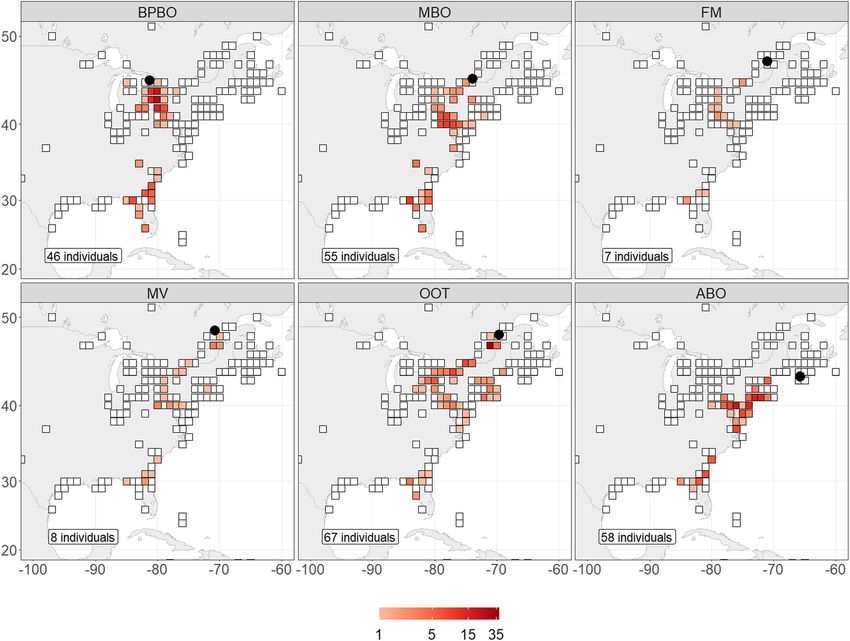
Bégin-Marchand et al. Movement Ecology          (2021) 9:23                                                                              Page 8 of 11

 Fig. 4 Fitted splines for a generalized additive model of the relationship between distance between receiving stations and latitude (smooth
 terms) on migration pace (log). Distance between receiving stations (left) suggest a lack of variation of the migration pace for longer segments.
 Birds have a slower migration pace in northern latitude, closer to their breeding origin (right). Migration paces were slower and more variable in
 northern latitudes suggesting more stopover closer to the breeding grounds

this study to assess connectivity are complimentary and                      non linear displacements between receiving stations,
help paint a more complete picture of how migratory                          such as landscape-scale movements within stopovers
connectivity can vary along migration routes.                                (e.g. foraging or exploratory movements) [38, 53]. The
   While we found evidence for spatial and temporal mi-                      Great Lakes basin, the Gulf of Maine and the Atlantic
gratory connectivity around the Florida Peninsula, des-                      Coast areas are all known to concentrate migratory
pite regional convergence, we did not investigate the                        songbirds during migration, and stopovers are known to
drivers of the local-scale spatial and temporal segrega-                     occur in these regions, as birds determine how to navi-
tion that we observed. Differences in migratory spatial                      gate these potential ecological barriers [7, 34, 41]. There-
and temporal migratory connectivity may be driven by                         fore, the slow migration pace exhibited in these areas
both intrinsic differences among populations in the tim-                     likely reflect stopover activity. Alternatively, the slower
ing of migration and migration routes as well as by dif-                     migration paces observed at more northern latitudes
ferences in extrinsic weather conditions experienced                         might represent a gradual transition and increase in
along the migration route. For example, wind conditions                      movement as birds transition from post-fledging move-
aloft can drive the pace of migration [39] and stopover                      ment and activities to full migratory movements. Swain-
durations, particularly at ecological barriers [18]. Winds                   son’s Thrushes perform longer or more frequent
can also influence migration tracks and thus routes [25].                    stopovers in the southern part of their migration route
Differences in migration routes could also be driven by                      [5]. In our study, we included distance as a covariate to
the age structure of the populations being tagged [6, 15].                   limit potential biases, yet the density of the radio-
For example, juveniles can have different intrinsic migra-                   telemetry network still had a strong influence on the
tion routes or respond differently to wind conditions                        accuracy of the calculated migration pace. A denser
aloft [39], which would likely decrease the strength of                      radio-telemetry array enables researchers to distinguish
migratory connectivity. We suggest examining the rela-                       between sustained flights and extended resting periods
tive importance of intrinsic and extrinsic drivers of mi-                    more readily. In other words, the longer distances be-
gratory connectivity is an important area of future                          tween receiving stations reduced our ability to estimate
research. An important caveat of our results is that in                      migration pace and detect stopovers with confidence.
our study, except for individuals captured directly on                       We highlight an important gap in the Motus network
their breeding site (ABO, FM, MV), the breeding origin                       between southern Virginia and northern Florida, which
of tagged birds could not be established. However, we                        did not allow us to determine stopover activity. Western
believe that breeding origin had little impact on migra-                     “inland” Swainson’s Thrushes monitored with geoloca-
tory connectivity between early and later stages of the                      tors refueled north of the Gulf of Mexico before crossing
migration journey.                                                           the Gulf of Mexico [16]. In our study, most birds de-
   Migration paces for individuals were slower at more                       tected near the Florida peninsula exhibited a clear flight
northern latitudes. Birds likely stayed stationary or made                   pattern with high migration pace suggesting that there
Bégin-Marchand et al. Movement Ecology   (2021) 9:23                                                                           Page 9 of 11

were flying by, or that unlike the Western “inland”            patches [33] and needed during migration and to gain a
population of Swainson’s Thrushes, they might not stop         better understanding of the time required to refuel to
north of the Gulf.                                             understand the migratory strategy of Swainson’s Thrush.
   We found no evidence for a relationship between age           The Motus Wildlife tracking system is an accessible and
and migration pace, although other studies found differ-       effective technology to gather data across a species breeding
ences in migration pace between adults and juveniles           range. The receiving array covered adequately the northern
closer to the breeding sites [6, 39]. Our study captured mi-   part of the coastal plains (Embayed section) and allowed for
gratory movements away from the breeding sites and it is       more accurate tracking of coastal populations like the birds
likely that age differences are less important as birds pro-   originating from the Maritimes. The southern part of re-
gress south and gain experience. Age related differences       gions including Piedmont, Blue Ridge and the Appalachian
may also vary between species given different selection        Plateaus, and East Gulf coastal plains would require supple-
pressures on the pace of migration. Similar to age, we         mentary receiving stations to track more inland migration
found that tagging longitude did not influence migration       routes. Reducing distance between receiving stations by de-
pace. Although they were captured en route, individuals        veloping of more receiving stations within the radio-
tagged at OOT likely originated from the Quebec-               telemetry array would reduce the bias of distance and en-
Labrador peninsula [19], but individuals captured at more      hance the accurate estimation of the migration pace.
southern migratory sites, like BPBO or MBO, may have
originated from a wider region [24]. Other factors includ-     Conclusion
ing moult status, sex, body condition, wing morphology         In summary, our study used birds tagged across the eastern
might have influenced the migration pace [9, 17, 40], but      breeding / migration range (a 1200 km gradient) and pro-
they were not further investigated in this study.              vided the first assessment of migratory connectivity during
   The objective of our study was not to estimate the mi-      the fall migration period for the eastern populations of
gration ground speed of Swainson’s Thrushes. However,          Swainson’s thrush. Importantly, we found that at a broad
we noted a considerable proportion of migration paces          scale, migratory connectivity decreased and birds converged
calculated for segments occurring on the same day were >       geographically as they migrated south. However, despite a
43 km/h (75 p.c. = 43.12 km/h). The high migration paces       weaker connectivity, we show for the first time that a popu-
calculated for segments occurring on the same day might        lation of migratory birds still appeared to maintain finer-
result from an overestimation of the distance between de-      scale spatial structure in their migration routes in a zone of
tection due to the detection range of the receiving sta-       convergence, suggesting that conservation strategies for dif-
tions, the presence of strong winds or tropospheric            ferent breeding populations of migratory birds may need to
propagation [12]. Nevertheless, the high migration paces       consider fine-scale migration routes in the convergence
calculated for segments occurring on the same day are          zone. Our approach provides a framework for understand-
similar to the maximum ~ 80 km/h previously estimated          ing differences in migration routes among populations
for migrating Swainson’s Thrushes with manual radio-           based on detections in the Motus Wildlife Tracking System
telemetry [13]. We recognize that the radio-telemetry          and will ultimately allow for an improved understanding
array had temporal and spatial gaps between receiving sta-     the factors driving migration patterns in Swainson’s Thrush
tions. Nevertheless, the migration paces calculated from       and other species. We hope that our results will encourage
the raw data suggest that migrating Swainson’s Thrushes        additional deployments of receiving stations in the Motus
have the capacity to travel much more than 100 km/day,         radio-telemetry network to fill important geographic gaps
contrarily to what was suggested by previous studies for       and more collaboration among the different research pro-
fall migration (i.e. 100–120 km/day) [57]. Yet, one individ-   jects to achieve a more complete portrait of the migration
ual Swainson’s Thrush previously monitored in spring           phenomenon.
with radio-telemetry traveled up to 375 km/night [13].
Moreover, Gómez et al. [22] estimated the flight range of      Supplementary Information
Swainson’s Thrush to be approximately 680–800 km after         The online version contains supplementary material available at https://doi.
                                                               org/10.1186/s40462-021-00263-9.
a fall stopover in Colombia based on fat deposition and
fuel load, although this does not account for headwinds
                                                                Additional file 1.
that could be encountered during flight. None the less, the
large migration distances observed and the high migration
                                                               Acknowledgements
paces observed do suggest that Swainson’s Thrushes rely        The data were acquired thanks to the Bruce Peninsula Bird Observatory, the
on fewer resting and stopover areas than previously ex-        McGill Bird Observatory, the Observatoire d’Oiseaux de Tadoussac and the
pected to complete their fall migration. It is therefore im-   Atlantic Bird Observatory. Tags were deployed by Stéphane Menu at Bruce
                                                               Peninsula Birds Observatory. We would like to thank the Forêt Montmorency
portant to identify the exact locations of stopover sites to   and the Parc national des Monts-Valin for their support as well as the field
evaluate the habitat used like conifer or deciduous forest     assistants and volunteers for collecting data. We thank the Motus Wildlife
Bégin-Marchand et al. Movement Ecology (2021) 9:23 Page 10 of 11
tracking system for the realisation of this study and the Motus programmers 5. Bégin-Marchand C, Desrochers A, Tremblay JA, Côté P. Comparing fall
who brought technical support. Last, we thank Dr. Kyle Elliott (McGill Univer- migration of three Catharus species using a radio-telemetry network (in
sity) for comments on earlier drafts. press). Anim Migr. 2020;7(1):1–8. https://doi.org/10.1515/ami-2020-0001.
6. Berrigan LE. Post-breeding movements of Swainson’s thrush in Southern
Authors’ contributions Nova Scotia: Acadia University; 2018.
All authors conceived the study design and research objectives. C.B.M., A.D., 7. Bonter DN, Gauthreaux SA, Donovan TM. Characteristics of important
P.D.T., J.A.T. and G.W.M. conceived the analyses used in this study. A.M., and stopover locations for migrating birds: remote sensing with radar in the
B.F., deployed tags at the McGill Bird Observatory, A.D., J.A.T and C.B.M. at Great Lakes Basin. Conserv Biol. 2009;23(2):440–8. https://doi.org/10.1111/j.1
Forêt Montmorency, Parc National des Monts-Valins and Observatoire d’Oi- 523-1739.2008.01085.x.
seaux de Tadoussac, and P.D.T. and L.E.B at the Atlantic Bird Observatory. All 8. Boulet M, Gibbs HL, Hobson KA. Integrated analysis of genetic, stable
authors provided feedback to C.B.M. during data analysis and the editing of isotope, and banding data reveal migratory connectivity and flyways in the
the manuscript. All authors provided their approval for publication. northern yellow warbler (Dendroica petechia; Aestiva group) shorebird
ecology view project on thin ice? Climatic influence on energy flow and.
Funding Ornithol Monogr. 2006;61(1):29–78. https://doi.org/10.1642/0078-6594
The different research projects were funded by Environment and Climate (2006)61[29:IAOGSI]2.0.CO;2.
Change Canada, Université Laval, McGill University, Acadia University, Bird 9. Bowlin MS. Sex, wingtip shape, and wing-loading predic arrival date at
Protection Quebec, and the Kenneth M. Molson Foundation. stopover site in the Swainson’s Thrush (Catharus ustulatus). Auk. 2007;124(4):
1388–96. https://doi.org/10.1642/0004-8038(2007)124[1388:SWSAWP]2.0.
Availability of data and materials CO;2.
The datasets used and/or analysed during the current study are available 10. Brown JM, Taylor PD. Adult and hatch-year blackpoll warblers exhibit
from the corresponding author on reasonable request. radically different regional-scale movements during post-fledging dispersal.
Biol Lett. 2015;11(12):20150593. https://doi.org/10.1098/rsbl.2015.0593.
Declarations 11. CCAC - Canadian Council on Animal Care. 2018. doi: https://doi.org/10.33
82/ps.0472060a.
Ethics approval and consent to participate 12. Chang HT. The effect of tropospheric layer structures on long-range VHF
All handling of birds was performed under standards on the welfare of radio propagation. IEEE Trans Antennas Propag. 1971;19(6):751–6. https://
animals from the Canadian Council on Animal Care (CCAC) [11] and doi.org/10.1109/TAP.1971.1140035.
approved by every institution’s CCAC committee: (Canadian Wildlife Service: 13. Cochran WW. Orientation and other migratory behaviours of a Swainson’s
FM, MV, MBO; Environment and Climate Change Canada: BPBO; McGill thrush followed for 1500 km. Anim Behav. 1987;35(3):927–9. https://doi.
University: MBO; Acadia University: ABO; Department of Forest, Wildlife and org/10.1016/S0003-3472(87)80132-X.
Parks of the Government of Quebec: OOT), and by the Canadian Wildlife 14. Cohen EB, Hostetler JA, Hallworth MT, Rushing CS, Sillett TS, Marra PP.
Service Bird Banding Office. Quantifying the strength of migratory connectivity. Methods Ecol Evol.
2018;9(3):513–24. https://doi.org/10.1111/2041-210X.12916.
Consent for publication 15. Crysler ZJ, Ronconi RA, Taylor PD. Differential fall migratory routes of adult
Not applicable. and juvenile Ipswich Sparrows (Passerculus sandwichensis princeps). Mov
Ecol. 2016;4(1):3. https://doi.org/10.1186/s40462-016-0067-8.
Competing interests 16. Delmore KE, Fox JW, Irwin DE. Dramatic intraspecific differences in
The authors declare that they have no competing interests. migratory routes, stopover sites and wintering areas, revealed using light-
level geolocators. Proc Biol Sci Roy Soc. 2012;279(1747):4582–9. https://doi.
Author details org/10.1098/rspb.2012.1229.
1 17. Deutschlander ME, Muheim R. Fuel reserves affect migratory orientation of
Wildlife Research Division, Environment and Climate Change Canada, 1550
d’Estimauville, Québec, QC G1J 0C3, Canada. 2Université Laval, 2325 Rue de thrushes and sparrows both before and after crossing an ecological barrier
l’Université, Québec, QC G1V 0A6, Canada. 3Acadia University, 33 Westwood near their breeding grounds. J Avian Biol. 2009;40(1):85–9. https://doi.org/1
Avenue, Wolfville, NS B4P 2R6, Canada. 4Birds Canada, P.O. Box 6227, 17 0.1111/j.1600-048X.2008.04343.x.
Waterfowl Lane, Sackville, NB E4L 1G6, Canada. 5McGill Bird Observatory, The 18. Dossman BC, Mitchell GW, Norris DR, Taylor PD, Guglielmo CG, Matthews
Migration Research Foundation, Inc., PO Box 10005, Ste Anne de Bellevue, SN, et al. The effects of wind and fuel stores on stopover departure
QC H9X 0A6, Canada. 6Canadian Wildlife Service, Environment and Climate behavior across a migratory barrier. Behav Ecol. 2016;27(2):567–74. https://
Change Canada, 351 boul. Saint-Joseph, Gatineau, QC K1A 0H3, Canada. doi.org/10.1093/beheco/arv189.
7 19. Émile Brisson-Curadeau, Elliott KH, Côté P. Factors influencing fall departure
McGill University, 21111 Lakeshore Road, Ste., Anne de Bellevue, QC H9X
3V9, Canada. 8Wildlife Research Division, Environment and Climate Change phenology in migratory birds that bred in northeastern North America. Auk.
Canada, 1125 Colonel By Rd., Ottawa, ON K1A 0H3, Canada. 9Department of 2019;137:1–14. https://doi.org/10.1093/auk/ukz064.
Biology, Carleton University, 1125 Colonel By Dr., Ottawa, ON K1S 5B6, 20. Faaborg J, Holmes RT, Anders AD, Bildstein KL, Dugger KM, Gauthreaux
Canada. SAJ, et al. Recent advances in understanding migration systems of New
World land birds. Ecol Monogr. 2010;80(1):3–48. https://doi.org/10.1890/
Received: 22 February 2021 Accepted: 3 May 2021 09-0395.1.
21. Gómez C, Bayly NJ, Norris DR, Mackenzie SA, Rosenberg KV, Taylor PD, et al.
Fuel loads acquired at a stopover site influence the pace of intercontinental
References migration in a boreal songbird. Sci Rep. 2017;7(1):1–11. https://doi.org/10.1
1. Ambrosini R, Møller AP, Saino N. A quantitative measure of migratory 038/s41598-017-03503-4.
connectivity. J Theor Biol. 2009;257(2):203–11. https://doi.org/10.1016/j.jtbi.2 22. Gómez C, Bayly NJ, Rosenberg KV. Fall stopover strategies of three species
008.11.019. of thrush (Catharus) in northern South America. Auk. 2014;131(4):702–17.
2. Anderson DR, Link WA, Johnson DH, Kenneth P. Suggestions for presenting https://doi.org/10.1642/AUK-14-56.1.
the results of data analyses. J Wildl Manag. 2001;65(3):373–8. https://doi. 23. Goslee SC. Correlation analysis of dissimilarity matrices. Plant Ecol. 2010;
org/10.2307/3803088. 206(2):279–86. https://doi.org/10.1007/s11258-009-9641-0.
3. Baldwin JW, Leap K, Finn JT, Smetzer JR. Bayesian state-space models reveal 24. Hobson KA, Van Wilgenburg SL, Dunn EH, Hussell DJT, Taylor PD, Collister
unobserved off-shore nocturnal migration from Motus data. Ecol Model. DM. Predicting origins of passerines migrating through Canadian migration
2018;386:38–46. https://doi.org/10.1016/j.ecolmodel.2018.08.006. monitoring stations using stable-hydrogen isotope analyses of feathers: a
4. Bayly NJ, Rosenberg KV, Easton WE, Gómez C, Carlisle J, Ewert DN, et al. new tool for bird conservation. Avian Conserv Ecol. 2015;10(1). https://doi.
Major stopover regions and migratory bottlenecks for Nearctic-Neotropical org/10.5751/ace-00719-100103.
landbirds within the Neotropics: a review. Bird Conserv Int. 2018;28(1):1–26. 25. Horton KG, Van Doren BM, Stepanian PM, Hochachka WM, Farnsworth A,
https://doi.org/10.1017/S0959270917000296. Kelly JF. Nocturnally migrating songbirds drift when they can andBégin-Marchand et al. Movement Ecology (2021) 9:23 Page 11 of 11
compensate when they must. Sci Rep. 2016;6(1):1–8. https://doi.org/10.103 48. Smetzer JR, King DI, Taylor PD. Fall migratory departure decisions and
8/srep21249. routes of blackpoll warblers Setophaga striata and red-eyed vireos Vireo
26. Hurvich CM, Tsai CL. Regression and time series model selection in small olivaceus at a coastal barrier in the Gulf of Maine. J Avian Biol. 2017;48(11):
samples. Biometrika. 1989;76(2):297–307. https://doi.org/10.1093/biomet/ 1451–61. https://doi.org/10.1111/jav.01450.
76.2.297. 49. Smouse PE, Long JC, Sokal RR. Multiple regression and correlation
27. Imlay TL, Saldanha S, Taylor PD. The fall migratory movements of Bank extensions of the mantel test of matrix correspondence. Syst Zool. 1986;
swallows, Riparia riparia: fly-and-forage migration? Avian Conserv Ecol. 2020; 35(4):627–32. https://doi.org/10.2307/2413122.
15(1). https://doi.org/10.5751/ace-01463-150102. 50. Stanley CQ, McKinnon EA, Fraser KC, Macpherson MP, Casbourn G, Friesen L,
28. Kelly JF, Ruegg KC, Smith TB. Combining isotopic and genetic markers to et al. Connectivity of wood thrush breeding, wintering, and migration sites
identify breeding origins of migrant birds. Ecol Appl. 2005;15(5):1487–94. based on range-wide tracking. Conserv Biol. 2015;29(1):164–74. https://doi.
https://doi.org/10.1890/04-1704. org/10.1111/cobi.12352.
29. Knight EC, Harrison AL, Scarpignato AL, Van Wilgenburg SL, Bayne EM, Ng 51. Sullivan BL, Wood CL, Illif MJ, Bonney RE, Fink D, Kelling S. eBird: a citizen-
JW, et al. Comprehensive estimation of spatial and temporal migratory based bird observation network in the biological sciences. Biol Conserv.
connectivity across the annual cycle to direct conservation efforts. 2009;142(10):2282–92.
Ecography. 2021;44(5):1–15. https://doi.org/10.1111/ecog.05111. 52. Taylor PD, Crewe TL, Mackenzie SA, Lepage D, Aubry Y, Crysler ZJ, et al. The
30. La Sorte FA, Fink D, Hochachka WM, Farnsworth A, Rodewald AD, Motus wildlife tracking system: a collaborative research network to enhance
Rosenberg KV, et al. The role of atmospheric conditions in the seasonal the understanding of wildlife movement. Avian Conserv Ecol. 2017;12(1).
dynamics of North American migration flyways. J Biogeogr. 2014;41(9): https://doi.org/10.5751/ACE-00953-120108.
1685–96. https://doi.org/10.1111/jbi.12328. 53. Taylor PD, Mackenzie SA, Thurber BG, Calvert AM, Mills AM, McGuire LP,
31. Legendre P, Legendre L. Numerical Ecology: Elsevier; 2012. et al. Landscape movements of migratory birds and bats reveal an
32. Lichstein JW. Multiple regression on distance matrices: a multivariate spatial expanded scale of stopover. PLoS ONE. 2011;6:e27054. https://doi.org/10.13
analysis tool. Plant Ecol. 2007;188(2):117–31. https://doi.org/10.1007/s11258- 71/journal.pone.0027054.
006-9126-3. 54. Townsend JM, Rimmer CC, McFarland KP. Radio-transmitters do not affect
33. Mack DE, Yong W. Swainson’s Thrush (Catharus ustulatus), version 1.0. In: seasonal mass change or annual survival of wintering Bicknell’s thrushes. J
Poole AF, Gill FB, editors. Birds of the world. Ithaca: Cornell Lab of Field Ornithol. 2012;83(3):295–301. https://doi.org/10.1111/j.1557-9263.2012.
Ornithology; 2020. https://doi.org/10.2173/bow.swathr.01. Accessed 22 Apr 00378.x.
2021. 55. Webster MS, Marra PP, Haig SM, Bensch S, Holmes RT. Links between
34. McCabe JD, Olsen BJ. Landscape-scale habitat availability, and not local worlds: unraveling migratory connectivity. Trends Ecol Evol. 2002;17(2):76–
geography, predicts migratory landbird stopover across the Gulf of Maine. J 83. https://doi.org/10.1016/S0169-5347(01)02380-1.
Avian Biol. 2015;46(4):395–405. https://doi.org/10.1111/jav.00598. 56. Wood S. Generalized additive models: an introduction with R, second
35. McKinnon EA, Fraser KC, Stutchbury B. New discoveries in landbird edition; 2019. https://doi.org/10.1201/9781315370279.
migration using geolocators, and a flight plan for the future. Auk. 2013; 57. Woodrey MS, Chandler CR. Age-related timing of migration: geographic and
130(2):211–22. https://doi.org/10.1525/auk.2013.130.2.12226. interspecific patterns. Wilson Bull. 1997;109(1):52–67.
36. McKinnon EA, Love OP. Ten years tracking the migrations of small landbirds: 58. Woodrey MS, Moore FR. Age-related differences in the stopover of fall
lessons learned in the golden age of bio-logging. Auk. 2018;135(4):834–56. landbird migrants on the coast of Alabama. Auk. 1997;114(4):695–707.
https://doi.org/10.1642/AUK-17-202.1. https://doi.org/10.2307/4089289.
37. Mehlman DW, Mabey SE, Ewert DN, Duncan C, Abel B, Cimbrich D, et al. 59. Wunderle JM. Age-specific foraging proficiency in birds. Curr Ornithol. 1991;
Conserving stopover sites for forest-dwelling migratory landbirds. Auk. 2005; 8:273–324.
122(2552):1281–90. https://doi.org/10.1126/science.98.2552.466. 60. Crewe TL, Deakin JE, Beauchamp AT, Morbey YE. Detection range of
38. Mills AM, Thurber BG, Mackenzie SA, Taylor PD. Passerines use nocturnal songbirds using a stopover site by automated radio-telemetry. J Field
flights for landscape-scale movements during migration stopover. Condor. Ornithol. 2019;90(2):176–89. https://doi.org/10.1111/jofo.12291.
2011;113(3):597–607. https://doi.org/10.1525/cond.2011.100186. 61. Barton K. MuMIn: multi-model inference. R package version 1.0.0. 2009.
http://r-forge.r-project.org/projects/mumin/.
39. Mitchell GW, Woodworth BK, Taylor PD, Norris DR. Automated telemetry
reveals age specific differences in flight duration and speed are driven by
wind conditions in a migratory songbird. Mov Ecol. 2015;3(1):19. https://doi. Publisher’s Note
org/10.1186/s40462-015-0046-5. Springer Nature remains neutral with regard to jurisdictional claims in
40. Morales A, Frei B, Mitchell GW, Bégin-Marchand C, Elliott KH. Variation in published maps and institutional affiliations.
stopover diurnal activity and migration speed associated with molt status in
migrating Swainson’s thrushes. The Auk: Ornithological Advances; 2021. in
review
41. Morris SR, Richmond ME, Holmes DW. Patterns of stopover by warblers
during spring and fall migration on Appledore Island, Maine. Wilson Bull.
1994;106(4):703–18.
42. Oksanen, J., G. F. Blanchet, M. Friendly, R. Kindt, P. Legendre, D. McGlinn, P. R.
Minchin, R. B. O’Hara, G. L. Simpsons, P. Solymos, M. H. H. Stevens, E. Szoecs,
and H. Wagner. 2019. vegan: community ecology package. R package version
2.5–6. https://CRAN.R-project.org/package=vegan Accessed 22 April 2021.
43. Powell LA, Krementz DG, Lang JD, Conroy MJ. Effects of radio transmitters
on migrating Wood thrushes (Efecto de los Radiotransmisores en Hylocichla
Mustelina migrantes). J Field Ornithol. 1998;69(2):306–15.
44. Ralph CJ. Age ratios and their possible use in determining autumn routes of
passerine migrants. Wilson Bull. 1981;93(2):164–88.
45. Robinson WD, Bowlin MS, Bisson I, Shamoun-Baranes J, Thorup K, Diehl RH,
et al. Integrating concepts and technologies to advance the study of bird
migration. Front Ecol Environ. 2010;8(7):354–61. https://doi.org/10.1890/080179.
46. Ruegg KC, Hijmans RJ, Moritz C. Climate change and the origin of migratory
pathways in the Swainson’s thrush, Catharus ustulatus. J Biogeogr. 2006;
33(7):1172–82. https://doi.org/10.1111/j.1365-2699.2006.01517.x.
47. Ruegg KC, Smith TB. Not as the crow flies: a historical explanation for
circuitous migration in Swainson’s thrush (Catharus ustulatus). Proc R Soc B
Biol Sci. 2002;269(1498):1375–81. https://doi.org/10.1098/rspb.2002.2032.You can also read