Growth, lifetime, directional movement and myosin dependent motility of mutant keratin granules in cultured cells
←
→
Page content transcription
If your browser does not render page correctly, please read the page content below
www.nature.com/scientificreports
OPEN Growth, lifetime, directional
movement and myosin‑dependent
motility of mutant keratin granules
in cultured cells
S. M. Lehmann, R. E. Leube *
& R. Windoffer
Intermediate filament polypeptides (IFPs) are prominent components of cytoplasmic aggregates,
which are pathognomonic for multiple diseases. Recent observations in cultured cells suggest that
they are dynamic and subject to regulated turnover. The emerging concept is that multiple factors
contribute to motility and turnover of IFP-containing aggregates. To understand their relative
contribution, quantitative tools are needed. The current study addresses this need using epithelial
cells producing mutant keratin IFPs that have been identified as the cause of the hereditary blister-
forming skin disease epidermolysis bullosa simplex. Digital image analysis of individual granules
allowed mapping of their complete life cycle, with information on multiple characteristics at any
given time-point. The deduced signet features revealed rapid granule fusion and directed transport
from the periphery towards the cell centre, and a limited, ~ 30 min lifetime with a slow, continuous
growth phase followed by fast disassembly. As paradigmatic proof-of-principle, we demonstrate
that inhibition of myosin II selectively reduces granule movement, linking keratin granule motility
to retrograde cortical acto-myosin flow. The newly developed methods and established parameters
will help in the characterization of known and the identification of novel regulators of IFP-containing
aggregates.
Cytoplasmic protein aggregates are hallmarks of many diseases, which affect various organs and lead to diverse
pathologies such as neurodegeneration, myopathy or epidermal blistering. The protein composition of these
aggregates varies considerably but intermediate filament polypeptides (IFPs) have been shown to be involved in
most instances1–6. Whether and how the different cell type-specific protein aggregates contribute to the respec-
tive pathogenic mechanisms still remains to be elucidated. The initial view that IFP-containing aggregates are
simply static cellular debris has been increasingly questioned in the last decades and various studies support the
view that they are quite dynamic7–10. This has kindled interest in understanding and modulating the dynamic
processes of protein aggregate formation in order to interfere with disease initiation and progression for the
benefit of affected patients.
Epidermolysis bullosa simplex (EBS) is a prototypic protein aggregate-forming disease, which affects the
epidermis. The autosomal-dominant disease is caused by mutations in keratin 5 and keratin 14. It manifests
with severe blistering in response to mild mechanical trauma because of cytolysis in the basal cell layer of the
epidermis3. At the subcellular level, EBS is characterized by disruption of the keratin filament network and occur-
rence of keratin-positive cytoplasmic aggregates3,11,12. Overexpressing EBS-mutant human keratin 14 in mice
phenocopies the EBS p henotype13,14. Similarly, expression of EBS-mutant keratins in cultured cells leads to the
formation of spherical keratin-containing cytoplasmic granules. These culture systems have helped to character-
ize modifiers of keratin granule formation including signalling molecules, heat shock proteins, ubiquitin ligases,
actin filaments and adhesion sites9,10,15–19. The emerging concept is that there is not a single factor responsible
for keratin aggregate formation, turnover and motility but that multiple factors contribute in different ways and
to different degrees. The elucidation of this multifactorial scenario requires sensitive means to qualitatively and
quantitatively assess the contribution of each factor to keratin granule dynamics. We therefore developed imaging
and analysis routines to characterize the dynamic behaviour of mutant keratin granules. We demonstrate that
they can be used to precisely describe at high temporal and spatial resolution the assembly, growth, disassembly,
Institute of Molecular and Cellular Anatomy, RWTH Aachen University, Wendlingweg 2, 52074 Aachen, Germany.
*
email: rleube@ukaachen.de
Scientific Reports | (2021) 11:2379 | https://doi.org/10.1038/s41598-021-81542-8 1
Vol.:(0123456789)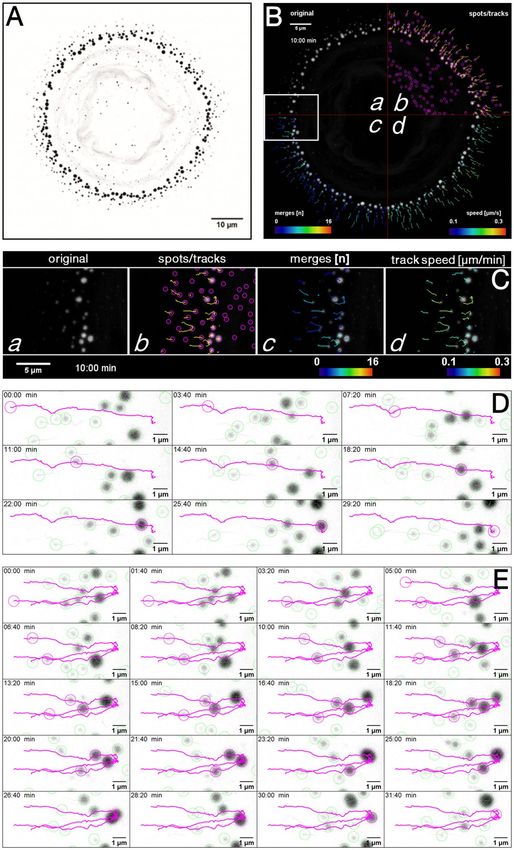
www.nature.com/scientificreports/
lifetime and motility of single keratin granules. As proof-of-principle, we quantify, for the first time, the inhibitory
effect of the actin motor protein myosin II on the speed and persistence of motion of keratin granules.
Results
Automated image analysis allows mapping of the appearance, motility and disappearance of
mutant keratin granules. The scheme in Fig. 1 serves as a guide for the approaches and results described
in this paper. The previously described mammary adenocarcinoma-derived MCF-7 cell line producing fluores-
cent protein-tagged keratin 14 mutant EYFP-K14R125C9 was selected to establish methods for measuring the
dynamic properties of EBS-mutant keratin aggregates. K14R125C is the most frequently mutated residue in EBS
(www.interfil.org).
Figure 2A depicts EYFP-K14R125C granules in a round-shaped, vital MCF-7 cell. The fluorescence micro-
graph confirms previous reports9,10 detecting keratin granules in the cell periphery and a residual network that
is limited to the perinuclear region. Time-lapse fluorescence recording (Movie 1) revealed that nascent keratin
granules appear at different positions close to the cell boundary. The growing granules move towards the cell
centre and disappear at a distinct transition zone, which is approximately 10 µm away from the cell boundary
and coincides with the border between the peripheral, thin lamellum and the inner, much thicker cytoplasm.
The different steps of subsequent image analysis are depicted in Fig. 2B,C (corresponding Movie 2). Starting
with the raw data (Fig. 2Ba,Ca) individual keratin granules were identified by the Laplacian of Gaussian’ detec-
tion implemented in Fiji’s TrackMate plugin (encircled in purple in Fig. 2Bb,Cb). In addition to the peripheral
granules, other, less fluorescent granules were also detected throughout the cytoplasm (blinking spots in Movie
1). The tracking algorithm, however, discarded them because of their short lifetime. On the other hand, the
movement of the more fluorescent and enlarging peripheral granules could be reliably documented. The yellow
tracks in Fig. 2Bb,Cb delineate the movement of single granules that could be followed for 10 or more consecutive
frames. Granules frequently fused with each other, resulting in merging of tracks. Figure 2Bc,Cc show colour-
coded representations of the number of merging events per track superimposed on the fluorescence recording
at time point 10 min. To visualize the speed of granule movement, the displacement rates of entire tracks were
determined and are represented quantitatively in colour code in Fig. 2Bd,Cd.
Figure 2D,E further highlight the quality of the image analyses by showing complete tracks of single keratin
granules from their first detection to their dissolution. Figure 2D (corresponding Movie 3) depicts a granule that
did not fuse with other granules during its ~ 29 min lifetime. We will refer to these track types as "solo" tracks
(Supplementary Fig. S1A). The track selected in Fig. 2E (corresponding Movie 4) represents the movement of
three granules that fused with each other. This track type is referred to as a "merging" track consisting of a "main"
track, which is the longest, in this instance ~ 32 min track, and two shorter "sub tracks", which were ~ 6 min
and ~ 18 min, respectively, in the selected example (Supplementary Fig. S1A).
Taken together, the established conditions and methods provide measurable information on the position,
movement, fluorescence and fusion frequency of mutant keratin granules and the properties derived from them
for entire vital cells at single granule resolution.
Keratin granule fusion occurs randomly but fusion rates correlate with granule size and den‑
sity. We first wanted to find out, whether position, size or density of keratin granules affect their fusion rate.
62.68% of the 820 granule tracks deduced from Movie 1 were of the merging type. The number of fusions ranged
between 1 and 10 (Fig. 3A). Combining track analyses from 6 recordings of 6 different cells showed that fusion
occurred 2.22 ± 0.69-times per track (Fig. 3B). Mapping of the merging events revealed that they occur mainly in
the middle and inner granule-bearing region (Fig. 3C). Cells with a high overall fluorescence, reflecting a large
number of large granules, had a high rate of granule fusion (Fig. 3D). The latter observation may be due to a
higher probability of granule approximation.
Mutant keratin granules have a limited lifetime encompassing a slow growth and rapid disso‑
lution phase. To find out, whether fusion affected the lifetime of keratin granules, the duration of solo and
main merging tracks was compared (Fig. 4A,B). The average lifetime of non-fusing granules turned out to be
shorter (18.49 ± 5.92 min) than that of fusing granules (25.82 ± 6.34 min). To understand granule growth kinetics
in the absence of fusion, granule fluorescence was examined in non-merging tracks. Movie 5 and Fig. 4C present
a prototypical track and the corresponding changes in fluorescence of a single keratin granule. As to be expected,
the increase in granule fluorescence corresponded well with the size of the growing granule (Movie 5). Changing
fluorescence was therefore taken as a measure of granule growth. The slow initial growth of the nascent granule
was followed by an exponential growth phase that levelled off at a distinct maximum. The ensuing disassembly
of the granule occurred rapidly with almost linear kinetics. Plotting the positions of initial granule detection
together with the positions of last granule detection showed that both events are spatially separated (Fig. 3C).
Granule appearance was restricted to the peripheral 2/3 of the granule-bearing zone, granule disappearance to
the inner 1/3. Comparing growth and dissolution of granules further demonstrated that granule growth was
limited to the peripheral part of the granule-containing zone whereas shrinking occurred only in the inner part
of that zone (Fig. 4D).
To see whether the change in fluorescence observed for the selected single granule was representative, nor-
malized granule fluorescence was compared for 137 solo tracks (Fig. 4E). The average granule fluorescence
determined for 5 cells, that were imaged with identical settings, varied by a factor of 3. A slow growth phase and
a much faster dissolution phase of keratin granules, however, were readily apparent independent of the average
fluorescence of granules, whose average lifetime was 25.56 ± 6.22 min (Fig. 4F,G).
Scientific Reports | (2021) 11:2379 | https://doi.org/10.1038/s41598-021-81542-8 2
Vol:.(1234567890)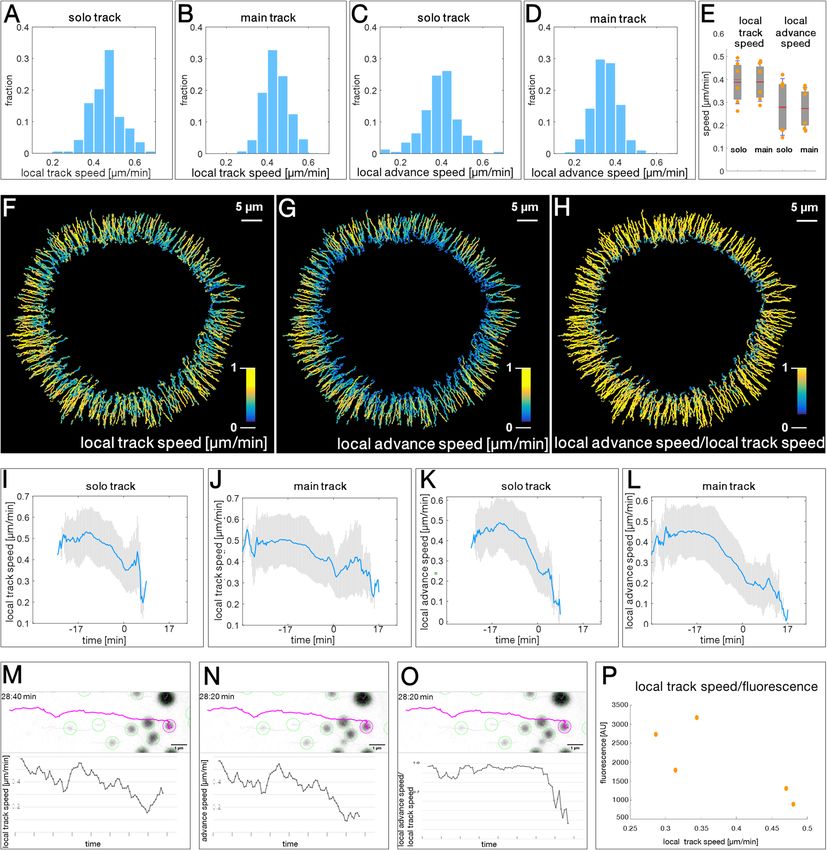
www.nature.com/scientificreports/

                                  Figure 1.  The schemes show overviews of the examined properties of mutant keratin granules and the workflow to
                                  determine them in quantitative terms. (A) The scheme depicts a typical EYFP-K14R125C-producing MCF-7 cell at
                                  the left and the different events which were studied at the single granule level with reference to the figures describing
                                  the respective analyses. They comprise nucleation, growth, motility, fusion and disassembly of keratin granules. (B)
                                  The scheme summarizes the different analysis steps of keratin granule dynamics beginning with the recording of
                                  changing fluorescence patterns in living cells producing fluorescence-tagged EYFP-K14R125C, followed by tracking
                                  of single granules, classification of tracks and determination of different granule properties at the single granule level
                                  and final multimodal statistical evaluation of entire granule cohorts in a given cell. The manuscript further describes
                                  how these methods can be used for the analysis of granule dynamics in different cells and its response to specific
                                  drugs. The described approach can be extended to examine keratin granule dynamics in genetically modified cells
                                  and can be extrapolated to other intermediate filament polypeptides, diseases and cell types.

Scientific Reports |   (2021) 11:2379 |                 https://doi.org/10.1038/s41598-021-81542-8                                                         3

                                                                                                                                                     Vol.:(0123456789)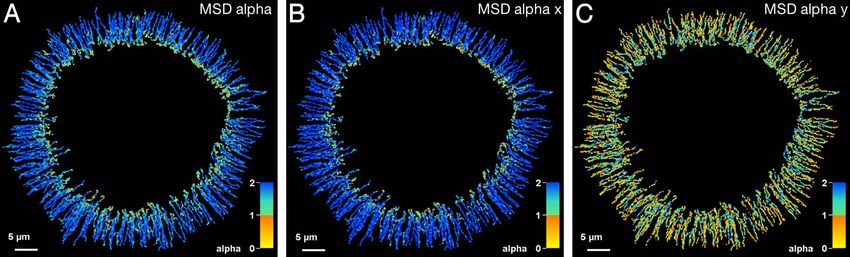
www.nature.com/scientificreports/

                                            Figure 2.  Image analysis of fluorescence recordings in MCF7 cells producing yellow fluorescent protein-
                                            tagged keratin 14 mutant EYFP-K14R125C provides quantitative information on keratin granule motility and
                                            fusion. (A) The fluorescence microscopy (inverse presentation) is taken from Movie 1 and corresponds to
                                            the first image taken at time point 0 min. (B) The composite fluorescence micrograph is taken from Movie
                                            2. The four quadrants depict different stages of image documentation and analysis. (a) presents the projected
                                            fluorescence recording at time point 10 min. The nuclear region is in the center and the granules are restricted
                                            to the cell periphery increasing in size towards the cell interior. (b) Detected granules are circled (magenta) and
                                            corresponding tracks are shown as yellow lines. Only the track paths of the last ten frames are shown. Note that
                                            the very small and weakly fluorescent granules, which are detected in the cell center, lack a track because of their
                                            short lifetime. (c) depicts the color-coded number of fusion events observed for each track. (d) shows the color-
                                            coded mean speed for each track. (C) The region boxed in white in B is shown at higher magnification with the
                                            full sequence provided as Movie 2. (D) Depicts a representative track of a single, non-merging keratin granule
                                            (surrounded by magenta circle) that was followed during its entire lifetime of 29 min 20 s moving from the
                                            cell periphery at left towards the cell center. For better visualization other nearby granules are circled in green
                                            without their corresponding tracks. The entire sequence is shown in Movie 3. (E) Presents tracks of three fusing
                                            granules (circled in magenta) during their entire lifetime of 31 min 40 s (cell periphery at left). Other nearby
                                            granules are encircled in green without their tracks shown. Corresponding Movie 4 shows the entire sequence.

          Scientific Reports |   (2021) 11:2379 |                https://doi.org/10.1038/s41598-021-81542-8                                                    4

Vol:.(1234567890)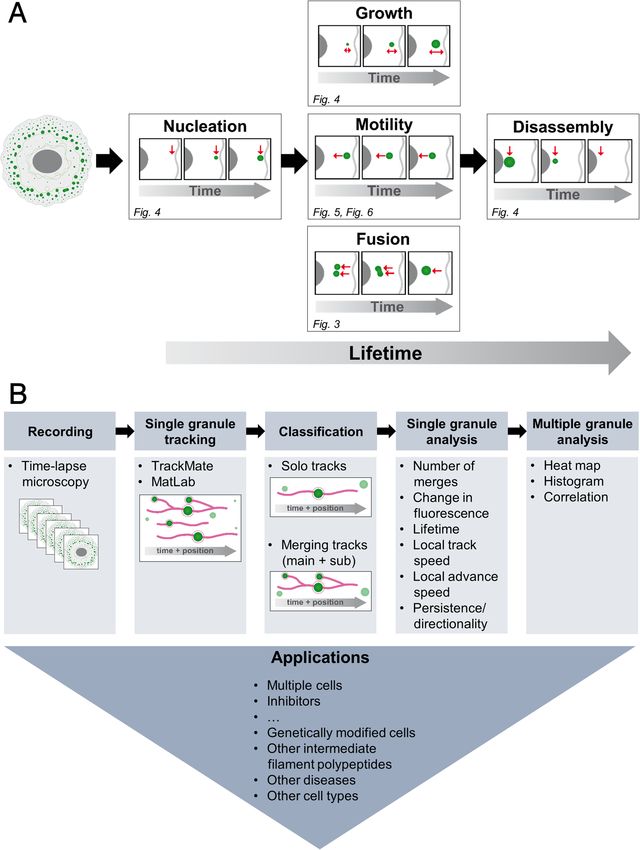
www.nature.com/scientificreports/
Figure 3. Image analysis of time-lapse fluorescence recordings in EYFP-K14R125C-producing MCF-7 cells
reveals frequent merging of keratin granules during their lifetime. (A) The histogram depicts the number
of merging events for each newly formed granule. 820 tracks of moving granules were taken from Movie
1 without any selection filter. (B) The whisker box plot shows the number of merging events observed in
complete tracks from first detection (appearance) to last detection (disappearance) in each of 6 fluorescence
time-lapse recordings. (C) The picture illustrates the positions of appearance (blue dots), merging (green dots)
and disappearance (red dots) of keratin granules as determined for Movie 1. (D) The graph shows the number
of merging events versus fluorescence (in arbitrary units, AU) determined from five independent time-lapse
fluorescence recordings.
Mutant keratin granules move with decreasing speed as they grow. To gain detailed informa-
tion on the mobility of keratin granules, the local speed and direction of keratin movement was analysed next.
Using data from Movie 1, we determined the local track speed as the distance travelled per time along the track
in µm/min for an 8 frame window at any given time point (Supplementary Fig. S1B). The average local track
speed of granules along solo tracks was very similar to that of granules moving along main merging tracks
(0.46 ± 0.06 µm/min vs. 0.44 ± 0.08 µm/min; Fig. 5A,B). To obtain a measure for the persistence of movement, we
determined the local advance speed, which is defined as the speed determined for the shortest distance between
the first and last positon of each 8 frame window (Supplementary Fig. S1B). As expected, the values were lower
than those for the local track speed but, again, did not differ between solo and main tracks (0.35 ± 0.07 µm/min
vs. 0.39 ± 0.09 µm/min; Fig. 5C,D).
To determine whether the findings were representative, we examined the track and advance speed of granules
in 6 cells (Fig. 5E). The overall values (mean local track speed for solo tracks: 0.39 ± 0.09 µm/min; mean local
track speed for main tracks: 0.39 ± 0.08 µm/min; mean local advance speed for solo tracks: 0.28 ± 0.12 µm/min;
mean local advance speed for main tracks: 0.27 ± 0.09 µm/min) were slightly different from the single cell data.
Closer inspection revealed considerable heterogeneity and indicated the presence of a group with fast- and
another group with slow-moving granules.
Figure 5F,G depicts colour-coded tracks representing local track speed and local advance speed of main
tracks. Both parameters are high during most of the granule’s lifetime and slow down considerably at the end.
The side-by-side comparison further suggested that the local advance speed rapidly slowed down at the end of
granule lifetime and slightly before the local track speed slowed down. In accordance, the ratios of local advance
speed to local track speed were stable for most of the granule’s lifetime and decreased at the end of its lifetime
(Fig. 5H). The phenomenon was also apparent in graphs, in which the fluorescence of granules was normalized
to the time point of the highest fluorescence level (Fig. 5I–L). The decrease in granule fluorescence (after time
point 0 min) was coincident with a transient increase in local track speed. At the same time the local advance
speed was drastically reduced. The graphs in Fig. 5I–L further demonstrate that both local track and local advance
speed decreased substantially as granules grew (before time point 0 min).
Together, the observations indicated that mutant keratin granules move directionally during most of their
lifetime but lose directionality while still remaining motile just prior to dissolution. Support for this idea was
also derived from inspection of single tracks at high resolution, revealing erratic granule movement at the end of
granule lifetime (Movies 3, 4). The selected track in Fig. 5M–O (Movie 6) exemplifies the described alterations
in local track and advance speed and their changing ratios at the end of granule lifetime.
To show that the relationship between granule speed and granule size is a general property, we determined the
ratios between local track speed and granule fluorescence in time-lapse recordings of 5 different cells (Fig. 5P).
The results show that increased granule fluorescence correlates with reduced velocity, indicating that granule
size and speed are inversely related.
Mutant keratin granules move by directed transport. The above analyses of local track and advance
speed indicated that keratin granules move coordinately toward the cell centre. To distinguish between directed,
free and restricted mode of mutant keratin granule transport, we performed mean square displacement (MSD)
analyses. The coefficient derived therefrom is the alpha (α) value, which indicates free diffusion if it equals 1,
whereas a value of α > 1 indicates movement by active transport, and a value of α < 1 points to motion con-
strained in space20. Analysing the data of Movie 1, the alpha value was determined for each time point of each
granule and was projected onto the track data. Figure 6A shows that the tracks display alpha values > 1 almost
Scientific Reports | (2021) 11:2379 | https://doi.org/10.1038/s41598-021-81542-8 5
Vol.:(0123456789)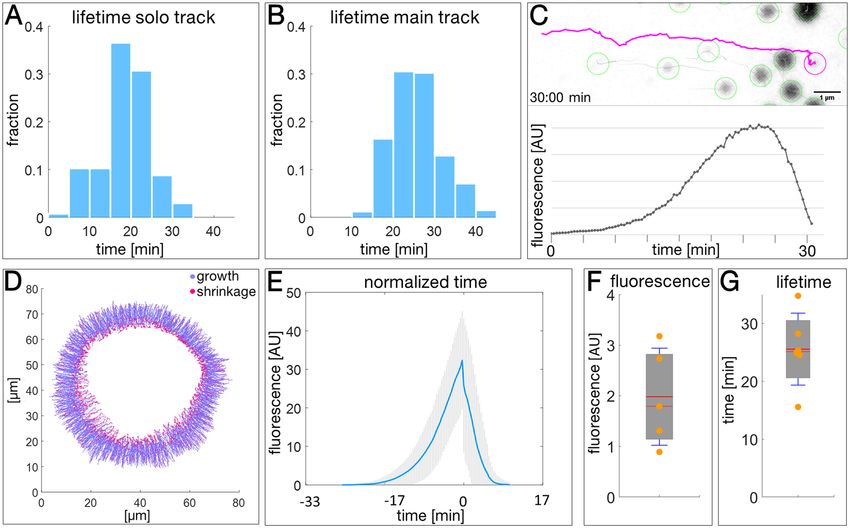
www.nature.com/scientificreports/
Figure 4. Unique signet features of keratin granule lifetime, growth and disassembly can be deduced from
time-lapse fluorescence recordings in EYFP-K14R125C-producing MCF-7 cells. (A,B) The histograms show the
lifetime of individual keratin granules, which either did not fuse with other granules (A; n = 137) or fused with
other granules (B; n = 341). For the fusing granules only the longest tracks (main tracks) were analysed (see
Supplementary Fig. S1A). The data are taken from Movie 1. (C) The photomontage shows the track of a typical
single keratin granule projected onto the fluorescence image (inverse presentation) taken at 30 min of Movie
5 and the corresponding fluorescence changes over time in the graph below. Other automatically tracked and
segmented nearby granules are encircled in green. (D) Illustrates the growth and shrinkage of keratin granules.
The change of fluorescence was determined for each individual granule track between each time point. Granule
tracks increasing in fluorescence brightness are shown in blue, granules with decreasing fluorescence in red.
Data are from the same 820 tracks of Movie 1 analysed in (Fig. 3C). (E) The graph shows the relative changes in
granule fluorescence over time determined for non-fusing keratin granules (n = 137). The time point of reaching
the maximum fluorescence as was set to 0 min for each granule for better comparison. The mean of the resulting
fluorescence is depicted in blue together with the corresponding standard deviation from the mean (SD) in grey.
(F,G) The whisker box plots depict the mean maximum fluorescence (F) and the mean lifetime (G) of keratin
granules determined in time-lapse recordings of 5 or 6 cells, respectively. Only complete tracks were analysed.
over their entire length, indicating directed transport. Shortly before the tracks end, values of < 1 indicated the
end of directed transport and restricted diffusion for the last frames instead.
To distinguish between inward movement and movement perpendicular to this axis, the movement along the
x-axis (defined as the axis between start- and end-point of this track) and y-axis (perpendicular to the x-axis)
were analysed separately (Fig. 6B,C). Movement along the x-axis showed alpha values above 1 for most of the
granule lifetime, which became only less than 1 at the end. In contrast, the movement along the y-axis showed
alpha values below 1 during most of the granule lifetime.
Together, we concluded that directed movement of granules occurs only in one direction, i.e. centripetally
towards the cell interior. The findings further suggested that specific transport mechanisms are likely involved
in keratin granule translocation.
Myosin II contributes to the speed and directionality of keratin granule movement. In trying
to identify likely candidate motor proteins that contribute to the directed transport of mutant keratin gran-
ules, we reasoned that microtubule-dependent motors confer typically much faster transport rates than those
observed in our study and therefore focused on actin-dependent myosin motors. A prime candidate is non-
muscle myosin II, which is known to support inward-directed transport processes and has been implicated in
the regulation of keratin granule dynamics21. To this end, EYFP-K14R125C-expressing MCF-7 cells were treated
with the myosin II-specific inhibitor para-nitroblebbistatin22,23. 30 images were recorded at 20 s intervals prior
to drug addition and 50 images immediately afterwards at the same frequency without interruption. In this way,
alterations in granule motility could be assessed in the same cells. The recordings were then subjected to the
image analyses described above taking only solo tracks into account.
Scientific Reports | (2021) 11:2379 | https://doi.org/10.1038/s41598-021-81542-8 6
Vol:.(1234567890)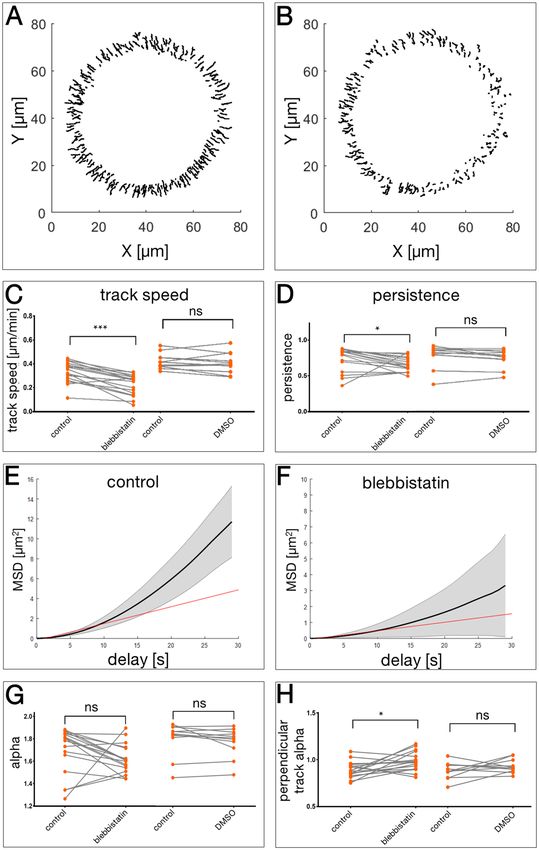
www.nature.com/scientificreports/

                                  Figure 5.  Analysis of keratin granule motility in EYFP-K14R125C-producing MCF-7 cells reveals coordinated
                                  motility profiles. (A–D) The histograms depict the local track speed of non-fusing (A; n = 137) and fusing
                                  keratin granules (B; n = 341) and the corresponding advance speed (C,D). Data are taken from Movie 1. The
                                  local track speed is defined for each position as the displacement (µm) per min for an 8 frame window at a given
                                  time point and amounts to 0.46 ± 0.06 µm/min for solo tracks (A) and 0.44 ± 0.08 µm/min for main tracks (B).
                                  The advance speed is defined as the shortest distance travelled for an 8 frame window at a given time point.
                                  The value for solo tracks is 0.35 ± 0.07 µm/min and 0.39 ± 0.09 µm/min for main tracks. (E) The whisker box
                                  plot shows local track speed and advance speed for 6 time-lapse fluorescence recordings. Mean speed of solo
                                  tracks amounts to 0.39 ± 0.09 µm/min, and 0.39 ± 0.08 µm/min for main tracks. Advance speed of solo tracks
                                  is 0.28 ± 0.12 µm/min, and 0.27 ± 0.09 µm/min for main tracks. (F–H) The color-coded tracks show the local
                                  track speed (F), advance speed (G) and ratios of local advance and local track speed of individual keratin
                                  granules ((H); corresponding Movie 1) highlighting directed movement toward the cell interior during most
                                  of the granule’s lifetime and erratic movement just prior to granule disappearance. (I–L) The graphs show the
                                  changes in local track and advance speed for non-fusing (solo track) and fusing (main track) single keratin
                                  granules. Data from Movie 1 were used. Curves are normalized with respect to time by setting time point 0 min
                                  at maximum granule fluorescence. Blue lines: mean; grey bars: SDs. (M–O) Tracks of a single, non-merging
                                  granule with diagrams showing local track speed (M), local advance speed (N) and the ratios of local advance
                                  speed/ local track speed (O) over time. The corresponding animations are provided as Movie 6. The changes of
                                  fluorescence over time of this granule are shown in Fig. 4C. (P) The graph shows the ratio of local track speed
                                  and granule fluorescence for 5 time-lapse fluorescence recordings. Note that increased granule fluorescence
                                  correlates with reduced speed.

Scientific Reports |   (2021) 11:2379 |               https://doi.org/10.1038/s41598-021-81542-8                                                7

                                                                                                                                           Vol.:(0123456789)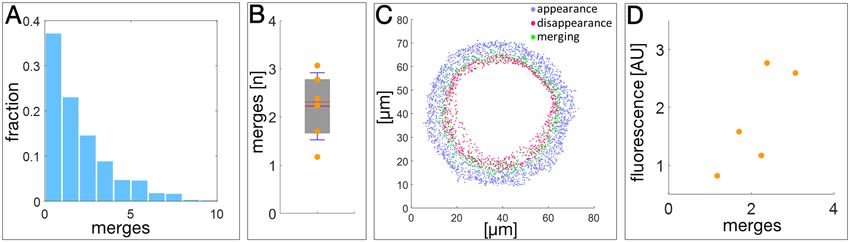
www.nature.com/scientificreports/
Figure 6. Mean square displacement analyses of keratin granules in EYFP-K14R125C-producing MCF-7 cells
reveal uniform inward-transport in a restricted region of the peripheral cytoplasm. (A) The color-coded tracks
depicting the overall alpha value. (B,C) The color-coded tracks depict the alpha values in x and y, respectively.
The x-axis is defined as the axis of transport defined by the start- and end-point of each individual track.
Alpha > 1 indicates directed transport, alpha = 0 free Brownian motion, and alpha < 1 restricted motion. Note
directed movement along the x-axis and lack of mobility perpendicular to that direction. The end of directed
transport along x is indicated by alpha < 1 at the end of the lifetime of the granules. The movement along the y
axis (= perpendicular to x-axis) remains random throughout the entire granule lifetime.
Blebbistatin treatment frequently led to flattening of cells and extension of cell protrusions. Solo tracks
deduced from a cell before and after blebbistatin addition are shown in Fig. 7A,B, respectively (Movie 7). The
decrease of track lengths after addition of para-nitroblebbistatin was obvious. The track speed changes were
then analysed in 17 blebbistatin-treated cells and compared to those in 11 control cells that were only treated
with the DMSO solvent. No significant changes were observed in the DMSO-treated controls whereas a highly
significant decrease of mean granule speed from 0.33 to 0.22 µm/min was detected in blebbistatin-treated cells
(Fig. 7C). Furthermore, the persistence, defined as the shortest distance between start and end point of a track
divided by the actual distance travelled, was also significantly reduced from 0.74 to 0.66 after inhibitor addition
(Fig. 7D). Averaged MSD curves of tracks in a single cell before and after addition of blebbistatin are depicted
in Fig. 7E,F. Both the individual and weighted curves are considerably flattened in the presence of blebbistatin,
indicating a decrease in total motility of mutant keratin granules. The alpha value calculated from the MSD
analyses, however, did not change in the presence of blebbistatin or DMSO (Fig. 7G), remaining above 1 in all
conditions. Similarly, the alpha value calculated along the x-axis was not altered (not shown). But the alpha along
the y-axis was significantly, although only to a minor degree, increased after blebbistatin addition (Fig. 7H).
To further substantiate the inhibitor experiments, cells were treated with ML-7 as an alternative upstream
myosin inhibitor (Supplementary Fig. S2). Analysis of the speed of granule movement showed a significant
reduction from 0.28 to 0.17 µm/min.
Together, the observations indicated that inhibition of myosin II significantly slowed down the inward move-
ment of mutant keratin granules.
Movement of mutant keratin granules coincides with cortical acto‑myosin flow. In view of the
partial myosin-dependency of keratin granule movement, we compared motion of granules with that of myosin.
To this end, MCF-7 cells stably expressing EYFP-K14R125C were transiently transfected with fluorescent protein-
tagged non-muscle myosin IIB. The keratin granule-bearing zone coincided with the peripheral enrichment
zone of non-muscle myosin IIB (Fig. 8A). Time-lapse fluorescence recording revealed that the constant myosin
flow corresponded with the inward flow of keratin granules (Movies 8 and 9). Both types of motility were equally
affected by para-nitroblebbistatin treatment (Fig. 8A, B; Movie 9). To understand why residual inward-directed
motility persisted in the presence of blebbistatin, we examined actin dynamics using LifeAct in comparison to
keratin granule mobility. In untreated cells, keratin granule motility corresponded well to the inward movement
of actin often co-distributing with transverse actin arcs (Fig. 8C,D; Movie 10). As to be e xpected24–26, blebbista-
tin dissolved transverse arcs but did not completely abolish retrograde actin flow, which still coincided with the
remaining granule movement. We therefore concluded that the inward movement of mutant keratin granules is
linked to retrograde actin flow.
Discussion
Ex vivo analyses are not sufficient to understand and characterize the mechanisms and consequences of patho-
logical keratin aggregate formation. Thus, recombinant K14R125H forms prototypical intermediate filaments
under optimal in vitro conditions27. Production of the same or similar keratin 14 mutants in cultured cells,
however, leads to abundant keratin granule formation with little remaining filamentous keratins in the peri-
nuclear region28–31. Time-lapse imaging revealed that these keratin granules are highly dynamic, displaying
a high degree of motility and a limited lifetime. These properties offer an inroad into the investigation of fac-
tors that modulate keratin aggregation. Progress has been hampered so far by the multifactorial regulation
of keratin granule dynamics. Quantitative parameters are therefore needed to determine the contribution of
Scientific Reports | (2021) 11:2379 | https://doi.org/10.1038/s41598-021-81542-8 8
Vol:.(1234567890)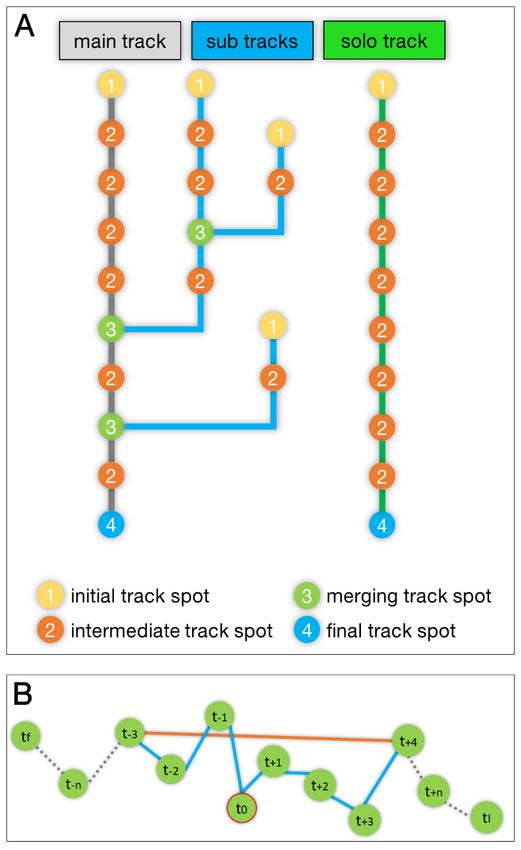
www.nature.com/scientificreports/
Figure 7. Inhibition of myosin II results in altered motility of EYFP- K 14R125C granules. (A,B) The tracks of mutant keratin granules
were retrieved from a live cell recording (20 s time intervals) using TrackMate software. The entire original time-lapse recording is
provided as Movie 7. Only non-merging tracks are plotted. The tracks shown were obtained before (A) and after (B) the addition of
20 µM para-nitroblebbistatin. Note the much shorter tracks in (B). (C) The overall track speed of keratin granules before (control)
and after addition of DMSO-dissolved para-nitroblebbistatin or the solvent DMSO only. For the blebbistatin experiment 17 cells
were analysed yielding 900 tracks before and 989 tracks after drug addition. Note the decrease in speed from 0.332 ± 0.086 µm/min
to 0.224 ± 0.086 µm/min (p = 0.000076). Adding DMSO does not affect speed of keratin granule movement (n = 11; 0.396 ± 0.062 µm/
min vs. 0.380 ± 0.081 µm/min; p = 0.320). (D) The persistence (shortest distance between start and end point of a track divided by
the actual distance travelled) of keratin granule movement is significantly reduced from 0.739 ± 0.165 to 0.664 ± 0.103 (p = 0.015) by
para-nitroblebbistatin. Adding DMSO does not change the persistence significantly (0.729 ± 0.152 vs. 0.696 ± 0.119; p = 0.083). (E,F)
Averaged MSD curves of the two data sets. The greyed area represents the weighted standard deviation over all MSD curves while the
black line is the weighted average over all MSD curves. Fitting the first 50% of the mean curve yields the average diffusion coefficients
D (red line) for both situations. (G) Differences in the alpha coefficients for the same dataset used in (C). Alpha = 0 indicates free
Brownian motion, while values > 1 indicate directed transport, and values < 1 indicate confined motion. Adding para-nitroblebbistatin
reduces alpha from 1.699 ± 0.206 to 1.619 ± 0.131 and adding DMSO reduces alpha from 1.710 ± 0.152 to 1.676 ± 0.140) both of which is
statistically not significant (p = 0.057 and p = 0.102, respectively). (H) The "perpendicular track alpha" coefficients for the same dataset
used in (C–E). Adding para-nitroblebbistatin significantly increases the average alpha from 0.890 ± 0.086 to 0.981 ± 0.102 (p = 0.020),
the addition of DMSO does not (0.883 ± 0.090 vs. 0.931 ± 0.073; p = 0.320).
Scientific Reports | (2021) 11:2379 | https://doi.org/10.1038/s41598-021-81542-8 9
Vol.:(0123456789)www.nature.com/scientificreports/
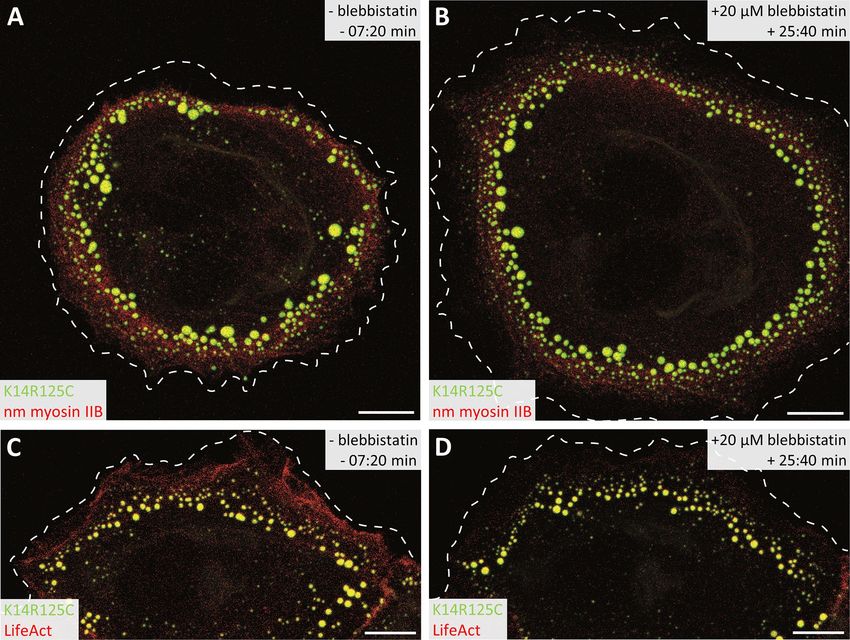
Figure 8. Live-cell imaging reveals interconnected retrograde movement of mutant keratin granules and
cortical acto-myosin. (A,B) The projection views depict EYFP-K14R125C-containing keratin granules (green)
and mCherry-non-muscle myosin IIB (red) in an MCF-7 cell 7 min 20 s before and 25 min 40 s after treatment
with 20 µM para-nitroblebbistatin. Note the spatial proximity of the fluorescent keratin granules and dotted
myosin fluorescence in the peripheral lamellum and their reduced presence in the central cytoplasm. The
corresponding Movie 9 shows that both move coordinately from the cell periphery to the cell center. Note the
enlargement of the cell caused by blebbistatin-induced relaxation of the cell cortex moving also keratin granules
and myosin outwards. The cell membrane is demarcated by a dashed line as determined from corresponding
brightfield images. Scale bars: 10 µm. (C,D) The projection views depict EYFP-K14R125C (green) distribution
together with LifeAct-RFP (red) in an MCF-7 cell 7 min 20 s before and 25 min 40 s after treatment with 20 µM
para-nitroblebbistatin. Note that cortical actin co-distributes with nascent keratin granules in the outermost
region of the lamellum. The entire time-lapse sequence is presented in Movie 10. Note again the relaxation of
the cell cortex and considerably reduced actin signal upon myosin II inhibition. Dashed lines indicate the cell
membrane. Scale bars: 10 µm.
individual factors. Microscopic recording of fluorescence-tagged keratin mutants provides temporal and spatial
information that can be dissected by image analysis to obtain such parameters. By pursuing this approach, we
were able to digitally track keratin granule formation, growth, movement and disassembly at the single granule
level. The results demonstrate that the determined parameters do not reflect random processes but must be the
consequence of coordinated regulation and can therefore be described in quantitative terms. Specifically, we
found that granule formation is restricted to less than 10 µm from the plasma membrane, that granule growth
is continuous up to a certain plateau size for about 30 min, that granule mobility is consistently directed toward
the cell centre, that the speed of granule movement differs between cells but always slowly declines as granules
grow, and that granule disassembly is faster than assembly and is limited to a distinct transition zone between
the thin cell periphery and thicker cell centre.
Probably the most remarkable property of keratin granules is their coordinated motility. It carries the signet
features of an actin-dependent transport mechanism with respect to speed, directionality and continuity. In
accordance, previous studies had shown that actin filament disruption by cytochalasin or latrunculin prevented
keratin granule motility whereas disruption of microtubules by nocodazole did n ot9. Whether and to which
degree actin-dependent motor proteins are involved in keratin granule motility, however, could not be resolved.
Using the standardized imaging conditions and methods of data analysis we addressed this aspect by treating
K14R125C-expressing cells with the myosin inhibitors para-nitroblebbistatin and ML-7. This revealed a significant
Scientific Reports | (2021) 11:2379 | https://doi.org/10.1038/s41598-021-81542-8 10
Vol:.(1234567890)www.nature.com/scientificreports/
reduction, though not complete inhibition of granule motility with comparatively minor effects on directionality.
The findings indicated that either drug inhibition was not complete or that other transport systems contribute to
keratin granule movement. Thus, kinesin-1 has also been shown to be involved in keratin m otility32 and may act
in concert with non-muscle myosin II. The kinesin-1-dependent type of motility, however, appears to be different
from the restricted inward-directed motility observed for the mutant keratin granules. Furthermore, alternative
scenarios may be underlying the effect of myosin II-dependent keratin granule transport: Non-muscle myosin II
either directly or indirectly affects keratin granule movement. In support of the first model physical association
between keratins and non-muscle myosin IIA has been documented for keratins K8/K18 and K6 with functional
implications for cell m igration21,33. A possible mechanism for the second scenario is that actin retrograde flow
is the primary stimulus for inward-directed keratin granule motility. The observation that the myosin inhibitors
used in this study are known to abolish transverse actin arcs but only partially (~ 50%) abolish retrograde actin
flow provides such a link24–26. It is fully supported by the blebbistatin-induced dissolution of transverse actin
arcs and the ~ 33% reduction of keratin granule speed in the present study.
A challenge in elucidating keratin aggregate formation is the influence of context-dependent modulators and
the highly variable effects of different mutations. Thus, EBS-associated mutations have been shown to affect kera-
tin network formation differently, resulting in different functional phenotypes of cell adhesion and mechanical
resilience29,34–36. Environmental factors including mechanical stress are known to affect mutant keratin network
organization and m echanotransduction34,37,38. This high degree of variability and the underlying multifactorial
nature of keratin aggregate formation necessitate means to assess keratin networks in quantitative terms. The
presented methods offer a way to screen for modifiers of keratin granule dynamics (Fig. 1B).
While our findings are relevant for dissecting mechanisms of keratin granule-forming diseases, they also
improve our understanding of normal keratin network regulation and dynamics. Despite the inability of K 14R125
mutants to support normal keratin network formation in transfected epithelial cells, keratin granule formation
and dissolution share key features with the normal keratin turnover, including induction of keratin polymeriza-
tion in the cell periphery and inward-directed transport accompanied by continuing p olymerization10,39. We
therefore propose that myosin-dependency of motility applies also to the observed inward transport of growing
keratin filament precursors. Remarkably, keratin filament precursors are released from the transport machin-
ery for network incorporation at a transition zone which appears to correlate with the zone, where the mutant
keratins are disassembled into subunits that can be re-used for another round of assembly and disassembly10,40.
The developed methods will help to clarify similarities and differences to other situations of keratin granule
formation, which occur for example during mitosis, apoptosis, phosphatase inhibition or increased stress41. More
generally, it will be important to compare key features of keratin aggregate formation and turnover with other
aggregates formed in other diseases involving other cytoplasmic IFPs.
Materials and methods
Cells. The MCF-7 cell line producing EYFP-K14R125C has been d escribed9. Cells were grown in uncoated
flasks or on glass bottom dishes (12 mm glass-diameter, thickness 1.5#; MatTek) in Dulbecco’s Modified Eagle’s
Medium (DMEM; Sigma Aldrich) supplemented with 10% fetal calf serum (FCS; Pan Biotech) in a humidified
atmosphere with 5% CO2 at 37 °C. Cells were passaged once a week at a ratio of 1:5–1:30 or at 1:30–1:40 for
live cell imaging. For passaging, cells were washed with and subsequently incubated for 10 min in phosphate
buffered saline (PBS) without Ca2+ or Mg2+ (Sigma Aldrich). They were then incubated with accutase (Sigma
Aldrich) until cells detached. They were then re-suspended in trypsin neutralizer solution (Thermo Fisher),
centrifuged and seeded.
Time‑lapse microscopy. MCF-7 cells were seeded in glass-bottom dishes (12 mm glass-diameter, thick-
ness 1.5#, MatTek) two days prior to imaging and transfected one day before imaging. The cells were transfected
with 5 µg of plasmid DNA and 1.5 µl Xfect polymer in a total volume of 100 µl Xfect reaction buffer (Takara)
per 2 ml of cell culture medium in 35-mm diameter dishes. The LifeAct-RFP plasmid was kindly provided
by Bernd Hoffmann (Forschungszentrum Jülich42) and the mCherry-MyosinIIB-N-18 plasmid was purchased
from Addgene (#55107; kindly provided by Michael Davidson). For live-cell imaging, cells were incubated in
25 mM HEPES-buffered DMEM without phenol red (Life technologies) supplemented with 2% fetal calf serum
(Pan biotech). Fluorescence recordings were performed with a laser scanning confocal microscope (LSM 710;
Carl Zeiss) using Zen black 2.1 SP3 software (Carl Zeiss). The microscope was equipped with an Airyscan detec-
tor, oil immersion objective (63 × /1.40-N.A. DIC M27) and a focus-shift correction system (DefiniteFocus; all
from Carl Zeiss). In order to perform live-cell imaging, the microscope incubation chamber was pre-warmed to
37 °C and humidified. For detection of EYFP the argon-ion laser was used at 514 nm and 0.3% power together
with a BP 420–480 + BP 495–620 filter (Movie 7) or the argon-ion laser was used at 488 nm and 0.1–0.3% power
and signal emission was acquired at a range of 505–555 nm (Movies 8, 9, 10). For detection of mCherry in living
cells a 543 nm HeNe-laser (module LGK 7786 P) was used at 5.0% power and signal emission was acquired at a
range of 600–700 nm. For detection of RFP a 543 nm HeNe-laser (module LGK 7786 P) was used at 10% power
with signal emission being acquired at a range of 600–700 nm. The experiments were performed at an optical
resolution corresponding to approximately 200–300 nm resolution in x/y length for the YFP signal. To improve
accuracy, the scan-pixel-size was set to 77 nm. Microscopy images were processed in Fiji distribution of ImageJ
software package43,44 and further processed for visualization by Adobe Photoshop CS3 and Microsoft Office
Professional Plus 2016. The scheme in Fig. 1 was prepared using Adobe Illustrator CS3.
Inhibitor treatment. Cells were seeded on day 0 on glass-bottom dishes and were imaged one day after
seeding in DMEM including 4-(2-hydroxyethyl)-1-piperazineethanesulfonic acid (HEPES) and without phenol
Scientific Reports | (2021) 11:2379 | https://doi.org/10.1038/s41598-021-81542-8 11
Vol.:(0123456789)www.nature.com/scientificreports/
red (Sigma Aldrich) supplemented with 2% FCS (Pan Biotech). Live cell imaging was performed on a Zeiss
LSM710 Duo microscope at 37 °C. The 488 nm line of an argon/krypton laser was used for fluorescence record-
ing with a 63 × /1.40-N.A. DIC M27 oil immersion objective. The emitted light was monitored between 500 and
540 nm (green signal), with a pinhole set at 1–2 AU (airy unit) and a laser intensity of 0.2%. Cells were imaged in
control medium. Subsequently, the medium was aspirated using a vacuum pump and replaced by medium sup-
plemented with the respective inhibitor for further imaging without interruption of recording. Para-nitroblebbi-
statin was purchased from Optopharma. Concentrations of 5, 10, 20 and 50 µM para-nitroblebbistatin were
tested. While 5 µM inhibited keratin granule motility only mildly, 50 µM showed signs of toxicity, completely
inhibiting intracellular motility and dynamics. Based on the test results and the recommendation of the manu-
facturer to not exceed 20 µM because of unspecific side effects, the reported efficient inhibition of myosin 2 func-
tion in cultured cells using 10–20 µM para-nitroblebbistatin22, the limited solubility of blebbistatin (4–25 µM
in aqueous solution containing 0.1–2% DMSO for blebbistatin22,23), and the concern for toxicity of high para-
nitroblebbistatin concentrations we decided to use 20 µM as the standard concentration.
ML-7 was purchased from Tocris and used at a standard concentration of 20 µM which has been shown to
inhibit MLCK efficiently in MCF-7 cells and is known to avoid unspecific inhibition of protein kinase A and C 45,46.
Automated image analysis. For best comparison high quality recordings of isolated cells were selected
that had a comparable overall cell morphology (round shape, flat cell body). Image sequences were either
recorded over a long period (between 270 and 365 frames per movie with 3 frames/min) allowing the analysis of
complete tracks, or in a before–after fashion to study the impact of modulators. In both instances, the analysis
followed the scheme shown in Fig. 1B. First, granules were tracked with the help of the FIJI plugin T rackMate47.
For segmentation, the LoG detector was applied with the following parameters: blob diameter = 1 µm; thresh-
old = 33 (in some experiments 1, due to different recording settings); no mean filtering; and sub-pixel localization
active. For tracking, the LAP tracker was used with the following parameters: Frame to frame linking = 1 µm;
track segment gap closing with maximal distance of 1 µm and maximal frame gap of 2; track segment splitting
disabled; track segment merging 1 µm. After initial track calculation, the tracks were filtered for mean quality
set to "auto". For further inspection numerical data (track-IDs; x, y, t; fluorescence) were exported and MAT-
LAB (The MathWorks, Inc.) custom scripts were used. Since merging of tracks occurred regularly, tracks were
automatically classified as solo tracks which did not merge, and merging tracks that were subdivided into main
tracks and sub tracks (Supplementary Fig. S1A). Mean local track speed, local advance speed and fluorescence of
granules were calculated for the different track types. To consider local changes of speed, a gliding mean of speed
was calculated by computing the local track and advance speeds for each time point taking 8 image recordings
from t − 3 to t + 4 into account (Fig. S1B).
To further examine the motion properties of granules, MSD analysis was performed using the MATLAB
class @msdanalyzer48. The coefficient alpha was determined in the following way: The MSD function was cal-
culated for each individual trajectory and its log–log representation was fitted with a linear function such that if
the MSD curve could be modelled by ρ(r) = ⟨r2⟩ = Γta, then log(⟨r2⟩) = f(log(t)) was fitted with Γ + α log(t). We
fitted individual MSD curves and discarded those for which the R2 coefficient, reflecting the quality of the fit,
was < 0.848. For MSD analysis along or perpendicular to the track direction, tracks were rotated in a way that
start- and end-point were located horizontally. In that instance, x values reflect back and forth movements while
y-values reflect up and down movements, i.e. movements perpendicular to the track axis. MSD analysis then
was performed for x and y values separately.
To test significance of before and after parameters the signrank function applying the Wilcoxon matched-pairs
signed-ranks test49 was used. Graphs were prepared using GraphPadPrism v7 Software. Values are given with
standard deviation of the mean, i.e. ± SD. Significance with a p ≤ 0.001 was labelled ***, p ≤ 0.01 was labelled **
and p ≤ 0.05 was labelled *.
Data availability
The automated image analysis protocols generated during the current study are available in the GitHub reposi-
tory, https://github.com/rwindoffer/KER_TRACK.
Received: 13 November 2020; Accepted: 8 January 2021
References
1. Chamcheu, J. C. et al. Keratin gene mutations in disorders of human skin and its appendages. Arch. Biochem. Biophys. 508, 123–137.
https://doi.org/10.1016/j.abb.2010.12.019 (2011).
2. Clemen, C. S., Herrmann, H., Strelkov, S. V. & Schroder, R. Desminopathies: pathology and mechanisms. Acta Neuropathol. 125,
47–75. https://doi.org/10.1007/s00401-012-1057-6 (2013).
3. Coulombe, P. A., Kerns, M. L. & Fuchs, E. Epidermolysis bullosa simplex: a paradigm for disorders of tissue fragility. J. Clin. Investig.
119, 1784–1793. https://doi.org/10.1172/JCI38177 (2009).
4. Didonna, A. & Opal, P. The role of neurofilament aggregation in neurodegeneration: lessons from rare inherited neurological
disorders. Mol. Neurodegener. 14, 19. https://doi.org/10.1186/s13024-019-0318-4 (2019).
5. Gentil, B. J., Tibshirani, M. & Durham, H. D. Neurofilament dynamics and involvement in neurological disorders. Cell Tissue Res.
360, 609–620. https://doi.org/10.1007/s00441-014-2082-7 (2015).
6. Yoshida, T. & Nakagawa, M. Clinical aspects and pathology of Alexander disease, and morphological and functional alteration of
astrocytes induced by GFAP mutation. Neuropathology 32, 440–446. https://doi.org/10.1111/j.1440-1789.2011.01268.x (2012).
7. Mignot, C. et al. Dynamics of mutated GFAP aggregates revealed by real-time imaging of an astrocyte model of Alexander disease.
Exp. Cell Res. 313, 2766–2779. https://doi.org/10.1016/j.yexcr.2007.04.035 (2007).
Scientific Reports | (2021) 11:2379 | https://doi.org/10.1038/s41598-021-81542-8 12
Vol:.(1234567890)www.nature.com/scientificreports/
8. Moeton, M. et al. GFAP isoforms control intermediate filament network dynamics, cell morphology, and focal adhesions. Cell
Mol. Life Sci. 73, 4101–4120. https://doi.org/10.1007/s00018-016-2239-5 (2016).
9. Werner, N. S. et al. Epidermolysis bullosa simplex-type mutations alter the dynamics of the keratin cytoskeleton and reveal a
contribution of actin to the transport of keratin subunits. Mol. Biol. Cell 15, 990–1002. https://doi.org/10.1091/mbc.e03-09-0687
(2004).
10. Windoffer, R., Kolsch, A., Woll, S. & Leube, R. E. Focal adhesions are hotspots for keratin filament precursor formation. J. Cell
Biol. 173, 341–348. https://doi.org/10.1083/jcb.200511124 (2006).
11. Anton-Lamprecht, I. & Schnyder, U. W. Epidermolysis bullosa herpetiformis Dowling-Meara. Report of a case and pathomorpho-
genesis. Dermatologica 164, 221–235 (1982).
12. Fuchs, E. Genetic skin disorders of keratin. J. Investig. Dermatol. 99, 671–674. https://doi.org/10.1111/1523-1747.ep12613737
(1992).
13. Coulombe, P. A. et al. Point mutations in human keratin 14 genes of epidermolysis bullosa simplex patients: genetic and functional
analyses. Cell 66, 1301–1311. https://doi.org/10.1016/0092-8674(91)90051-y (1991).
14. Vassar, R., Coulombe, P. A., Degenstein, L., Albers, K. & Fuchs, E. Mutant keratin expression in transgenic mice causes marked
abnormalities resembling a human genetic skin disease. Cell 64, 365–380. https://doi.org/10.1016/0092-8674(91)90645-f (1991).
15. Buchau, F., Munz, C., Has, C., Lehmann, R. & Magin, T. M. KLHL16 degrades epidermal keratins. J. Investig. Dermatol. 138,
1871–1873. https://doi.org/10.1016/j.jid.2018.02.017 (2018).
16. Chamcheu, J. C. et al. Chemical chaperones protect epidermolysis bullosa simplex keratinocytes from heat stress-induced keratin
aggregation: involvement of heat shock proteins and MAP kinases. J. Investig. Dermatol. 131, 1684–1691. https://doi.org/10.1038/
jid.2011.93 (2011).
17. Loffek, S. et al. The ubiquitin ligase CHIP/STUB1 targets mutant keratins for degradation. Hum. Mutat. 31, 466–476. https://doi.
org/10.1002/humu.21222(2010).
18. Woll, S., Windoffer, R. & Leube, R. E. p38 MAPK-dependent shaping of the keratin cytoskeleton in cultured cells. J. Cell Biol. 177,
795–807. https://doi.org/10.1083/jcb.200703174 (2007).
19. Sporrer, M. et al. Treatment of keratinocytes with 4-phenylbutyrate in epidermolysis bullosa: Lessons for therapies in keratin
disorders. EBioMedicine 44, 502–515. https://doi.org/10.1016/j.ebiom.2019.04.062 (2019).
20. Qian, H., Sheetz, M. P. & Elson, E. L. Single particle tracking. Analysis of diffusion and flow in two-dimensional systems. Biophys.
J. 60, 910–921. https://doi.org/10.1016/S0006-3495(91)82125-7 (1991).
21. Kwan, R. et al. PKC412 normalizes mutation-related keratin filament disruption and hepatic injury in mice by promoting keratin-
myosin binding. Hepatology 62, 1858–1869. https://doi.org/10.1002/hep.27965 (2015).
22. Kepiro, M. et al. para-Nitroblebbistatin, the non-cytotoxic and photostable myosin II inhibitor. Angew. Chem. Int. Ed. Engl. 53,
8211–8215. https://doi.org/10.1002/anie.201403540 (2014).
23. Rauscher, A. A., Gyimesi, M., Kovacs, M. & Malnasi-Csizmadia, A. Targeting myosin by blebbistatin derivatives: optimization and
pharmacological potential. Trends Biochem. Sci. 43, 700–713. https://doi.org/10.1016/j.tibs.2018.06.006 (2018).
24. Medeiros, N. A., Burnette, D. T. & Forscher, P. Myosin II functions in actin-bundle turnover in neuronal growth cones. Nat. Cell.
Biol. 8, 215–226. https://doi.org/10.1038/ncb1367 (2006).
25. Nobezawa, D., Ikeda, S. I., Wada, E., Nagano, T. & Miyata, H. Directional transport of a bead bound to lamellipodial surface is
driven by actin polymerization. Biomed. Res. Int. 2017, 7804251. https://doi.org/10.1155/2017/7804251 (2017).
26. Yi, J., Wu, X. S., Crites, T. & Hammer, J. A. 3rd. Actin retrograde flow and actomyosin II arc contraction drive receptor cluster
dynamics at the immunological synapse in Jurkat T cells. Mol. Biol. Cell 23, 834–852. https://doi.org/10.1091/mbc.E11-08-0731
(2012).
27. Herrmann, H., Wedig, T., Porter, R. M., Lane, E. B. & Aebi, U. Characterization of early assembly intermediates of recombinant
human keratins. J. Struct. Biol. 137, 82–96. https://doi.org/10.1006/jsbi.2002.4466 (2002).
28. Coulombe, P. A., Hutton, M. E., Vassar, R. & Fuchs, E. A function for keratins and a common thread among different types of
epidermolysis bullosa simplex diseases. J. Cell Biol. 115, 1661–1674. https://doi.org/10.1083/jcb.115.6.1661 (1991).
29. Homberg, M. et al. Distinct impact of two keratin mutations causing epidermolysis bullosa simplex on keratinocyte adhesion and
stiffness. J. Investig. Dermatol. 135, 2437–2445. https://doi.org/10.1038/jid.2015.184 (2015).
30. Morley, S. M. et al. Generation and characterization of epidermolysis bullosa simplex cell lines: scratch assays show faster migra-
tion with disruptive keratin mutations. Br. J. Dermatol. 149, 46–58. https://doi.org/10.1046/j.1365-2133.2003.05493.x (2003).
31. Morley, S. M. et al. Temperature sensitivity of the keratin cytoskeleton and delayed spreading of keratinocyte lines derived from
EBS patients. J. Cell Sci. 108(Pt 11), 3463–3471 (1995).
32. Robert, A. et al. Kinesin-dependent transport of keratin filaments: a unified mechanism for intermediate filament transport. FASEB
J. 33, 388–399. https://doi.org/10.1096/fj.201800604R (2019).
33. Wang, F., Chen, S., Liu, H. B., Parent, C. A. & Coulombe, P. A. Keratin 6 regulates collective keratinocyte migration by altering
cell-cell and cell-matrix adhesion. J. Cell Biol. 217, 4314–4330. https://doi.org/10.1083/jcb.201712130 (2018).
34. Fujiwara, S., Deguchi, S. & Magin, T. M. Disease-associated keratin mutations reduce traction forces and compromise adhesion
and collective migration. J. Cell Sci. https://doi.org/10.1242/jcs.243956 (2020).
35. Liovic, M. et al. Severe keratin 5 and 14 mutations induce down-regulation of junction proteins in keratinocytes. Exp. Cell Res.
315, 2995–3003. https://doi.org/10.1016/j.yexcr.2009.07.013 (2009).
36. Russell, D., Andrews, P. D., James, J. & Lane, E. B. Mechanical stress induces profound remodelling of keratin filaments and cell
junctions in epidermolysis bullosa simplex keratinocytes. J. Cell Sci. 117, 5233–5243. https://doi.org/10.1242/jcs.01407 (2004).
37. D’Alessandro, M., Russell, D., Morley, S. M., Davies, A. M. & Lane, E. B. Keratin mutations of epidermolysis bullosa simplex alter
the kinetics of stress response to osmotic shock. J. Cell Sci. 115, 4341–4351. https://doi.org/10.1242/jcs.00120 (2002).
38. Karsch, S., Buchau, F., Magin, T. M. & Janshoff, A. An intact keratin network is crucial for mechanical integrity and barrier func-
tion in keratinocyte cell sheets. Cell. Mol. Life Sci. https://doi.org/10.1007/s00018-019-03424-7 (2020).
39. Windoffer, R., Beil, M., Magin, T. M. & Leube, R. E. Cytoskeleton in motion: the dynamics of keratin intermediate filaments in
epithelia. J. Cell Biol. 194, 669–678. https://doi.org/10.1083/jcb.201008095 (2011).
40. Kolsch, A., Windoffer, R., Wurflinger, T., Aach, T. & Leube, R. E. The keratin-filament cycle of assembly and disassembly. J Cell Sci
123, 2266–2272. https://doi.org/10.1242/jcs.068080 (2010).
41. Sawant, M. S. & Leube, R. E. Consequences of keratin phosphorylation for cytoskeletal organization and epithelial functions. Int.
Rev. Cell Mol. Biol. 330, 171–225. https://doi.org/10.1016/bs.ircmb.2016.09.005 (2017).
42. Riedl, J. et al. Lifeact: a versatile marker to visualize F-actin. Nat. Methods 5, 605–607. https://doi.org/10.1038/nmeth.1220 (2008).
43. Rueden, C. T. et al. Image J2: ImageJ for the next generation of scientific image data. BMC Bioinform. 18, 529. https://doi.
org/10.1186/s12859-017-1934-z (2017).
44. Schindelin, J. et al. Fiji: an open-source platform for biological-image analysis. Nat. Methods 9, 676–682. https://doi.org/10.1038/
nmeth.2019 (2012).
45. Diecke, F. P. et al. Regulation of Na-K-2Cl cotransport in cultured bovine corneal endothelial cells. Exp. Eye Res. 80, 777–785. https
://doi.org/10.1016/j.exer.2004.12.008 (2005).
46. Cui, W. J. et al. Myosin light chain kinase is responsible for high proliferative ability of breast cancer cells via anti-apoptosis involv-
ing p38 pathway. Acta Pharmacol. Sin. 31, 725–732. https://doi.org/10.1038/aps.2010.56 (2010).
Scientific Reports | (2021) 11:2379 | https://doi.org/10.1038/s41598-021-81542-8 13
Vol.:(0123456789)You can also read


