Drifting-snow statistics from multiple-year autonomous measurements in Adélie Land, East Antarctica
←
→
Page content transcription
If your browser does not render page correctly, please read the page content below
The Cryosphere, 14, 1713–1725, 2020
https://doi.org/10.5194/tc-14-1713-2020
© Author(s) 2020. This work is distributed under
the Creative Commons Attribution 4.0 License.

Drifting-snow statistics from multiple-year autonomous
measurements in Adélie Land, East Antarctica
Charles Amory
Department of Geography, University of Liège, Liège, Belgium

Correspondence: Charles Amory (charles.amory@uliege.be)

Received: 10 July 2019 – Discussion started: 2 September 2019
Revised: 23 April 2020 – Accepted: 29 April 2020 – Published: 29 May 2020

Abstract. Drifting snow is a widespread feature over the         (known as wind glaze areas) or even net ablation (known as
Antarctic ice sheet, whose climatological and hydrologi-         blue ice areas), whose presence has a profound influence on
cal significance at the continental scale have been con-         the local surface energy balance (Bintanja, 1999; Scambos
sequently investigated through modelling and satellite ap-       et al., 2012), possibly enhancing surface melt (Lenaerts et al.,
proaches. While field measurements are needed to evalu-          2017). In coastal areas, wind redistribution of snow is re-
ate and interpret model and satellite products, most drifting-   sponsible for an export of mass beyond the ice-sheet margins
snow observation campaigns in Antarctica involved data col-      (Scarchilli et al., 2010; Palm et al., 2017). Sublimation of
lected at a single location and over short time periods. With    snow particles during transport is a major component of the
the aim of acquiring new data relevant to the observation        surface heat and moisture budgets in regions, where most of
and modelling of drifting snow in Antarctic conditions, two      the precipitated snow is relocated by wind (e.g. Mann et al.,
remote locations in coastal Adélie Land (East Antarctica)        2000; Bintanja, 2001; Thiery et al., 2012).
that are 100 km apart were instrumented in January 2010             Because of the widespread character of drifting and blow-
with meteorological and second-generation IAV Engineering        ing snow over the vast and remote Antarctic continent, esti-
acoustic FlowCapt™ sensors. The data, provided nearly con-       mates of their hydrological and climatological significance at
tinuously so far, constitute the longest dataset of autonomous   the ice-sheet scale rely on parameterized methods (e.g. Gal-
near-surface (i.e. within 2 m) measurements of drifting snow     lée, 1998; Déry and Yau, 2002; Lenaerts and van den Broeke,
currently available over the Antarctic continent. This pa-       2012; Palm et al., 2017; van Wessem et al., 2018; Agosta
per presents an assessment of drifting-snow occurrences and      et al., 2019). A consensus emerging from these efforts that
snow mass transport from up to 9 years (2010–2018) of half-      has persisted for more than 2 decades suggests that, although
hourly observational records collected in one of the Antarctic   significant locally, mass loss through wind redistribution and
regions most prone to snow transport by wind. The dataset is     export into the ocean is of minor importance, while subli-
freely available to the scientific community and can be used     mation during transport remains the dominant sink of mass
to complement satellite products and evaluate snow-transport     when evaluated over the whole ice sheet. Conversely, con-
models close to the surface and at high temporal frequency.      trasting results can be found from one study to another in the
                                                                 absolute values attributed to the contribution of wind-driven
                                                                 snow processes to the large-scale mass transport. The latest
                                                                 continent-wide estimations of wind-driven snow sublimation
1   Introduction                                                 obtained from regional modelling (van Wessem et al., 2018)
                                                                 are lower by a factor of 4 than those computed from a com-
Wind-driven transport of snow in Antarctica, organized into      bination of satellite products and meteorological reanalyses
drifting ( < 2 m a.g.l.) and blowing (> 2 m a.g.l.) snow, has    (Palm et al., 2017). Modelled snow mass fluxes presented in
important implications for the ice-sheet climate and sur-        Agosta et al. (2019) exhibit a similar overall spatial pattern
face mass balance. Erosive winds redistribute snow at the        but are more than 3 times larger than those reported in van
surface and can form areas of near-zero net accumulation

Published by Copernicus Publications on behalf of the European Geosciences Union.
1714                                                                            C. Amory: Drifting-snow statistics in Adélie Land

Wessem et al. (2018). Considering the diversity of interac-           Table 1. Geographical and climate characteristics of the two mea-
tions and the non-linearity of processes involved in the on-          surement locations for the respective observation periods.
set, development and magnitude of wind-driven snow occur-
rences (e.g. Déry et al., 1998; Bintanja, 2000; Amory et al.,           Station                            D47a                     D17b
2016), model results as well as the assumptions made in the             Start of observation               9 Jan 2010               3 Feb 2010
implementation of wind-driven snow physics need to be care-             End of observation                 27 Dec 2012              31 Dec 2018c
fully assessed with independent observations.                           Location                           67.4◦ S, 138.7◦ E        66.7◦ S, 139.9◦ E
   Advances in active lidar remote sensing of the atmo-                 Altitude                           1560                     450
                                                                        Distance from coast (km)           110                      10
sphere from space have provided recent insights into the
                                                                        Wind speed (m s−1 )                11.9                     9.8
spatial distribution and temporal variability in blowing snow           Air temperature (◦ C)              −25.1                    −15.5
over the last decade independently of modelling approaches.             Air relative humidity (%)          90.6                     81.4
Although of unrivalled interest for studying blowing snow               Wind direction (◦ )                158                      154
over large temporal, horizontal and vertical scales simulta-            Directional constancy              0.95                     0.92
neously, satellite lidar data provide snapshots of a particular       a Mean values at sensor level are used. b Mean values at sensor level nearest to 2 m are
set of blowing-snow properties (frequency, layer depth, opti-         used. c The station at site D17 is still operative.
cal thickness) relative to the satellite revisit time (Palm et al.,
2011). Moreover, prior satellite detection has been restricted
to clear-sky or optically thin-cloud conditions and relatively        mass fluxes assuming a gamma distribution of particles (e.g.
deep (> 30 m) blowing-snow layers, precluding its applica-            Déry et al., 1998; Déry and Yau, 1999, 2001; Bintanja, 2000;
tion for characterization of shallower (drifting and blowing          Nemoto, 2004; Lenaerts et al., 2012). Additionally observed
snow) layers and for model evaluation in the vicinity of the          snow mass fluxes can be directly used to assess the abil-
surface. While this last limitation is also shared with ground-       ity of models to reproduce wind-driven snow conditions at
based remote-sensing techniques (Mahesh et al., 2003; Gos-            a specific location from a qualitative (e.g. Lenaerts et al.,
sart et al., 2017), measured vertical profiles of snow mass           2012; Gallée et al., 2013) or a quantitative (e.g. Nishimura
fluxes display, however, the strongest gradients in the lowest        and Nemoto, 2005; Yang and Yau, 2007; Amory et al., 2015;
metres of the atmosphere (Budd, 1966; Mann et al., 2000;              van Wessem et al., 2018) perspective. However, even if each
Nishimura and Nemoto, 2005).                                          dataset is individually valuable regarding the scarcity of ob-
   Direct near-surface observations of wind-driven snow in            servations, in most cases the data were collected at a sin-
Antarctica are sparse in time and space to the extent that            gle location and over a few months, precluding investigations
long-term quality-controlled datasets that still constitute es-       into spatial and temporal (seasonal and interannual) variabil-
sential development and evaluation bases for parametrization          ity.
schemes barely exist. The absence of an official standard                In order to acquire new model-evaluation-oriented obser-
instrument has led to the use of a wide range of observa-             vations, a field campaign specifically dedicated to drifting
tion techniques, from mechanical traps and nets to electronic         snow was initiated in January 2010 in Adélie Land (Trouvil-
(optical, piezoelectric, acoustic) sensors (see Leonard et al.,       liez et al., 2014), a wind confluence area of East Antarctica.
2012, and Trouvilliez et al., 2014, for an extensive review)          Two distinct locations, namely D17 and D47 (Fig. S1 in the
as well as visual observations carried out at some Antarc-            Supplement), were instrumented for long-term data acquisi-
tic manned stations (Mahesh et al., 2003; König-Langlo and            tion and equipped with second-generation IAV Engineering
Loose, 2007). However, like satellite products, visual obser-         acoustic FlowCapt™ sensors (hereafter referred to as 2G-
vations are representative of instantaneous conditions only           FlowCapt™), which are particularly well-suited for continu-
and are additionally dependent on personal appreciation of            ous monitoring in remote environments and under harsh con-
the observer, who might change with time, leading to non-             ditions (Trouvilliez et al., 2015). This study presents an as-
uniform and temporally discontinuous records.                         sessment of drifting-snow occurrences and snow mass trans-
   In spite of their disparity, near-surface measurements of          port from analysis of multiple-year time series of meteoro-
wind-driven snow over the Antarctic ice sheet have provided           logical data and snow mass fluxes collected in this frame-
valuable and accurate information that cannot be sensed re-           work within a katabatic wind region of the Antarctic ice sheet
motely nor determined visually. This includes, among others,          among the most prone to snow transport by wind.
particle size distributions and related dimensionless shape
parameters, total particle numbers, and snow mass fluxes at
different heights. Although the data collected are also relative
to the instrument used and can hardly compare to each other,
they are eventually useful for modelling experiments. The
dimensionless shape parameter and particle number are, for
instance, either predicted or prescribed quantities in snow-
transport models that compute sublimation rates and snow

The Cryosphere, 14, 1713–1725, 2020                                                              https://doi.org/10.5194/tc-14-1713-2020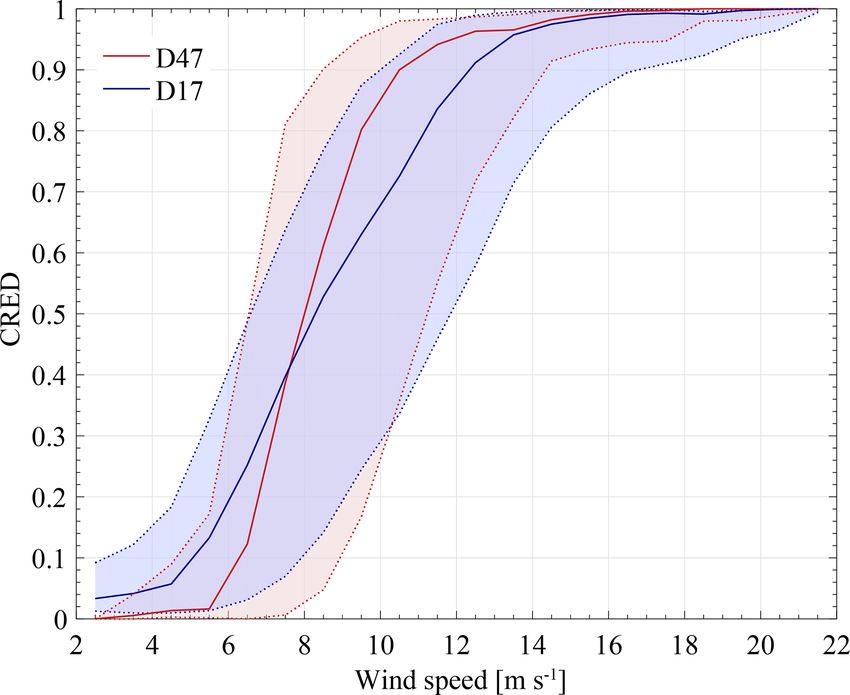
C. Amory: Drifting-snow statistics in Adélie Land                                                                              1715

Figure 1. Location of Dumont d’Urville Station (DdU) and sites D17 and D47 in coastal Adélie Land and schematic cross section showing
elevation and distance from the coastline for each site. Contours show elevation each 500 m from 0 to 4500 m.

2     Site characteristics and data                                  of D47 allowed for limited servicing time so that summer
                                                                     visits were restricted to the maintenance of sensors without
2.1    Instrumentation                                               raising operations. As a result the measurement heights de-
                                                                     creased from their initial values to 1.5 m for wind speed and
                                                                     direction and 0.9 m for temperature and relative humidity in
The study area consists of a sloping snowfield with a break
                                                                     late December 2012, when the equipment was entirely re-
in slope at nearly 210 km inland at about 2100 m a.s.l., down-
                                                                     moved. The instrument types and specificities are summa-
stream of which D47 and D17 are located (Fig. 1). The two
                                                                     rized in Table S1 in the Supplement. Data were sampled at
measurement sites are 100 km apart, south-west of the per-
                                                                     15 s intervals and stored at a half-hourly time resolution on a
manent French station Dumont d’Urville (66.6◦ S, 140◦ W;
                                                                     Campbell CR3000 data logger.
40 m a.s.l.). Because of their remote locations, access and
maintenance activities are only possible in summer. At D17,
a 7 m high mast is equipped with six levels, logarithmically         2.2   Climate settings
spaced (initial heights of 0.8, 1.3, 2, 2.8, 3.9 and 5.5 m),
of anemometers and thermo-hygrometers housed in natu-                The surface climate in coastal Adélie Land is dominated by
rally ventilated MET21 radiation shields (Fig. S1, left panel).      intense, frequent and persistent katabatic flows originating
The meteorological mast is oriented toward the prevailing            from the continental interior, where strong temperature in-
wind direction to prevent flow distortion by the measurement         versions develop. The local topography controls the drainage
structure. The wind direction is sampled at the upper level          of the cold, dense near-surface air as it flows downslope and
only. Site D47 is equipped with only one level of wind speed         accelerates toward the steep coastal escarpment over an un-
and direction measured at 2.8 m and temperature and rela-            obstructed snow-covered fetch of several hundreds of kilo-
tive humidity measured at 2.2 m (Fig. S1, right panel). The          metres. Table 1 lists geographical settings and climate in-
thermo-hygrometers are factory calibrated to report relative         formation for the two sites. Wind speed and temperature
humidity with respect to liquid water. Goff and Gratch (1945)        regimes at 2 m height at the two measurement locations fol-
formulae are used to convert to relative humidity with respect       low an annual cycle typical of katabatic wind confluence ar-
to ice for air temperatures below 0 ◦ C, using the sensor tem-       eas (Fig. S2). Lower temperatures and higher wind speeds
perature reports in the conversion. Ultrasonic depth gauges          are observed in winter as a result of the strong radiative
are used to monitor surface height changes at both sites, from       deficit of the surface and increased katabatic forcing. In sum-
which the elevation of the sensors above the surface is as-          mer, the absorption of shortwave radiation by the surface
sessed throughout the year. At D17, this information is not          diminishes the katabatic forcing, air temperature increases
available before December 2012, when the height ranger was           and wind speed reduces. The higher incidence of drifting
deployed. The station is currently still operative, and the in-      snow (Fig. S3) and inherent loading of air masses with mois-
struments along the profile are raised back manually to orig-        ture through sublimation (Amory and Kittel, 2019) combined
inal heights at the beginning of each summer field campaign.         with lower temperatures in winter account for an increase in
The remoteness and the frequently harsh weather conditions           near-surface relative humidity compared to summer values.

https://doi.org/10.5194/tc-14-1713-2020                                                    The Cryosphere, 14, 1713–1725, 2020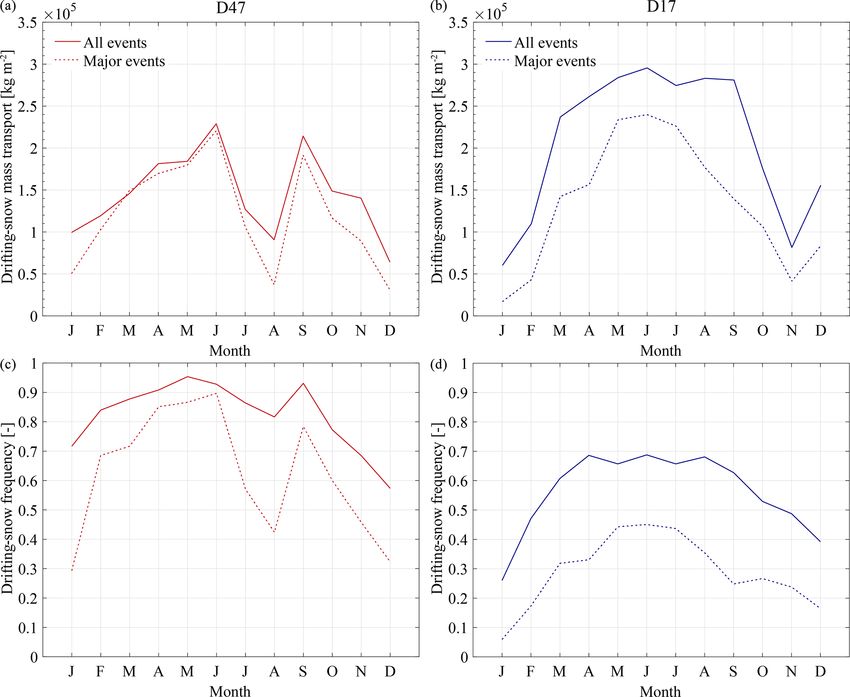
1716                                                                      C. Amory: Drifting-snow statistics in Adélie Land

Substantially lower temperatures and subsequent dampened          remote-sensing techniques can only retrieve information on
seasonal variations in relative humidity are observed at D47      blowing-snow layers for which the snow particles are lifted
due to the higher elevation.                                      at several tens of metres off the surface (Mahesh et al., 2003;
   Even if D17 is located near the downstream end of the          Palm et al., 2011; Gossart et al., 2017).
sloping ice terrain where stronger katabatic forcing can be
expected, year-round higher wind speeds are consistently ob-      2.3.2   Field installation
served at D47 some 100 km inland, as already reported by
Wendler et al. (1993). Although the question remains open         In early January 2010 at D47, two 2G-FlowCapt™ sensors
for further study, an explanation for this feature may in-        were installed and superimposed vertically, with the bottom
volve the deceleration and subsequent thickening of the at-       of the lower sensor located close to the surface (∼ 0.1 m) in
mospheric boundary-layer flow beyond the ice-sheet mar-           order to detect the onset of drifting snow (Fig. S1). At D17
gins, where it is no longer sustained by the buoyancy (kata-      two sensors were deployed in February 2010, but only one
batic) force. The resulting accumulation of cold air down-        was initially installed close to the surface, while the other one
stream over the ocean leads to the establishment of an ups-       was set up at the top of the measurement structure. The upper
lope pressure gradient force opposing the katabatic flow that     sensor was removed in January 2011 because of malfunction
is responsible for an additional slowing of the airstream when    and reinstalled after repair in late December 2012, similarly
reaching the coastal area (Gallée and Pettré, 1998), possibly     to the configuration adopted for D47. Like for the other me-
accounting for the lower wind speeds at D17 compared to           teorological instruments, the 2G-FlowCapt™ sensors at D17
D47.                                                              were reset into their original position with the lower sensor
   Both measurement sites show a very high constancy              near the surface during each summer visit, except for austral
in wind direction (defined as the ratio of the resultant          summers 2015–2016 and 2016–2017, during which the pair
wind speed to the mean wind speed), reflecting the quasi-         of instruments were left unchanged. Consequently, substan-
unidirectional nature of the flow in coastal Adélie Land (Ta-     tial burial of the lower sensor took place during the 3-year
ble 1; Fig. S1). This provides evidence that topographic chan-    period from early 2015 to late 2017 depending on snow accu-
nelling strongly controls the surface wind regime and indi-       mulation and ablation. As no raising operations were under-
cates that cyclonic disturbances do not significantly alter the   taken at D47, the measurement structure was progressively
direction of the main flow.                                       buried and the lower 2G-FlowCapt™ became entirely cov-
                                                                  ered with snow during the course of the year 2012. Flow-
2.3     Drifting-snow data                                        Capt™ consumes little power and is designed to withstand
                                                                  harsh climate conditions without regular human attendance.
2.3.1    Measurement principle                                    At each station battery voltage is monitored and stored to-
                                                                  gether with the meteorological variables in the data logger to
At each station the meteorological records were comple-           ensure that the entire measurement system is sufficiently sup-
mented by drifting-snow measurements made with 2G-                plied with energy throughout the winter. The 2G-FlowCapt™
FlowCapt™ sensors. The instrument consists of a 1 m long          sensors are continuously solicited by the data logger (RS232
tube containing electroacoustic transducers that measure the      connection) such that instances of instrument malfunction
acoustic vibration caused by the impacts of wind-borne snow       (absence of response and no data) can be unambiguously
particles on the tube. Using spectral analysis, the sensor        distinguished from the absence of drifting snow (data con-
accurately distinguishes the low-frequency noise generated        taining null values). A thorough check on the observations
by turbulence from the high-frequency drifting-snow sig-          was performed and resulted in omission of misleading data
nal, which is proportional to the snow mass flux integrated       wherever necessary. Except for those very few cases, mainte-
over the length of the tube (Chritin et al., 1999). This means    nance periods in summer, and a major 2-month failure of the
that the measured acoustic vibration, and, thus, the estima-      lower 2G-FlowCapt™ sensor at D47 in May and June 2012,
tion of the snow mass flux, depends on the shape, size, den-      the dataset is continuous along the respective measurement
sity and speed of each individual particle colliding with the     periods.
tube (Cierco et al., 2007). As precipitating snow particles di-
rectly originating from clouds and drifting (saltating and/or     2.3.3   Accuracy assessment
suspended) snow particles relocated from the ground cannot
be discriminated, measured snow mass fluxes account for           While FlowCapt™ sensors can detect the occurrence of snow
all forms of wind-driven snow along the sampling height.          transport with a high level of confidence, the ability of the
2G-FlowCapt™ can record continuous information as long            original design to estimate snow mass fluxes is more ques-
as it remains partially exposed. This is an advantage over        tionable (Cierco et al., 2007). These accuracy issues, without
visual observations and satellite products provided at spo-       being necessarily solved, have been significantly improved
radic intervals. Moreover, the ability of these sensors to de-    with 2G-FlowCapt™, facilitating its use for quantitative ap-
tect events of small magnitude is particularly interesting, as    plications (Trouvilliez et al., 2015). Although measurement

The Cryosphere, 14, 1713–1725, 2020                                                   https://doi.org/10.5194/tc-14-1713-2020
C. Amory: Drifting-snow statistics in Adélie Land 1717
uncertainty is not known, 2G-FlowCapt™ was shown to gen- threshold yielded a high level of agreement (98.6 %) be-
erally underestimate the snow mass flux relative to integrated tween the SPC-S7 and 2G-FlowCapt™ in terms of occur-
estimates computed from optical measurements made with a rence detection in the comparison study led by Trouvilliez
snow particle counter S7 (SPC-S7; taken as a reference in et al. (2015) in the Alps. Since this value remains small com-
the study) during a winter season in the French Alps, par- pared to snow mass fluxes estimated during drifting-snow oc-
ticularly during concurrent precipitation (Trouvilliez et al., currences (see Sect. 3.4), the confidence threshold is assumed
2015). During mixed drifting-snow events, when erosion oc- independent of the exposed length of the sensor. The sensor
curs simultaneously with snowfall, the density of precipitat- is considered unburied as long as at least 10 % (i.e. 0.1 m) of
ing particles which have not yet reached the ground is lower its initial length remain uncovered with snow.
than eroded, more rounded snow particles originating from Changes in the exposed length of the 2G-FlowCapt™
the ground, which have lost their original crystal shape and through snow accumulation and ablation affect the estima-
size through collision, sublimation and the thermal processes tion of the snow mass flux, as it is vertically integrated over
of metamorphism. For a given snow mass flux, the particles’ the uncovered part of the instrument. This is a matter of con-
momentum, and by extension the measured acoustic pres- cern at both sites, since precipitation along the Adélie coast
sure, is therefore lower during a mixed drifting-snow event occurs year-round almost exclusively in the form of snowfall,
than during an event predominantly driven by the erosion with a mean accumulation amounting to 362 mm w.e. yr−1
process. This results in an underestimation of the snow mass (Agosta et al., 2012), and frequent, high wind speeds induce
flux measured by 2G-FlowCapt™ during mixed events, with frequent erosion and deposition of snow. As a result, the ac-
a magnitude depending on the relative proportion of eroded tual sampling height varied substantially and non-uniformly
particles against fresh snow particles. throughout the measurement period, preventing direct com-
Environmental conditions influence greatly the estimation parisons of snow-transport amounts over time. This is ac-
of the snow mass flux by 2G-FlowCapt™. The intercom- counted for in a simple way by combining, when available,
parison experiment in the Alps was done within a range half-hourly snow mass fluxes from the two measurement lev-
of mass flux values (< 2.5 × 10⁻² kg m−2 s−1 ) significantly els to derive a standardized estimate of the drifting-snow
lower than those encountered in Adélie Land (see Sect. 3.4). mass flux (i.e. vertically integrated between 0 and 2 m over
In addition, comparatively stronger surface winds and lower the snow surface) ηDR such that
temperature on the Antarctic ice sheet favour the breaking
and rounding of snow particles. This suggests that the per- η1 + η2 , h1 + h2 >href ,
ηDR = (1)
formance of 2G-FlowCapt™ remains to be assessed in the η1 + η2 · h1h+h
ref
2
, h1 + h2 < href ,
extreme Antarctic environment, in which large proportions
of small, rounded particles can be expected in drift condi- where ηi (kg m−2 s−1 ) is the observed snow mass flux in-
tions (i.e. within 2 m a.g.l.) even with concurrent precipitat- tegrated over the exposed height hi (m) of the correspond-
ing snow (Nishimura and Nemoto, 2005). ing 2G-FlowCapt™ sensor, and href = 2 m corresponds to
A field experiment involving measurements with SPC-S7 the sum of two fully exposed 1 m long 2G-FlowCapt™ sen-
and 2G-FlowCapt™ sensors performed during a 24 h long sors. In other words, when h1 + h2 < 2 m, it is assumed
snow-transport event was undertaken at site D17 in late Jan- that the measured snow mass flux is constant up to 2 m. To
uary 2014 (Fig. S3). Strong drift conditions were observed, keep consistency with the confidence threshold for the detec-
with 2 m wind speeds and snow mass fluxes reaching up to tion of drifting-snow occurrences, snow mass fluxes below
19 m s−1 and 4×10⁻¹ kg m−2 s−1 respectively. Although the 10−3 kg m−2 s−1 were set to zero. The horizontal snow mass
statistical representativeness of the results may be small due transport in drift conditions for a given period of time [t0 , tn ],
to the low number of data collected during only one event, the QDR , can then be written as
comparison shows that the snow mass fluxes provided by the Ztn
two types of sensors are very similar in magnitude (Fig. S4).
QDR (t) = ηDR (t) dt. (2)
Further details on the experimental set-up and comparison
t0
methodology are provided in the Supplement (Sect. S1).
2.3.4 Computation of drifting-snow frequency and
mass transport 3 Analysis of observations
To remove electronic or turbulence noise and ensure that ac- 3.1 Spatial and temporal variations in drifting-snow
tual occurrences are detected, drifting snow has been consid- occurrences
ered to occur when the half-hourly mean of the snow mass
flux exceeds a confidence threshold of 10−3 kg m−2 s−1 , as Monthly values of drifting-snow frequency at D47 and D17
determined from visual observations on the field in Adélie indicate that drifting snow is a regular feature of the coastal
Land (Amory et al., 2017). Note that the same confidence slopes of Adélie Land (Fig. 2; overall averages of 0.81 at
https://doi.org/10.5194/tc-14-1713-2020 The Cryosphere, 14, 1713–1725, 20201718 C. Amory: Drifting-snow statistics in Adélie Land
Figure 2. Seasonal variability in drifting-snow frequency as recovered by the 2G-FlowCapt™ instruments. Shaded areas correspond to
frequencies respectively computed using a relaxed and a stricter confidence threshold of 10−4 and 10−2 kg m−2 s−1 and are shown as a
measure of uncertainty. The absence of data at D47 during May and June 2012 is due to instrument malfunction.
lar inter-annual variability is depicted (annual averages range
from 0.73 to 0.85 at D47 and 0.45 to 0.68 at D17), drifting-
snow frequency varies strongly within the year, with an am-
plitude that can differ from year to year. Both locations expe-
rience a higher incidence of drifting snow in winter (defined
here as the 8-month period between 1 March and 1 Novem-
ber) than during the rest of the year, a pattern quite com-
mon over Antarctica (Mahesh et al., 2003; Scarchilli et al.,
2010; Gossart et al., 2017; Palm et al., 2018). At the end
of winter, a gradual decrease in drifting-snow frequency is
observed until a minimum is reached during summer, con-
sistent with the annual course of wind speed (see Fig. S2,
upper panel). This seasonal contrast is more pronounced at
D17 than at D47 due to the stronger inhibition of erosion
in summer, resulting from lower wind speeds and higher air
temperatures that promote the formation of cohesive bonds
holding particles to the surface (e.g. Schmidt, 1980; Amory
et al., 2017). Although the use of a lowered threshold does
Figure 3. CRED distribution showing the increasing probability of
observing drifting snow with increasing 2 m wind speed at sites
not affect the derived frequency significantly, the stronger
D47 (red curve) and D17 (blue curve). Shaded areas correspond sensitivity to the increased threshold demonstrates the im-
to CREDs respectively computed using a relaxed and a stricter con- portant contribution of occurrences of relatively small mag-
fidence threshold of 10−4 and 10−2 kg m−2 s−1 and are shown as nitude (i.e. < 10−2 kg m−2 s−1 ) to the overall frequency. This
a measure of uncertainty. demonstrates the need to specify explicitly the chosen thresh-
old value when computing drifting-snow frequency from 2G-
FlowCapt™.
D47 and 0.57 at D17). Frequency values were computed for The monthly values of drifting-snow frequency systemat-
each month of the observation period as the ratio between ically observed 100 km inland at D47 are also higher than
the number of half-hourly observations with a snow mass those close to the coastline at D17. Analysis of drift condi-
flux at the lower, unburied level ηi higher than the confi- tions documented simultaneously at D17 and D47 for the 3-
dence threshold of 10−3 kg m−2 s−1 and the total number of year period 2010–2012 shows a significant spatial variability,
observations in that month. In each panel the shaded area with almost all drifting-snow occurrences at D17 involving
corresponds to the frequency respectively computed using a drifting snow at D47, while the opposite does not hold true
relaxed and a stricter threshold of 10−4 and 10−2 kg m−2 s−1 (Table S2). Wind speeds at D47 for which drifting snow is
and is shown as a measure of uncertainty. While no particu-
The Cryosphere, 14, 1713–1725, 2020 https://doi.org/10.5194/tc-14-1713-2020C. Amory: Drifting-snow statistics in Adélie Land 1719
of snow transport from a set of common meteorological pa-
rameters, a credibility index (CRED) was used in a simpler
approach to provide an estimation of the frequency of occur-
rence of drifting snow under specific wind conditions:
p
CRED = , (3)
p+n
where p is the number of occurrences of drifting snow for
a given wind speed range and n is the number of non-
occurrences within that range. CRED varies from 0 to 1 and
reflects the probability of observing drifting snow for a given
range of wind speeds. Here a CRED of 0 means that no
occurrence of drifting snow was observed for the selected
range of wind speeds, while a CRED of 1 indicates that all
wind speeds in that range were associated with drifting snow.
CRED was calculated from the meteorological dataset within
Figure 4. Distribution of durations of drifting-snow events at D47 1 m s−1 intervals of wind speed. Occurrences observed be-
(red) and D17 (blue). The minimum values of duration and drifting-
low 2 m s−1 and above 22 m s−1 were not considered, since
snow mass transport for an event to be retained in the statistics are
their relative proportion within each wind speed interval in-
respectively set to 4 h and 15 kg m−2 .
dividually accounted for less than 1 % of the observations.
As in Fig. 2 the sensitivity of CREDs to the relaxed and
Table 2. Standardized estimates of annual horizontal snow mass stricter confidence thresholds used for acknowledging the oc-
transport in drift conditions.
currence of drifting snow is illustrated by the shaded areas.
The frequency of occurrence generally increases with
Year Snow mass transport (kg m−2 )
wind speed (Fig. 3) and typically resembles a cumulative
D17 D47 normal distribution (Baggaley and Hanesiak, 2005). As 2G-
2010 – 1.89 × 10⁶ FlowCapt™ does not provide information on the source of
2011 – 1.64 × 10⁶ wind-borne snow particles, CREDs in wind speed intervals
2012 – – lower than 5 m s−1 at D17 most likely correspond to rare oc-
2013 2.05 × 10⁶ – currences detected during snowfall (without necessarily in-
2014 2.42 × 10⁶ – volving erosion of snow) or shortly after the deposition of
2015 2.68 × 10⁶ – a loose snow layer that is easily erodible during light-wind
2016 2.63 × 10⁶ – conditions. Then, for higher intervals, small differences in
2017 2.12 × 10⁶ – wind speed involve large variations in the CRED. At both
2018 2.20 × 10⁶ – sites, the likelihood of observing drifting snow becomes im-
portant (CRED > 0.5) when wind speeds rise above 8 m s−1 .
Wind speeds above 12 m s−1 almost systematically produce
observed at D47 only (28.3 % of occurrences) are generally drifting snow (CRED > 0.9), indicating that threshold (fric-
lower (average of 11.5 m s−1 ) compared to those for which tion velocity) values for snow transport are most often ex-
the two locations experience drifting snow simultaneously ceeded in such wind conditions. Differences in local cli-
(average of 13.5 m s−1 ). This means that the largest occur- mate between the two locations could be expected to af-
rences are seen at both sites, and the higher drifting-snow fect CRED distributions through their influence on post-
frequency at D47 is mainly due to additional occurrences of depositional processes. Lower average wind speeds at D17
lesser magnitude for which the reduced wind speed down- could be associated with lower compaction rates enabling
stream at D17 is not high enough to trigger snow transport. drifting snow to be triggered by lower wind speeds than
at D47. Conversely lower drift-induced compaction at D17
3.2 Frequency of occurrence could be compensated by stronger interparticle bonding re-
sulting from higher average air temperatures. Accurate in-
Wind speeds at 2 m height for which drifting snow is de- vestigation of these aspects would inexorably require knowl-
tected (averages of 13.1 m s−1 for D47 and 12.6 m s−1 for edge of snow properties at the surface. However, Fig. 3 il-
D17) are generally higher than those occurring without drift- lustrates substantially similar CRED distributions, indicating
ing snow (averages of 7 m s−1 for D47 and 6.1 m s−1 for that wind speed is the main driver behind the occurrence of
D17), although a wide range of similar wind speeds coexists drifting snow at these locations.
between both categories. Following the approach of Bagga-
ley and Hanesiak (2005) aiming at predicting the occurrence
https://doi.org/10.5194/tc-14-1713-2020 The Cryosphere, 14, 1713–1725, 20201720 C. Amory: Drifting-snow statistics in Adélie Land
Figure 5. Drifting-snow mass flux against 2 m wind speed recorded at D47 (a) and D17 (b). Only periods for which two 2G-FlowCapt™
sensors are installed and/or the lower sensor is not entirely covered with snow (i.e. h1 > 0.1 m) are considered.
of erodible snow, the combination of which determines the
magnitude of snow mass fluxes and the duration of drifting-
snow events (Vionnet et al., 2013; Amory et al., 2016, 2017).
Following Vionnet et al. (2013), a drifting-snow event was
defined as a period over which snow transport is detected for
a minimum duration of 4 h. That is, an event is considered
to start and end when the half-hourly snow mass flux at the
lower unburied level ηi respectively rises above and drops
below the confidence threshold of 10−3 kg m−2 s−1 . To fo-
cus on significant drifting-snow events, an additional crite-
rion requires that a snow mass QDR of at least 15 kg m−2
(resulting from a drifting-snow mass flux ηDR at the confi-
dence threshold of 10−3 kg m−2 s−1 for a duration of 4 h) is
transported along the event. Note that in the case of complete
burial of the lower sensor (i.e. h1 < 0.1 m) or in the absence
of a sensor at the second level, this criterion is applied on the
snow mass transport computed from the single available level
Figure 6. Logarithm of snow mass transport in drift conditions without correction. By applying this selection procedure to
against duration for each drifting-snow event recorded at D47 (red the whole database, 1566 and 226 drifting-snow events were
circles) and D17 (blue crosses). Only periods for which two 2G- respectively identified at D17 and D47. Most events do not
FlowCapt™ sensors were installed and/or not entirely covered with exceed 72 h at D17 and can reach 10 d at most, while a slight
snow are considered. Linear fits for D47 (black line) and D17 (light
proportion (7 %) of events at D47 last more than 10 d, with
blue line) data are also reported on the graph, in which duration is
a maximum duration of 26 d (Fig. 4). In short, drifting-snow
expressed in hours.
events are on average twice as numerous but roughly 2 times
shorter at D17 (yearly average number of 173 and median du-
ration of 15 h) than at D47 (yearly average number of 95 and
3.3 Duration of drifting-snow events
median duration of 27.5 h), where stronger winds can sustain
longer events. Note that these statistics are not significantly
Drifting snow occurs as long as the effective shear stress ex-
altered if the length of the time series considered for D17 is
erted on the snow surface by the overlying airstream (i.e. the
reduced to that of D47.
friction velocity) equals or exceeds the threshold value for
erosion. Concurrent snowfall and advection of snow from up-
wind areas can also contribute to the wind-borne snow mass. 3.4 Horizontal drifting-snow mass transport
The incidence of drifting snow depends on (and is affected by
changes in) flow dynamics, surface roughness, cohesion of The drifting-snow mass flux ηDR typically tends to increase
exposed surface snow particles or more generally availability with wind speed in a power-law fashion (Fig. 5). This well-
The Cryosphere, 14, 1713–1725, 2020 https://doi.org/10.5194/tc-14-1713-2020C. Amory: Drifting-snow statistics in Adélie Land 1721 Figure 7. Intra-annual variability in drifting-snow mass transport (a, b) and related drifting-snow frequency (c, d) at D47 (a, c) and D17 (b, d). The relative contribution of major drifting-snow events (see text) is highlighted in dotted lines. Summed mass transport and frequency values were first determined for each month and averaged within each monthly bin to produce monthly average values. The variability (standard deviation) is not shown due to the short length of the time series. known behaviour (Radok, 1977; Mann et al., 2000) is, how- snow surface. This means that concurrent documentation of ever, depicted with significant dispersion and notable differ- turbulence and surface snow properties is required for a bet- ences between the two locations; the data at D17 show that ter assessment of drifting-snow processes and improvements drifting-snow mass fluxes can be of greater magnitude than of model predictability (e.g. Baggaley and Hanesiak, 2005; at D47 for similar wind speeds and exhibit a generally higher Vionnet et al., 2013). variability along the range of wind speeds. This illustrates Despite the non-linear behaviour of the drifting-snow mass the diversity and spatial variability in factors controlling the flux illustrated in Fig. 5, QDR increases linearly with the wind-borne snow mass, as mentioned in the previous sec- event duration (Fig. 6). Values of QDR were computed for tion. While wind speed can be used to predict the occurrence each drifting-snow event identified in the database along of drifting snow with quite a similar probability distribution which data from the two sensors are uninterruptedly avail- between both locations (Fig. 3), on the other hand Fig. 5 able. Linear regression fits are shown, and their respective demonstrates that more caution should be taken when scaling equations are reported on the graph. A logarithm scale is pre- drifting-snow mass transport with wind speed or related sin- ferred for readability purposes. Figure 6 also shows that QDR gle parameters independent of surface snow properties (e.g. hardly exceeds 105 kg m−2 even for the longest events, which Mann et al., 2000). Such an approach would indeed involve thus seems to appear as an upper bound value for the mass mixtures of power laws to capture the large variability in transported in drift conditions during a single event. This drifting-snow mass flux within the same wind speed interval, is particularly well illustrated by D47 data. High values of particularly at D17, where almost the entire range of values is QDR for a wide range of durations involve large snow mass observed from 15 m s−1 . Drifting snow is highly non-linear fluxes recorded at the two measurement levels, indicating the in nature and results essentially from the competitive balance regular occurrence of well-developed, non-intermittent trans- between atmospheric drag and cohesive forces acting on the port events in which particles are simultaneously carried out https://doi.org/10.5194/tc-14-1713-2020 The Cryosphere, 14, 1713–1725, 2020
1722                                                                    C. Amory: Drifting-snow statistics in Adélie Land

through both the saltation and suspension mechanisms. This       form incidence of drifting snow in winter, the sharp decrease
suggests that events of small magnitude involving low values     in QDR from June to August at D47 is due to a reduced occur-
of QDR and/or during which transport in saltation dominates      rence of major events during this period. This demonstrates
over transport in suspension must be comparatively short-        that high monthly values of drifting-snow frequency do not
lived. This, however, cannot be substantiated by studying the    directly relate to the magnitude of snow transport, since they
two levels separately because snow mass fluxes are vertically    can mainly consist of multiple but relatively brief events in-
integrated over the exposed length of the sensor, which for      volving low or moderate snow mass fluxes. This also sug-
the sensor closest to the ground almost always largely ex-       gests that, from a modelling perspective, representing these
ceeds typical saltation heights (i.e. ∼ 0.1 m).                  major events rather than the complete range of drifting-snow
   On an annual basis, both kinds of events combine to pro-      occurrences would be sufficient to capture the bulk of the
duce yearly values of QDR close to or above 2 × 10⁶ kg m−2       contribution of drifting-snow processes to the local surface
at both locations (Table 2). Note that annual values of QDR      mass balance.
decrease only very slightly (less than 5 %) when a stricter
confidence threshold is applied (i.e. only snow mass fluxes
ηi > 10−2 kg m−2 s−1 are considered), a result of large snow     4   Conclusions
mass fluxes well beyond this threshold regularly occurring
during drifting-snow events. Such high estimates suggest that    Meteorological data and snow mass fluxes automatically ac-
redistribution of snow by wind and concurrent sublimation of     quired at two locations 100 km apart in Adélie Land, D17
snow particles during transport are important components of      and D47, were combined to illustrate the spatial and temporal
the surface mass balance in Adélie Land (Agosta et al., 2012;    variability in drifting-snow frequency and mass transport in
Amory and Kittel, 2019).                                         a small portion of the East Antarctic coast. While the equip-
                                                                 ment at D47 was dismantled after a period of 3 years (2010–
3.5    Contribution of major drifting-snow events                2012), station D17 is still operative, and the data provided
                                                                 nearly continuously for a period of 9 years (2010–2018)
The linear relationship between QDR and event duration il-       constitute the longest database of autonomous near-surface
lustrated in Fig. 6 can be used to distinguish the contribu-     measurements of drifting snow currently available over the
tion of the largest events to the drifting-snow mass transport   Antarctic continent. It should be noted that data collection
from that of the residual events. Major drifting-snow events     continues at D17, and new measurements will be available
were defined as the events whose duration is higher than the     in the future. Statistical analysis of the current dataset in-
75th percentile for each site. Figure 7 shows that such major    dicates that the likelihood of drifting snow increases with
events, preferably but not exclusively grouped in winter, ac-    wind speed. Drifting snow occurred 81 % and 57 % of the
count for a reduced proportion of the overall events (respec-    time on average at D47 and D17, with maximum and min-
tively 22 % and 24 % for D47 and D17) but mainly dictate         imum frequency values respectively observed in winter and
the variability in QDR at the monthly scale, with the largest    summer, in line with the annual course of wind speed. The
winter events capable of transporting up to 9 % of the an-       higher drifting-snow frequency at the more inland location
nual quantity alone. The average monthly frequency result-       D47 is most likely the result of locally higher wind speeds.
ing only from the occurrence of major events in each month       Such high incidences of drifting snow and annual mass trans-
is reported on the graph. As mentioned above, only the pe-       port values reaching or exceeding 2×10⁶ kg m−2 at both sites
riods for which the snow mass flux was measured continu-         suggest that drifting-snow processes are important compo-
ously at two levels have been considered. Note that this re-     nents of the local surface mass balance that would require
quirement is met for distinct periods of time between both       a specific attention in a modelling context. By imposing a
measurement locations which thus must not be compared di-        minimum duration of 4 h and a minimum mass transport of
rectly. At D17 (Fig. 7b, d), major events account for about      15 kg m−2 , 226 and 1566 drifting-snow events have been de-
half of the observed frequency but contribute to a larger part   tected at D47 and D17 over the respective observation pe-
(> 70 %) of the mass transported in drifting snow. Larger        riods. Events at D17 typically last 15 h (median value) and
monthly values of QDR in winter result from an increased oc-     are roughly 2 times shorter than at D47, where longer events
currence of major events combined with stronger snow mass        can be sustained by higher wind speeds. The observations
fluxes (Amory et al., 2017), while drifting snow in summer       also demonstrate that most of the mass transported annually
mainly occurs in the form of residual events of lower mag-       in drifting snow is carried out through a few major events,
nitude. The data collected at D47 (Fig. 2, left panel) indi-     accounting for less than 25 % of all the events and occur-
cate that major events can contribute to an even larger part     ring preferably in winter, indicating that modelling the in-
(> 82 %) of the annual transport and bring a different gen-      fluence of drifting snow on the surface mass balance in this
eral perspective by showing that QDR can be as important         area might primarily rely on an accurate representation of
in summer as during some winter months, depending on the         these major events. The poor spatial and temporal cover-
occurrence of major events. Despite a high and relatively uni-   age of satellite lidar techniques renders it difficult to deter-

The Cryosphere, 14, 1713–1725, 2020                                                 https://doi.org/10.5194/tc-14-1713-2020
C. Amory: Drifting-snow statistics in Adélie Land 1723
mine the mean duration of snow-transport events reported Review statement. This paper was edited by Louise Sandberg
here. However, blowing-snow events covering large areas Sørensen and reviewed by Stephen P. Palm and two anonymous ref-
can be successfully detected and tracked over a period of erees.
days, as demonstrated in Palm et al. (2011). The presence
of clouds impeding satellite retrieval is additionally respon-
sible for the omission of overcast and/or snowfall conditions
during which blowing snow is likely to occur preferentially References
because of the increased availability of loose snow. This can
be particularly restrictive in coastal regions where the oc- Agosta, C., Favier, V., Genthon, C., Gallée, H., Krinner, G.,
currence of blowing snow is often associated with synoptic- Lenaerts, J. T. M., and van den Broeke, M. R.: A 40-year
scale weather systems involving the presence of optically accumulation dataset for Adelie Land, Antarctica and its ap-
thick clouds (Gossart et al., 2017). The observations pre- plication for model validation, Clim. Dynam., 38, 75–86,
sented in this study, while providing spatially limited infor- https://doi.org/10.1007/s00382-011-1103-4, 2012.
mation, enable a continuous detection of snow-transport oc- Agosta, C., Amory, C., Kittel, C., Orsi, A., Favier, V., Gallée, H.,
currences even in the presence of clouds and/or during snow- van den Broeke, M. R., Lenaerts, J. T. M., van Wessem, J. M., van
de Berg, W. J., and Fettweis, X.: Estimation of the Antarctic sur-
fall. Although likely representative of local conditions, they
face mass balance using the regional climate model MAR (1979–
constitute an original dataset dedicated to a poorly docu- 2015) and identification of dominant processes, The Cryosphere,
mented, yet widespread, feature of the Antarctic climate that 13, 281–296, https://doi.org/10.5194/tc-13-281-2019, 2019.
can be used to complement satellite products and evaluate Amory, C. and Kittel, C.: Brief communication: Rare ambient
snow-transport models close to the surface and at high tem- saturation during drifting snow occurrences at a coastal lo-
poral frequency. Such exercises are needed to improve our cation of East Antarctica, The Cryosphere, 13, 3405–3412,
understanding of the links between the occurrence and mag- https://doi.org/10.5194/tc-13-3405-2019, 2019.
nitude of drifting snow and ambient meteorological condi- Amory, C., Trouvilliez, A., Gallée, H., Favier, V., Naaim-Bouvet,
tions and ultimately better quantify the influence of drifting F., Genthon, C., Agosta, C., Piard, L., and Bellot, H.: Compar-
snow on the climate and surface mass balance of the Antarc- ison between observed and simulated aeolian snow mass fluxes
tic ice sheet. in Adélie Land, East Antarctica, The Cryosphere, 9, 1373–1383,
https://doi.org/10.5194/tc-9-1373-2015, 2015.
Amory, C., Naaim-Bouvet, F., Gallée, H., and Vignon, E.:
Brief communication: Two well-marked cases of aerody-
Data availability. The database presented and described in this
namic adjustment of sastrugi, The Cryosphere, 10, 743–750,
article (Amory et al., 2020) is available for download at
https://doi.org/10.5194/tc-10-743-2016, 2016.
https://doi.org/10.5281/zenodo.3630497. The data of the upcoming
Amory, C., Gallée, H., Naaim-Bouvet, F., Favier, V., Vignon, E.,
years will be added to the database on a yearly basis and made avail-
Picard, G., Trouvilliez, A., Piard, L., Genthon, C., and Bel-
able to the community.
lot, H.: Seasonal Variations in Drag Coefficient over a Sastrugi-
Covered Snowfield in Coastal East Antarctica, Bound.-Lay. Me-
teorol., 164, 107–133, https://doi.org/10.1007/s10546-017-0242-
Supplement. The supplement related to this article is available on- 5, 2017.
line at: https://doi.org/10.5194/tc-14-1713-2020-supplement. Amory, C., Genthon, C., and Favier, V.: A drifting snow data set
(2010–2018) from coastal Adelie Land, eastern Antarctica, Zen-
odo, https://doi.org/10.5281/zenodo.3630497, 2020.
Competing interests. The author declares that there is no conflict of Baggaley, D. G. and Hanesiak, J. M.: An Empirical Blow-
interest. ing Snow Forecast Technique for the Canadian Arctic
and the Prairie Provinces, Weather Forecast., 20, 51–62,
https://doi.org/10.1175/WAF-833.1, 2005.
Acknowledgements. This work would not have been possible with- Bintanja, R.: On the glaciological, meteorological, and climatolog-
out the financial and logistical support of the French Polar Institute ical significance of Antarctic blue ice areas, Rev. Geophys., 37,
IPEV (programme CALVA-1013). The author would like to thank 337–359, https://doi.org/10.1029/1999RG900007, 1999.
all the on-site personnel in Dumont d’Urville and Cap Prud’homme Bintanja, R.: Snowdrift suspension and atmospheric tur-
for their precious help in the field, in particular Philippe Dordhain bulence. Part I: Theoretical background and model
for electronic and technical support. Luc Piard, Christophe Gen- description, Bound.-Lay. Meteorol., 95, 343–368,
thon and Vincent Favier are also acknowledged for their investment https://doi.org/10.1023/A:1002676804487, 2000.
in collecting data and maintaining the observation system in Adélie Bintanja, R.: Snowdrift Sublimation in a Katabatic Wind Region of
Land. The author thanks Christoph Kittel, Stephen P. Palm and two the Antarctic Ice Sheet, J. Appl. Meteorol., 40, 1952–1966, 2001.
anonymous reviewers for providing many constructive comments. Budd, W. F.: The Drifting of Nonuniform Snow Particles, in: n Stud-
Charles Amory is a postdoctoral researcher from the Fonds de la ies in Antarctic Meteorology, edited by: Rubin, M. J., 59–70,
Recherche Scientifique de Belgique (F.R.S.-FNRS). https://doi.org/10.1029/AR009p0059, 1966.
Chritin, V., Bolognesi, R., and Gubler, H.: FlowCapt: a new
acoustic sensor to measure snowdrift and wind velocity for
https://doi.org/10.5194/tc-14-1713-2020 The Cryosphere, 14, 1713–1725, 20201724 C. Amory: Drifting-snow statistics in Adélie Land avalanche forecasting, Cold Reg. Sci. Technol., 30, 125–133, Methods and model evaluation, J. Geophys. Res., 117, D05108, https://doi.org/10.1016/S0165-232X(99)00012-9, 1999. https://doi.org/10.1029/2011JD016145, 2012. Cierco, F.-X., Naaim-Bouvet, F., and Bellot, H.: Acoustic sen- Leonard, K. C., Tremblay, L.-B., Thom, J. E., and MacAyeal, D. R.: sors for snowdrift measurements: How should they be used Drifting snow threshold measurements near McMurdo station, for research purposes?, Cold Reg. Sci. Technol., 49, 74–87, Antarctica: A sensor comparison study, Cold Reg. Sci. Technol., https://doi.org/10.1016/j.coldregions.2007.01.002, 2007. 70, 71–80, https://doi.org/10.1016/j.coldregions.2011.08.001, Déry, S. J. and Yau, M. K.: A Bulk Blowing 2012. Snow Model, Bound.-Lay. Meteorol., 93, 237–251, Mahesh, A., Eager, R., Campbell, J. R., and Spinhirne, J. D.: Ob- https://doi.org/10.1023/A:1002065615856, 1999. servations of blowing snow at the South Pole, J. Geophys. Res.- Déry, S. J. and Yau, M. K.: Simulation Of Blow- Atmos., 108, https://doi.org/10.1029/2002JD003327, 2003. ing Snow In The Canadian Arctic Using A Double- Mann, G. W., Anderson, P. S., and Mobbs, S. D.: Profile measure- Moment Model, Bound.-Lay. Meteorol., 99, 297–316, ments of blowing snow at Halley, Antarctica, J. Geophys. Res., https://doi.org/10.1023/A:1018965008049, 2001. 105, 24491–24508, https://doi.org/10.1029/2000JD900247, Déry, S. J. and Yau, M. K.: Large-scale mass balance effects of 2000. blowing snow and surface sublimation: MASS BALANCE EF- Nemoto, M.: Numerical simulation of snow saltation and sus- FECTS OF BLOWING SNOW, J. Geophys. Res.-Atmos., 107, pension in a turbulent boundary layer, J. Geophys. Res., 109, ACL 8–1–ACL 8–17, https://doi.org/10.1029/2001JD001251, D18206, https://doi.org/10.1029/2004JD004657, 2004. 2002. Nishimura, K. and Nemoto, M.: Blowing snow at Mizuho Déry, S. J., Taylor, P. A., and Xiao, J.: The thermodynamic effects station, Antarctica, Philos. T. R. Soc. A, 363, 1647–1662, of sublimating, blowing snow in the atmospheric boundary layer, https://doi.org/10.1098/rsta.2005.1599, 2005. Bound.-Lay. Meteorol., 89, 251–283, 1998. Palm, S. P., Yang, Y., Spinhirne, J. D., and Marshak, A.: Gallée, H.: Simulation of blowing snow over the Satellite remote sensing of blowing snow properties antarctic ice sheet, Ann. Glaciol., 26, 203–206, over Antarctica, J. Geophys. Res.-Atmos., 116, D16123, https://doi.org/10.3189/1998AoG26-1-203-206, 1998. https://doi.org/10.1029/2011JD015828, 2011. Gallée, H. and Pettré, P.: Dynamical Constraints on Kata- Palm, S. P., Kayetha, V., Yang, Y., and Pauly, R.: Blowing batic Wind Cessation in Adélie Land, Antarctica, J. At- snow sublimation and transport over Antarctica from 11 years mos. Sci., 55, 1755–1770, https://doi.org/10.1175/1520- of CALIPSO observations, The Cryosphere, 11, 2555–2569, 0469(1998)0552.0.CO;2, 1998. https://doi.org/10.5194/tc-11-2555-2017, 2017. Gallée, H., Trouvilliez, A., Agosta, C., Genthon, C., Favier, V., and Palm, S. P., Kayetha, V., and Yang, Y.: Toward a Satellite- Naaim-Bouvet, F.: Transport of Snow by the Wind: A Compari- Derived Climatology of Blowing Snow Over Antarc- son Between Observations in Adélie Land, Antarctica, and Sim- tica, J. Geophys. Res.-Atmos., 123, 10301–10313, ulations Made with the Regional Climate Model MAR, Bound.- https://doi.org/10.1029/2018JD028632, 2018. Lay. Meteorol., 146, 133–147, https://doi.org/10.1007/s10546- Radok, U.: Snow drift, J. Glaciol., 19, 123–139, 1977. 012-9764-z, 2013. Scambos, T., Frezzotti, M., Haran, T., Bohlander, J., Lenaerts, J., Goff, J. A. and Gratch, S.: Thermodynamic properties of moist air, Van Den Broeke, M., Jezek, K., Long, D., Urbini, S., Farness, Trans. ASHVE, 51, 125–157, 1945. K., Neumann, T., Albert, M., and Winther, J.-G.: Extent of low- Gossart, A., Souverijns, N., Gorodetskaya, I. V., Lhermitte, S., accumulation “wind glaze” areas on the East Antarctic plateau: Lenaerts, J. T. M., Schween, J. H., Mangold, A., Laffineur, implications for continental ice mass balance, J. Glaciol., 58, Q., and van Lipzig, N. P. M.: Blowing snow detection from 633–647, https://doi.org/10.3189/2012JoG11J232, 2012. ground-based ceilometers: application to East Antarctica, The Scarchilli, C., Frezzotti, M., Grigioni, P., De Silvestri, L., Ag- Cryosphere, 11, 2755–2772, https://doi.org/10.5194/tc-11-2755- noletto, L., and Dolci, S.: Extraordinary blowing snow trans- 2017, 2017. port events in East Antarctica, Clim. Dynam., 34, 1195–1206, König-Langlo, G. and Loose, B.: The Meteorological observa- https://doi.org/10.1007/s00382-009-0601-0, 2010. tory at Neumayer Stations (GvN and NM-II) Antarctica, Polar- Schmidt, R. A.: Threshold wind-speeds and elastic im- forschung, 76, 25–38, 2007. pact in snow transport, J. Glaciol., 26, 453–467, Lenaerts, J., Lhermitte, S., Drews, R., Ligtenberg, S., Berger, https://doi.org/10.3189/S0022143000010972, 1980. S., Helm, V., Smeets, C., Broeke, M., van de Berg, W., Thiery, W., Gorodetskaya, I. V., Bintanja, R., Van Lipzig, N. van Meijgaard, E., Eijkelboom, M., Eisen, O., and Pattyn, P. M., Van den Broeke, M. R., Reijmer, C. H., and Kuipers F.: Meltwater produced by wind–albedo interaction stored in Munneke, P.: Surface and snowdrift sublimation at Princess Elis- an East Antarctic ice shelf, Nat. Clim. Change, 7, 58–62, abeth station, East Antarctica, The Cryosphere, 6, 841–857, https://doi.org/10.1038/nclimate3180, 2017. https://doi.org/10.5194/tc-6-841-2012, 2012. Lenaerts, J. T. M. and van den Broeke, M. R.: Modeling drifting Trouvilliez, A., Naaim-Bouvet, F., Genthon, C., Piard, L., Favier, snow in Antarctica with a regional climate model: 2. Results: V., Bellot, H., Agosta, C., Palerme, C., Amory, C., and Gal- DRIFTING SNOW IN ANTARCTICA, 2, J. Geophys. Res.- lée, H.: A novel experimental study of aeolian snow transport Atmos., 117, D05109, https://doi.org/10.1029/2010JD015419, in Adelie Land (Antarctica), Cold Reg. Sci. Technol., 108, 125– 2012. 138, https://doi.org/10.1016/j.coldregions.2014.09.005, 2014. Lenaerts, J. T. M., van den Broeke, M. R., Déry, S. J., van Meij- Trouvilliez, A., Naaim-Bouvet, F., Bellot, H., Genthon, C., and Gal- gaard, E., van de Berg, W. J., Palm, S. P., and Sanz Rodrigo, J.: lée, H.: Evaluation of the FlowCapt Acoustic Sensor for the Aeo- Regional climate modeling of drifting snow in Antarctica, Part I: The Cryosphere, 14, 1713–1725, 2020 https://doi.org/10.5194/tc-14-1713-2020
You can also read