Dynastic measures of inter-generational mobility with empirical evidence from Indonesia - WIDER Working Paper 2021/70
←
→
Page content transcription
If your browser does not render page correctly, please read the page content below

WIDER Working Paper 2021/70

Dynastic measures of inter-generational
mobility with empirical evidence from
Indonesia

Olivier Bargain,1 Maria C. Lo Bue,2 and Flaviana Palmisano3

April 2021
Abstract: We suggest a simple and flexible criterion to assess inter-generational mobility. It
accommodates different types of outcomes (continuous outcomes such as potential earnings, or
discrete ones such as education groups) and captures dynastic improvements of such outcomes at
different points of the initial distribution. We provide dominance characterizations—for instance,
on the relative progress made by women vs men—that are consistent with social preferences upon
desirable patterns of mobility. We suggest an application for Indonesia. Exploiting IFLS data to
match parents observed in 1993 to their children in 2014, we provide one of the rare inter-
generational mobility analyses based on a long panel in the context of a poor country. Results
indicate that mobility in terms of education and potential earnings were markedly to the advantage
of women. A large part of the population was lifted out of illiteracy, possibly due to large-scale
education and school construction reforms. However, our mobility index also shows that
educational mobility was regressive and has, in turn, reduced the progressivity of the mobility in
terms of potential earnings.
Key words: inter-generational mobility, education, social welfare, Indonesia, gender
JEL classification: J6, J62, O12
Acknowledgements: The authors acknowledge the support of the United Nations University
World Institute for Development Economics Research (UNU-WIDER). The usual disclaimers
apply.

1 Bordeaux University, France, corresponding author: olivier.bargain@u-bordeaux.fr; 2 UNU-WIDER; 3 Sapienza University of

Rome, Italy
This study has been prepared within the UNU-WIDER project Social mobility in the Global South—concepts, measures, and
determinants.
Copyright © UNU-WIDER 2021
UNU-WIDER employs a fair use policy for reasonable reproduction of UNU-WIDER copyrighted content—such as the
reproduction of a table or a figure, and/or text not exceeding 400 words—with due acknowledgement of the original source,
without requiring explicit permission from the copyright holder.
Information and requests: publications@wider.unu.edu
ISSN 1798-7237 ISBN 978-92-9267-008-5
https://doi.org/10.35188/UNU-WIDER/2021/008-5
Typescript prepared by Gary Smith.
United Nations University World Institute for Development Economics Research provides economic analysis and policy advice
with the aim of promoting sustainable and equitable development. The Institute began operations in 1985 in Helsinki, Finland, as
the first research and training centre of the United Nations University. Today it is a unique blend of think tank, research institute,
and UN agency—providing a range of services from policy advice to governments as well as freely available original research.
The Institute is funded through income from an endowment fund with additional contributions to its work programme from
Finland, Sweden, and the United Kingdom as well as earmarked contributions for specific projects from a variety of donors.
Katajanokanlaituri 6 B, 00160 Helsinki, Finland
The views expressed in this paper are those of the author(s), and do not necessarily reflect the views of the Institute or the United
Nations University, nor the programme/project donors.
1      Introduction

Inequality in a society is perhaps more bearable if it is accompanied by high economic mobility between
generations. On this condition, parents can invest in their children’s education to ensure them a better
future than their own. A growing academic literature aims to address this question, suggesting ways to
measure and characterize patterns of inter-generational mobility (Jäntti and Jenkins 2015). Importantly,
long panel datasets are becoming increasingly available, and provide researchers with the possibility
to compare various sorts of achievements across generations. The literature on rich countries relies
on this type of data, often from administrative sources, to produce increasingly refined analyses of
inter-generational mobility (Black and Devereux 2011). The literature remains very scant for low- and
middle-income countries precisely because of the limited availability of long and robust panels.

On the methodological side, inter-generational mobility studies often rely on a single-valued mobil-
ity elasticity stemming from the regression of children’s outcomes on parents’ outcomes. Jäntti and
Jenkins (2015) emphasize the need for more general characterizations of inter-generational mobility.
Recent studies go in this direction and report more comprehensive patterns based on mobility curves
(e.g. Bratberg et al. 2017; Markussen and Røed 2019). However, these measures are specifically de-
signed according to the variable chosen to represent individual economic status and on which mobility
is calculated. There is no encompassing framework that allows measuring inter-generational mobility
in a disaggregated way—that is, comparing mobility at different points of the initial distribution, while
accommodating any type of achievement based on either continuous or discrete outcomes. Finally, there
is a rich literature on dominance results for multidimensional inequality, but few operational methods to
assess inter-generational mobility patterns within a normative framework.

This paper attempts to address both types of concern. On the methodological side, we suggest a simple
criterion to evaluate and compare inter-generational mobility processes. It builds upon information on
mobility experienced at the individual level—that is, for a parents–children dynasty defined according to
the first-generation distribution—and relies on ‘dynastic curves’ to generate partial but robust rankings
of mobility processes. The approach has several advantages. First, it enables us to assess if and how
mobility differs at different points of the distribution, and can be implemented to compare the mobility
of subgroups of the population (e.g. differential mobility patterns for women and men).

Second, the approach is consistent with a general definition of parents’ and children’s achievement. It
can be used interchangeably to evaluate mobility when the achievement variable is either cardinal or
only ordinal, making it general enough to assess the mobility experienced in different domains of well-
being. Our application will focus on achievements based on cardinal outcomes (potential earnings) or
ordinal outcomes (discrete education categories). The approach enables us to incorporate weighting
mechanisms that account not only for the position of a given dynasty in each generation, but also for the
distance that separates it from others. It allows us to go beyond re-ranking measures and to additionally
account for structural changes in the distribution.

Third, our framework is closely linked to the inequality and social welfare literature, which helps to
give a normative justification for its implementation. The normative support allows us to rationalize
the use of mobility curves and to suggest and implement additional measurement tools (e.g. higher-
order dominance results), which are particularly helpful when mobility curves alone do not allow us to
rank mobility patterns. It leads to dominance characterizations—for instance, on the relative progress
made by women versus men—that are consistent with social preferences upon desirable patterns of
mobility.

On the empirical side, our application consists of one of the few inter-generational mobility analyses
for low-/middle-income countries. We focus on education and earning mobility in Indonesia. To our
knowledge, this is one of the rare developing countries for which a long representative panel data exists

                                                   1
and can be used to measure inter-generational mobility. Thus, we exploit the features of the Indonesian
Family Life Survey (IFLS) data, namely the long duration and the exceptionally low attrition of this
household panel. It enables us to match parents in 1993 with their children in 2014 to extract and
compare outcomes of both groups in each period. As argued above, this is relatively rare in the context
of low- and middle-income countries, for which mobility studies are often based on specific households
(e.g. cohabiting parents and children) or on recall questions about parents’ labour market outcomes and
human capital.

The results point to broad improvement in education levels over a generation, lifting a large part of the
population out of illiteracy. These changes are very likely due to the large-scale education policies im-
plemented in Indonesia and extensively documented in the economic literature (see, inter alia, Akresh
et al. 2018; Ashraf et al. 2020; Duflo 2001, 2004; Mazumder et al. 2019). Several reforms have in-
deed provided universal primary education and expanded access to secondary education in the second
generation considered in our analysis.1 Mobility patterns reveal that, independently of the outcome con-
sidered, women have progressed faster than men. Yet, a striking result is that educational mobility was
regressive: progress in education was a lot more pronounced among economically advantaged dynasties.
A decomposition analysis shows that these trends seriously limit the degree of progressivity observed
in terms of potential earnings mobility. These results shed new light on the long-term implications of
prominent education reforms and the way they reshape the distribution of human capital and that of
potential labour market outcomes.

The structure of the paper is as follows. Section 2 suggests a brief survey of the related literature. Section
3 outlines the approach and suggests a normative characterization of patterns of mobility, including
dominance results to make welfare-consistent comparisons across mobility processes. Section 4 presents
the empirical application for Indonesia. Section 5 discusses the results of our inter-generational mobility
analysis for education and earnings. Section 6 concludes.

2          A brief account of the literature

2.1        Methods to measure mobility

Most inter-generational mobility studies are based on a single linear parameter derived from regressions
of children’s outcomes on parents’ outcomes and controls.2 Such inter-generational elasticity coeffi-
cients are useful single-valued summary measures of mobility. They allow controlling for both life
cycle effects and transitory shocks. They are widely used so that estimates can be compared across
studies, across countries, and over time. However, these measures also show strong limitations. They
are not informative on whether the society has faced upward or downward mobility. Thus, comparisons
between different episodes of mobility performed using these indicators need to be interpreted with cau-
tion. Also, these measures are not sensitive to changes in the marginal distribution of income. Finally,
they are not able to capture mobility differentials across different groups in the population or between
different segments of the distribution.3

The recent literature adopts a more disaggregated approach that captures the mobility experienced by
different parts of the distribution and, in doing so, provides a more detailed picture about the specific
features of the mobility process under analysis (see, among others, Bratbert et al. 2017; Markussen and

1 This is the case of the INPRES reform, the One Roof School programme, and several scholarships programmes, as discussed
in Section 5.
2   See, among others, Corak (2013), Idzalika and Lo Bue (2020), Mocetti et al. (2020), and Neidhöfer et al. (2018).
3   This last issue can in principle be overcome by the quantile regression technique, as used by Eide and Showalter (1999).

                                                                2
Røed 2019). However, such measures are precisely designed according to the variable chosen to repre-
sent the achievement of an individual (and mobility thereof), while they could be more general and, for
instance, distinguish between ordinal and cardinal outcomes (Klasen 2008; Klasen and Reimers 2017).4
We suggest a tool that can be used interchangeably to evaluate the mobility of cardinal and ordinal
variables while providing normative support to our framework as well as dominance results.5

2.2      Empirical results and challenges

Inter-generational mobility has been an active field of research (see the surveys by Björklund and Jäntti
2009; Black and Devereux 2011; Jäntti and Jenkins 2015; Solon 1999). In particular in the case of
education mobility, early studies include Bowles (1972), Blake (1985), and Spady (1967). In more
recent studies, Card et al. (2018) investigate education mobility in the USA, while Hertz et al. (2008)
estimate country-level mobility coefficients across 42 countries. Because of the difficulty matching
information on both parents and children, studies on low- and middle-income countries are limited.
Alesina et al. (2020) use census data on cohabiting parents and children to explore education mobility
across 26 African countries. Bossuroy and Cogneau (2013) study occupational mobility in five sub-
Saharan African countries. Fontep and Sen (2020) estimate inter-generational persistence of occupation
and education status in Cameroon, suggesting an interesting gender comparison.6 Importantly, many
of these studies do not rely on panel information and must find ways to retrieve information for both
parents and children using specific selections (e.g. cohabiting families) or recall information.7

2.3      Normative approaches to assess mobility

Our normative approach aims to provide dominance results and welfare foundations to characterize
inter-generational mobility. Hence, it naturally relates to the tools adopted in the context of multidi-
mensional inequality and intra-generational mobility (see the very detailed exposition from Jäntti and
Jenkins 2015). Dominance checks extended to mobility patterns can find their origins in results for
multivariate distributions of income (Atkinson and Bourguignon 1982; Gottschalk and Spolaore 2002;
Markandya 1984). The framework suggested by these authors is commonly interpreted as an aggrega-
tion of intertemporal utilities defined over two periods.8 All relevant mobility is captured by the changes
in individuals’ ranks, making social welfare results sensitive to mobility as reversals rather than mobil-
ity as origin dependence. In other words, the utilitarist social welfare framework does not incorporate
evaluations of mobility in the form of individual income growth, which is the interesting dimension
for inter-generational mobility. An exception is Bourguignon (2011), who shows that the Atkinson and
Bourguignon (1982) results can be applied to comparisons of alternative ‘growth processes’ when the
pair of marginal distributions relating to the first period are identical (this restriction unfortunately lim-
its the applicability of the approach). Related to this, several contributions have defined social welfare

4 Bratberg et al. (2017) specifically consider changes in income rank and income share between parents and children.
Markussen and Røed (2019) look at rank and class correlation between parent and children for each vigintile of the parent
distribution for different income and non-income variables.
5 Note also that from an empirical point of view, the aforementioned contributions focus on rich countries, benefiting from
outstanding data to characterize mobility over several generations in a very representative way. Our work rather focuses on
inter-generational mobility in a poor country for which only survey data are available.
6 Novel data on inter-generational mobility in 18 Latin American countries are provided by Neidhöfer et al. (2018). Several
studies also focus on inter-generational mobility in India (Asher et al. 2018; Azam and Bhatt 2015; Emran and Shilpi 2015)
and China (Emran and Sun 2015; Emran et al. 2020; Golley and Kong 2013).
7 Alesina et al. (2020) match individuals to their parents using data on cohabitants of different generations, which makes the
final sample quite selective (less than 10 per cent of the initial data). Fontep and Sen (2020) retrieve parents’ information
thanks to retrospective questions.
8 Aspects such as aversion to intertemporal fluctuations and to future income risk are specific to this interpretation and absent
from the inter-generational perspective.

                                                               3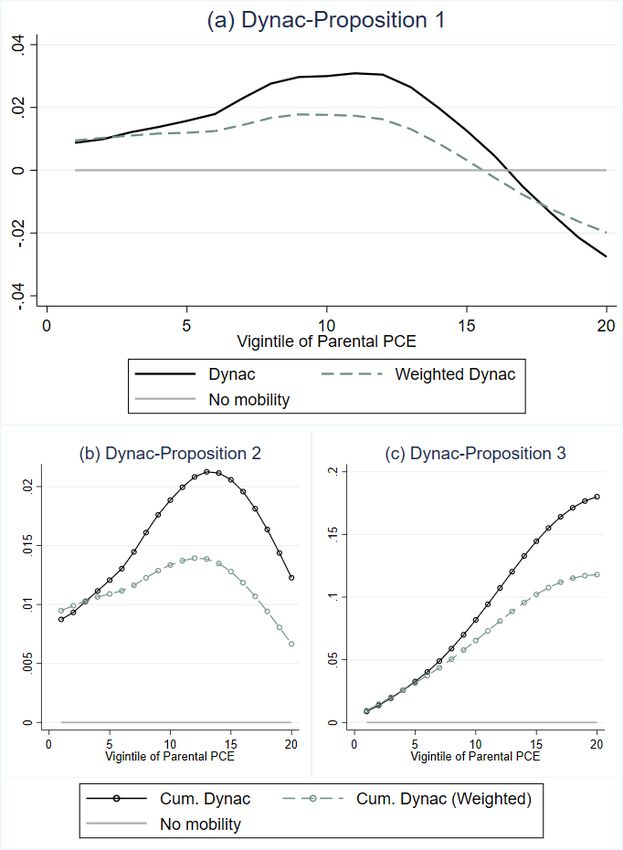
explicitly in terms of income mobility—that is, income changes rather than income levels. This litera-
ture, focusing again mainly on intra-generational mobility interpretations and applications, assumes that
individual-level mobilities are represented by concepts of ‘distance’ between first- and second-period
incomes (Fields et al. 2002; Jenkins and Van Kerm 2016; Van Kerm 2009). It has been extensively used
to characterize where income growth has benefited specific segments of the population, notably the poor,
using non-anonymous growth incidence curves (Berman and Bourguignon, 2021; Bourguignon 2011;
Grimm 2007; Jenkins and Van Kerm 2016; Lo Bue and Palmisano 2020; Palmisano 2018; Van Kerm
2009). Our approach is closely related to this literature but adapted to the inter-generational perspective.
We also go beyond the usual focus on income and suggest a flexible framework to accommodate any
type of achievement (including non-cardinal measures such as discrete educational classes).9

3        Theoretical framework

We first describe the methodology used to measure inter-generational mobility, then discuss welfare-
related characteristics of mobility patterns.

3.1      Measuring inter-generational mobility

Mobility means different things to different people (Fields 2008). We first present the definition of
mobility that we adopt in this paper, then propose a set of tools to evaluate mobility in a way that is
consistent with our definition. We interpret the degree of mobility as the extent to which individual
achievements get better or worse across generations. Using the term ‘individual’ implies that we will
compare the achievements of a person and her parent, i.e. of a specific dynasty, over the duration of
a generation, retaining the principle of non-anonymity. To obtain an evaluation of such changes, we
follow a three-step procedure that will define dynasties, achievements, and the mobility measure itself.
Finally, we shall see that we endorse a relative approach to measuring mobility.

Dynasties

The first step corresponds to the definition of a rule that allows tracking individual achievements across
generations, which we will refer to as a ‘dynasty’. We denote t the generation of the parents and t + 1
that of their children. Dynasties will be defined according to an outcome z used to characterize the first-
generation distribution. We will use per-capita expenditure in our application as it relates to notions of
welfare (or living standards) and provides a very disaggregated picture of the population (at least com-
pared to other variables such as income groups or education classes). Following the standard literature
on mobility, the dynasty will correspond to the relative position of the parents in the initial distribution
of z. Let the z-distribution observed for generation t be represented by its cumulative distribution func-
tion (CDF) Fz (zt ) = P(z̃t ∈ ℜ+ : z̃t ≤ zt ). Each dynasty will simply be characterized by this probability,
denoted pt ∈ [0, 1], which returns the proportion of people observed below zt in generation t.

Achievements

The second step consists in the definition of an individual’s achievement. Note that in a general repre-
sentation, the outcome used to measure achievements may differ from z. For instance, we may study the
mobility in terms of educational achievements or earnings at different points of the distribution of liv-

9 Note that a few contributions adopt transition matrices rather than rank comparisons when individual incomes are classified
into discrete classes (see in particular Dardanoni (1993) for stochastic dominance results for rankings of mobility processes
summarized by transition matrices).

                                                             4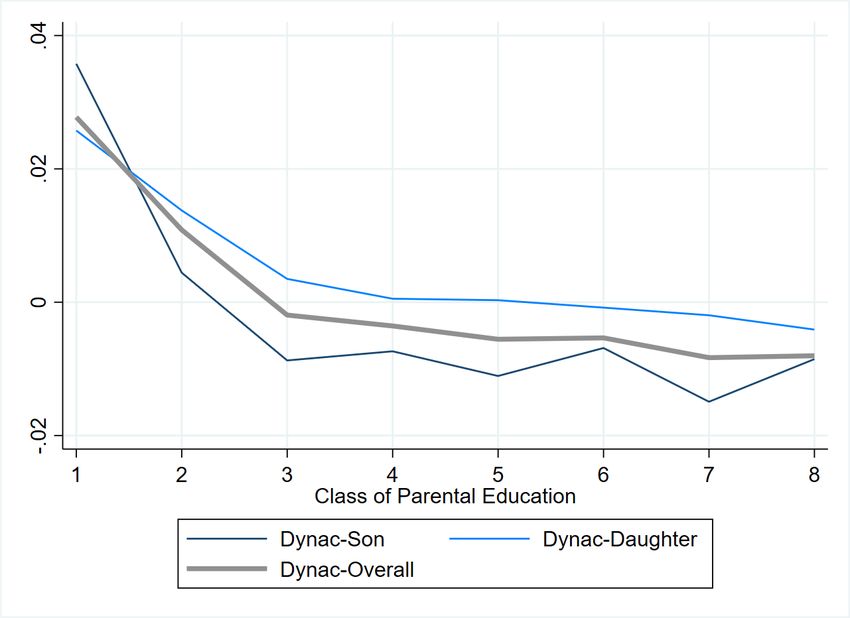
ing standards.10 Different mobility studies adopt different definitions of achievement depending on the
focus of the analysis (D’Agostino and Dardanoni 2009; Fields and Ok 1999). Two main approaches can
be detected. The first interprets an individual’s achievement as something that is measurable in terms of
level of any outcome variable. The second approach interprets an individual’s achievement as something
that is only measurable in relation to the rank of an individual in the outcome distribution of interest. A
measure of mobility based on an index of achievement constructed using the first approach would treat
an ordinal variable (e.g. education categories) as a cardinal one. An important issue that characterizes
ordinal data is that the mean is not order-preserving under scale changes (Allison and Foster 2004),
whereas distributional orderings based on comparisons of CDFs are robust to changes in the scale. This
militates for the use of CDF comparisons when dealing with ordinal data, as recently popularized by
Cowell and Flachaire (2017, 2018) and Jenkins (2019, 2020). This is the line of reasoning that we adopt
here and, hence, we shall follow the second approach.
We first consider a continuous outcome denoted by y, which is typically the case of monetary variables
such as individual earnings. We represent by yt (pt ) : [0, 1] → ℜ+ the earnings of the parents (generation
t) for a dynasty pt . In the same way, we denote by yt+1 (pt ) the earnings of the children (generation
t + 1) of this dynasty pt . We denote f and F the probability density function and CDF of the outcome
considered to characterize achievements. A measure of achievement for the parents and children of any
dynasty pt can respectively be written as follows:
Z yt (pt )
at(1) (pt ) =
f (yt (st ))dyt (st )
0
∀pt ∈ [0, 1], Z yt+1 (pt ) (1)
(1)
at+1
(pt ) = f (yt+1 (st ))dyt+1 (st )
0
In the space of a continuous measure such as earnings, for a dynasty pt , the parents’ achievement is
represented by the fraction of individuals of generation t with earnings equal to or below the level yt (pt )
achieved by the parents of dynasty pt . Their children’s achievement is measured by the fraction of
individuals of generation t + 1 with earnings equal to or below the level yt+1 (pt ) achieved by these
children of dynasty pt .
Let us now consider a discrete outcome, which is typically the case of non-monetary variables that are
ordinal but not cardinal, such as education classes (or health status, occupation types, etc.). Let there be
an ordered set of K > 2 classes, each class k being associated with a latent outcome level—for instance,
the educational attainment. Let kt (pt ) (kt+1 (pt )) be the class occupied by parents (children) of dynasty
pt , nk,t (nk,t+1 ) the number of individuals in this class, and Nt (Nt+1 ) the total number of individuals in
the population of parents (children). Achievement for parents and children can be respectively expressed
as follows:
kt (pt )
(2) ∑i=1 ni,t
at (pt ) =
Nt
∀pt ∈ [0, 1], kt+1 (pt )
(2)
(2) ∑ n i,t+1
at+1 (pt ) = i=1
Nt+1
In the space of discrete variables such as education classes, for a dynasty pt , the parents’ achievement
is represented by the fraction of individuals of generation t who belong to the same or to a lower class
than the class reached by these parents. Their children’s achievement is measured by the fraction of
individuals of generation t + 1 who belong to the same or to a lower class than the class reached by these
10 Indeed, these measures more precisely point to the mobility of specific individuals (e.g. men versus women), which we can
try to explain. In contrast, how the per-capita expenditure of their dynasty’s households evolve over time depends on many
factors that would be extremely hard to disentangle (labour markets, marriage markets, the prevalence of customs such as
matrilocality, our Indonesian context, etc.).
5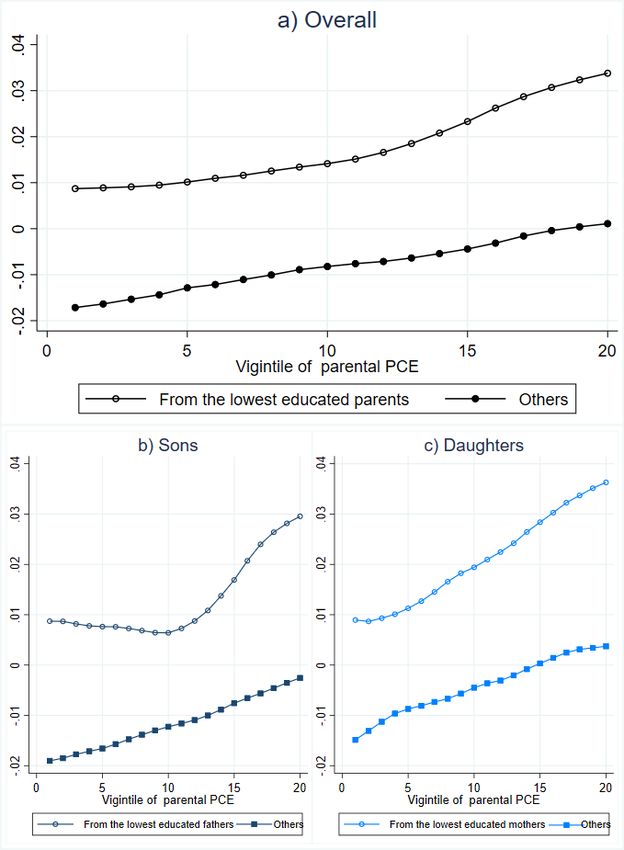
children of dynasty pt . Hence, our concept of achievement is independent of scale and allows us to treat
cardinal and ordinal variables in a uniform way.
Weighted achievements
We also consider complementary definitions obtained by introducing weights in the achievement schemes
previously defined. In the case of continuous outcomes, these are expressed as follows:
Z yt (pt )
(3)
at (pt ) = f (yt (st ))(F(yt (pt )) − F(yt (st )))dy(st )
0
∀pt ∈ [0, 1], Z yt+1 (pt ) (3)
(3)
at+1 (pt ) =
f (yt+1 (st ))(F(yt+1 (pt )) − F(yt+1 (st )))dy(st )
0
In the case of discrete outcomes, these are written as follows:
kt (pt ) kt (pt )
(4) ∑i=1 ni,t ∑s=i+1 ns,t
a (p ) =
t t
N2
t
∀pt ∈ [0, 1], kt+1 (pt ) kt +1(pt )
(4)
(4) ∑i=1 ni,t+1 ∑s=i+1 ns,t
at+1 (pt ) = .
2
Nt+1
For a dynasty pt , individual achievement is represented by the fraction of individuals of generation
t (t + 1) attaining a level or class lower or equal to that of the parents (children) of this dynasty, now
weighted by the distance that separate each of these individuals from the parents (children). The distance
is simply the density of people between each of these individuals and the parents (children) of this
dynasty, measured as a difference in ranks in the continuous approach of equation 3 or by summing
intermediary classes in the discrete approach of equation 4.
Mobility
The last step consists in the construction of a measure of mobility, the Dynastic Curve (DynaC here-
after):
(s) (s)
d a(s) (pt ) = at+1 (pt ) − at (pt ) , ∀ pt ∈ [0, 1] and s = 1, 2, 3, 4 (5)
DynaC allows measuring relative inter-generational mobility at a disaggregated level and in a consis-
tent way for both cardinal and ordinal outcomes. DynaC associates to every dynasty pt the differ-
ence between children’s achievement and their parents’ achievement. Since achievement is distribution-
dependent, d(a) is a relative measure of mobility—that is, inter-generational mobility is evaluated ac-
cording to how better or worse, with respect to their parents, children are positioned in the outcome
distribution of their generation. For instance, if children of a dynasty pt attain the same level of educa-
tion as their parents (or progress only a little) while other dynasties progress a lot more, then children
of dynasty pt dominate fewer people than their parents used to and the mobility score of dynasty pt is
negative. Hence, we shall refer to ‘positive’ (‘negative’) mobility to convey relative upward (relative
downward) mobility—that is, the fact that a dynasty attains a better (worse) rank in the second genera-
tion than in the first.
We can also suggest an interpretation of DynaC in the weighted case, i.e. for s = 3, 4. Assume the child
in a given dynasty obtains the same unweighted achievement in two alternative distributions, i.e. he
dominates the same number of people in both distributions. His weighted achievement needs not be the
same. It will be higher in the distribution where the people the child dominates are further below. This is
an interesting interpretation for mobility because it means that for a positive unweighted DynaC, which
indicates that the dynasty improves its rank between a generation and the next, the progress made by
this dynasty is all the faster as the weighted DynaC is large. Thus, while DynaC can be seen as a simple
6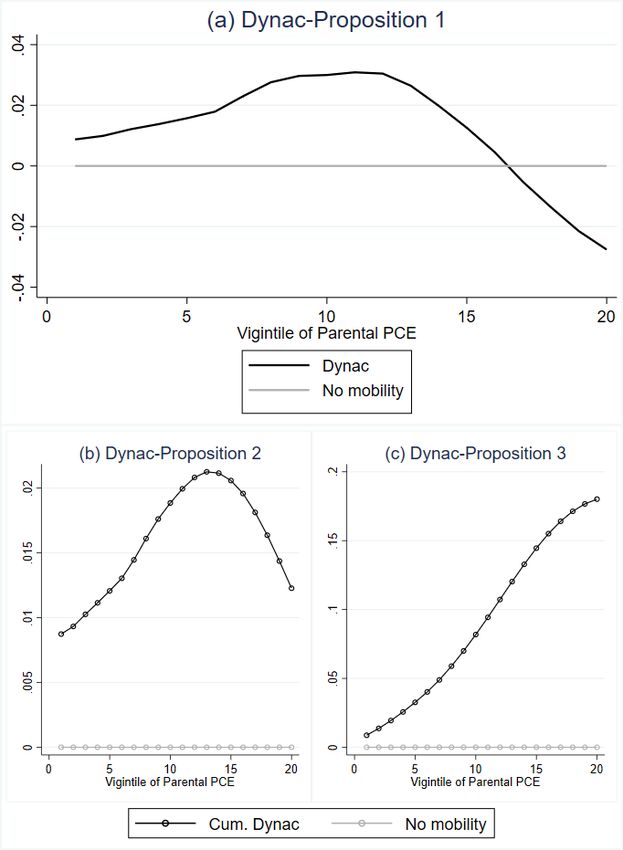
measure of reranking in its unweighted formulation of the continuous case, the weighted approach adds
more information related to the change in the shape of the distribution. In our example above, there is an
increase in inequality below the dynasty in question. Take a somewhat opposite situation, for instance a
dynasty with a zero unweighted DynaC and a negative weighted DynaC. It can be interpreted as a decline
in inequality below this dynasty in the second generation, as the people dominated by this dynasty catch
up and concentrate just below it. In other words, a dynasty can well preserve her rank (zero DynaC) but
experience a negative weighted mobility through this reshaping of the distribution below it.11

3.2      Normative justification

We now provide a normative support to the use of DynaC to evaluate and compare mobility episodes.
Let D(t,t+1) be the general process of mobility between two generations. We are interested in judging
this process from a normative perspective. We assume that a social planner is endowed with cardinal
preferences over mobility processes, denoted by W (D), and write as P the set of social preferences. A
                                                                                                            (t,t+1)
social planner with preferences W ∈ P may assess whether the mobility of a given process, say Dπ                    ,
                                                              (t,t+1)
is socially superior to immobility by evaluating whether W (Dπ        ) is larger than a benchmark process
                                                                              (t,t+1)        (t,t+1)
of immobility for all the dynasties. Considering two mobility processes Dπ            and Dω         , the planner
                                                                       (t,t+1)           (t,t+1)
may deem the first process socially preferred to the second if W (Dπ           ) ≥ W (Dω         ). If the set of
social preferences were known, we could directly conduct these types of assessments. We do not have
this information and, hence, should in principle conduct a sensitivity analysis over a reasonable range of
preferences.

In practice, we start by imposing some restrictions. Namely, we reformulate the dominance in terms
of observables—that is, preferences over mobility processes are specified as functions of the observed
distributions of achievements. To represent such preferences, we adapt the rank-dependent model pro-
posed by Yaari (1987), which offers theoretical and empirical tractability. It assumes that social welfare
can be written as a weighted average of all possible realizations, where the weights are a function of
the rank of the realizations. Transposed to our mobility problem, it becomes the weighted average of
                         (s)

mobility measures d a (pt ) over all dynasties in the population, with a weight w(pt ) ≥ 0 assigned
to the mobility of dynasty pt . Thus, the social evaluation of any inter-generational mobility process,
indexed by π , is written as:
                                                         Z 1
                                       W (D(t,t+1)
                                           π       )=          w(pt )dπ (a(s) (pt ))d pt                                   (6)
                                                          0

The extent of mobility, as measured by the DynaC, is computed for one of the s = 1, 2, 3, 4 definitions
of achievement introduced in the previous section. Let us rewrite dπ (a(s) (pt )) as dπ (pt ) hereafter to
simplify notations. We will restrict to a set of social preferences

                                          P∗ = {W : w(pt ) ≥ 0 ∀pt ∈ [0, 1]}                                               (7)

such that the social marginal effect of each dynasty’s mobility is positive. We suggest four propositions,
the proofs of which are reported in Appendix B.

11The  weights could alternatively be defined as a distance in levels of earnings or education. Our definition captures changes
in the distribution while abstracting from any form of cardinalization, i.e. it uses density of population between discretized
groups such as education classes. Related to this, further work could explore the link with recent studies on non-anonymous
growth incidence curves (NAGIC), which are changes in levels (for instance income levels) of given dynasties while DynaC is
a change in ranks. Berman and Bourguignon (2021) suggest a decomposition of NAGIC into a mobility effect (reranking) and
a shape effect (i.e. a change in the whole cross-sectional distribution). Our weighted DynaC adds to the rank mobility a weight
based on the change in shape (but focused on the part of the distribution below each dynasty).

                                                                7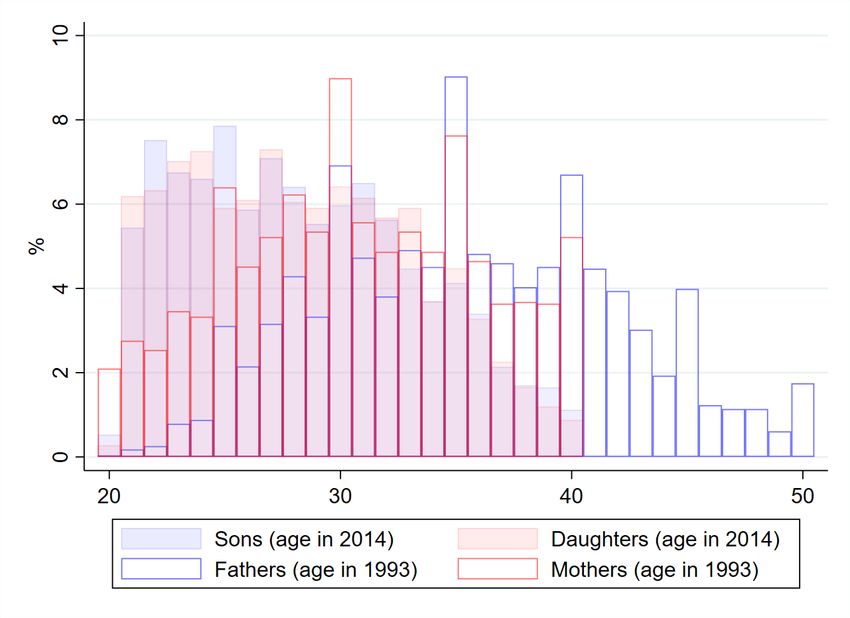
(t,t+1)         (t,t+1)       (t,t+1)
Proposition 1: Given two mobility processes Dπ            and Dω                           , Dπ          is socially preferred to
 (t,t+1)         ∗
Dω       , ∀W ∈ P , if and only if
                                   dπ (pt ) ≥ dω (pt ), ∀pt ∈ [0, 1]                                                          (8)
Proposition 1 characterizes the first-order dominance criterion based on DynaC. It requires checking
the DynaC dominance of one mobility process over the other for every dynasty. The intuition of this
proposition is simple: if there is at least one dynasty experiencing a higher mobility in process Dπ than
in process Dω , while there is no difference for the other dynasties, then the former process is socially
preferred to the latter. When assessing whether a single process yields mobility, the proposition simply
becomes dπ (pt ) ≥ 0, ∀pt ∈ [0, 1]. With our relative mobility concept, it may seem difficult to obtain
dominance (between two processes or between a single process and immobility). Indeed, assume a
population composed only of fathers and sons: some sons will be better positioned in their distribution
than their fathers in theirs—some dynasties will show positive (i.e. relative upward) mobility and others
a negative one. Things are in fact more complicated in real-world data. Some children (e.g. daughters)
may experience higher relative mobility compared to sons, so dominance may appear, at least over some
portion of the dynastic distribution.

Nonetheless, if the DynaCs of two mobility processes are crossing, it is possible to follow the social
choice tradition and suggest higher-order dominance results. These are the minimal refinements on the
set of admissible preferences that may lead to an unambiguous assessment of the mobility processes.
More than this, we use cumulative DynaCs to increasingly put more weight on the mobility of the
poorest dynasties. We start with second-order dominance and general social weights that decline with
the dynasty percentile (Proposition 2), then introduce convexity in the social weighting scheme to give
an emphasis on the poorest of the poor (Proposition 3) and finally suggest a Rawlsian type of social
valuation (Proposition 4).
                                                                 (t,t+1)         (t,t+1)       (t,t+1)
Proposition 2: Given two mobility processes Dπ             and Dω       , Dπ                             is socially preferred to
 (t,t+1)          ∗         δ w(pt )
Dω       , ∀ W ∈ P for which δ pt ≤ 0 for all pt ∈ [0, 1], if and only if
                                  Z pt                   Z pt
                                         dπ (qt )dqt ≥            dω (qt )dqt , ∀pt ∈ [0, 1]                                  (9)
                                   0                         0

If we allow social preferences to be more sensitive to the mobility experienced by the more disadvan-
taged dynasties in the initial period, a comparison between two alternative mobility processes can be
carried out by testing for cumulative DynaC dominance,     as suggested inRthis proposition. When assess-
ing the mobility of a single process, we simply write 0pt d(qt )dqt > 0 ( 0pt d(qt )dqt < 0) for all pt as a
                                                        R

situation of weak relative positive (negative) mobility according to the idea that there should be a priority
for lifting up the poor.
                                                         (t,t+1)           (t,t+1)   (t,t+1)                               (t,t+1)
Proposition 3: Given two mobility processes Dπ and Dω        , Dπ     is socially preferred to Dω
       ∗           δ w(pt )       δ 2 w(pt )
∀ W ∈ P for which δ pt ≤ 0 and δ p2 ≥ 0 for all pt ∈ [0, 1] if and only if
                                              t

                      Z pt Z qt                   Z pt Z qt
                                  dπ (st )dst ≥                  dω (st )dst ∀pt ∈ [0, 1] ∀pt ∈ [0, 1]                      (10)
                       0    0                      0     0

According to this proposition, we can perform a test based on a third-order upward DynaC dominance,
which finds its justification in social preferences that give more weight to the mobility experienced by
the poorest of the poor. Any progressive inheritance tax (or transfer) that improves the mobility of a poor
individual by taking some mobility from a middle-class individual is preferred to a transfer of mobility

                                                                 8
from a rich to a middle-class individual.12 We conclude with a comparison criterion of a Rawlsian
flavour and that might be useful in the presence of coarse data.
(t,t+1) (t,t+1) (t,t+1) (t,t+1)
Proposition 4: Given two mobility processes Dπ and Dω , Dπ is socially preferred to Dω
∗
∀ W ∈ P for which w(pt ) = w(qt ) > 0 ∀pt , qt ∈ [0, p̄] and w(pt ) = 0 ∀pt ∈ [ p̄, 1] if and only if
Z p̄t Z p̄t
dπ (qt )dqt ≥ dω (qt )dqt (11)
0 0
Selecting a threshold equal to p̄ implies that we focus only on dynasties corresponding to households
of the lower p̄ percent of the first-generation distribution. Alternative thresholds can be selected to
focus on different groups of dynasties.13 The test corresponding to this proposition can be interpreted
as a ‘priority’ criterion—that is, it reflects the preferences of a social planner who endorses a ‘mobility
priority for the worst off’. This echoes back to the maximin criterion à la Rawls: mobility is valuable if
and only if poor dynasties experience an improvement, independently of how the rest of the population
performs.
4 Empirical approach
4.1 Data
Overview
Our empirical analysis relies on the IFLS, which is an ongoing longitudinal survey of individuals, house-
holds, and communities. Based on an initial sample representing 83 per cent of the Indonesian popula-
tion, the IFLS is conducted in 13 Indonesian provinces extending across the islands of Sumatra, Java,
Kalimantan, Sulawesi, Bali, and West Nusa Tenggara. It has interesting features that make it particularly
suited to our analysis. First, it covers a long time period, ranging from 1993 to 2014, which is appropri-
ate for inter-generational mobility measurement. Second, it benefits from an exceptionally low attrition
rate. Indeed, extensive efforts were provided to track respondents when collecting data in each of the
five waves (1993, 1997, 2000, 2007, and 2014). It has allowed reaching a recontact rate of 92 per cent
in the last wave (Strauss and Witoelar 2019; Strauss et al. 2016), which guarantees both cross-sectional
and longitudinal representativeness of our sample for inter-generational mobility calculations. Third, it
includes individual and household information on a large set of socioeconomic characteristics, such as
education, income, and consumption expenditure, in addition to standard demographic variables.
For these reasons, the IFLS has been applied to many development studies, including those focusing
on intra-generational mobility (see Grimm 2007; Lo Bue and Palmisano 2020). It has also been used to
investigate the heterogeneous effect of the INPRES school construction programme on girls’ educational
achievements between ethnic groups practising bride price and the others (Ashraf et al. 2020) or the
spillover effects of the programme on the second generation’s human capital outcomes (Akresh et al.
2018; Mazummder et al. 2019). We suggest here to exploit the length of the panel for inter-generational
mobility measurement. As previously discussed, the ability to link information on parents and their
children when both groups are about the same age is relatively rare in the context of low- and middle-
income countries. Mobility across the two generations of interest in the IFLS will necessarily reflect the
12 Alternatively, it is possible to obtain a ranking criterion that is based on the idea of preserving the mobility of less-advantaged
dynasties while, at the same time, focusing on the dynamics of the richest dynasties. This alternative proposition (30 ) is
discussed in Appendix C.
13 Ifthe threshold is equal to 1, the proposition reduces to the comparison of mean mobilities. When p̄ = 0.5, it is reminiscent
of a recent approach introduced by Asher et al. (2018) to estimate inter-generational educational mobility with coarse data,
which is typically the case of developing countries.
9impact of the aforementioned reforms on the second generation’s potential earnings, but also the other
changes affecting the earnings potential of men and women over time.
Generation matching and selection
We use the first and last waves of the IFLS. That is, we identify the generation of fathers and mothers in
1993 using IFLS 1 (cf. Frankenberg and Karoly 1995) and match them with their offspring observed in
2014 in IFLS 5 (cf. Strauss et al. 2016). We have two broad objectives. First, we aim at observing both
generations at similar age ranges, or at least not too radically different. It is not an issue for education
outcomes since parents and children are old enough for their education levels to be a fixed characteristic,
but it is an issue for meaningful profiles of earnings mobility. We will also apply an age correction when
predicting earnings hereafter. Second, to simplify interpretations, we prefer to define cohorts such that
the first generation has left school after the implementation of INPRES and subsequent reforms, while
the second generation is the one most affected by these large-scale policies.
As a result, we select dynasties where individuals are observed in an age range of 20–40 (born 1952–
74 for parents and 1974–94 for children), with the exception of fathers, who are selected in a 20–50
age range. The asymmetry for fathers is justified as follows: males of the first generation tend to be
older—and have children later—than their spouses, and restricting to 20–40 would reduce the sample
size and the representativeness of the matched, dynastic sample.14 This leaves us with a sample of 2,164
daughters and 2,060 sons matched with 2,284 mothers and 2,284 fathers.
4.2 Achievements and DynaC implementation
The concept z used to define dynasties is the per-capita expenditure in households observed in 1993. It
is convenient to use this welfare measure as a backdrop against which we can assess individual mobility
in terms of earnings or education.15 Our analysis focuses on two types of achievements: one based
on discrete outcomes k corresponding to education classes, the other based on continuous outcomes y
corresponding to potential earnings.
Regarding the discrete outcome, based on the information reported in the IFLS data on the highest
education level attended and on the grade completed for that level, we construct eight education classes,
from ‘no education’ to ‘university degree’. These classes are used to implement baseline achievement
measures of equation 2.
The continuous outcome is the potential earnings of each individual, used to implement achievements
in equation 1. Given the number of adults without a paid job, potential earnings are more relevant than
actual earnings, which would give a very truncated picture of inter-generational mobility. Moreover,
predicted earnings help to assess how education mobility translates in monetary terms. Indeed, since
education is one of the key determinants of earnings, predicting earnings would reflect a combination of
relative education levels within each generation and different returns to education across generations.16
To generate this outcome, we simply use observed earnings and run separate earnings estimations for
14 Furthersensitivity checks could consist in applying the 20–40 age bracket to everyone or the 20–50 bracket to both mothers
and fathers, but we do not expect radically different conclusions.
15 As justified before, we refrain from using it as an outcome. Additional reasons are empirical. First, there is a high potential
for measurement error (see Grimm 2007). Second, for all children still living with their parents in 2014, there will be a strong
persistence in this variable, which is not what we want to characterize. We rather focus on men’s and women’s individual
mobility in terms of individual achievement (education, earnings potentials).
16 We will suggest counterfactual analyses along these lines to assess how educational mobility, compounded with changes in
returns to education, may have contributed to earnings mobility at different points of the initial distribution.
10mothers, fathers, sons, and daughters.17 Using the four sets of estimations, we predict potential earnings
for mothers, fathers, sons, and daughters, respectively, given their own characteristics at the time of
observation, except age. Indeed, to compare the potential earnings of sons and fathers (daughters and
mothers) at about the same age, we predict 2014 earnings for sons (daughters) using the age that their
father (mother) had in 1993.18
Descriptive statistics are reported in Table A2. Daughters and sons are observed aged 29 on average,
which is lower but close to their mother’s age (32) and father’s age (37). Figure A1 shows a broad
overlap between generations. However, there are mechanical differences imposed by the matching of
generations at specific points in time (1993 and 2014) and demographic particularities (e.g. the fact that
men are older than their spouses). This justifies the strategy described above to neutralize the role of
age when predicting earnings. Further results in Table A2 focus on achievements. It turns out that, on
average, our sample of individuals in the offspring generation seems to fare relatively better than their
parents. Their economic conditions have improved, as the value of real per-capita expenditure has more
than doubled. Second-generation average education level is about 5.9, corresponding to 10–11 years
of schooling, which is almost twice as large as their parents’ educational achievement (i.e. 3–3.6 or
roughly six years of schooling). Their potential earnings are also much improved: in real terms (i.e.
when accounting for changes in living costs over 20 years) they are 5–6 times as high as their parents’
potential earnings.
4.3 Education reforms in Indonesia and absolute mobility
Education mobility in Indonesia is particularly interesting to examine, given the large-scale education
reforms implemented by this country over the past decades. We start with a brief overview of the
reforms potentially affecting the offspring in our analysis, and move to the description of mobility pat-
terns.
Education reforms
A series of programmes have been implemented since the 1970s and have certainly contributed to boost
enrolment rates and increase access to education. In 1973, the Indonesian government launched the
‘Sekolah Dasar INPRES’ programme, a large-scale school construction programme whose effectiveness
has been well documented in many studies (see, inter alia, Akresh et al. 2018; Ashraf et al. 2020; Duflo
2001, 2004; Mazumder et al. 2019). Between 1973–74 and 1978–79, the number of primary schools
in the country more than doubled, leading to a remarkable increase in enrolment rates among children
aged 7–12, from 69 per cent in 1973 to 83 per cent by 1978. In our selection, the parents will have been
hardly affected by this reform when they were themselves children, while all their children would be in
the right age group to fully benefit from the reforms.19
Education enrolment expansion continued through the 1990s and the early 2000s, the years of the Asian
economic ‘miracle’ marked by remarkable progress in poverty reduction and economic growth (Bolt
et al. 2018; Timmer 2018). By the early 2000s, Indonesia achieved a nearly universal net primary
17 These regressions account for a first-step selection equation using a relatively standard instrument, namely the total resource
of other family members. Estimation results are reported in Appendix Table A1: they essentially show the (monotonic) effect
of education classes in the main equation (earning potentials), as well as the significant role of the instrument (and its expected
negative sign) in the participation equation.
18 Without this adjustment, earnings mobility would partly reflect the fact that parents are observed at older ages and hence at
higher earnings levels (a differential that might vary along the cross-sectional distribution).
19 Indeed, those who could benefit from the early phase of INPRES were those aged five or younger in 1974, which represents
less than 3 per cent (12 per cent) of the fathers (mothers) in our sample. In contrast, all the children in our selection where born
after 1974 and hence were primary-school-aged at the time of the second phase of INPRES school construction.
11enrolment rate, while junior high school enrolment rates had reached about 60 per cent, compared to 17
per cent in 1975 (Granado et al. 2007).20 Efforts to increase access to education, especially among the
most disadvantaged children, have also been made since the late 1990s through the launch of a series of
scholarship programmes.21
Changes in education levels and absolute mobility
Figure 1 shows the distribution of education levels for both generations in our selected data. The first
observation is that the new generation has basically escaped from illiteracy, possibly thanks to the pre-
viously discussed reforms. While 40 per cent of the parents in our dynastic sample had no education or
only incomplete primary schooling, their offspring are almost all in higher education classes. Almost
none of them have no education, and less than 5 per cent have uncompleted primary schooling. The
completion of junior high school has almost doubled, while a majority of children now have a (senior)
high school degree or go to university.
We check who has benefited from these tremendous improvements in education. Using the matched
generations, we represent the share of (absolute) education mobility in Figure 2. Ranking dynasties
according to parental education levels, we report the proportion of upward mobility, downward mobility,
or immobility (left axis). The graph essentially points to the upward mobility for all children of parents
who had less than a high school degree, and a relative immobility for the top dynasties (with 80 per
cent of the university-graduated parents sending their children to university as well). We also depict the
average difference in education levels between the two generations (right axis). As expected, it shows
larger improvement among dynasties of low-educated parents and a declining profile.
Figure 1: Distribution of educational levels
Source: authors’ elaboration based on IFLS 1 and IFLS 5.
20 In
2005, the government launched the ‘One Roof School Program’ aimed to facilitate transitions from primary to secondary
school by building junior high schools on the same sites as primary schools, especially in remote areas (ILO 2011).
21 This includes the 1998 ’School Grants Program’, which was effective in preventing schools drop-outs especially among
primary-school-aged children from poor rural families (Sparrow 2004). Another programme was implemented in 2001–005,
the ’Compensation for Fuel Subsidy Decreased Program’, to help children from poor families through scholarships (Bantuan
Khusus Murid, BKM), which covered both primary and secondary education.
12Figure 2: Absolute educational mobility
Note: educational level correspondence: (1) no education, (2) incomplete primary school, (3) completed primary school, (4)
incomplete junior high school, (5) completed junior high school, (6) incomplete senior high school, (7) completed senior high
school, (8) university.
Source: authors’ elaboration based on IFLS 1 and IFLS 5.
5 Empirical results
We now turn to our main results based on DynaC measures. As per equation 5, the DynaC curves
simply show for all dynasties the difference between children’s and parents’ relative achievements, their
achievement being the proportion of people they dominate in their own distribution. We present results
in two steps. First, we describe DynaC and cumulated DynaC curves across dynasties to assess whether
the overall mobility process over the 1993–2014 period has been progressive or not, with potential
implications for the role played by education reforms. We do so for each type of outcome, namely
education classes (discrete) and potential earnings (continuous). We disentangle the contribution of
education mobility on potential earnings mobility. Second, we present DynaC dominance results when
comparing the relative mobility of men and women. Our baseline relies on like-for-like comparisons
(daughters to mothers and fathers to sons), but we also check the sensitivity of dominance results to
alternative definitions, including a reference point that is common to both men and women.
5.1 Relative mobility across dynasties
Relative education mobility by initial education class
We first represent education DynaCs across parents’ education classes. Figure 3 shows a declining
pattern with ‘positive’ mobility only for dynasties of parents in the lowest education categories (classes
1 and 2 for no education and incomplete primary school). This seems consistent with previous results
indicating how education reforms have greatly reduced illiteracy in Indonesia. More than this, it tells us
that dynasties where parents were at the lowest levels have progressed more than others on the education
ladder. Mechanically, dynasties with parents at higher level have smaller margins of progress (recall that
13parents with junior high school or above were dominating more than 70 per cent of their distribution in
1993).22
Figure 3: Relative education mobility (DynaC by parent education levels)
Note: educational level correspondence: (1) no education, (2) incomplete primary school, (3) completed primary school, (4)
incomplete junior high school, (5) completed junior high school, (6) incomplete senior high school, (7) completed senior high
school, (8) university.
Source: authors’ elaboration based on IFLS 1 and IFLS 5.
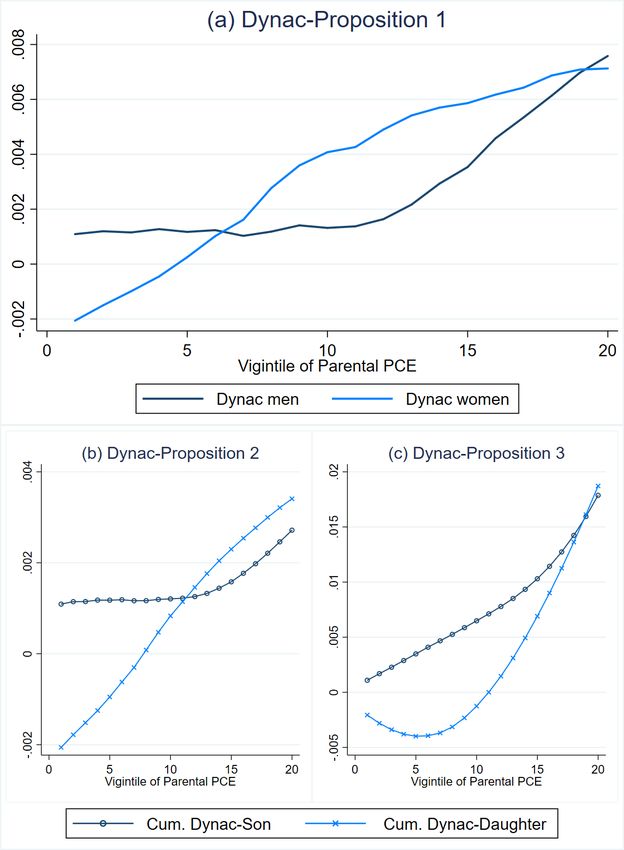
Relative education mobility
While the DynaC mobility by parental education class is interesting, most of the non-anonymity is lost
with such a large grouping. Moreover, faster education mobility among the lowest levels is expected,
especially given the fact that a larger majority of first-generations were in this situation (67 per cent had,
at best, completed primary schooling in 1993). Hence, we turn to our main results, depicting DynaC
curves over the range of dynasties pt based on per-capita expenditure in first-generation households. For
the sake of exposition, we shows vigintile averages of dynastic mobility measures.23 We are interested
to know where mobility was the highest and, in particular, whether large-scale educational policies have
targeted the poorest. Figure 4(a) shows a very different pattern compared to Figure 3. When considering
mobility across the living standard distribution, we observe a regressive pattern. It is first due to the fact
that, as recalled above, most of the first generation was uneducated: the low-educated parents were to be
found in all quantiles of per-capita expenditure and not just among the poor. Then, dynasties progressing
the most were those with low-education parents but also higher living standards. This is illustrated in
Figure A4(a) in Appendix A, which depicts DynaC curves for dynasties of low-educated parents (classes
1 and 2) versus others (parents with education classes 3–8). The former show positive mobility scores
while the latter group does not progress as much (hence negative mobility measures). These results tend
to indicate that INPRES and subsequent reforms have improved education levels more substantially
among the wealthier.
In the next section we address dominance between two groups (men and women) using Propositions
1–4. At this stage, we can examine dominance with respect to the immobility benchmark and establish
22 Note that the distance travelled could be evaluated differently when the starting point is ‘no education’ compared to when it
is at a higher level. We keep this type of normative refinement for further research.
23 They combine possibly very different situations across the different persons composing each vigintile, in particular quite
different patterns between men and women, as we shall see.
14whether the overall mobility profile for education was socially superior. In Figure 4(a) there is no
dominance of mobility over immobility since we observe a crossing of the zero line around the third
vigintile. Among the poorest dynasties, the mobility measure is negative, reflecting a slower pace of
educational improvement compared to other dynasties. We will see that these negative values are due
to men, whose educational position tends to decline relative to that of their fathers. Moving to second-
order dominance, we see in Figure 4(b) that immobility prevails over a larger segment (i.e. up to the fifth
vigintile) when priority is put on the poorest and further still in Figure 4(c) (up to the seventh vigintile)
where priority goes to the poorest of the poor.
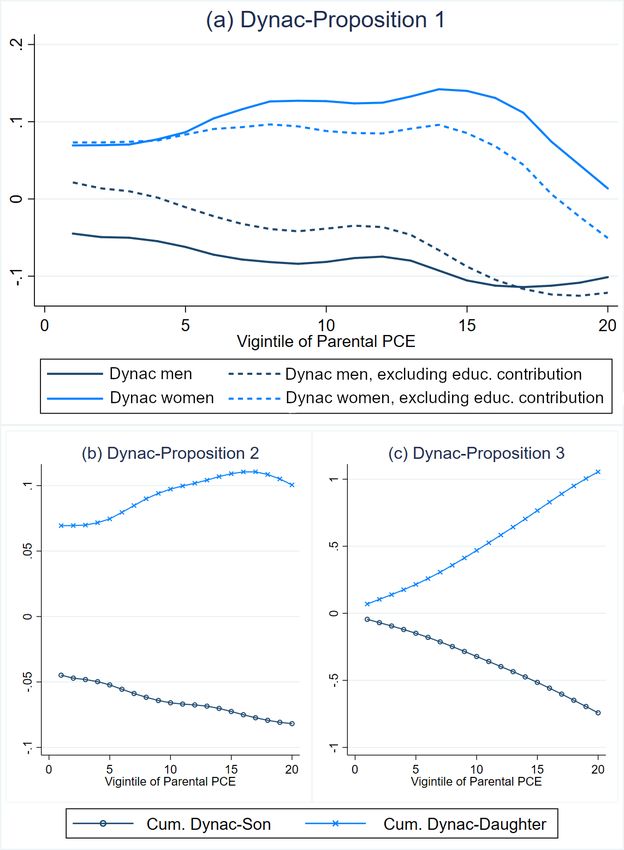
Relative mobility of potential earnings: the role of education
In Figure 5 we report DynaC results for the continuous outcome (i.e. potential earnings). Figure 5(a)
depicts the DynaC curve (solid line) and a counterfactual (dashed line) obtained when setting children’s
education level to their parents’ level. The main DynaC curve shows a regressive pattern (up to the 12th
vigintile) that turns progressive thereafter. Negative values at the top indicate that children from wealth-
ier backgrounds progressed relatively less quickly in terms of earnings-generating capacity than the rest
of the population. Importantly, while the overall pattern is fairly flat, the dashed curve shows that pro-
gressivity would be more pronounced if education levels had not changed between generations. In other
words, the regressive nature of education reforms translates here into a reduced extent of progressivity
in terms of potential earnings mobility.
Relative mobility of potential earnings: dominance and weighted DynaC
DynaCs based on continuous variables are equivalent to a change in rank between generations, as used
in the recent literature focusing on re-ranking measures (cf. Section 2). Our framework goes a few
steps further by adding dominance results and the possibility to weight achievement measures. First, we
question the dominance of the mobility process over immobility. Figure 5(a) is inconclusive because the
DynaC curve crosses the zero line (around the 17th vigintile). Yet, if we put the emphasis on the poor,
positive mobility scores may be what prevails. This is indeed what we see in Figure 5(b) with second-
order dominance over immobility. There is a fortiori dominance of the third order in Figure 5(c). Then,
weighted DynaC curves based on the achievement formulas of equation 3 allow us to account for struc-
tural changes in the distribution between parents and their children. Dynastic mobility is all the larger as
the rank improvement across generation is larger. Weighted and unweighted DynaCs are presented to-
gether in appendix Figure A5, but only to inspect patterns (mobility levels are not comparable). Adding
weights leads in this case to flatter trends, with in particular a lower degree of regressivity in the first
half of the living standard distribution. As discussed in the theory section, if a dynasty is characterized
by a zero weighted DynaC but a negative unweighted Dynac, there is a reduction in inequality below
this dynasty, i.e. the distance between this dynasty and its followers shrinks as the latter are catching up.
This is the situation we observe for instance at the 17th vigintile, i.e. when the DynaC curve crosses the
zero line.
15You can also read