Topographical curvature is sufficient to control epithelium elongation - Nature
←
→
Page content transcription
If your browser does not render page correctly, please read the page content below
www.nature.com/scientificreports
OPEN Topographical curvature
is sufficient to control epithelium
elongation
Pablo Rougerie1*, Laurent Pieuchot2*, Rafaela Silva dos Santos1,3, Julie Marteau4,
Maxence Bigerelle4, Pierre‑François Chauvy5, Marcos Farina1 & Karine Anselme2
How biophysical cues can control tissue morphogenesis is a central question in biology and for the
development of efficient tissue engineering strategies. Recent data suggest that specific topographies
such as grooves and ridges can trigger anisotropic tissue growth. However, the specific contribution
of biologically relevant topographical features such as cell-scale curvature is still unclear. Here we
engineer a series of grooves and ridges model topographies exhibiting specific curvature at the ridge/
groove junctions and monitored the growth of epithelial colonies on these surfaces. We observe a
striking proportionality between the maximum convex curvature of the ridges and the elongation of
the epithelium. This is accompanied by the anisotropic distribution of F-actin and nuclei with partial
exclusion of both in convex regions as well as the curvature-dependent reorientation of pluricellular
protrusions and mitotic spindles. This demonstrates that curvature itself is sufficient to trigger and
modulate the oriented growth of epithelia through the formation of convex “topographical barriers”
and establishes curvature as a powerful tuning parameter for tissue engineering and biomimetic
biomaterial design.
Understanding the mechanisms controlling and guiding the growth of tissues is of fundamental importance. In
particular, the ability of epithelia to break isotropy and grow preferentially along a specific direction is a key part
of embryo development and wound healing. Unsurprisingly, it is also an important part of tissue engineering
efforts aiming at fostering tissue repair or growing in vitro organoids and replacement tissues.
Over the years, the microenvironment geometry has emerged as a relevant parameter of tissue
morphogenesis1. Indeed, cells tend to align and migrate along the main orientation of anisotropic surfaces, a
process termed “contact guidance”2,3. Parallel grooves and ridges are among the most common model surfaces
for contact guidance. Over such surfaces, single cells elongate and align with the longitudinal axis of the grooves
and ridges while epithelial monolayers exhibit an oriented collective m igration4–8. These topographies are char-
acterized by the presence of angular edges and corners at the junction between a ridge and the adjacent grooves.
These so-called “topographical discontinuities” has long been considered instrumental for contact guidance and
the resulting anisotropic elongation of cells and e pithelia2,9. For instance, single cells tend to extend protrusions
along such discontinuities and accumulate F-actin or Vinculin t here10,11. However, the in vivo microenvironment
associated with epithelia is edge-less, displaying a complex architecture with fibrillary or curved shapes both at
nanometric, cellular, and supracellular scales. The contact-guided epithelial growth could thus be an artefact
from in vitro surfaces with topographical discontinuities. It is therefore crucial to determine whether and how
the notion of contact-guided epithelium morphogenesis can be extended to edge-less, curved topographies.
Substrate curvature affects the local trajectory and the overall velocity of c ells12–14. Convexity seems to be
associated with higher myosin II-based contractility and lower F-actin contacts, as opposed to concavity15,16.
Negative curvatures (concavity) also seem to induce detachment or tearing of fully-grown, static and contractile
epithelial monolayers17. However, the available studies so far focused on single cells migrating over isotropically
curved surfaces12,15, or on full-grown epithelial monolayers confined around cylindrical wires or inside hollow
1
Laboratório de Biomineralização, Centro de Ciênça da Saúde, Instituto De Ciências Biomédicas, Federal
University of Rio de Janeiro, Rio de Janeiro 21941‑902, Brazil. 2Université de Haute-Alsace, CNRS, IS2MUMR
7361, 68100 Mulhouse, France. 3Instituto de Biofisica Carlos Chagas Filho, Centro de Ciências da Saúde, Federal
University of Rio de Janeiro, Rio de Janeiro 21941‑902, Brazil. 4Université de Valenciennes et du Hainaut Cambrésis,
LAMIHUMR-CNRS 8201, Le Mont Houy, 59313 Valenciennes, France. 5France.Micropat SA, Côtes‑de‑Montbenon
30, 1003 Lausanne, Switzerland. *email: pablo.rougerie@ens‑lyon.org; laurent.pieuchot@uha.fr
Scientific Reports | (2020) 10:14784 | https://doi.org/10.1038/s41598-020-70907-0 1
Vol.:(0123456789)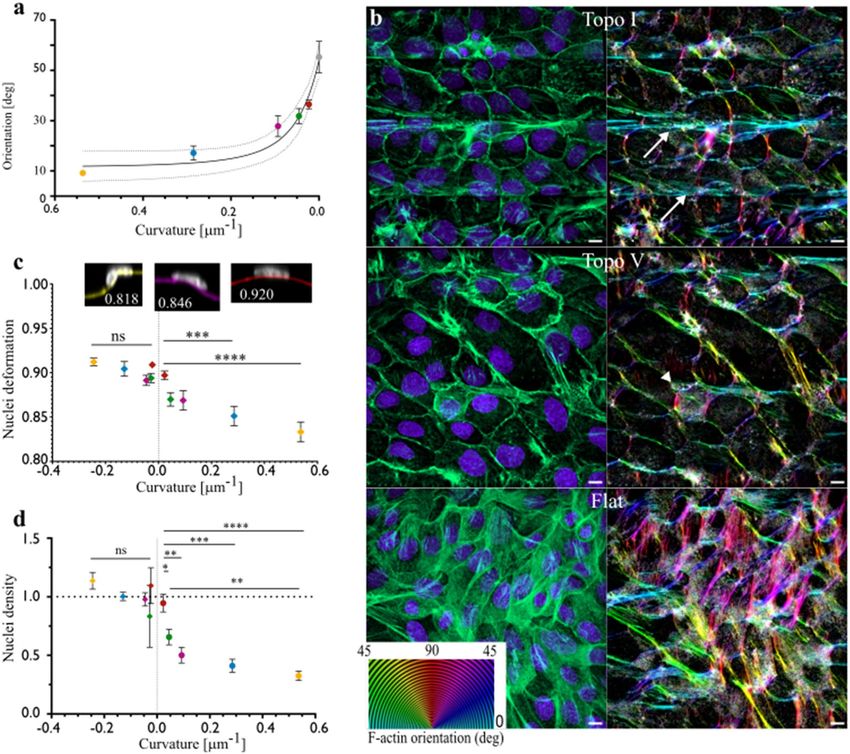
www.nature.com/scientificreports/
tubes13,14. Importantly, cylindrical surfaces necessarily cause a lateral confinement that restrains the direction
of growth of the epithelium along the cylinder axis. In addition, lateral confinement induces changes in the col-
lective migration velocity, independently of any curvature e ffect13. A recent article interestingly looked at the
growth of non-confined endothelia over anisotropic sinusoidal surfaces18. The results suggest that endothelia
grow anisotropically over wavy surfaces. However, it remains unclear how the local curvature affects the growth
dynamics of the tissue or the intracellular organization of majorcell components such as the cytoskeleton and
nuclei. In addition, this studies compared sinusoidal surfaces with different wavelength, which modifies two key
topographical parameters at the same time: the maximal curvature and the period of the convex and concave
regions. Given that the period also affects the efficiency of topographical guidance19,20, it is therefore crucial to
uncouple the curvature and the period in order to be able to draw definitive conclusions on the specific role of
curvature itself during tissue growth and morphogenesis. To do so, we engineered anisotropic surfaces made
of cell-scale grooves and ridges of different curvature at the ridge/grooves junctions but of similar depth and
periods. We then set out to applied these new topographies to assess how these landscape would influence the
morphogenesis of growing epithelia. We confirmed that topographical discontinuities are dispensable for contact
guidance and we reported that the degree of epithelium elongation is linearly proportional to the level of convex-
ity to which it is exposed. We showed that convex regions act as topographical barriers that control the organi-
zation of the actin cytoskeleton and nuclei and impact key processes such as collective migration and oriented
cell division. Altogether, this work identifies curvature as a powerful physical cue that can control epithelium
morphogenesis, providing new leads for the development of tissue engineering strategies.
Results
Cell‑scale curvature linearly controls the elongation of growing epithelia. We engineered five
grooves and ridges topographies with a progressive smoothing of the junction between the ridge and the adja-
cent groove (Topo I–V) (Fig. 1A). Nanoscale grooves and ridges are associated with phenomena of bridging over
the grooves owing to the inherent rigidity of cells, hence restricting adhesion formation to the upper r egions4,6,21.
To avoid such an effect that might interfere with the reading of surface shape per se, we focused on cell-scale
geometries. Our surfaces have a period of 100 μm and a depth of 10 μm. With this dimensions, cells can fit
entirely over the ridges or in the grooves without restriction of access (Fig. 1A). In addition, we had previously
shown that peak and valley topographies with 100 μm period induce a strongest cell response in a human mes-
enchymal stem cells model22. Importantly, the period and depth remain unchanged, so the spatial density of the
topographical pattern of interest (curved regions) is similar between topographies and the curvature is the main
topographical variable. The maximal convex curvature shows a 20-fold drop from the quasi-angular crenellation
of Topo I to the perfectly sinusoidal Topo V while the maximal concave curvature exhibits a more moderate
tenfold decrease (Supplementary Fig. S1). Of note, Topo I and Topo II are strongly similar in overall shape and
ridge width, however the curvature is noticeably different with a two-fold difference of convex curvature radius
(Supplementary Fig. S1). The points of highest convex curvature are localized at the side of the ridge on Topo I,
II, III, IV, as shown in the color-coded transversal section of the surfaces in Supplementary Fig. S1D. On topo V,
the convex regions merge together into a large apical area of low convex curvature).
We monitored the growth of millimetric circular MDCK colonies over fibronectin-coated polydimethylsi-
loxane (PDMS) surfaces structured with theses topographies. The canine kidney epithelial cell line MDCK was
chosen because it is a classic model system extensively used for epithelial growth, morphogenesis and mechanobi-
ology. The maximal possible growth was reached after 48 h. Beyond that time point, epithelial colonies started to
grow outside the topographically structured region of the substrate. Colonies growing over flat, isotropic control
surface showed an isotropic growth illustrated by their persistent circular shape. By contrast, all the colonies
cultured over the edgeless topographies grew into an elliptic shape (Fig. 1B). The average deviation angle from
the topography α indicated that epithelial colonies align with the longitudinal axis of the ridges in all curvature
condition tested (Fig. 1C,D). As summarized in Table 1, the alignment with the longitudinal axis is improved
by more than 40° (deviation angle between 1.5° and 3.6° whereas it reaches 45° on the Flat control reflecting the
uniform distribution of the deviation angle in this case). This confirms that epithelia retain their ability of contact
guidance even in the absence of topographical discontinuities. Importantly, we noticed that the elongation of the
colony (aspect ratio) shows a linear correlation with the maximum convex or concave curvature (Fig. 1B,E). A
transversal convex curvature radius of 44 µm increase the average elongation by 30% compared to the Flat control
whereas a high curvature (curvature radius of 2 µm) double the elongation of the growing monolayer compared
to the control (Table 1). In order to account for a possible effect of the topography on the extent of growth of
the monolayer, we also computed the ratio of elongation to growth. We observed that the relationship between
topography and elongation was maintained (Fig. 1F). In our approach, we used surfaces of similar period and
depth, ensuring a comparable spatial density of topographical signals. Although the width of the flat section of
the ridge varies, it is similar between Topo I and Topo II and yet, the change in maximum curvature still cor-
relates with a noticeable drop in colony elongation. Taken together, these observations clearly demonstrate that
cell-scale curvature is per se an important morphogenetic cue able to guide and tune the growth of epithelia.
Growing epithelia exhibit a progressive restriction of their transversal growth. While previous
studies reported the effect of anisotropic surfaces on epithelia, their impact on the dynamics of epithelial growth
remained unclear. Therefore, we used our topography inducing the strongest phenotype to look deeper into
how these surfaces affected the dynamics of epithelial. Over 24 h, colony size and elongation increase simulta-
neously and linearly (Fig. 2A,B and Supplementary Movie 1). The quantification of the colony border velocity
showed that the transversal growth is very slow, with an average speed below 10 μm h−1 while the longitudinal
growth reaches up to 40 μm h−1 on average (Fig. 2C). Therefore, we produced a detailed map of edge velocity as
Scientific Reports | (2020) 10:14784 | https://doi.org/10.1038/s41598-020-70907-0 2
Vol:.(1234567890)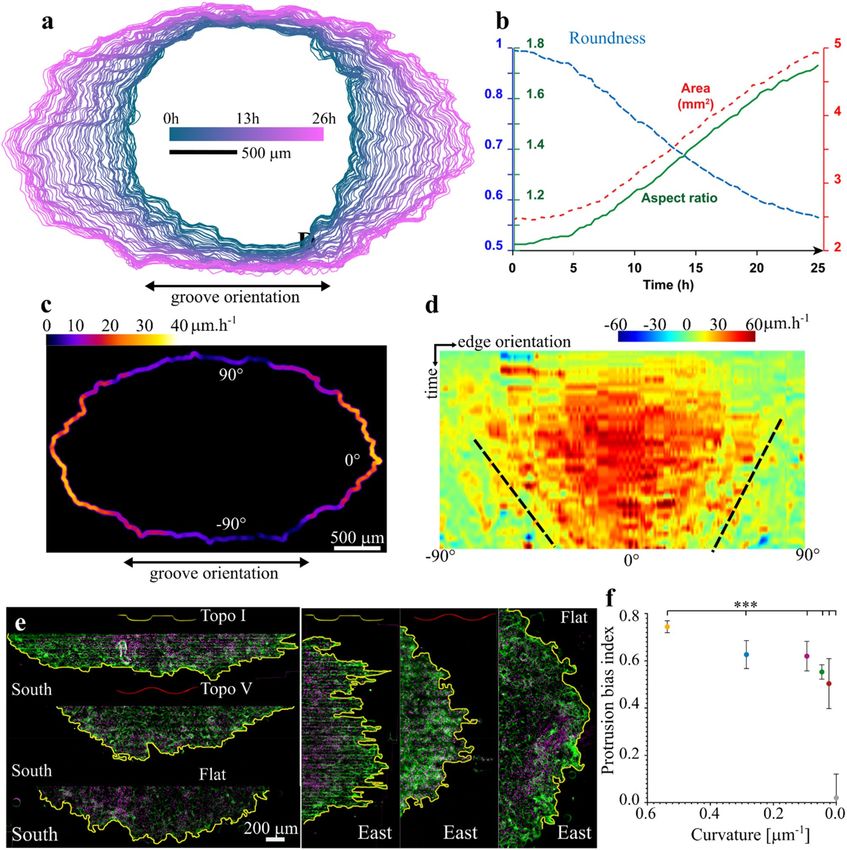
www.nature.com/scientificreports/
Figure 1. The periodic curvature of the substrate linearly controls the epithelium elongation. (a) transversal
cross-section of topographies I to V (orange: F-actin, magenta: nuclei, cyan: fibronectin). Note the
decreasing curvature at the ridge/groove junctions. Note that cells can fit entirely on the ridges or grooves.
(b) Representative outlines of epithelial monolayers after 48 h of growth on the surfaces shown in A. The
surface longitudinal axis is oriented horizontally. The size of the outlines has been normalized to allow
easier comparison of the shapes. (c) Schematic of the morphological parameters quantified. In blue, the
ellipsoidal epithelial colony after 2 days of growth. The colony alignment with the topography is calculated
as the α angle between the grooves and the longer axis of the colony. The colony elongation of the colony is
the Aspect Ratio of the colony longer axis D to the shorter axis d. (d) Epithelial colony alignment with the
topography as explained in C (mean + SEM). Five to 9 independent colonies per topography. The colony
orientations on the 5 topographies are all statistically significant compared to flat (a one-way ANOVA followed
by Tukey multiple comparison tests showed a statistical difference between the topographies and the flat
control, P < 0.0001). (e) Epithelial colony elongation after two days of growth as a function of the maximal
convex (left) or concave (right) curvature of each surface (see Supplementary Fig. S1 and Experimental
Section for curvature calculation). Five to 9 independent colonies (mean + SEM). Linear regression:
Elongation = 1.505 × Convex + 1.235, R2 = 0.90 1; Elongation = − 3.441 × Concave + 1.212, R2 = 0.9124. Dotted
lines: 95% confidence interval of the linear regressions. (f) Epithelial colony elongation after 2 days of growth
as shown in (e) normalized by the growth of the colony. The growth is defined by (A − A0)/A0 with A being the
colony area at day 2 and A0 the colony area at day 0.
Scientific Reports | (2020) 10:14784 | https://doi.org/10.1038/s41598-020-70907-0 3
Vol.:(0123456789)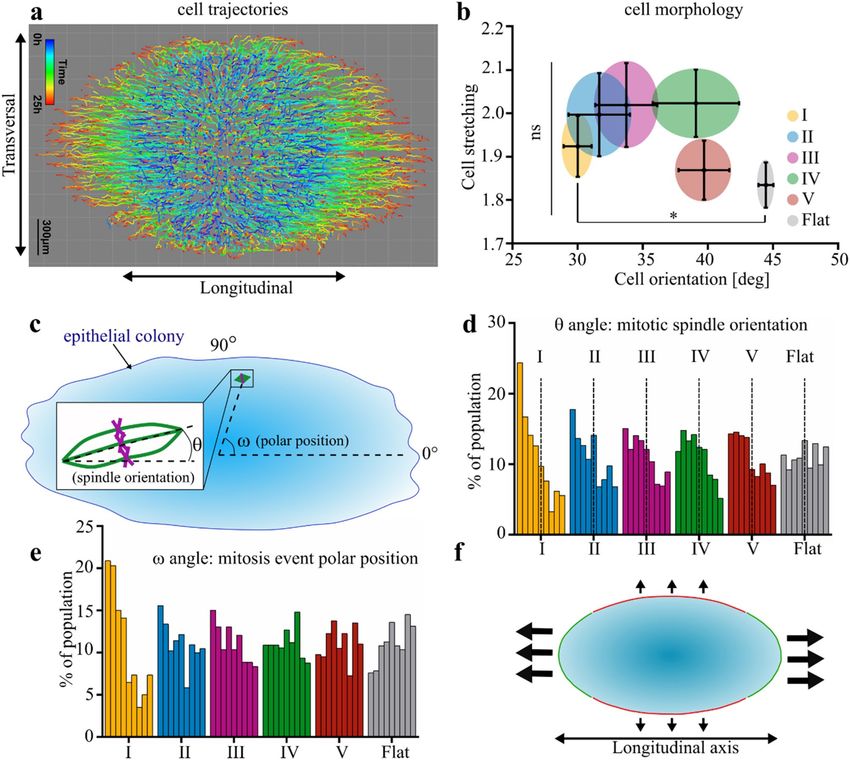
www.nature.com/scientificreports/
Max. convex curvature Max concave curvature Min concave radius Average elongation (fold
Topography (μm−1) Min. convex radius (μm) (μm−1) (μm−1) of Flat) Average alignment (°)
Topo I 0.537 2.0 − 0.244 4.3 1.9 1.8
Topo II 0.285 3.8 − 0.129 8.2 1.6 1.5
Topo III 0.093 11.3 − 0.046 23.6 1.4 3.1
Topo IV 0.046 22.8 − 0.028 37.0 1.3 2.3
Topo V 0.023 44.4 − 0.024 43.3 1.3 3.6
Flat 0 Infinity 0 Infinity 1 45.3
Table 1. Summary of morphological changes of the epithelial colonies. The Values for maximal convex or
concave curvature or radii of curvatures are the mean of the values calculated as detailed in the “Material and
methods” and in Supplementary Fig. S1.
a function of time and of the local border orientation relatively to the topography axis (Fig. 2D). Interestingly it
highlighted a progressive restriction of the fast extending regions from a [− 60°; + 60°] arc centered around the
surface longitudinal axis to a [− 25°; + 25°] arc 20 h later. Given that the topographies are made of periodic topo-
graphical elements (a ridge and a groove), it is possible that the progressive restriction of fast extending regions
to the longitudinal direction is due to the repetitive encounter of transversally extending regions with evenly
spaced topographical obstacles. Such a “summation” of topographical cues in periodic surfaces had been sug-
gested before2. Supporting that idea, we found that longitudinally expanding segment of the monolayer bound-
ary presented clear pluricellular protrusions. (Fig. 2E) These pluricellular protrusions are site of strong cell-ECM
traction forces and are considered important in defining the overall direction of collective migration of the
monolayer23,24. By contrast, the outline of the transversally oriented regions of the monolayer are straighter and
apparently devoid of such pluricellular protrusions. This contrast is striking on the most curved surface (Topo
I) and gets weaker as the local curvature of the ridge/groove junctions decreases (From Topo I to Topo V). We
quantified this anisotropy in pluricellular protrusion formations by developing a Protrusion Bias Index (see
“Material and methods” and Supplementary Fig. S2) equal to 0 in the absence of anisotropy and increasing with
the contrast in protrusion formation between longitudinal and transversal segments of the monolayer outline.
As shown in Fig. 2F, the index is close to 0 on the flat control reflecting the topographical isotropy of this surface,
while it is positive on all topographies and decrease along with the curvature. We concluded that the curved
regions, extended longitudinally, work as curvature-dependent topographical barriers that repeatedly hamper
the formation of pluricellular protrusions and the transversal growth of the monolayer. Under this hypothesis, it
becomes clear why it is important to uncouple the curvature parameter from the period parameter as the former
would affect the “strength” of those barriers whereas the latter would affect the rate of encounter.
F‑actin and nuclei organizations are sensitive to the magnitude of convex curvatures. The
previous observations support the idea that cell-scale curvature is a topographical obstacle that hampers trans-
versal monolayer extension. Nuclei and actin cytoskeleton have been shown to play essential roles in the cell
response to curvature, we thus decided to investigate whether they were likely to be involved in the curvature-
induced elongation of e pithelia12,14. We observed that both the F-actin and nuclei show heterogeneous and ani-
sotropic distributions in presence of periodic surface curvature. The F-actin as well as the nuclei densities in the
xy plane clearly indicate a heterogeneity with longitudinal stretch of high and low density of F-actin or nuclei
(Fig. 3A,B). Importantly, this anisotropic distribution of F-actin and nuclei is less conspicuous as the periodic
curvature of the surface decreases. Therefore, the anisotropy of the topography is associated with a correspond-
ing and curvature-dependent anisotropy of F-actin orientation and nuclei distribution.
Supporting the notion that curvature is a topographical obstacle, the convex regions seem to particularly
affect the distribution of F-actin and nuclei as their densities drops at the most convex points and accumulate
in its vicinity (Fig. 3A,B). This effect is especially clear on the most curved topographies Topo I to Topo III, and
becomes less visible on Topo IV and Topo V. We quantified the average spatial orientation of actin fibers in con-
focal z-stack using OrientationJ Fiji plugin25 and we observed that the anisotropic density of F-actin was accom-
panied with a curvature-dependent longitudinal alignment of the F-actin cytoskeleton (Fig. 4A,B). In particular,
3D reconstruction showed that the high actin density regions close to the most convex point of the surface was
made of thick F-actin bundles running longitudinally without crossing the convexity (Fig. 4B, Supplementary
Fig. S3 and Supplementary Movies 2 and 3). This suggests that convex regions are not suitable for actin crossing
and therefore guide the monolayer cytoskeleton in the longitudinal direction in a curvature-dependent manner.
Regarding the nuclei distribution, we had previously shown in single cells spread over isotropically curved
surfaces that nuclei slide away from convex regions as a result of mechanical stress and that this was instrumental
for single cell sensing of curvature12. To check whether nuclei from our epithelial monolayers were subjected to
mechanical stress when contacting the convex regions of the substrates, we used nuclei deformation as a proxy.
We measured the solidity of the transversal shape of nuclei positioned over the convex regions (Fig. 4C). A non-
deformed ellipsoid nucleus would have solidity equal to one. Our results clearly indicate a curvature-dependent
deformation of nuclei when position over the convex regions, whereas concave curvature did not have any
clear effect. Consistently, the ratio of nuclei overlapping the sites of maximal convex curvature relatively to flat
sections remained below one and increased proportionally to the curvature (from 0.3 on Topo I to 0.9 on Topo
V, Fig. 4D). By contrast, the corresponding “concave to flat” ratio did not indicate significant enrichment or
Scientific Reports | (2020) 10:14784 | https://doi.org/10.1038/s41598-020-70907-0 4
Vol:.(1234567890)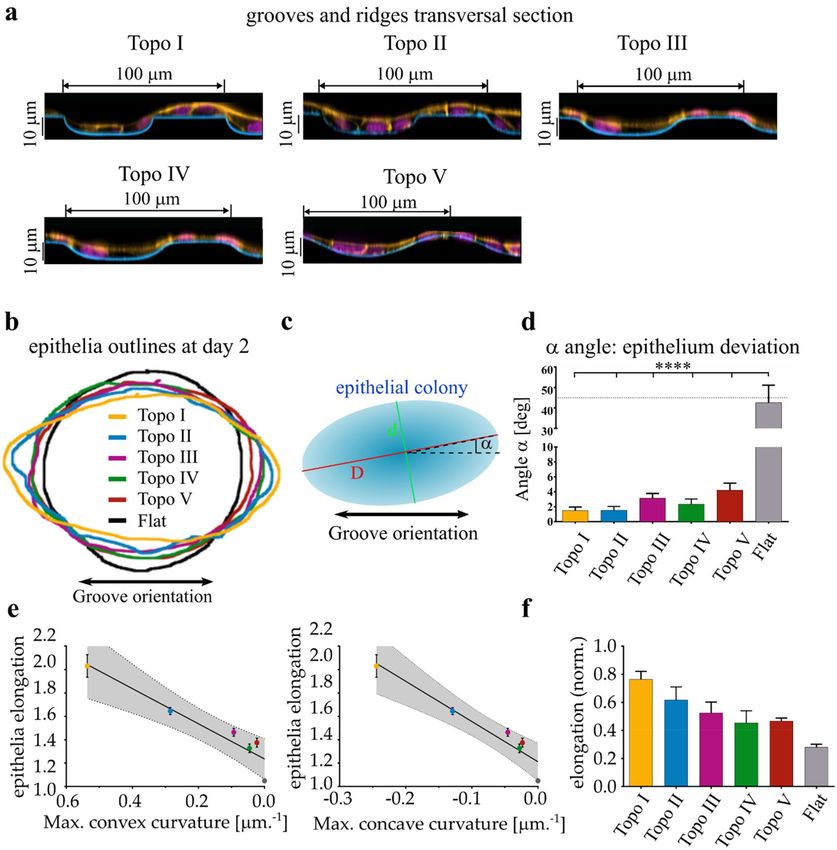
www.nature.com/scientificreports/

                            Figure 2.  The elongating epithelium shows a progressive hampering of its transversal growth. (a) Superposed
                            outlines of a growing MDCK colony on Topo I corresponding to Movie 1. Time lapse: 20 min. (b) Longitudinal
                            elongation of a representative MDCK colony over time. Circularity, calculated as (Perimeter)
                                                                                                                    4π×Area
                                                                                                                            2 decreases as colonies
                            becomes less circular. Aspect ratio, calculated as the ratio of the longer axis of the bounding ellipse to the shorter
                            axis indicates the stretching of the colony. (c) Average local velocity the colony edge outgrowth from (a),
                            color-coded and represented on the final colony outline. (d) Velocity map of the progression of the colony edge
                            from (a). The x axis corresponds to the local edge orientation relatively to the surface longitudinal axis. Zero
                            degree represents the part of the edge extending in the longitudinal direction whereas 90° represent the edge
                            extending transversally across the grooves and ridges. The black dotted lines highlight the progressing
                            restriction of high velocity outgrowth to the edge segments extending longitudinally. (e) Representative
                            transversally extending (left) and longitudinally extending (right) epithelium borders used for the calculation of
                            the Protrusion Bias Index; green: actin, magenta: nuclei, yellow: colony border. Note the contrast of tortuosity
                            between both borders on a given topography and between topographies. (f) Protrusion Bias Index as a function
                            of convex curvature: a higher value indicates higher contrast in pluricellular protrusion formation between the
                            colony border extending longitudinally and transversally (see Supplementary Note S1 for details). Four to 6
                            independent colonies for each topography (mean + SEM). A one-way ANOVA showed a statistically difference
                            between all the topography and the Flat control, P < 0.001.

Scientific Reports |   (2020) 10:14784 |                https://doi.org/10.1038/s41598-020-70907-0                                               5

                                                                                                                                            Vol.:(0123456789)
www.nature.com/scientificreports/
Figure 3. Heterogeneous and anisotropic distribution of F-actin and nuclei in presence of curvature. (a) F-actin
density map. Blue indicates low density, Red indicates high density. Black dotted line: positions of the points of
maximal convex curvature. On the right: the average intensity of the map at every transversal position. Twenty
to 30 superposed independent fields were used to generate the maps. Scale bar: 40 μm. (b) Nuclei density map.
Blue indicates low density, Red indicates high density. Black dotted line: positions of the points of maximal
convex curvature. On the right: the average intensity of the map at every transversal position. Twenty to 30
superposed independent fields were used to generate the maps. Scale bar: 40 μm.
Scientific Reports | (2020) 10:14784 | https://doi.org/10.1038/s41598-020-70907-0 6
Vol:.(1234567890)www.nature.com/scientificreports/
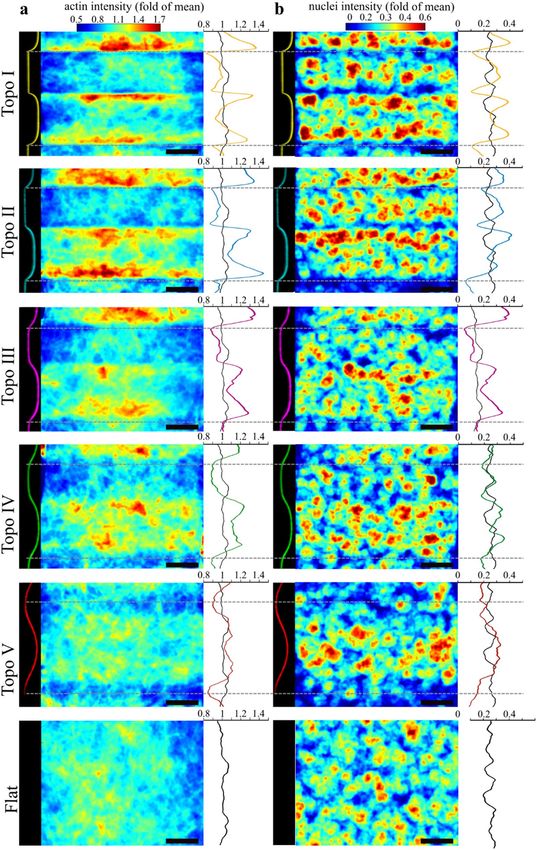
Figure 4. The curvature of the substrate controls the orientation of F-actin and the distribution of nuclei
within the monolayer. (a) Average F-actin orientation in the xy plane (mean + SEM). Ten fields per colony and
2–7 independent colonies per topography. An angle of 0 indicates a perfect alignment with the topography.
The points fit an exponential function y = a + b−cx (R2 = 0.7726), dotted lines: 95% confidence interval. (b)
Color coding for F-actin orientation relatively to the surface longitudinal axis for epithelia growing over
the most curved (Topo I), least curved (Topo V) and Flat control. The color code is indicated in the bottom
left. (c) Deformation of the nuclei overlapping the points of maximal convex or concave (mean + SEM). The
deformation is assessed by the solidity of the transversal cross-section of the nuclei (ratio between the area of
the nucleus transversal cross-section and the area of its bounding ellipse). Lower solidity indicates lower nucleus
deformation. Shapes of representative nuclei and their solidity are shown. Thirteen to 30 nuclei per condition.
One-way ANOVA followed by Tukey’s multiple comparison test, ****P < 0.0001, ***P < 0.001. (d) Proportion
of nuclei positioned over the point of maximal convex or concave curvature of a given topography relatively to
flat sections (mean + SEM, 6 fields per colony, 2–6 independent colonies per topography). One-way ANOVA
followed by Tukey’s multiple comparisons test *P < 0.05, **P < 0.01, ***P < 0.001, ****P < 0.0001.
exclusion from the concave regions relatively to flat sections. Similarly to actin, albeit with a much milder effect,
we observe a trend of increasing nuclei alignment with the longitudinal axis on surfaces with higher curvature
(Supplementary Fig. S4A). By contrast, we did not observe a correlation between the type of topography and
other morphological aspects of nuclei such as the volume, the elongation or the flatness, with the exception of
nuclei being flatter on a totally flat substrate (Supplementary Fig. S4B–D).
Altogether, these results clearly indicate that both F-actin and nuclei, key component of the cell mechanical
machinery, are distributed according to the underlying anisotropy of the substrate and that this distribution
is proportional to the periodic convex curvature of the substrate. Therefore, they are sensitive to curvature
and it strongly suggests that they both participate in the curvature reading by the monolayer and the resulting
Scientific Reports | (2020) 10:14784 | https://doi.org/10.1038/s41598-020-70907-0 7
Vol.:(0123456789)www.nature.com/scientificreports/
contact-guided oriented growth. Consistently with what we had previously demonstrated in single cells over
isotropic surfaces, convexity appears to be a mechanically unfavorable topographical feature from which F-actin
and nuclei are partially excluded. Within the context of anisotropic curvature such as ours, longitudinal stretches
of convex regions thus create curvature-dependent “topographical barriers” unsuitable for nuclei crossing and
F-actin positioning. This may in turn guide the cytoskeleton and cell orientation along the longitudinal axis of
the surface and induce the oriented growth of the tissue.
Periodic curvature induce a curvature‑dependent guidance of key morphogenetic mecha-
nisms. The growth along a specific direction of space is the end-result of synergistic morphogenetic pro-
cesses such as cell rearrangement and alignment, cell stretching, collective migration and oriented m itosis26.
We thus decided to determine which of these morphogenetic mechanisms might be guided by the curvature
pattern of the substrate. Among these mechanisms, collective migration has been widely investigated over the
years. We tracked the trajectory of cells in the growing colony from Supplementary Movie 1 (Fig. 5A). The
migration trajectories initiating along the longitudinal axis remained straight while the trajectories starting in
the transversal direction seemed hampered and eventually turned along the longitudinal axis. Consistent with
our previous observation on the formation of pluricellular protrusions (Fig. 2) and orientation of the actin
cytoskeleton (Figs. 3, 4), this confirmed that curvature sensing leads to a reorientation of cell trajectories within
the monolayer resulting in curvature-dependent longitudinal growth of the epithelia.
We then looked at cell morphology (Fig. 5B). Indeed, the anisotropic growth of epithelia during development
or post-injury re-epithelialization also includes events of cell stretching and alignment26. While we observed a
trend toward curvature-dependent cell alignment similar to what we observed for nuclei (Supplementary Fig. S4),
we did not manage to obtain statistically significant difference compared to the Flat control (with the exception
of Topo I). This is in contrast with the effect of anisotropic topographies on single cells, where cells tend to show
a significant increase of e longation6. It then highlights that the response of the epithelium to curvature is likely
to be a collective phenomenon.
Beside migration and cell morphology, the oriented proliferation is also a key factor of oriented morphogen-
esis and participate in the elongation of various tissues in vivo26. Consistently, we checked whether the cell-scale
topography could also reorient cell proliferation. We quantified both the orientation of the mitotic spindle (θ
angle) and the angular position of mitosis events using the longitudinal axis of the surface (ω angle) and the
colony centroid as references (Fig. 5C). Importantly, the θ angle distribution presented a clear skew toward
low angles. This bias got smaller as the curvature decreased until reaching a homogenous distribution on the
Flat control (Fig. 5D). The ω angle distribution showed that the majority of mitotic events had an angle below
45° on high curvature topographies (Topo I–III) (Fig. 5E). This means that more cell divisions are occurring
in the longitudinally faced sectors of the colony on highly curved topographies, which may contribute to the
faster growth of the colony in the longitudinal direction. This interestingly demonstrates a topography-based,
curvature-dependent control of oriented proliferation: anisotropic topography leads to a longitudinal division
of cells while the magnitude of the local convexity modulates the extent of this effect.
Altogether, we show that periodic curvature exerts a global control over epithelial morphogenesis by target-
ing various key mechanisms such as migration, cell alignment or proliferation. These effects combined lead to a
progressive slowdown of transversal extension compared to longitudinal extension, causing the observed elonga-
tion and the associated elliptic shape of the epithelium (Fig. 5F). Importantly, all these effects are proportional
to the transversal curvature. It confirms that the transversal curvature is the ruling parameter that modulate the
anisotropy of the growth of epithelial monolayers.
Discussion
The phenomenon of contact guidance leads to the oriented migration or growth of cohesive cell population such
as epithelia in presence of anisotropic microenvironment. The majority of studies investigating topographical
contact guidance of epithelia used anisotropic and edge-containing s urfaces4,6,7,21,27–29. The fact that fibrillary
ECM such as collagen can guide the collective migration of MDCK island30 highlighted the necessity to work
with geometries more akin to the in vivo context and has spurred interest into the importance of curvature.
Previous works established that epithelial monolayers are sensitive to cell-scale curvature. Some of them used
confined geometries such as cylinders or hollow tubes. Confinement either impeded further growth or artificially
forced the growth toward a specific direction of s pace13,14,17,31. For example, previously used wires or hollow tubes
inherently cause a lateral confinement and restrict the monolayer progression to the cylinder axis. In addition,
this lateral confinement modifies the dynamics of the monolayer, causing plugging (hollow tubes)14 or altered
migration velocity (wires)13. By contrast, “open” geometries where every direction of growth in the xy plane is
theoretically possible do not constrain the epithelial colonies and preserve their ability of auto-organization. They
then allow to investigate the efficiency of cell-scale curvature to guide tissue morphogenesis. A recent report
indicate that endothelia grow anisotropically over sinusoidal surfaces suggesting that topographical discontinui-
ties are dispensable and that curvature of the environment can by an efficient morphogenetic cue18. However,
changes in the sinusoid wavelength between conditions alter the period of curved sections. As a consequence,
endothelial islands of similar areas may see less curvature-originated guiding cues when cultivated over long
wavelength surface compared to short wavelength surface, which may explain the overall change in anisotropic
growth. The importance of the spatial density of topographical pattern had been suggested in pioneering work2
and reported for angular, nanometric p atterns19,20. We eliminated this bias in our system by developing surfaces
with different curvatures but with constant period. This is accompanied with a change in ridge width, which
could introduce a new bias. However, we do note that Topo I and Topo II have ridges of comparable width and
yet induce noticeable differences in all the supercellular and subcellular readouts considered, indicating that
Scientific Reports | (2020) 10:14784 | https://doi.org/10.1038/s41598-020-70907-0 8
Vol:.(1234567890)www.nature.com/scientificreports/
Figure 5. Curvature-dependent orientation of key morphogenetic mechanisms. (a) Cell trajectories during
24 h of growth on Topo I (see also Supplementary Movie 1). Note that cells initially starting transversally turns
toward the longitudinal axis. (b) Average cell stretching (Aspect Ratio) and cell alignment with topography
within the epithelial colony (mean + SEM). Five separated fields per colony, four independent colonies
per topography. Non parametric Kruskal–Wallis test, *P < 0.05. (c) Schematic of the positional parameters
quantified for mitosis. θ angle: orientation of the mitotic spindle relatively to the topography longitudinal axis
ω angle: angular coordinate of the dividing cell using the longitudinal axis as reference axis and the colony
centroid as origin. (d) Distribution of the mitotic spindle orientation θ (bin width: 10°) 300–400 mitosis from
4 independent colonies for each topography. The dotted lines separate the angles below 45° (indicating an
alignment with the substrate longitudinal axis) and above 45° Kruskal–Wallis non-parametric test shows a
statistical difference between medians P < 0.0001. (e) Distribution of the angular coordinate ω of cells in mitosis
(bin width: 10°), 300–400 mitosis from 4 independent colonies for each topography. Kruskal–Wallis non-
parametric test shows a statistical difference between medians P < 0.0001. (f) Model of the epithelial anisotropic
growth. The surface longitudinal axis is oriented horizontally. Transversally facing colony borders are hampered
in a curvature-dependent fashion. Longitudinal orientation of cell migration and cell proliferation sustain the
growth of longitudinally facing borders, leading to the anisotropic deformation of the colony.
curvature is indeed the ruling topographical parameter. With this approach, we demonstrated that the local cur-
vature is a potent cue tuning the anisotropization of epithelium growth. The curvature-driven anisotropic growth
is characterized by a curvature-dependent exclusion of nuclei from convex region and alignment of actin stress
fiber with the longitudinal axis (Figs. 3, 4). This suggests that areas of convex curvature work as longitudinally
oriented topographical barriers hampering tissue growth transversally to them.
Scientific Reports | (2020) 10:14784 | https://doi.org/10.1038/s41598-020-70907-0 9
Vol.:(0123456789)www.nature.com/scientificreports/
Epithelial morphogenesis results from the synergy between various morphogenetic processes such as collec-
tive migration, intercellular rearrangement, cellular morphological changes and oriented cell d ivision26. Inter-
estingly, we observed a wide effect as both migration and proliferation presented a curvature-dependent spatial
bias toward the longitudinal axis of the surface (Fig. 5). This puts the magnitude of anisotropic curvature as a
central parameter of the microenvironment able to modulate many aspects of tissue growth and morphogenesis.
The question of whether the substrate curvature affects each morphogenetic mechanism individually or rather
coordinate them through an unknown mechanism is yet to be determined. To that regard, the spatial bias of
pluricellular protrusion formation is interesting (Fig. 2). These are sites of particularly important cell-ECM trac-
tion forces23,32 and may play a role in local g uidance33. It then raises the interesting possibility that the spatial
anisotropy of pluricellular protrusion leads in turn to a corresponding anisotropy of the monolayer mechanical
stress. Given that cell and mitosis orientation are sensitive to the local mechanical stress direction34–36, it could
then explain the curvature-dependent reorientation of mitosis observed in Fig. 5. To test that hypothesis, it would
therefore be very interesting to quantify the intercellular and cell-substrate mechanical stresses to determine
the influence of the local substrate curvature on it and the variation of stress magnitude/orientation along the
longitudinal vs transversal axis.
Several hypotheses have been formulated to explain the mechanism of transduction of the topographi-
cal information. The Curtis and Clark hypothesis suggests a role for topographical discontinuities (edges) in
topography sensing2 for example through the accumulation of Focal Adhesions along the e dges10. Alternatively,
O’Hara and Buck hypothesized that the lower parts (grooves) of nanometric topography were out of cells’ reach
thereby restricting focal adhesions to the ridges37. With our curved, cell-scale topographies, these hypotheses
do not hold. First because our topographies are smooth and edgeless and second because their dimensions allow
for cell-substrate contact at every point, even in the grooves (Fig. 1A). Besides, we did not observe dominant
and repetitive pattern of focal adhesions (data not shown). We thus looked for other cellular components that
might be involved in the sensing of curved surfaces. We hypothesized that eligible candidates should exhibit
an anisotropic organization reflecting the anisotropy of the substrate and being proportional to the curvature.
Both nuclei distribution and F-actin orientation satisfy these criteria. Several studies establish nuclei as essential
players of cell reaction to t opography38. We demonstrated that single cells avoid crossing convex regions owing
to the tendency of nuclei to slide away from convex curvature12. This is consistent with the low nuclei density
over convex regions in our settings indicating that the transversal crossing of convex regions is impaired. In
addition, the orientation of actin stress fibers have been shown to depend on the local curvature39,40. While no
mechanism has been fully demonstrated, a model suggests that the final orientation of stress fibers results from
the balance between the bending energy cost and the cell c ontractility41. According to this model, cells on a low
convex curvature will orientate their stress fibers along the direction of maximum curvature to compensate the
deformation resulting from cell contractility. We made observations consistent with this model as we indeed
observed transversal stress fibers on our topographies with low convex curvature radii, Topo IV and V (22 and
44 μm, respectively see Fig. 4 and Supplementary Fig. S3). This finding is consistent with the available literature,
where epithelial cells growing over cylindrical substrates of 16–40 μm curvature radius also present transversally
oriented stress fibers, e.g. perpendicular to the cylinder a xis13,39. On higher convex curvature, the logic behind
the model of Biton and Safran would then suggest an orientation of actin stress fiber along the path of minimum
curvature to compensate for the rising energetic cost of actin bending as the substrate curvature is increased.
We can then understand why convex regions seem to work as “topographical barriers” on our high curvature
topographies (radii below 10 μm). In that case, actin stress fibers tend to follow in the form of longitudinal bun-
dles rather than to cross. Together, nuclei exclusion from, and actin reorientation along convex regions would
then result in a spatial bias of various morphogenetic mechanisms such as collective migration or proliferation
along the longitudinal surface axis.
Our surfaces also contain concave regions, specifically at the base of the slopes between the grooves regions
and the ridges. This concave curvature also repeats itself all the way along the longitudinal axis. Epithelial
monolayers cultured in concave grooves or hollow tubes orientate their actin along the longitudinal a xis14,42. It
is thus possible that concave curvatures also play a role in the topography-controlled directional growth of our
epithelial colonies. However, we only observed curvature-dependent nuclei exclusion from convex areas (Fig. 4).
In addition, we observed a drop of actin density right at the point of maximal convex, but not concave, curvature
(Fig. 3). Although we cannot rule out a role of concave curvature in the contact guidance of growing epithelia,
we estimate that the convex curvature is the driving geometrical cue in our experimental setting.
The notion of contact guidance had been applied to curved surfaces presenting either lateral confinement or
varying topographical spatial densities. Here, we achieved the adjustable anisotropization of epithelial growth
using smooth grooves and ridges with various degrees of curvature but equal periods and depths. In this work, we
thus demonstrate that the magnitude of curvature is intrinsically a potent and tunable guiding cue for the mor-
phogenesis of epithelia. Longitudinally oriented convex regions act as “topographical barriers” whose “strength”
depends on the curvature magnitude. Repetitive encounter between the growing epithelium and these barriers
progressively reorient the cytoskeleton, the cell migration and proliferation and leads to the whole epithelium
elongation. As curvature is a geometric feature that can take an infinity of values, it opens interesting possibilities
of fine-tuning the tissue behavior by substrate design. Growing epithelia may encounter curved and anisotropic
landscape in vivo for example in the vicinity of blood vessels or thick collagen bundles of the dermis43. In addi-
tion, tissue curvature has a strong influence of the outcome of cancer m orphogenesis44. Thus, we suggest that
the control of epithelial anisotropic growth through local curvature participate in tissue morphogenesis in vivo,
together with classic chemical or mechanical cues. The ability of cell-scale curvature to induce and modulate
the anisotropic growth of epithelial sheets bears a great interest for the design of in vitro implant device aiming
at fostering the growth of epithelial tissues.
Scientific Reports | (2020) 10:14784 | https://doi.org/10.1038/s41598-020-70907-0 10
Vol:.(1234567890)www.nature.com/scientificreports/
Material and methods
Preparation PDMS surface. Five steel master surfaces were micro-fabricated. They consisted of an array
of parallel grooves with a period of 100 µm and an amplitude of 10 µm. For the five surfaces the mid height
valley width equals the mid height peak width. Each surface presents a distinct peak curvature ranging from a
straight edge (Topo I) to a sinusoidal curve (Topo V). The surfaces were microstructured on 316 L stainless steel
coins (diameter 15 mm, thickness 1.5 mm) using a two-step electrochemical process. The raw materials were
first mechanically polished to obtain a mirror finish before being spin-coated with a polymeric resin (10 µm
thick). The first process step mask pattern (diameter 8 mm) was then created through local UV laser ablation
of the resin coating. Mass transport-limited electrochemical dissolution was then performed under optimized
hydrodynamic conditions. The experiment was stopped when a precise electrical charge corresponding to the
desired dissolution depth was passed through the system. For the second process step, the remaining polymeric
mask was laser ablated within a 10 mm diameter and a second electrochemical dissolution step was applied until
the final topography was reached. The geometric parameters of the first step mask and the electrical stop charges
of both electrochemical steps were obtained by numerical simulations (custom Labview 2D Laplace equation
solver using a boundary elements method).
Plastic replicates were then produced by hot embossing of the steel masters on 35 mm Petri dishes. The final
PDMS surface (thus with the same topography as the steel master templates) were produced by pouring liquid
PDMS (Sylgard 184, 1 part of curing agent for 10 part of PDMS) into the plastic replicate and incubated 6 h at
80 °C.
Estimation of local curvature of PDMS surface. Fibronectin-coated PDMS surfaces were immu-
nostained. Alternatively, rhodamine-labelled fluorescent fibronectin (20 μg mL−1, Cytoskeleton Inc.) was used.
The transversal cross-section of the topography was obtained from reslicing of a vertical confocal z stack (z step
0.37 μm, 60 × lense of AN 1.4 yelding an optical slice of 1 μm) and subsequent binarizing and skeletonizing the
fibronectin signal (Supplementary Fig. S1A). An equation y = f (x) was fitted to the cross-section by non-linear
regression to describe the surface altitude as function of position along the transversal axis (Supplementary
ÿ
Fig. S1B). The curvature κ was then obtained at each point by k = 3 where the dot and double dot repre-
(1+ẏ2 ) 2
sent the first and second derivative of f(x), respectively. The local maxima and minima of κ over a single period
of the topographical pattern correspond to the most convex and most concave points, respectively. Resulting
values are shown in Supplementary Fig. S1C,E. Color-coded representations (Supplementary Fig. S1D) of the
local curvature were produced by averaging κ between surfaces at each points and using binarized fibronectin
staining as mask.
Cell culture. The parental MDCK cell line (canine epithelial kidney) was obtained from the Cell Bank of
the State of Rio de Janeiro (BCRJ, cell code 0168). MDCK were cultured in Dulbecco’s Modified Eagle Medium
(Sigma D6046) low glucose, supplemented with 10% Fetal Bovine Serum (Gibco, lot #210415K), MEM Non-
essential Amino Acid (Sigma, M7145), L-glutamine 2 mM (Sigma, G7513). For the growth of epithelial colonies
over PDMS substrates, PDMS substrates are sterilized with ethanol and coated with bovine plasma fibronectin
(ThermoFischer Scientific, 33010018 20 μg mL−1) for 1 h at room temperature. In parallel, small PDMS blocks
with a central, custom-made well are first sterilized and passivated with a 5% solution of BSA in water and then
a 5% solution of Pluronic acid F-127 (Sigma, P2443) and placed over the PDMS substrate. A MDCK suspension
(1.15 million cells mL−1) is loaded into the wells incubated overnight before carefully removing the wells.
Antibodies and reagents. Antibodies used are available in Supplementary Informations (Supplementary
Note 2). Other staining reagents are as follows: Alexa488-phalloidin (ThermoFischer Scientific, A12379 1:200),
Alexa568-phalloidin (ThermoFischer Scientific, A12380 1:200), Alexa647-phalloidin (ThermoFischer Scientific,
A22287 1:200), Hoechst 33342 (ThermoFischer Scientific, H1399, 1:1,000).
Live cell imaging. For live cell imaging, cells adhering onto the topographies where loaded with the dye
CellTracker Red CMPTX (ThermoFischer) and placed in an incubation chamber (Okolab) at 37 °C, 5%CO2
and H2O saturated. Z-stacks were acquired at regular time intervals with a 20 × magnification objective. Particle
tracking was done on vertical maximum projection of the z-stacks using Imaris software (Bitplane).
Immunofluorescence. For immunofluorescence, the samples are washed with warm PBS with Calcium
and Magnesium and fixed and permeabilized for 15 min at room temperature (formaldehyde 4%, Triton X-100
0.2% in PBS with Calcium and Magnesium). The samples are then rinsed blocked for 30 min (5% BSA, 0.2%
Triton X-100 and 5% donkey serum in TBS). The samples are then rinsed and incubated with the primary (1 h)
then secondary (45 min) antibody with 3 washes in between in staining buffer (1% BSA and 0.2% Triton X-100
in TBS). The samples are then rinsed 5 times and mounted in glycerol 90%, 0.5% N-propyl gallate (Sigma 02370).
Images are acquired on a Olympus IX71 epifluorescence microscope, a Zeiss Axiozoom V.16, or a Leica TCS-
SPE Confocal microscope.
Actin orientation. To determine the orientation of F-actin in the xy plane, z-stack from confocal micros-
copy images were analyzed slice by slice with the OrientationJ ImageJ plugin25. The dominant orientation was
averaged between slices of a given stack then between stacks of a given epithelial colony to yield the mean F-actin
orientation of the colony. Six stacks by colonies were used.
Scientific Reports | (2020) 10:14784 | https://doi.org/10.1038/s41598-020-70907-0 11
Vol.:(0123456789)www.nature.com/scientificreports/
Analysis of mitosis. To analyze the position parameters of mitosis event, an image of the entire epithelial
colony stained for nuclei and tubulin was obtained using an Axiozoom V.16. The orientation of mitosis was
determined based on the orientation of the mitotic spindles. The polar coordinate was manually determined
using the longitudinal axis and the colony centroid as references.
Analysis of nuclei distribution and deformation. The average number of nuclei positioned over the
points of highest convex or concave curvature was quantified by counting each nuclei overlapping these points
from transversal section of confocal z-stacks and subsequent normalization by the number of nuclei overlapping
an arbitrary point localized on a flat section of the topography. To estimate the topography-induced deformation
of nuclei, nuclei shape from transversal cross-sections of z-stacks were binarized. The solidity (ratio between the
area of the object and its bounding ellipse) of the resulting shapes was obtained using ImageJ.
F‑actin and nuclei density maps. For nuclei, individual fields of view of nuclei were binarized to a pixel
value of 1 for nuclei and 0 for background and carefully adjusted by translation between them to match their
underlying topographies. The aligned and superposed projections are then subjected to an average projection.
Therefore, each pixel value represents the average number of nuclei overlapping that particular point of the
topography. For F-actin, sum projections of individual stacks were obtained and each normalized by its fluores-
cence mean. Then, all these projections were aligned together by translation, and averaged together, yielding an
average F-actin density map.
Morphological analysis of colony. Images of the entire colonies were obtained after two days of growth.
The colony alignment was calculated as the deviation angle between the topography longitudinal axis and the
major axis of the fitting ellipse of the colony. The colony aspect ratio is the ratio between the longer and shorter
axis of the fitting ellipse. The edge velocity was performed using the plugin QuimP for ImageJ45. Shapes of
individual cells were determined by manual outlining and used to calculate the cell orientation and elongation.
Pluricellular protrusion formation (tortuosity). Spatial bias in the formation of migration fingers was
quantified through a “Protrusion Bias Index”. Details on the index are available in Supplementary Fig. S2 and
Supplementary Note 1.
Statistical analysis. All the statistical tests (parametric and non-parametric) were performed using Graph-
Pad Prism 8.
Received: 11 March 2020; Accepted: 24 July 2020
References
1. Nikkhah, M., Edalat, F., Manoucheri, S. & Khademhosseini, A. Engineering microscale topographies to control the cell-substrate
interface. Biomaterials 33, 5230–5246. https://doi.org/10.1016/j.biomaterials.2012.03.079 (2012).
2. Curtis, A. S. G. & Clark, P. The effects of topographic and mechanical properties of materials on cell behavior. CRC Rev. Biocompat.
5, 343–362 (1990).
3. Weiss, P. Experiments on cell and axon orientation in vitro; the role of colloidal exudates in tissue organization. J. Exp. Zool. 100,
353–386 (1945).
4. Ray, A. et al. Anisotropic forces from spatially constrained focal adhesions mediate contact guidance directed cell migration. Nat.
Commun. 8, 14923. https://doi.org/10.1038/ncomms14923 (2017).
5. Londono, C. et al. Nonautonomous contact guidance signaling during collective cell migration. Proc. Natl. Acad. Sci. U.S.A. 111,
1807–1812. https://doi.org/10.1073/pnas.1321852111 (2014).
6. Teixeira, A. I., Abrams, G. A., Bertics, P. J., Murphy, C. J. & Nealey, P. F. Epithelial contact guidance on well-defined micro- and
nanostructured substrates. J. Cell Sci. 116, 1881–1892. https://doi.org/10.1242/jcs.00383 (2003).
7. Kwon, C., Kim, Y. & Jeon, H. Collective migration of lens epithelial cell induced by differential microscale groove patterns. J. Funct.
Biomater. https://doi.org/10.3390/jfb8030034 (2017).
8. Lee, G. et al. Contact guidance and collective migration in the advancing epithelial monolayer. Connect. Tissue Res. 59, 309–315.
https://doi.org/10.1080/03008207.2017.1384471 (2018).
9. Curtis, A. & Wilkinson, C. Topographical control of cells. Biomaterials 18, 1573–1583 (1997).
10. Wojciak-Stothard, B. et al. Role of the cytoskeleton in the reaction of fibroblasts to multiple grooved substrata. Cell Motil. Cytoskelet.
31, 147–158. https://doi.org/10.1002/cm.970310207 (1995).
11. Oakley, C. & Brunette, D. M. The sequence of alignment of microtubules, focal contacts and actin filaments in fibroblasts spreading
on smooth and grooved titanium substrata. J. Cell Sci. 106(Pt 1), 343–354 (1993).
12. Pieuchot, L. et al. Curvotaxis directs cell migration through cell-scale curvature landscapes. Nat. Commun. 9, 3995. https://doi.
org/10.1038/s41467-018-06494-6 (2018).
13. Yevick, H. G., Duclos, G., Bonnet, I. & Silberzan, P. Architecture and migration of an epithelium on a cylindrical wire. Proc. Natl.
Acad. Sci. U.S.A. 112, 5944–5949. https://doi.org/10.1073/pnas.1418857112 (2015).
14. Xi, W., Sonam, S., Beng Saw, T., Ladoux, B. & Teck Lim, C. Emergent patterns of collective cell migration under tubular confine-
ment. Nat. Commun. 8, 1517. https://doi.org/10.1038/s41467-017-01390-x (2017).
15. Werner, M. et al. Surface curvature differentially regulates stem cell migration and differentiation via altered attachment morphol-
ogy and nuclear deformation. Adv. Sci. 4, 1600347. https://doi.org/10.1002/advs.201600347 (2017).
16 Werner, M., Kurniawan, N. A., Korus, G., Bouten, C. V. C. & Petersen, A. Mesoscale substrate curvature overrules nanoscale contact
guidance to direct bone marrow stromal cell migration. J. R. Soc. Interface. https://doi.org/10.1098/rsif.2018.0162 (2018).
Scientific Reports | (2020) 10:14784 | https://doi.org/10.1038/s41598-020-70907-0 12
Vol:.(1234567890)www.nature.com/scientificreports/
17. Broaders, K. E., Cerchiari, A. E. & Gartner, Z. J. Coupling between apical tension and basal adhesion allow epithelia to collectively
sense and respond to substrate topography over long distances. Integr. Biol. Quant. Biosci Nano Macro 7, 1611–1621. https://doi.
org/10.1039/c5ib00240k (2015).
18. Cheng, D. et al. Studies of 3D directed cell migration enabled by direct laser writing of curved wave topography. Biofabrication
11, 021001. https://doi.org/10.1088/1758-5090/ab047f (2019).
19. Kim, D. H. et al. Mechanosensitivity of fibroblast cell shape and movement to anisotropic substratum topography gradients.
Biomaterials 30, 5433–5444. https://doi.org/10.1016/j.biomaterials.2009.06.042 (2009).
20. Park, J. et al. Directed migration of cancer cells guided by the graded texture of the underlying matrix. Nat. Mater. 15, 792–801.
https://doi.org/10.1038/nmat4586 (2016).
21. Lawrence, B. D., Pan, Z. & Rosenblatt, M. I. Silk film topography directs collective epithelial cell migration. PLoS ONE 7, e50190.
https://doi.org/10.1371/journal.pone.0050190 (2012).
22. Bigerelle, M., Giljean, S. & Anselme, K. Existence of a typical threshold in the response of human mesenchymal stem cells to a
peak and valley topography. Acta Biomater. 7, 3302–3311. https://doi.org/10.1016/j.actbio.2011.05.013 (2011).
23. Reffay, M. et al. Interplay of RhoA and mechanical forces in collective cell migration driven by leader cells. Nat. Cell Biol. 16,
217–223. https://doi.org/10.1038/ncb2917 (2014).
24. Reffay, M. et al. Orientation and polarity in collectively migrating cell structures: Statics and dynamics. Biophys. J. 100, 2566–2575.
https://doi.org/10.1016/j.bpj.2011.04.047 (2011).
25. Puspoki, Z., Storath, M., Sage, D. & Unser, M. Transforms and operators for directional bioimage analysis: A survey. Adv. Anat.
Embryol. Cell Biol. 219, 69–93. https://doi.org/10.1007/978-3-319-28549-8_3 (2016).
26. Lecuit, T. & Le Goff, L. Orchestrating size and shape during morphogenesis. Nature 450, 189–192. https://doi.org/10.1038/natur
e06304 (2007).
27. Dalton, B. A. et al. Modulation of epithelial tissue and cell migration by microgrooves. J. Biomed. Mater. Res. 56, 195–207 (2001).
28. Diehl, K. A., Foley, J. D., Nealey, P. F. & Murphy, C. J. Nanoscale topography modulates corneal epithelial cell migration. J. Biomed.
Mater. Res., Part A 75, 603–611. https://doi.org/10.1002/jbm.a.30467 (2005).
29. Kapoor, A., Caporali, E. H., Kenis, P. J. & Stewart, M. C. Microtopographically patterned surfaces promote the alignment of teno-
cytes and extracellular collagen. Acta Biomater. 6, 2580–2589. https://doi.org/10.1016/j.actbio.2009.12.047 (2010).
30. Haga, H., Irahara, C., Kobayashi, R., Nakagaki, T. & Kawabata, K. Collective movement of epithelial cells on a collagen gel substrate.
Biophys. J. 88, 2250–2256. https://doi.org/10.1529/biophysj.104.047654 (2005).
31 Maechler, F. A., Allier, C., Roux, A. & Tomba, C. Curvature-dependent constraints drive remodeling of epithelia. J. Cell Sci. https
://doi.org/10.1242/jcs.222372 (2019).
32. Trepat, X. et al. Physical forces during collective cell migration. Nat. Phys. 5, 426–430. https://doi.org/10.1038/nphys1269 (2009).
33. Khalil, A. A. & Friedl, P. Determinants of leader cells in collective cell migration. Integr. Biol. Quant. Biosci. Nano Macro 2, 568–574.
https://doi.org/10.1039/c0ib00052c (2010).
34. Tambe, D. T. et al. Collective cell guidance by cooperative intercellular forces. Nat. Mater. 10, 469–475. https://doi.org/10.1038/
nmat3025 (2011).
35. Harris, A. R. et al. Characterizing the mechanics of cultured cell monolayers. Proc. Natl. Acad. Sci. U.S.A. 109, 16449–16454. https
://doi.org/10.1073/pnas.1213301109 (2012).
36. Hart, K. C. et al. E-cadherin and LGN align epithelial cell divisions with tissue tension independently of cell shape. Proc. Natl.
Acad. Sci. U.S.A. 114, E5845–E5853. https://doi.org/10.1073/pnas.1701703114 (2017).
37 Ohara, P. T. & Buck, R. C. Contact guidance in vitro. A light, transmission, and scanning electron microscopic study. Exp. Cell Res.
121, 235–249 (1979).
38. Anselme, K., Wakhloo, N. T., Rougerie, P. & Pieuchot, L. Role of the nucleus as a sensor of cell environment topography. Adv.
Healthc. Mater. 7, e1701154. https://doi.org/10.1002/adhm.201701154 (2018).
39. Svitkina, T. M., Rovensky, Y. A., Bershadsky, A. D. & Vasiliev, J. M. Transverse pattern of microfilament bundles induced in epi-
theliocytes by cylindrical substrata. J. Cell Sci. 108(Pt 2), 735–745 (1995).
40. Bade, N. D., Xu, T., Kamien, R. D., Assoian, R. K. & Stebe, K. J. Gaussian curvature directs stress fiber orientation and cell migra-
tion. Biophys. J. 114, 1467–1476. https://doi.org/10.1016/j.bpj.2018.01.039 (2018).
41. Biton, Y. Y. & Safran, S. A. The cellular response to curvature-induced stress. Phys. Biol. 6, 046010. https://doi.org/10.1088/1478-
3975/6/4/046010 (2009).
42. Sun, B., Xie, K., Chen, T.-H. & Lam, R. H. W. Preferred cell alignment along concave microgrooves. RSC Adv. 7, 6788–6794. https
://doi.org/10.1039/c6ra26545f (2017).
43. Wolf, K. et al. Collagen-based cell migration models in vitro and in vivo. Semin. Cell Dev. Biol. 20, 931–941. https://doi.
org/10.1016/j.semcdb.2009.08.005 (2009).
44. Messal, H. A. et al. Tissue curvature and apicobasal mechanical tension imbalance instruct cancer morphogenesis. Nature 566,
126–130. https://doi.org/10.1038/s41586-019-0891-2 (2019).
45. Baniukiewicz, P., Collier, S. & Bretschneider, T. QuimP: analyzing transmembrane signalling in highly deformable cells. Bioinfor-
matics 34, 2695–2697. https://doi.org/10.1093/bioinformatics/bty169 (2018).
Acknowledgements
The authors wish to thank Fernando Pereira de Almeida from CENABIO of the UFRJ (Brasil) and the confocal
microscopy platform of IS2M (Université de Haute-Alsace, France) for their critical technical assistance. The
authors thanks Pauline Provini for her critical reading. This work was supported by the PVE fellowship program
#406407/2013-4 to K.A. from CNPq Brazil, the PDJ fellowship #150145/2015-2 from CNPq to P.R., the PDJ
Nota 10 fellowship #E-26/202.820/2016 from FAPERJ Brazil to P.R., the Programa de Excelencia Academica
#PROEX-0487 from CAPES (Brazil) to R.S.S., the program PICS “Biointerfaces” #272116 from CNRS France to
K.A. and the grant # ANR-12-BSV5-0010-02 from ANR, France to K.A.
Author contributions
P.R. designed the experiments, M.B., K.A., P.-F.C. designed the surfaces, P.-F.C. fabricated the surfaces, J.M.,
M.B. characterized the surfaces, P.R., R.S.S. and L.P. performed the experiments, P.R., L.P, K.A., M.F. analyzed
the data, P.R. wrote the manuscript with critical readings from all the coauthors.
Competing interests
The authors declare no competing interests.
Additional information
Supplementary information is available for this paper at https://doi.org/10.1038/s41598-020-70907-0.
Scientific Reports | (2020) 10:14784 | https://doi.org/10.1038/s41598-020-70907-0 13
Vol.:(0123456789)You can also read