Neuropsychologia - Boston University
←
→
Page content transcription
If your browser does not render page correctly, please read the page content below
Neuropsychologia 158 (2021) 107893
Contents lists available at ScienceDirect
Neuropsychologia
journal homepage: www.elsevier.com/locate/neuropsychologia
Representation of semantic typicality in brain activation in healthy adults
and individuals with aphasia: A multi-voxel pattern analysis
Ran Li *, Tyler K. Perrachione, Jason A. Tourville, Swathi Kiran
Department of Speech, Language & Hearing Sciences, Boston University, Boston, MA, USA
A R T I C L E I N F O A B S T R A C T
Keywords: This study aimed to investigate brain regions that show different activation patterns between semantically
Aphasia typical and atypical items in both healthy adults and individuals with aphasia (PWA). Eighteen neurologically
Semantic processing healthy adults and twenty-one PWA participated in an fMRI semantic feature verification task that included
Typicality
typical and atypical stimuli from five different semantic categories. A whole-brain searchlight multi-voxel
fMRI
Multi-voxel pattern analysis
pattern analysis (MVPA) was conducted to classify brain activation patterns between typical and atypical con
ditions in each participant group separately. Behavioral responses were faster and more accurate for typical vs.
atypical items across both groups. The searchlight MVPA identified two significant clusters in healthy adults: left
middle occipital gyrus and right calcarine cortex, but no significant clusters were found in PWA. A follow-up
analysis in PWA revealed a significant association between neural classification of semantic typicality in the
left middle occipital gyrus and reaction times in the fMRI task. When the typicality effect was examined for each
semantic category at the univariate level, significance was identified in the visual cortex for fruits in both groups
of participants. These findings suggest that semantic typicality was modulated in the visual cortex in healthy
individuals, but to a lesser extent in the same region in PWA.
1. Introduction and PWA.
The neural representation of conceptual and semantic knowledge in
the human cortex has been widely studied in both healthy adults and 1.1. Behavioral correlates of semantic typicality
persons with aphasia (PWA). Category representation is thought to be
determined by the internal structure of object categories, including It is well known that category structure and representation are
among other factors, semantic typicality. Psycholinguistic evidence in determined by several factors such as frequency, familiarity, animacy
both healthy individuals and PWA suggests differential responses for etc. (Boster, 1988; Malt and Smith, 1982). Of these, exemplar typicality
typical and atypical exemplars. However, the neural mechanisms for the is another organizing principle of the internal structure of semantic
typicality effect have not been well established. Distinct neural patterns categories. Previous psycholinguistic studies in healthy adults have
of representation for typical versus atypical exemplars that follow the examined the typicality effect using a variety of experimental para
behavioral differences would further our understanding of how cate digms, such as category membership verification (Hampton, 1979;
gories and their specific examples are represented in the brain. The Larochelle and Pineau, 1994), ratings of typicality of items in a category
present study examined brain regions that show neural encoding of se (Rosch, 1975; Rosch and Mervis, 1975), the order in which category
mantic typicality in both healthy adults and PWA using a multi-voxel items are learned (Rosch and Mervis, 1975), and category naming fre
pattern analysis (MVPA), which allowed for the detection of brain quency (Hampton, 1995). These studies have all identified a robust
activation patterns across multiple voxels relative to traditional fMRI typicality effect, as evidenced by shorter reaction times, faster learning,
approaches that measure only magnitude of activation (Kriegeskorte and/or more accurate responses for typical than atypical items.
et al., 2006). The rest of the introduction discusses the current evidence Different theoretical accounts have been proposed to explain the
of behavioral and neural responses to typicality in healthy individuals typicality effect. According to the prototype, or family resemblance hy
pothesis models (Rosch and Mervis, 1975), categories are represented by
* Corresponding author. Department of Speech, Language & Hearing Sciences, 635 Commonwealth Ave, Boston University, Boston, MA, 02215, USA.
E-mail address: rli92@bu.edu (R. Li).
https://doi.org/10.1016/j.neuropsychologia.2021.107893
Received 24 September 2020; Received in revised form 31 March 2021; Accepted 13 May 2021
Available online 19 May 2021
0028-3932/Published by Elsevier Ltd.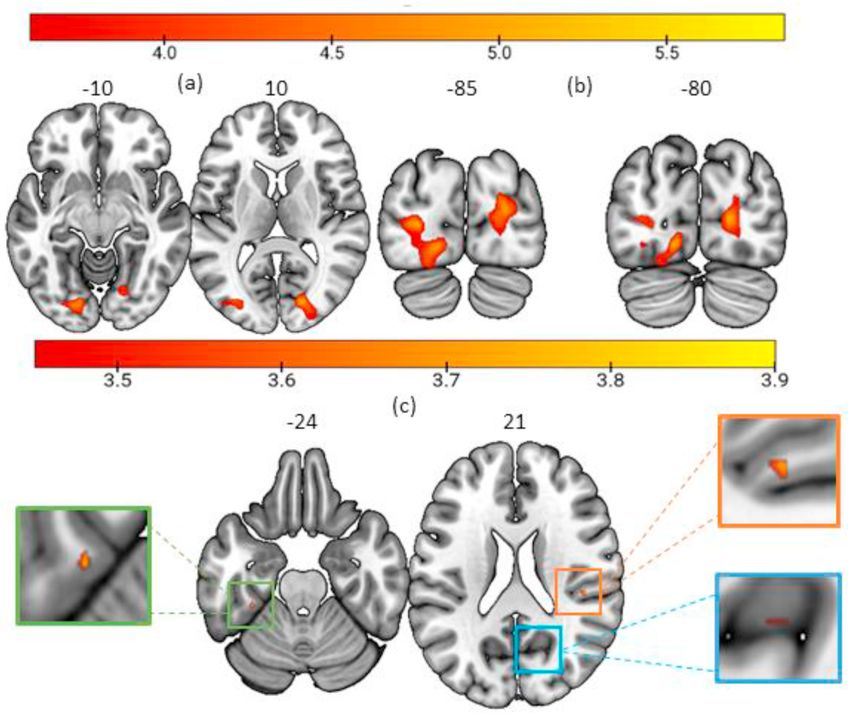
R. Li et al. Neuropsychologia 158 (2021) 107893
a set of features that may carry more or less weight in the prototype (e.g., stems from damage to the control system that shapes the flow of acti
birds: robin), which is the summary description of all category members vation through the hub-and-spokes network, leading to noisy processing
based on features. This theory postulates that typicality is determined by within the semantic network as the balance of activation and inhibition
the extent to which features are shared between the prototype and is disrupted. Thus, since typical items are more similar to other category
category members. Typical members of a category are more similar to members than atypical items, a larger degree of semantic control is
the prototype as they share more semantic features with the prototype, required to resolve the semantic competition elicited by the typical
whereas atypical members are less similar to the prototype as they share items, resulting in reduced typicality effect in individuals with SA.
fewer features with the prototype. The semantic complexity hierarchy
further suggests that atypical items have a more complex representation, 1.2. Neural correlates of semantic typicality
as they carry a wider range of semantic features including core (e.g.,
birds: has wings), distinctive (e.g., runs, long legs), and prototypical (e.g., Even though the behavioral typicality effects are fairly robust in
flies) features, whereas typical items are easier to access because they healthy individuals and to a certain extent in PWA, whether these dif
comprise only core and prototypical features (Kiran, 2007). ferences in category exemplar representation are instantiated in the
An alternative perspective of typicality is the exemplar theory, which brain is not completely clear. Two neuroimaging studies to date have
assumes that the summary description of the category (i.e., prototype) is utilized fMRI to examine the neural representation of typicality in
not needed. In this account, categories are represented in memory by healthy individuals. One study compared neural response patterns of the
actual exemplars that have previously been encountered and are labeled most and least typical items in each category to the category central
with their category name (Nosofsky and Palmeri, 1997; Nosofsky and tendency (i.e., the average neural patterns of all exemplars in a cate
Zaki, 2002). With continued learning experience, memories for these gory) in healthy young adults (Iordan et al., 2016). Participants were
exemplars are eventually formed and used for categorization or recog exposed to picture stimuli of different semantic categories and were
nition of stimuli (Nosofsky and Zaki, 2002; Rouder and Ratcliff, 2006). asked to perform an fMRI one-back repetition task. A region of interest
According to this exemplar-based model, typicality is conceptualized as (ROI) MVPA showed that neural response patterns to typical exemplars
the summed similarity of a category member to all the stored members were more similar to the central category tendency than less typical
of that category (Nosofsky, 1988). Hence, typical items are accessed exemplars in the lateral occipital complex (LOC), suggesting that the
faster and more accurately as they are more similar to the stored ex LOC plays an important role in the processing of typicality. Another
emplars, whereas atypical items are accessed slower and less accurately fMRI study investigated the neural representation of typicality via the
because they are less similar to the stored exemplars (Nosofsky, 1988). implementation of an artificial categorization task (Davis and Poldrack,
The same behavioral typicality effect has even been reported in PWA 2014). The results showed that neural typicality, that is, similarity of
(Kiran et al., 2007; Kiran and Thompson, 2003; Sandberg et al., 2012). brain activation patterns between category members and the central
For example, one study examined the effect of typicality on online tendency, was significantly correlated with participants’ perceptions of
category verification of inanimate categories in normal young, normal typicality in early visual regions and regions of the right temporal
older, and aphasic patients with and without semantic impairment fusiform and medial temporal lobes. These results suggest that the
(Kiran et al., 2007). Participants were asked to decide if the target word processing of typical and atypical exemplars may engage visual and
that was either a typical, atypical, or nonmember of a category belonged temporal regions in healthy individuals. Specifically, visual regions are
to the preceding category label. Results showed that even though PWA likely associated with processing the attributes and semantics of cate
performed worse on the task than healthy individuals, their responses to gory members (Martin et al., 1996; Tyler et al., 2003), and the temporal
typical items were faster and more accurate than atypical items, a lobe is involved in semantic processing that integrates visual informa
pattern similar to healthy controls. tion for conceptual retrieval (Binder et al., 2009).
In contrast, the typicality effect was not found in other studies In general, the findings from these two studies are consistent with
including PWA (Rogers et al., 2015; Sandberg et al., 2012). For example, neural models of semantic processing, including the left-lateralized
Sandberg et al. (2012) examined the effect of semantic typicality in network of frontal, parietal, temporal and prefrontal regions that is
healthy controls and PWA for categories that varied in terms of category involved in a high level of integration in receiving, storing, and pro
boundaries and gradedness using the online category verification cessing semantics (Binder et al., 2009, 2011). The activations identified
paradigm. The results showed a consistent typicality effect in healthy in the temporal and/or temporo-occipital regions suggest that typicality
controls across tasks, but a reduced effect in some PWA specific to the may involve both visual and semantic processing. More specifically,
severity of semantic impairment. Rogers et al. (2015) further examined these results also align with the distributed model of category repre
the effect of typicality on a variety of language tasks in patients with sentation (Tyler et al., 2000), which has primarily focused on explaining
semantic dementia (SD; bilateral anterior temporal lobe/ATL atrophy) category specific impairments after brain damage (i.e., disproportionate
whose semantic representations are distorted, and patients with se difficulty with specific categories; Hillis and Caramazza, 1991; Gainotti,
mantic aphasia (SA; left fronto-parietal and/or posterior temporal 2000). This model suggests that object concepts vary in the number and
stroke) whose semantic control may be affected. In the SA group, typi types of attributes, the degree to which these attributes are shared or
cality effect was identified in two tasks: 1) picture sorting, in which distinctive, and the strength of the relationships between these attri
accuracy was higher for sorting typical than atypical items into specific butes. Therefore, concepts with shared features may be more resistant to
categories, and 2) word-picture matching, in which accuracy was lower brain damage as these features are intercorrelated and reinforce each
for typical items when picture distractors were close, and accuracy was other with mutual activation (Tyler and Moss, 1998; Tyler et al., 2003).
lower for atypical items when distractors were distal. However, the This model also posits that categories are represented through a
typicality effect was not significant in the picture naming task. The au distributed but partially overlapping network involving the frontal,
thors explained these findings within the context of the controlled se temporal, parietal, and occipital lobes. Hence, activations in the tem
mantic cognition (CSC) model, which provides a joint account of poral and visual regions for typicality processing suggest that categories
semantic representation and control (Lambon Ralph et al., 2016). The are represented by the internal structure in these brain regions.
CSC model suggests that semantic representations are mediated by a To our knowledge there are no neuroimaging studies examining the
single hub situated in the bilateral ATLs (Patterson et al., 2007), and a effects of typicality in PWA. As mentioned earlier, the behavioral typi
fronto-temporoparietal control system in the posterior middle temporal cality effect in PWA was identified in some studies but not all. Since
gyrus (pMTG), the prefrontal cortex (PFC), and the intraparietal sulcus semantic aphasia is often associated with damage to the left prefrontal
(IPS), that is involved to manipulate activation in the network for se and/or temporo-parietal regions, we would expect that damage to the
mantic representations. In individuals with SA, the semantic impairment traditional language network would affect the processing of typicality in
2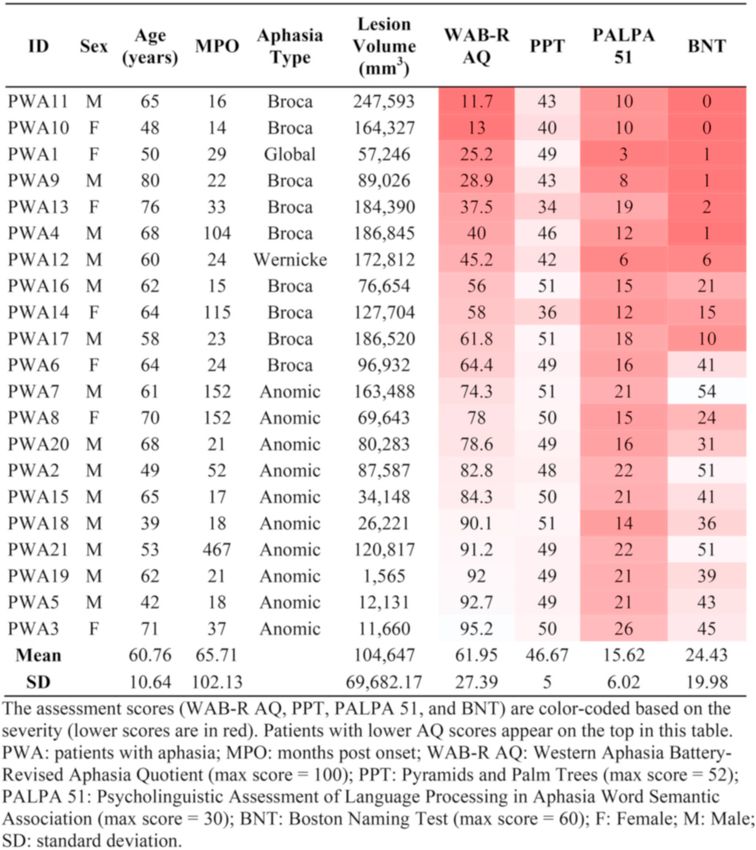
R. Li et al. Neuropsychologia 158 (2021) 107893
PWA due to impaired semantic representations. If the neural correlates 2. Methods
of typicality are located in visual regions (Davis and Poldrack, 2014;
Iordan et al., 2016), then the typicality effect in PWA would be identi 2.1. Subjects
fied in the same regions as long as they are spared from damage. If
typicality involves semantic processing in temporal regions, the typi This study was conducted on a retrospective dataset that initially
cality effect would also be identified in these regions of PWA. These included N = 35 individuals with chronic aphasia (10 female, 25 male;
predictions can be potentially resolved by examining differential pat mean age = 61.54 ± 10.97 years, mean time post onset = 60.43 ± 85.37
terns of activation associated with behavioral differences between months) due to a single left hemisphere stroke, and N = 21 neurologi
typical and atypical examples in PWA who present with damage to the cally healthy individuals (11 female, 10 male; mean age = 59.61 ±
fronto-temporal network, thereby providing insights into how semantic 13.13 years) who completed scanning for the Center for the Neurobiology
categories and the internal structure are represented in the damaged of Language Recovery (CNLR) conducted at Boston University. Of the
brain. initial sample, three healthy individuals and one patient were excluded
due to poor fMRI data acquisition. In addition, 13 patients (3 female, 10
1.3. The current study male) with lesions extending to the visual cortex were excluded as we
attempted to examine activation patterns consistent with healthy adults
The overarching goal of the current study was to examine the pro (Iordan et al., 2016). An attempt to exclude patients based on temporal
cessing of typical and atypical exemplars in both healthy individuals and lobe damage failed because all 35 patients had lesion damage in the
PWA, in order to understand how semantic typicality is organized in temporal cortex, as shown in the lesion overlay (Fig. 1). This process
both healthy and damaged brains through the following research resulted in a final sample including N = 18 healthy individuals (8 fe
questions: male, 10 male; mean age = 59.86 ± 10.50 years) and N = 21 PWA
Question 1: Which brain regions show distinguishable neural (Table 1; 7 female, 14 male; mean age = 60.71 ± 10.65 years, mean time
response patterns associated with behavioral responses between typical post onset = 65.43 ± 102.25 months). Exclusion criteria included other
and atypical items in healthy adults? psychiatric or neurological disorders other than stroke, and in
Hypotheses 1: According to previous behavioral studies (Rosch et al., compatibility with MRI. All participants but three PWA were
1976; Hampton, 1995), healthy individuals would show a significant right-handed. All participants exhibited normal or corrected-to-normal
typicality effect. Specifically, behavioral responses to typical exemplars visual and hearing, and reported English as their primary language.
would be faster and more accurate than atypical exemplars. According Written informed consent was obtained in accordance with the Boston
to previous fMRI studies in healthy individuals (Davis and Poldrack, University Institutional Review Board (IRB) protocol.
2014; Iordan et al., 2016), we expected to identify a typicality effect in
visual and temporal regions. 2.2. Standardized language assessments
Question 2: Which brain regions show distinguishable neural
response patterns associated with behavioral responses between typical Prior to scanning, PWA completed standardized assessments to
and atypical items in PWA? examine their linguistic and cognitive abilities (Table 1). Tests admin
Hypothesis 2: According to previous behavioral studies examining istered included the Western Aphasia Battery-Revised (WAB-R; Kertesz,
semantic typicality in PWA (Kiran and Thompson, 2003; Kiran et al., 2007) to measure overall aphasia severity (range: 11.7–95.2); the Bos
2007; Rogers et al., 2015), responses in patients would be slower and ton Naming Test (BNT; Kaplan et al., 2001) to measure naming abilities
less accurate than in healthy adults, but the behavioral typicality effect (range: 0–54); the Pyramids and Palm Trees (PPT; Howard and Patter
would exist, i.e., responses to typical items would be faster and more son, 1992) to examine nonverbal semantic association abilities (range:
accurate than atypical items. Our primary prediction was the neural 34–51), and subtest 51: Word Semantic Association from the Psycho
activation patterns consistent with a behavioral typicality effect would linguistic Assessment of Language Processing in Aphasia (PALPA; Kay
most likely be identified in visual regions (Iordan et al., 2016) if they et al., 1996) to assess lexical-semantic association skills (range: 3–26).
were spared from damage. Secondly, if the processing of typical and Most patients had semantic impairment according to Table 1 and per
atypical exemplars involved semantic representations, the temporal formance varied by overall aphasia severity.
cortex may also be identified through the MVPA. However, since the
patients with aphasia were likely to present with varying degrees of 2.3. Stimuli
damage to the temporal lobe, this prediction was dampened due a
possible lack of power in detecting change. Stimuli included color photographs of real items from three natural
In this study, a pattern-based MVPA was conducted to address these semantic categories (birds, vegetables, fruits) and two man-made cate
research questions. MVPA is one way of detecting neural correlates of gories (furniture, clothing). Pictures corresponded to concrete nouns that
typicality in fMRI data. It allows for the capture of neural information were balanced for familiarity, length, lexical frequency (CELEX; Van der
across multiple voxels relative to the traditional fMRI univariate anal Wouden, 1990) and concreteness (Coltheart, 1981). The stimuli were
ysis, which does not consider the spatial distribution of information derived from a previous experimental task that collected semantic
(Mahmoudi et al., 2012). Further, a whole-brain searchlight MVPA is typicality ratings of multiple items from nearly 500 individuals (not
commonly used to analyze human fMRI data (Kriegeskorte et al., 2006) enrolled in the present study) using MTurk (Meier et al., 2016). That task
when there are extremely high dimensional brain voxels and a small asked participants to either rate each item using a 1–5 scale (1 = most
number of samples as in the present study, which is likely to cause the typical, 5 = most atypical) or define as a non-category member. A list
“curse-of-dimensionality” problem. This approach has additional bene was created with only the items receiving ratings from at least 20 in
fits in that it does not require a priori region specification, and it does not dividuals and their typicality values reflected the average rating across
cause computational difficulties when there are more voxels than ex participants tested on those items. Items were organized from most to
amples (Etzel et al., 2013). For all of these reasons, a whole-brain least typical and 18 items from the top and 18 from the bottom of the list
searchlight MVPA approach was applied to the data in this study to were selected as typical and atypical exemplars for each semantic
examine neural correlates of semantic typicality. category as stimuli (see Table 2 for the average typicality rating by
category, and Appendix A for a sample of task stimuli). Two-sample
t-tests showed significant difference between typical and atypical con
ditions across all items (p < 0.05) as well as within each category (ps <
0.05). An additional set of 36 items consisting of pixelated scrambled
3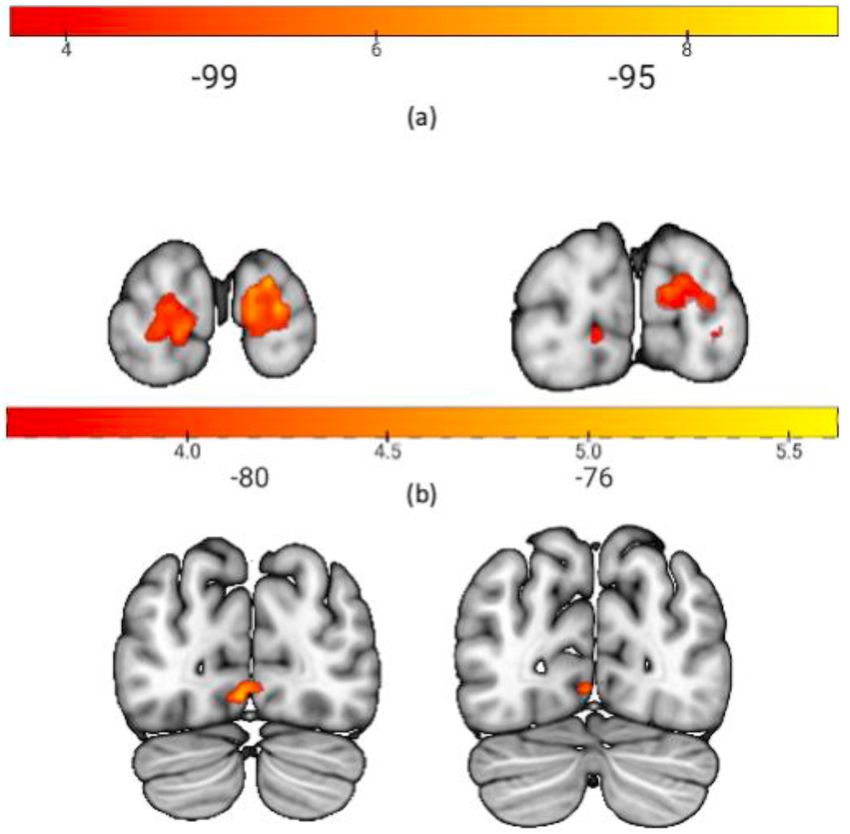
R. Li et al. Neuropsychologia 158 (2021) 107893
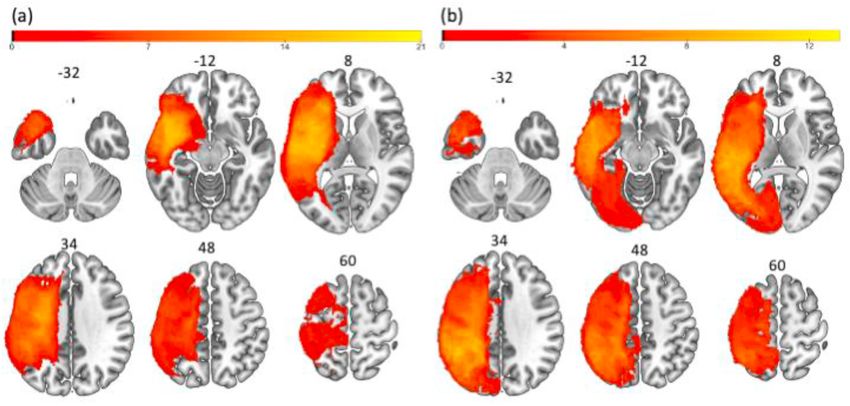
Fig. 1. Overlay of lesion masks. (a): lesion overlay across PWA included (n = 21) in the current study; (b): lesion overlay across PWA excluded (n = 13) from this
study. Color bar indicates the number of patients with overlapping lesion. Images are displayed in neurological convention (left on left). (For interpretation of the
references to color in this figure legend, the reader is referred to the Web version of this article.)
semantic feature applied to a specific item by providing a “Yes” or “No”
Table 1
response. Defining type (features shared by more than 80% of the items
Patient demographics and standardized assessment data.
in the category), characteristic type (features shared by less than 80% of
the items within the category), unrelated features (features that applied
to some category members but not the target item), and non-category
features (features that do not apply to any category members) were
assigned as applicable or not applicable to target items based on
response average. In the current fMRI task, semantic features were
controlled for type of information conveyed such as number of physical,
functional, and contextual features, as well as whether they were
defining or characteristic of the category (see Appendix B for a sample of
semantic features).
2.4. fMRI task
During the fMRI task, each participant was assigned three categories
of stimuli, including fruits plus two other categories that were pseudo-
randomly counterbalanced across participants.1 Experimental and con
trol trials were randomized and presented across two separate runs.
Each run consisted of 27 typical and 27 atypical trials across three cat
egories (i.e., 9 trials per typicality per category) and 18 control trials per
run. During fMRI scanning, participants performed a semantic feature
verification task on the stimuli. The task employed an event-related
design with randomized inter-stimulus intervals (ISIs) between 2 and
4 s (Bandettini and Cox, 2000) and was implemented using E-Prime 2.0
(Schneider et al., 2002). Each experimental trial presented a picture
together with a written semantic feature below for 5 s (Fig. 2). Next, a
fixation cross appeared on the screen during the 2–4 s ISI, and partici
pants were instructed to answer “Yes” or “No” to whether the presented
semantic feature applied to the picture by button press. On control trials,
participants were presented with a scrambled picture and were required
to determine color judgement (i.e., black and white, color) using the same
pictures of the experimental stimuli served as control items.
Semantic features were also validated using a previous MTurk study
(Sandberg et al., 2020) and were used to derive stimuli in the current 1
Fruits were assigned to all participants as it was used as the monitored items
fMRI task. The MTurk participants (not enrolled in the present study) for a subsequent language treatment for PWA. Details of the treatment can be
were shown exemplar pictures and were asked to indicate whether a found in Gilmore et al. (2020).
4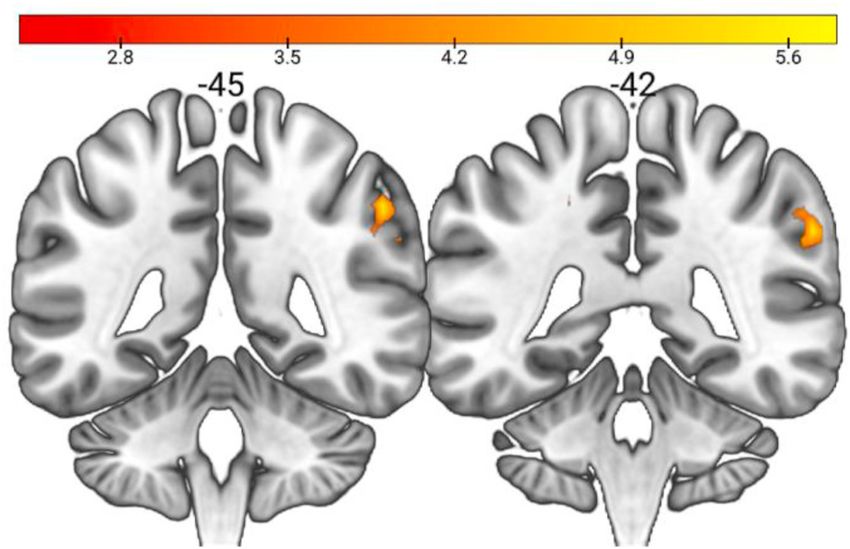
R. Li et al. Neuropsychologia 158 (2021) 107893
Table 2
Average typicality ratings by category used in the fMRI semantic verification task.
Birds Vegetables Clothing Furniture Fruits
All items Mean ± SD 2.16 ± 0.69 2.52 ± 1.04 2.60 ± 1.08 3.44 ± 1.70 2.54 ± 0.98
Range 1.12–3.71 1.00–4.76 1.06–4.95 1.00–5.93 1.00–4.14
Typical items Mean ± SD 1.59 ± 0.32 1.63 ± 0.35 1.66 ± 0.46 1.97 ± 0.95 1.65 ± 0.44
Range 1.12–2.06 1.00–2.24 1.06–2.47 1.00–3.60 1.00–2.34
Atypical items Mean ± SD 2.73 ± 0.44 3.41 ± 0.66 3.53 ± 0.60 4.91 ± 0.70 3.42 ± 0.35
Range 2.12–3.71 2.45–4.76 2.68–4.95 3.73–5.93 2.83–4.14
Note: items with ratings closer to 1 were considered more typical exemplars of the semantic category whereas items with ratings closer to 5 were considered more
atypical exemplars of the category.
Specifically, binarized lesion masks (in which lesioned voxels were
deleted) for all PWA were manually drawn based on T1 images in
MRIcron (Rorden and Brett, 2000). Binarized lesion masks and lesion
maps (in which lesioned voxels were preserved) were included during
preprocessing to improve coregistration and normalization (Brett et al.,
2001). Normalized structural and functional data were visually
compared to the template using the Check Reg function for SPM12, and
images that were insufficiently aligned were manually corrected. The
Artifact Detection Toolbox (ART) for SPM12 (Ashburner et al., 2014)
was used to detect noise due to movement-related artifacts based on a
linear motion threshold of 2 mm, rotational motion threshold of 0.5
radians, or global signal deviation of more than three standard de
viations from the mean image intensity.
2.7. Data analysis
Fig. 2. Semantic feature verification task. Each trial was presented on the 2.7.1. Lesion volume and percent of spared tissue
screen for 5 s, followed by a fixation cross for 2–4 s before the next trial The anatomical ROIs were extracted from the AAL Atlas using the
appeared. Participants were asked to press the button to indicate whether the
MarsBAR toolbox for SPM (Brett et al., 2002). Total lesion volume and
semantic feature (at the bottom of each trial) applied to each picture.
the percentage of spared tissue in each anatomical ROI were calculated
based on patients’ normalized lesion maps. Specifically, any overlap
procedure. Reaction times and response accuracy were recorded for data between each patient’s lesion map and the atlas-based left hemisphere
analyses. ROIs was deleted, which created a set of ROIs comprising only spared
tissue for each patient. The percentage of spared tissue in each ROI was
2.5. fMRI data acquisition then calculated using the volume of each of the spared tissue ROIs,
divided by the total volume of the region from the AAL atlas, and
Participants were scanned at the Athinoula A. Martinos Center for multiplied by 100 (Sims et al., 2016). In PWA, the visual regions were
Biomedical Imaging in Charlestown, MA on a 3T Siemens Trio Tim using spared as indicated by the percentage of spared tissues in the middle
a 20-channel head + neck coil. T1 images were acquired with TR = occipital gyrus (MOG; mean = 99.74 ± 0.57%), calcarine cortex (99.96
2300 ms, TE = 2.91 ms, 176 sagittal slices, 1 × 1 × 1 mm voxels, 256 × ± 0.19%), inferior occipital gyrus (IOG; mean = 100 ± 0%), and supe
256 matrix, FOV = 256 mm, flip angle = 9◦ , fold-over direction = AP. rior occipital gyrus (SOG; mean = 99.93 ± 0.25%).
Functional images were acquired via a gradient echo T2*-weighted EPI
sequence, with TR = 2570 ms, TE = 30 ms, 40 axial slices, 3 mm slices 2.7.2. Behavioral analysis
interleaved with 2 × 2 × 3 mm voxels, 80 × 78 matrix, FOV = 220 × In order to examine participants’ behavioral performance in the fMRI
220 mm, 40 axial, flip angle = 90◦ , parallel imaging with acceleration semantic feature verification task, mixed-effects models were performed
factor of 2. using the lmerTest package (Kuznetsova et al., 2017) in R Studio Version
3.6.3 (Rstudio Team, 2016). Data were missing from run 2 of PWA19
2.6. fMRI preprocessing and both runs of PWA18 and PWA20 due to technical issues of
recording. Hence, these data were excluded from the behavioral analysis
For both groups, the MRI images were preprocessed following a as these 0s could bias group comparisons and undermine mixed-effects
standard pipeline in SPM12 (Ashburner et al., 2014), including slice models in PWA.
timing with reference to the middle slice to account for differences in the A generalized linear mixed-effects model for binomial data was
timing of slice acquisition and realignment to correct for motion during conducted to determine the effect of semantic typicality on response
scanning. Functional images were coregistered with the T1 structural accuracy (0 = inaccurate, 1 = accurate), and a linear mixed-effects
scan, which was segmented into grey matter, white matter and cere model was conducted to determine the effect of semantic typicality on
brospinal fluid based on the tissue probability maps in SPM12. accurate reaction times. In both models, the fixed factors included se
Normalization of structural and functional images to Montreal Neuro mantic typicality (typical, atypical), group (healthy adults, PWA), and
logical Institute (MNI) space was then performed using 4th-degree the typicality-by-group interaction term. Semantic category (fruits, veg
b-spline interpolation. Finally, functional data were spatially etables, clothing, birds, furniture) was entered as a covariate. Random
smoothed using a 4-mm FWHM smoothing kernel for the purpose of structure included a random intercept for subjects and a random slope
univariate analysis (Meinzer et al., 2013). Another set of normalized but for typicality. In order to estimate the fixed effects, sum-to-zero contrasts
unsmoothed functional images was prepared for performing the were coded for fixed factors (i.e., typicality, group, category), so that the
searchlight MVPA (Kamitani and Sawahata, 2010). mean of the dependent variable for a given level was compared to the
A few additional steps were incorporated for patient data. overall mean of the dependent variable (i.e., main effect). Statistical
5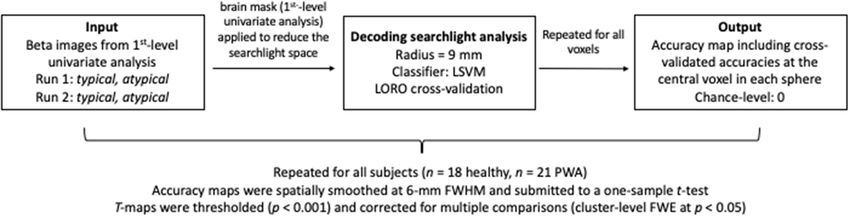
R. Li et al. Neuropsychologia 158 (2021) 107893
significance was set at p < 0.05. the brain, yielding an accuracy map for each individual that included
cross-validated accuracies ranging from − 50 to 50 (0 represents the
2.7.3. Univariate fMRI analysis chance-level).
For the first-level univariate analysis, the normalized and smoothed The above individual searchlight analysis was then repeated in each
functional images for each individual were passed to a generalized linear individual for a group analysis. The resulting classification accuracy
modeling (GLM), which was used to obtain beta images associated with maps for all participants were first spatially smoothed (post-processed)
each condition (typical, atypical), and to test whether the results were at 6 mm FWHM in SPM12 (Ashburner et al., 2014). Then, these
similar or different from the searchlight analysis. Stimulus onsets and smoothed accuracy maps were subjected to a 2nd-level mixed-effects
durations were convolved with the canonical hemodynamic response analysis for each group separately using a one-sample t-test in SPM12.
function (HRF) and its temporal derivative (Johnson et al., 2019). The resulting t-maps indicated statistical significance of the group-level
Conditions included typical, atypical, and scrambled pictures. Each con classification accuracy in each voxel against zero (chance-level). These
dition was modeled separately for each run and both runs were t-maps were thresholded voxelwise at p < 0.001 (uncorrected) and
concatenated within the GLM. Motion correction parameters that were corrected for multiple comparisons using a cluster-level FWE correction
obtained from realignment were included. Additionally, a grey matter at p < 0.05.
mask was applied in the model to exclude the
blood-oxygen-level-dependent (BOLD) signals in other anatomical seg 3. Results
mentations such as white matter and cerebrospinal fluid (CSF). The
main contrasts of interest were typical > atypical and atypical > typical. 3.1. Behavioral results on the fMRI task
A contrast image from the 1st-level analysis was then submitted to a
2nd-level univariate analysis (one-sample t-test) to examine differences Fig. 4 displays the mean response accuracy and reaction times for
of brain activation between typical and atypical conditions for each typical and atypical conditions across subjects in each group.
group of participants. The resulted t-maps were thresholded voxelwise at Results from the logistic mixed-effects model predicting response
p < 0.001 (uncorrected) and then corrected for multiple comparisons accuracy captured a significant main effect of typicality (β = − 0.12, |z|
using a cluster-level familywise error rate (FWE) correction at p < 0.05. = 2.47, SE = 0.05, p < 0.05), but no main effect of group (p = 0.10) or a
Uncorrected results were reported if no clusters of voxels showed sig group-by-typicality interaction effect (p = 0.22). This finding suggests
nificance after correction. that responses to atypical items were significantly less accurate than
typical items across groups, but this typicality effect did not differ
2.7.4. Searchlight MVPA significantly between healthy adults (typical: 80.86 ± 27.89%; atypical:
In order to investigate which brain regions were sensitive to neural 77.37 ± 25.14%) and PWA (typical: 68.81 ± 19.90%; atypical: 68.03 ±
encoding of semantic typicality, a whole-brain searchlight analysis was 17.76%). There was, in addition, a main effect of category (fruits: β =
performed (Kriegeskorte et al., 2006) using The Decoding Toolbox (TDT; − 0.70, |z| = 9.81, SE = 0.07, p < 0.01; furniture: β = 0.59, |z| = 4.37, SE
Hebart et al., 2015) on the normalized but unsmoothed images in each = 0.14, p < 0.01), indicating that responses to fruits were less accurate
group separately. TDT offers an interface with Statistical Parametric than the grand mean (i.e., average across groups or typicality condi
Mapping (SPM; http://www.fil.ion.ucl.ac.uk/spm/) in MATLAB tions) and responses to furniture were more accurate than the grand
(MathWorks, Inc., 2015). Beta values from the 1st-level univariate mean. Post-hoc pairwise comparisons (tukey method) were performed
analysis were fed into the MVPA (Haynes et al., 2007; Mumford et al., using the emmeans package in R Studio Version 3.6.3. Findings showed
2012; Schrouff et al., 2013). Steps for performing the searchlight anal that responses to fruits were less accurate than birds (p < 0.01), clothing
ysis are demonstrated in Fig. 3. (p < 0.01), furniture (p < 0.01), and vegetables (p < 0.01), whereas re
In the individual searchlight analysis, beta images for each condition sponses to furniture were more accurate than clothing (p < 0.05) and
(typical, atypical) in each run were first extracted from the 1st-level vegetables (p < 0.05).
univariate analysis. A brain mask that was created during model esti The linear mixed-effects model for predicting accurate reaction times
mation in the 1st-level univariate analysis was automatically used to revealed a significant main effect of semantic typicality (β = 36.29, |t| =
reduce the searchlight space to voxels inside the brain. Next, a decoding 3.25, SE = 11.18, p < 0.01), but no significant main effect of group (p =
searchlight analysis between the conditions typical and atypical was 0.97) or a group-by-typicality interaction effect (p = 0.15). This finding
executed with a 9 mm radius, using a binary linear support vector ma indicates that responses to atypical items were significantly slower than
chine (LSVM; Cortes and Vapnik, 1995) as a classifier (LIBSVM package typical items across groups, but the typicality effect did not differ
in MATLAB; Chang and Lin, 2011) with a leave-one-run-out (LORO) significantly between healthy adults (typical: 1680 ± 243 ms; atypical:
cross-validation approach. That is, an LSVM classifier was trained with 1743 ± 212 ms) and PWA (typical: 1672 ± 517 ms; atypical: 1707 ± 521
the data from one run used as the training set, and its performance was ms). Results also showed a significant main effect of category (fruits: β =
assessed on the data from the other run used as the testing set. The mean 132.93, |t| = 6.84, SE = 19.44, p < 0.01), indicating that responses to
cross-validated accuracy was then stored at the central voxel in each fruits were slower than the grand mean. Post-hoc pairwise comparisons
searchlight sphere. This whole procedure was repeated for all voxels in revealed that responses to fruits were slower than birds (p < 0.01),
Fig. 3. Steps for performing the searchlight analysis. Upper section: three key components for performing the individual searchlight analysis. Lower section: group-
level analysis.
6
R. Li et al. Neuropsychologia 158 (2021) 107893
Fig. 4. Task performance in healthy individuals and PWA. Boxplots demonstrating the mean response accuracy in rates (a; 1.0 = 100%) and reaction times for
accurate trials in milliseconds (b) across participants by condition in each group. Error bars: mean ± standard deviation.
clothing (p < 0.01), furniture (p < 0.01), and vegetables (p < 0.01). behavioral data in the fMRI task. P-values were then adjusted for mul
tiple comparisons using the Benjamini-Hochberg procedure (FDR <
3.2. Searchlight MVPA 0.05). A significant positive association was found between the mean
RTs across all typical and atypical trials and neural classification in the
Table 3 and Fig. 5 exhibit results of the group-level searchlight LMOG (ρ = 0.57, p = 0.01; Fig. 6). This correlation remained significant
analysis in healthy adults and PWA. In the healthy group, significant after p-values were adjusted (p = 0.04).
above-chance searchlight classification between typical and atypical
items was found in two clusters: left middle occipital gyrus (LMOG) 3.4. Univariate fMRI analysis
extending into the left lingual gyrus, and right calcarine cortex
extending into the right superior occipital gyrus (RSOG). In the patient Results in healthy adults showed a significant cluster of voxels in the
group, no clusters of voxels showed significance after correction for right supramarginal gyrus (RSMG; t = 5.71, k = 34, MNI: x = 60, y =
multiple comparisons. At the uncorrected level (voxelwise at p < 0.001), − 42, z = 33) for typical > atypical (Fig. 7). Another cluster of voxels
we found neural classification in the right Rolandic operculum, left (uncorrected voxelwise at p < 0.001, cluster size k ≥ 10) was found in
fusiform gyrus and right precuneus. the left cerebellum (t = − 5.92, MNI: x = − 21, y = − 81, z = − 21) for
atypical > typical, but no significance was identified after multiple
comparison correction. Results in PWA (uncorrected voxelwise at p <
3.3. Relationship between task performance and neural classification 0.001) showed activation in the right MOG (t = 3.87, MNI: x = 30, y =
− 84, z = 24) and left lingual gyrus (t = 3.8, MNI: x = − 21, y = − 84, z =
Although the searchlight MVPA did not reveal any significant results − 15) for atypical > typical, and in the right superior frontal gyrus (t =
in PWA, a follow-up analysis was conducted to examine the association 5.20, MNI: x = 21, y = 6, z = 54), left cerebellum (t = 3.88, MNI: x =
between the visual representation of semantic typicality and behavioral − 12, y = − 45, z = − 24), and right supplementary motor area (t = 3.59,
performance in our patients. MNI: x = 12, y = 0, z = 54) for typical > atypical.
An ROI MVPA was first conducted to extract individual PWA’s
classification accuracy from the LMOG and right calcarine in PRoNTo
3.5. Post-hoc within-category univariate analysis
2.1 (Schrouff et al., 2013). Functional ROIs for the LMOG and right
calcarine were extracted from healthy individuals based on the
One potential difficulty with interpreting the afore-mentioned re
group-level classification results using the MarsBAR toolbox for SPM12
sults is that the analyses were conducted for typical vs. atypical while
(Brett et al., 2002). Within each ROI, an MVPA was performed using a
collapsing across categories. Thus, to further assess if the effects of
binary LSVM classifier with LORO cross-validation (see Appendix C for
typical vs. atypical were maintained within specific categories, a uni
individual classification accuracy in each ROI).
variate analysis was conducted to examine brain activation patterns for
Next, Spearman’s rank correlations were conducted to examine the
typical and atypical conditions within each category. The model structure
relationship between neural classification accuracy in each ROI and (1)
was the same as the previous univariate analysis. In healthy adults,
the mean reaction times (RTs), (2) the mean accurate RTs, and (3) the
significant clusters of voxels (cluster-level FWE corrected at p < 0.05;
mean percent accuracy across typical and atypical trials in the fMRI task,
Fig. 8a) were found for atypical fruits > typical fruits in the RSOG (t =
as well as assessment scores in the (4) PPT, which was administered to
8.97, MNI: x = 18, y = − 99, z = 15) extending into the right calcarine
examine semantic association abilities. For correlational analysis (1)–
cortex (t = 6.53, MNI: x = 12, y = − 99, z = 3), and in the LMOG (t =
(3), PWA18 and PWA20 were excluded and PWA19’s behavioral per
6.87, MNI: x = − 15, y = − 102, z = 6) extending into the left calcarine
formance was represented using data from run 1 due to their missing
cortex (t = 6.16, MNI: x = 12, y = − 99, z = 3). No significant clusters
were found for the other four categories after correction for multiple
Table 3 comparisons. In PWA, significant brain activation was identified for
Group-level searchlight results in healthy individuals and PWA. atypical fruits > typical fruits in the left lingual gyrus (t = 5.62; MNI: x =
Region Cluster size t-value x y z − 3, y = − 78, z = − 3; cluster-level FWE corrected at p < 0.05; Fig. 8b).
Healthy (cluster-level FWE correction at p < 0.05) No significant results were found for the other four categories.
L MOG 148 5.82* − 27 − 84 6
L Lingual 148 5.23* − 15 − 81 − 6 4. Discussion
R Calcarine 122 5.32* 18 − 81 9
R SOG 122 5.08* 24 − 84 15
PWA (uncorrected at p < 0.001) The current study aimed to examine the processing of typical and
R Rolandic operculum 3 3.88 45 − 27 21 atypical exemplars in both healthy individuals and PWA. Behavioral
L Fusiform 3 3.87 − 33 − 36 − 24 responses in the fMRI task showed that typical items were processed
R Precuneus 2 3.57 15 − 63 21 faster and more accurately than atypical items across both groups of
L: Left, R: Right, MOG: middle occipital gyrus, SOG: superior occipital gyrus; x, participants. The searchlight MVPA across all categories demonstrated
y, and z correspond to peak MNI coordinates; *: FWE correction at p < 0.05. neural representation of semantic typicality in the visual cortex in
7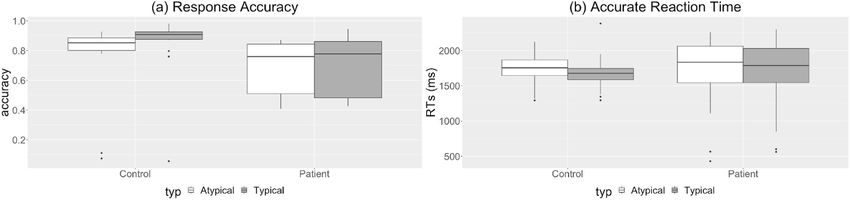
R. Li et al. Neuropsychologia 158 (2021) 107893
Fig. 5. Searchlight results in healthy individuals and
PWA. Statistical significance for classification against
chance-level in healthy participants (thresholded at p
< 0.001, cluster-level FWE-corrected at p < 0.05),
shown in axial (a) and coronal (b) views. Color bar
indicates t-statistics (from 3.65 to 5.82), significant
clusters were found in the LMOG and right calcarine
cortex; Statistical significance for classification
against chance-level in PWA (uncorrected at p <
0.001), shown in axial slices (c). Color bar indicates t-
statistics (from 3.45 to 3.9), clusters were found in the
left fusiform gyrus (green), right Rolandic operculum
(orange) and right precuneus (blue). Figures are ori
ented in neurological convention. (For interpretation
of the references to color in this figure legend, the
reader is referred to the Web version of this article.)
Fig. 6. Relationship between neural classification and fMRI task performance
in PWA. Scatterplot depicting the relationship between neural classification in
the LMOG and RTs across all typical and atypical trials in the fMRI task (n = 19
PWA). X-axis: neural classification accuracy (% accuracy); y-axis: mean reac
tion times (milliseconds).
Fig. 7. Brain activation for typical > atypical revealed by the univariate analysis
in healthy individuals. Coronal slices showing significant brain activation in the
healthy individuals but did not reveal any significance in PWA. A follow-
RSMG (cluster-level FWE correction at p < 0.05). No significant activation was
up correlational analysis in PWA showed a significant positive associa
found for atypical > typical. Images were displayed in neurological convention.
tion between neural classification in the LMOG and response times in the
fMRI task. At the univariate level when all categories were included, a
across the two groups addressed in this study.
significant cluster was found for typical > atypical in the RSMG in
healthy individuals, but no significance was found for atypical > typical
or for either contrast in PWA. However, when each category was 4.1. Behavioral typicality effect
analyzed separately, significant clusters of voxels were identified in the
LMOG and RSOG for atypical fruits > typical fruits in healthy individuals, The current study found a main effect of typicality. Specifically, re
and another significant cluster was identified in the left lingual gyrus for sponses to typical items were faster and more accurate than atypical
the same contrast in PWA. Neural representation of typicality has been items across healthy adults and PWA. These findings are consistent with
previously identified in visual (i.e., right LOC; Iordan et al., 2016) and previous behavioral studies examining the effects of typicality in both
temporal regions (i.e., right temporal fusiform and medial temporal healthy individuals (Rosch et al., 1976; Hampton, 1995) and PWA
lobes; Davis and Poldrack, 2014) in healthy young individuals. The (Kiran and Thompson, 2003; Kiran et al., 2007; Sandberg et al., 2012),
present study differed from these previous studies in that we included suggesting that atypical exemplars of a category are more difficult to
both older healthy adults and patients with post-stroke aphasia. In what process than typical exemplars. However as suggested by Roger et al.
follows, we discuss the main behavioral and neuroimaging findings (2015), the typicality effect may be governed by specific tasks. In their
study, patients with SA showed significant typicality effects in picture
8
R. Li et al. Neuropsychologia 158 (2021) 107893
4.2. Neural correlates of semantic typicality in healthy adults
In order to identify the neural correlates of typicality, an MVPA was
conducted in this study to detect different brain activation patterns
between typical and atypical items (Kriegeskorte et al., 2006). Results in
healthy adults revealed two neural clusters in the visual cortex with
above-chance classification accuracy after correction for multiple com
parisons (i.e., LMOG and right calcarine cortex). These findings partially
support our hypothesis, which predicted distinct patterns of activation
between typical and atypical exemplars in both visual and temporal
regions. The univariate analysis in healthy adults revealed a significant
cluster in the RSMG that indicated greater activation for typical >
atypical. However, the distinction between typical and atypical exem
plars in the visual cortex could have been affected by other factors than
typicality itself. Given that a category effect was found in the behavioral
data, it is possible that we inadvertently compared typical birds with
atypical clothing and the difference emerged from a purely visual
complexity aspect without capturing exemplar typicality effects. For this
reason, we further examined the typicality effect for each category and
found a significant typicality effect for fruits in regions that were
consistent with the MVPA (i.e., LMOG and RSOG). Other categories did
not show these findings likely because of lower sample sizes. These re
sults suggest that MVPA allows for the capture of subtle neural differ
ences in access and representation of semantic typicality by taking into
Fig. 8. Atypical fruits > Typical fruits in (a) healthy adults and (b) PWA. (a) account the relationships across voxels, whereas univariate analysis
Significant clusters in the RSOG extending into the right calcarine cortex, and in cannot (Haxby et al., 2001; Norman et al., 2006).
the LMOG extending into the left calcarine cortex; (b) significant cluster in the Our findings in the visual cortex are consistent with previous neu
left lingual gyrus. Color bars indicate t-statistic (cluster-level FWE corrected at roimaging studies examining the typicality effect in healthy individuals
p < 0.05). Figure is oriented in neurological convention (left is on the left). (For (Davis and Poldrack, 2014; Iordan et al., 2016). Although the findings
interpretation of the references to color in this figure legend, the reader is are not in the same visual regions as identified in previous studies (i.e.,
referred to the Web version of this article.)
LOC in the Iordan study), these results support the hypothesis that
neural representation of semantic typicality is built by the visual system
sorting and word-picture matching tasks, but not in the picture naming at an intermediate processing stage, rather than being directly reflected
task. Their findings were interpreted within the context of semantic in the stimulus input (Iordan et al., 2016). The LMOG and calcarine
control. Since the semantic impairment in SA can arise from damage to cortex have both been associated with visual semantic processing of
the control network (i.e., prefrontal and/or temporo-parietal regions), different categories (Martin et al., 1996; Tyler et al., 2003), suggesting
the processing of typicality might be affected if the tasks require a that these regions play an important role in processing the internal
greater degree of control. Nevertheless, we think task-dependency does structure of categories.
not affect our findings as our fMRI task did not require semantic control The distinction between typical and atypical items in the visual
such as inhibiting specific feature properties or selecting a target item cortex might also be attributed to other psycholinguistic and perceptual
among other strongly competing distractors. factors, such as familiarity (Boster, 1988) and lower visual features (e.g.,
The regression analyses of response times and accuracy did not color relatedness; Huth et al., 2012). Even though our study was not
reveal a main effect of group or the group-by-typicality interaction. aimed to investigate these potential factors, we have attempted to
Previous studies investigating semantic typicality found significantly further clarify whether our picture stimuli differed in color-related
lower accuracy and longer RTs in PWA than healthy adults (Kiran and features between typical and atypical exemplars. Color features were
Thompson, 2003; Sandberg et al., 2012). A main difference between extracted using the rgb2hsv function in R Studio ("grDevices” package;
these previous studies and the current study is that they compared pa Rstudio Team, 2016), which provided values of hue, saturation,
tients with different types of aphasia or levels of semantic impairment. vibrancy, contrast, and clarity. For each of these features, a simple linear
Hence, including PWA of different aphasia types and severity in a single regression was conducted to estimate the effect of typicality (i.e.,
group might have led to an insignificant group effect or an interaction typical, atypical) across all the stimuli. We did not find any significance
effect in our study. Note that the goal of this study was not to examine between typical and atypical stimuli, suggesting that the pictures were
semantic typicality in different age groups or patients with various unlikely confounded by color-related parameters. One could argue
aphasia severities. Another explanation to this finding is that two whether the relations among the stimuli are correlated to the relations
healthy adults (HP2 and HP7) scored below chance (50% accuracy) in among their neural representations. These questions are better exam
the fMRI task, which might also have resulted in an insignificant ined using other approaches such as the representational similarity
between-group difference. analysis (RSA; Kriegeskorte et al., 2008). The current experimental
Behavioral results further showed an effect of category, in which design, however, was not well suited to compute a dissimilarity matrix
responses to fruits were slower and less accurate than the other cate ideal to complete an RSA, hence we were unable to implement this
gories and responses to furniture were more accurate than fruits, clothing, analysis to examine these issues. Future research is needed to tease apart
and vegetables. This category-specific effect was not initially hypothe potential factors, including familiarity of the objects, motion-related
sized. We think this finding could be due to a relatively high overall features of the picture stimuli, and lexical interference of the features
familiarity of furniture and a low overall familiarity of fruits, which is a that may differentially affect the typicality representation in the brain.
potential factor that might have affected the processing of typicality Results from our searchlight MVPA surprisingly did not capture
(Folstein and Dieciuc, 2019; Malt and Smith, 1982). above-chance classification in any temporal regions in healthy adults,
which is contrary to our hypothesis. Comparing to one previous study
that found typicality representation in the temporal cortex (Davis and
9
R. Li et al. Neuropsychologia 158 (2021) 107893
Poldrack, 2014), our study had relatively fewer trials and runs that the role of the temporal lobe in the processing of typicality for PWA.
might have led to a diminished effect in the temporal cortex. Alterna
tively, it is possible that semantic feature verification for typical and 4.4. Limitations and future directions
atypical examples is similar in a way that does not elicit temporal
activation. One limitation of the current study is a relatively small sample size of
Nevertheless, the neural correlates of typicality in healthy adults can task stimuli, which could lead to cross-validation failure with large error
be explained by theoretical models. One explanation of the distinction in multi-voxel pattern analysis, as suggested by previous studies (Var
between typical and atypical exemplars that appeared in the visual but oquaux, 2018). Additionally, the neural representation of typicality can
not the temporal cortex is based on the prototype theory, which assumes be associated with other psycholinguistic factors, such as familiarity,
that the degree of shared features could be different between typical and frequency, animacy, etc. Although the current study was not aimed to
atypical exemplars (Rosch and Mervis, 1975). Note that some of the examine the effects of these factors, future studies should utilize ap
features required perceptual processing (i.e., apple: is round; parrot: has proaches such as RSA (Kriegeskorte et al., 2008) to establish the corre
feathers) whereas other features required functional/semantic knowl spondence between the relations among stimuli and the relations among
edge (e.g., blouse: worn by women; washing machine: needs power to their brain activation patterns in order to tease apart these potential
work) about the example in question. The current results of a typicality variables. This approach would require more samples of task trials to
effect in the visual cortex (i.e., MOG) but not in the temporal lobe (i.e., examine factors that may influence the neural distinction between
MTG) even in the healthy adults would suggest that such type of featural typical and atypical stimuli in the visual cortex. Another direction is to
verification may be occurring in the visual cortex. The present results include subgroups of PWA based on whether there is damage to the
can likely be better explained by the exemplar theory (Nosofsky and temporal lobe or not in order to understand the role of the temporal lobe
Palmeri, 1997; Nosofsky and Zaki, 2002), which posits that categories in typicality processing. As pointed out by Price et al. (2006), activation
are represented based on the stored exemplars in memory, and that may not be detected in patients if they are grouped on the basis of
typicality is conceptualized as how similar each item is to the stored similar lesion patterns as this could bias the interpretation of
exemplars in memory. Here, the typicality effect identified in the visual patient-specific responses. Furthermore, the typicality effect could also
cortex suggests that these regions may participate in visual and semantic be affected by the impaired semantic control ability in PWA, as sug
processing as participants might have completed the featural verifica gested by Rogers et al. (2015). So, it would be informative if future
tion task by comparing features for specific examples as stored memory studies could gather information about semantic control in order to
representations rather than as a set of distributed featural examine its role in the processing of items or tasks that require semantic
representations. control.
4.3. Neural correlates of semantic typicality in PWA 5. Conclusion
In PWA, different patterns of activation were identified for the pro The current study aimed to identify brain regions that show differ
cessing of typical and atypical exemplars. Specifically, the uncorrected ential neural activation patterns between typical and atypical exemplars
results from the searchlight MVPA showed three clusters of voxels in the in both healthy adults and PWA. The behavioral results showed that
right Rolandic operculum, left fusiform gyrus and right precuneus. responses to typical items were faster and more accurate than atypical
These regions did not show significance after correction for multiple items. A searchlight MVPA revealed that semantic typicality was rep
comparisons, so it is difficult to draw conclusions about the roles of these resented in the visual cortex in healthy adults, whereas results were not
regions. However, a follow-up correlational analysis captured a signifi significant in PWA. A follow-up analysis in PWA showed a strong as
cant positive association between reaction times in the fMRI task and sociation between neural classification in the LMOG and reaction times
neural classification in the LMOG, suggesting that the typicality effect in the fMRI task. When the typicality effect was examined for each
was more likely identified in the visual cortex in patients who spent category at the univariate level, significance was identified for fruits in
longer versus shorter time verifying semantic features. At the univariate the visual cortex in both healthy individuals and PWA. These findings
level, no significance was identified for typical > atypical or atypical > suggest that typicality was modulated in the visual cortex in healthy
typical. When examining the activation patterns within each category, a individuals, but to a lesser extent in the same region in PWA. Future
significant cluster was found in the left lingual gyrus for atypical fruits > studies can include patients on the basis of damage to the temporal lobe
typical fruits. Even though the results from MVPA did not capture any and incorporate other neuroimaging techniques to establish the roles of
significance, the brain-behavioral correlation and the within-group temporal and visual regions in typicality processing.
univariate analysis for fruits suggest that neural representation of se
mantic typicality might still be modulated by visual regions in PWA, yet Credit statement
to a much lesser extent than healthy individuals.
While there was no temporal activation corresponding to the typi Ran Li: Conceptualization, Methodology, Software, Formal analysis,
cality effect in healthy adults, in PWA, we were unable to examine po Writing – original draft, Writing – review & editing, Visualization.
tential activation since all our participants had damage in the temporal Swathi Kiran: Conceptualization, Methodology, Investigation, Re
lobe. One possibility for the results in PWA is that temporal lesions may sources, Writing – review & editing, Supervision, Funding acquisition.
cause damage to the functional connectivity between temporal and vi Tyler Perrachione: Conceptualization, Methodology, Formal analysis;
sual regions that affects the processing of all typical and atypical items. Jason Tourville: Conceptualization, Methodology, Formal analysis.
Numerous neuroimaging studies have indicated the importance of
functional connection in cognitive processes as behavioral deficits may Funding
emerge from any damage in the regions of a network (Catani and Ffyt
che, 2005; Toba et al., 2020). Hence, although the visual cortex was This work was supported by National Institute on Deafness and Other
spared in our patients, brain damage in any part of the temporal lobe Communication Disorders of the National Institutes of Health (USA)
could result in functional deficits in semantic processing of typicality. under grant 1P50DC012283. The authors report no conflict of interest.
However, this tentative account should be examined in future studies Ran Li was supported by grant from the NIH/NIDCD (1U01DC014922).
using other neuroimaging techniques such as dynamic causal modelling Jason Tourville was supported by grants from the NIH/NIDCD (R01
to examine the functional interactions between the visual and temporal DC002852 and R01 DC007683). Swathi Kiran is a scientific consultant
lobes. As such, in this study, it is difficult to draw any conclusions about for The Learning Corporation (FKA Constant Therapy) but there is no
10You can also read


