Climate-induced speleothem radiocarbon variability on Socotra Island from the Last Glacial Maximum to the Younger Dryas
←
→
Page content transcription
If your browser does not render page correctly, please read the page content below
Clim. Past, 16, 409–421, 2020
https://doi.org/10.5194/cp-16-409-2020
© Author(s) 2020. This work is distributed under
the Creative Commons Attribution 4.0 License.

Climate-induced speleothem radiocarbon variability on Socotra
Island from the Last Glacial Maximum to the Younger Dryas
Steffen Therre1 , Jens Fohlmeister2,3 , Dominik Fleitmann4 , Albert Matter5 , Stephen J. Burns6 , Jennifer Arps1 ,
Andrea Schröder-Ritzrau1 , Ronny Friedrich7 , and Norbert Frank1
1 Institute of Environmental Physics, Heidelberg University, Heidelberg, Germany
2 Potsdam   Institute for Climate Impact Research, Potsdam, Germany
3 GFZ German Research Centre for Geosciences, Section Climate Dynamics and Landscape Development, Potsdam, Germany
4 Department of Environmental Sciences, University of Basel, Basel, Switzerland
5 Institute of Geological Sciences, University of Bern, Bern, Switzerland
6 Department of Geosciences, University of Massachusetts, Amherst, USA
7 Curt-Engelhorn-Centre Archaeometry gGmbH, Mannheim, Germany

Correspondence: Steffen Therre (stherre@iup.uni-heidelberg.de)

Received: 8 August 2019 – Discussion started: 19 September 2019
Accepted: 3 February 2020 – Published: 28 February 2020

Abstract. In this study, the dead carbon fraction (DCF) vari-     is of particular relevance for speleothem studies that aim
ations in stalagmite M1-5 from Socotra Island in the western      to reconstruct past atmospheric 14 C (e.g., for the purposes
Arabian Sea were investigated through a new set of high-          of 14 C calibration), as these would rely on largely climate-
precision U-series and radiocarbon (14 C) dates. The data re-     independent soil carbon cycling above the cave.
veal an extreme case of very high and also climate-dependent
DCF. For M1-5, an average DCF of 56.2 ± 3.4 % is observed
between 27 and 18 kyr BP. Such high DCF values indicate a
high influence of aged soil organic matter (SOM) and nearly       1   Introduction
completely closed-system carbonate dissolution conditions.
Towards the end of the last glacial period, decreasing Mg/Ca      Radiocarbon (14 C hereafter) dating has fundamentally
ratios suggest an increase in precipitation which caused a        changed our knowledge of the timing of events and rates
marked change in the soil carbon cycling as indicated by          of change in archeological and climate proxy records ever
sharply decreasing DCF. This is in contrast to the relation       since it was pioneered in the late 1940s (Arnold and Libby,
of soil infiltration and DCF as seen in stalagmites from tem-     1949). To provide more accurate data for 14 C calibration be-
perate zones. For Socotra Island, which is influenced by the      yond the tree-ring record, speleothems gained importance
East African–Indian monsoon, we propose that more humid           as a source of information on atmospheric 14 C. Stalagmite
conditions and enhanced net infiltration after the Last Glacial   records from tropical and temperate climate zones overlap-
Maximum (LGM) led to dense vegetation and thus lowered            ping the (floating) tree-ring data (Beck et al., 2001; Hoff-
the DCF by increasing 14 CO2 input into the soil zone. At         mann et al., 2010; Southon et al., 2012) have been included
the onset of the Younger Dryas (YD) a sudden change in            in the most recent comprehensive 14 C intercalibration data
DCF towards much higher, and extremely variable, values           set IntCal13 (Reimer et al., 2013). Radiocarbon calibration
is observed. Our study highlights the dramatic variability of     based on speleothems relies on the assumption of a low and
soil carbon cycling processes and vegetation feedback on          constant dead carbon fraction (DCF) in the stalagmite, even
Socotra Island manifested in stalagmite DCF on both long-         though one of the included calibration records showed DCF
term trends and sub-centennial timescales, thus providing ev-     variation by almost a factor of 2 during the YD (Beck et al.,
idence for climate influence on stalagmite radiocarbon. This      2001; Hoffmann et al., 2010). A unique speleothem calibra-
                                                                  tion record was recently published by Cheng et al. (2018),

Published by Copernicus Publications on behalf of the European Geosciences Union.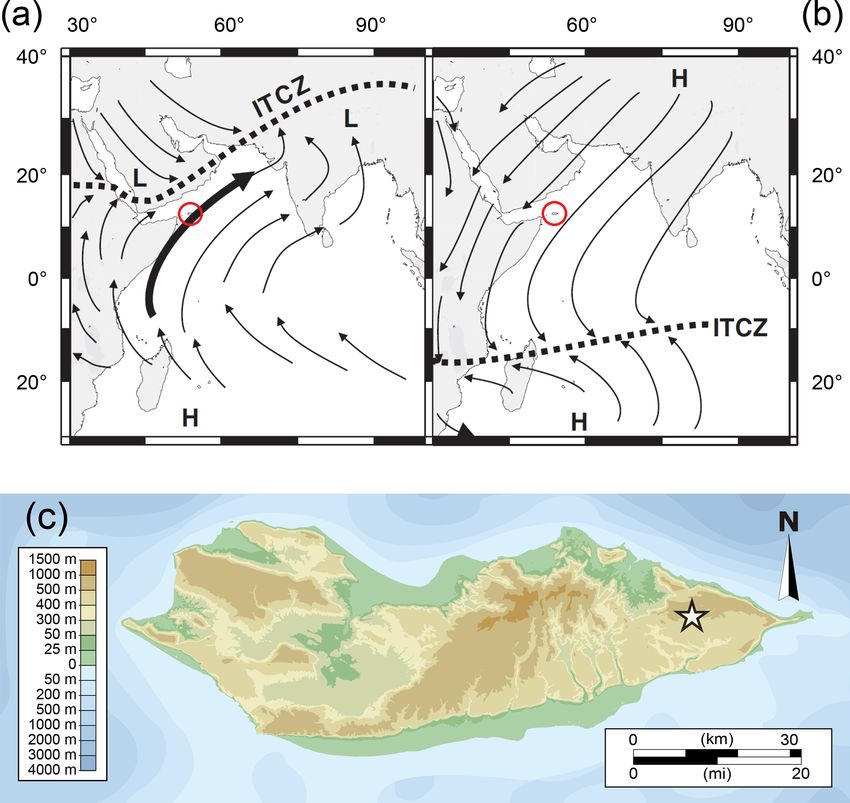
410 S. Therre et al.: Climate-induced speleothem radiocarbon variability
who presented a continuous atmospheric 14 CO2 reconstruc- the input of 14 CO2 into the soil zone through denser vegeta-
tion from stalagmites with a very low (< 6 %) and constant tion above the cave is the determining factor for soil carbon
DCF. They further showed that variations of speleothem 14 C cycling.
at Hulu Cave, China, coincide with floating tree-ring 14 C
variations, proving that even small decadal-scale carbon cy-
2 Study location and material
cle changes and atmospheric 14 C are captured by stalagmites
(Adolphi et al., 2017). However, such a situation is unusual, 2.1 Socotra Island
as significant impacts on DCF can arise from carbonate dis-
solution or climate and carbon cycle changes. By combining Socotra Island is the largest island of the eponymous
14 C dating and elemental Mg/Ca analysis, a connection be- archipelago of four islands on the western margin of the Ara-
tween precipitation (net infiltration) and stalagmite DCF was bian Sea. It is situated 230 to 360 km east of the Horn of
observed. Several studies attributed this relation to changes Africa (Somalia) and 380 km south of the Arabian Penin-
in open- vs. closed-system conditions of limestone dissolu- sula (Fig. 1). Socotra Island is approximately 130 km long
tion, which controls the contribution of very old host rock and 30 km wide. Its topography varies from coastal plains in
carbonate to drip water dissolved inorganic carbon (DIC) the north and south of the island to elevated plateaus several
(Griffiths et al., 2012; Noronha et al., 2014). In a recent hundred meters above sea level (m a.s.l.). The innermost part
study, DCF values exceeding 50 % in a Holocene stalagmite of the island consists of a mountainous area with elevations
from Corchia Cave, Italy, have been reported (Bajo et al., of up to 1500 m a.s.l. The archipelago is mainly made up of
2017). Such high DCF values are above the theoretical limit Precambrian basement rocks that are in part overlain by Cre-
for closed-system carbonate dissolution systems and were at- taceous or Tertiary plateau limestone (Schlüter, 2006). The
tributed to enhanced host rock dissolution by sulfuric acid. maritime climate of Socotra Island is under the strong influ-
Two studies focusing on the direct influence of decompos- ence of the East African–Indian monsoon system reflected
ing soil organic matter (SOM) on soil CO2 found that aging in the biannual migration of the Intertropical Convergence
SOM leads to depleted soil gas 14 CO2 concentration and con- Zone (ITCZ) between its Northern Hemisphere winter posi-
sequently higher DCF in the stalagmite calcite (Fohlmeister tion in the southern Indian Ocean and its summer position
et al., 2011; Rudzka et al., 2011). in the Arabian Sea (Shakun et al., 2007) (Fig. 1a, b). This
The Arabian Sea and Indian Ocean have been the focus migration is responsible for the bimodal distribution of pre-
of numerous paleoclimate studies in recent years (DiNezio cipitation. More than 20 % of total annual rainfall on the is-
et al., 2018; Fleitmann et al., 2003, 2007; Shakun et al., land occurs in April and May when the northward-migrating
2007), particularly concerning the potential impact of cli- ITCZ crosses the island. The second annual crossing of the
matic changes in the North Atlantic region on the intensity of ITCZ during October to December accounts for more than
the Indian summer monsoon and low-latitude climate condi- 50 % of the annual rainfall (Scholte and De Geest, 2010).
tions. For this study, we selected a speleothem (sample M1-5) Today, total precipitation can be as low as 67 mm yr−1 near
from Socotra Island which documents a significant increase the coastal plains, while more than 500 mm rainfall can occur
in monsoonal rainfall during the Bølling–Allerød interstadial in the mountainous areas in the inner island with elevations
(Shakun et al., 2007). These findings were recently corrobo- of more than 1000 m a.s.l. (Scholte and De Geest, 2010).
rated by DiNezio et al. (2018), who postulated a unique In-
dian Ocean climate dipole behavior linked to the monsoon 2.2 Stalagmite M1-5
during the last glacial. This dipole pattern, which seems pre-
dominantly driven by the exposure of the Sunda and Sahul Stalagmite M1-5 was collected from Moomi Cave in
shelves, causes a marked cooling and reduction in moisture 2002, which lies on a limestone plateau (Moomi Plateau,
availability in the Arabian Sea, leading to dry conditions in ca. 500 m a.s.l.) in the eastern part of Socotra Island
the region around Socotra Island during the last glacial pe- (12◦ 320 0400 N, 54◦ 190 0000 E; Fig. 1c). Moomi Cave is ap-
riod. proximately 1 km long, largely horizontal, and overlain by
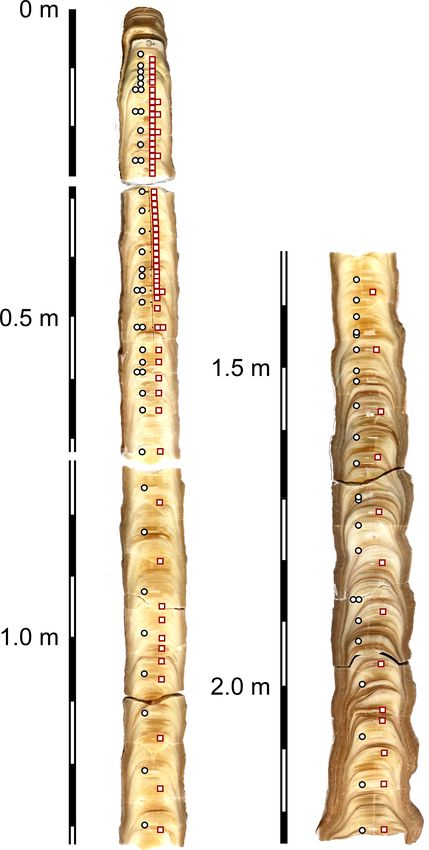
Here we present a study of a stalagmite from Socotra Is- ∼ 20 m of bedrock (Burns, 2003). Stalagmite M1-5 is ap-
land, with the aim of investigating changes in the local cli- proximately 2.2 m long and 10 to 15 cm wide and grew
mate regime across the last deglaciation (Termination I). As roughly 1 km from the cave entrance. It was sectioned along
the climate shifted towards more humid conditions after the its growth axis down to the base (Fig. 2) and polished to make
LGM, synchronous changes in vegetation and soil carbon cy- the growth layers more visible (Shakun et al., 2007). On the
cling may be expected. Hence, we investigate the temporal macroscopic scale, there are significant differences visible in
evolution of the DCF and hydro-proxies of stalagmite M1- the texture and stratigraphy of the stalagmite. The lower part
5 from the LGM to the beginning of the Holocene to study of the stalagmite from its base to approximately 1.5 m dis-
the links between above-cave hydrology and soil carbon cy- tance from the top shows distinct changes in layer coloring,
cling. Our study shows that increasing moisture on Socotra and it generally has a larger width of approximately 15 cm. In
Island is associated with decreasing DCF, and it proves that younger parts, the carbonate is brighter and the width rarely
Clim. Past, 16, 409–421, 2020 www.clim-past.net/16/409/2020/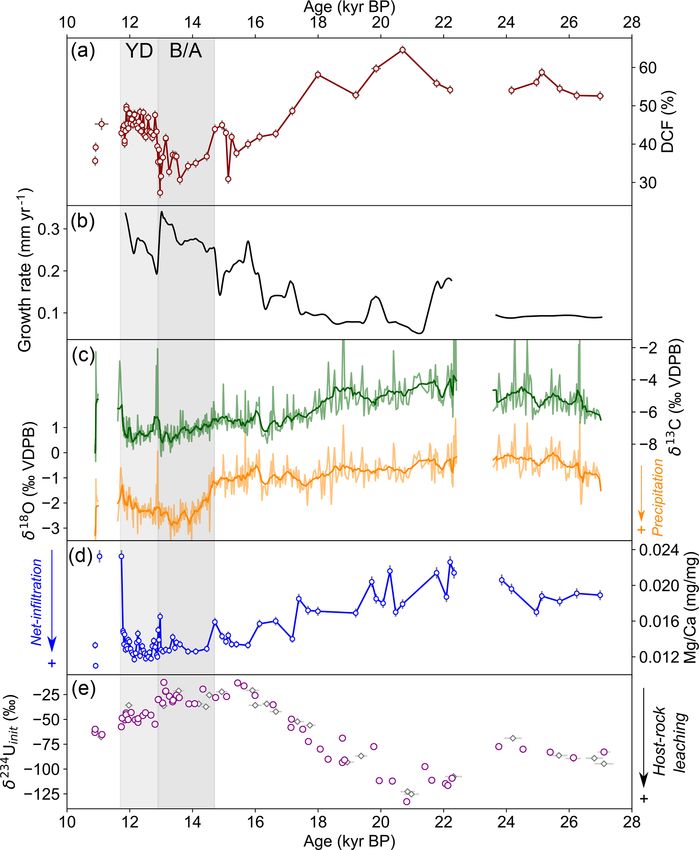
S. Therre et al.: Climate-induced speleothem radiocarbon variability                                                                 411

Figure 1. Upper figures show the geographic position of the Socotra archipelago (red circle) in the western Arabian Sea, east of the coast
of Somalia with the prevailing monsoonal surface wind patterns in boreal summer (a) and boreal winter (b) relative to the Intertropical
Convergence Zone (ITCZ) (graphic adapted from Fleitmann et al., 2007). In a topographic map (c), the position of Moomi Cave in the east
of Socotra Island on the Moomi Plateau is indicated by a white star.

exceeds 10 cm. Another visible change can be seen in the               using a Thermo Fisher Neptune Plus multicollector induc-
uppermost 10 cm where the layering is much darker, which               tively coupled plasma mass spectrometer (MC-ICP-MS) at
Shakun et al. (2007) found to occur shortly after an apparent          the Institute of Environmental Physics, Heidelberg Univer-
hiatus.                                                                sity, Germany. Multiple measurements of the HU-1 standard
                                                                       resulted in a value of 1.00002±0.00082 for (234 U/238 U) and
                                                                       1.00004 ± 0.00082 for (230 Th/238 U) for 517 samples over
3     Methods                                                          22 months. The HU-1 standards used to bracket the sample
                                                                       measurements accordingly yield a reproducibility of 0.82 ‰
3.1    U-series dating                                                 for (234 U/238 U) and (230 Th/238 U). Full procedural blanks
                                                                       were found to be smaller than 0.04 fg for 230 Th and 0.4 fg
Forty samples were analyzed at the Heidelberg Institute of
                                                                       for 234 U. The calculations for the radiometric ages were per-
Environmental Physics for this study. M1-5 was previously
                                                                       formed using the half-lives from Cheng et al. (2000) to main-
U-series dated at the Isotope Geology Laboratory, Univer-
                                                                       tain comparability with the record from Shakun et al. (2007).
sity of Bern. In total, 62 age data points are presently avail-
                                                                       More recent half-life values do not significantly change ra-
able, in addition to the previous age determination efforts
                                                                       diometric age estimates (see Results section). For detrital
by Shakun et al. (2007). For the sample treatment in Hei-              230 Th correction, a 232 Th/238 U weight ratio of 3.8 ± 1.9 and
delberg, approximately 80 to 120 mg of speleothem calcite
                                                                       secular radioactive equilibrium within the uranium decay
were cut with a diamond wire saw or drilled along growth
                                                                       chain was assumed.
layers. Chemical sample preparation, U and Th purification,
and mass spectrometric measurements follow the procedures
described in detail in Arps (2017), Douville et al. (2010),
and Wefing et al. (2017). Activity ratios were determined

www.clim-past.net/16/409/2020/                                                                         Clim. Past, 16, 409–421, 2020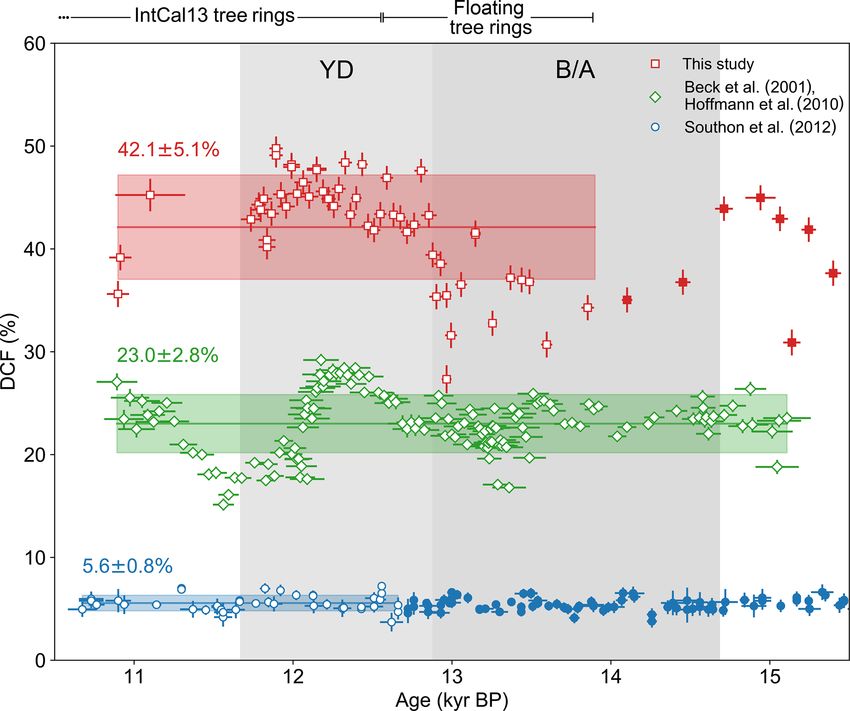
412                                                      S. Therre et al.: Climate-induced speleothem radiocarbon variability

                                                                  apparent blank activities consistently lower than 0.25 pmC
                                                                  (pmC represents percent modern carbon) (apparent blank
                                                                  14 C ages of 48–56 kyr). Oxalic acid II standards were graphi-

                                                                  tized from previously extracted CO2 gas and used for mea-
                                                                  surement calibration. Other international and in-house calcite
                                                                  standards were prepared and measured frequently to deter-
                                                                  mine the full analytical measurement reproducibility. In our
                                                                  case, the IAEA C2 standard was measured over 2 years with
                                                                  a reproduced value of 40.77 ± 0.36 pmC compared to the as-
                                                                  signed literature value of 41.14 ± 0.03 pmC.

                                                                  3.3    Elemental analysis

                                                                  For measurements of Mg/Ca ratios, approximately 1 to 2 mg
                                                                  of calcite was drilled from the stalagmite at each 14 C sample
                                                                  point. At the Institute of Environmental Physics at Heidel-
                                                                  berg University a Thermo Fisher iCAP Q inductively cou-
                                                                  pled plasma quadrupole MS (ICPQMS) was used, while data
                                                                  were also collected at the Institute of Earth Sciences at Hei-
                                                                  delberg University using an ICP optical emission spectrome-
                                                                  ter (ICP-OES) 720. For the ICPQMS, the 1σ reproducibility
                                                                  of the Mg/Ca ratio of two measured standards is < 1 %. For
                                                                  the OES setup, the internal 1σ standard deviation is < 1 % for
                                                                  Ca2+ and Mg2+ . Here SPS SW2 is used as a standard, and
                                                                  the long-term 1σ reproducibility is 2.0 % for Ca2+ and 3.3 %
Figure 2. Composite photograph of stalagmite M1-5 from Moomi
Cave. Black circles indicate where U-series dating samples were
                                                                  for Mg2+ (Warken et al., 2018). Comparability of the results
taken; red squares represent 14 C sample locations.               from both setups was ensured by normalizing the Mg/Ca
                                                                  ratios with respect to a series of internal standard measure-
                                                                  ments that were carried out in both laboratories.
3.2   Radiocarbon dating
                                                                  4     Results
For 14 C measurements, approximately 10 mg of calcite was
cut with a diamond wire saw or drilled from the stalagmite        4.1    U-series chronology
along the growth layers. To avoid contamination by ambi-
ent air, the cut samples were leached in 4 % hydrochloric         The U concentration in M1-5 ranges from 700.5 ± 2.9 to
acid before hydrolysis, whereas the powder from drilled sam-      2913.8 ± 9.3 ppb, and 232 Th concentrations are between
ples was immediately processed after sampling. Hydrolysis         15.04 ± 0.88 and 21042 ± 36 ppt.
was carried out on an evacuated glass line (p < 10−3 mbar)           All U-series ages in this study are reported in “years be-
by adding 0.5 mL of 11 % hydrochloric acid. The emerg-            fore present (yr BP)” or “kiloyears before present (kyr BP)”
ing water vapor during hydrolysis was removed by dry ice          where BP is referring to the year 1950. High 238 U and low
and acetone freezing traps. The acquired CO2 was subse-           232 Th concentrations in most samples allow for very precise

quently reduced to graphite over 3–4 h at 575 ◦ C on a sep-       U-series ages without major corrections or age reversals. U-
arate setup by adding H2 and the CO2 from the previous step       series ages range from 27.11±0.20 to 10.890±0.034 kyr BP
to a reactor containing iron powder as a catalyst. Detailed       with 2σ age uncertainties from 0.2 % to 1.0 %. The result-
descriptions of the sample preparation routine can be found       ing chronology is in good agreement with previous results
in Fohlmeister et al. (2011) and Unkel (2006). After the re-      from the same sample (Shakun et al., 2007), but the higher
action, the resulting graphite–iron compound was pressed          resolution of the new U-series dates reveals the growth his-
into targets. A 200 kV tandem MICADAS (mini carbon dat-           tory in much closer detail. Except for two outliers, almost
ing system) AMS at the Curt-Engelhorn-Centre Archaeome-           all U-series ages are in stratigraphic order and were utilized
try gGmbH in Mannheim, Germany, was used for the mea-             for age–depth modeling (Fig. 3). Replicate U-series age sub-
surements (Kromer et al., 2013; Synal et al., 2007). Process      samples for seven different depths all agree within their 2σ
blanks from marble were prepared using the same method            errors.
applied for regular samples to account for possible contam-          Age–depth modeling was performed using a stepwise
ination during chemical preparation or sample handling be-        implementation of StalAge (Scholz and Hoffmann, 2011)
fore the eventual measurement in the AMS, and they yielded        between the resolved growth discontinuities. The growth

Clim. Past, 16, 409–421, 2020                                                                 www.clim-past.net/16/409/2020/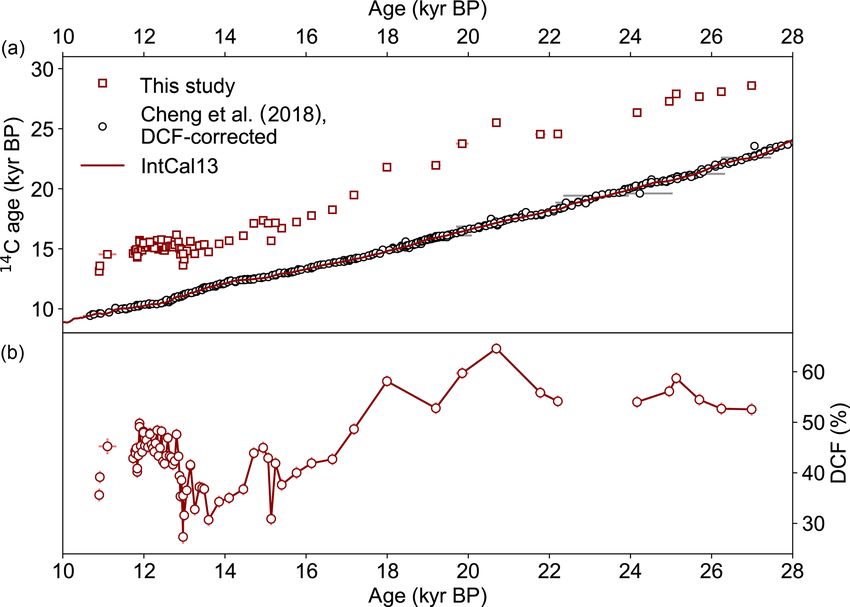
S. Therre et al.: Climate-induced speleothem radiocarbon variability                                                                    413

                                                                        4.2   Radiocarbon results
                                                                        A total of 78 stalagmite 14 C measurements were performed
                                                                        on stalagmite M1-5, including 6 duplicates for which all
                                                                        steps including the subsampling, preparation, and measure-
                                                                        ment were repeated. The measured 14 C activities (a 14 Cmeas )
                                                                        range between 19.52 ± 0.20 and 2.846 ± 0.035 pmC. The re-
                                                                        producibility of 14 C results is assessed by long-term mea-
                                                                        surements of the international IAEA C2 standard. The result-
                                                                        ing statistical error is used as an overall reproducibility. The
                                                                        total uncertainty is then calculated as the square root of the
                                                                        squared sum of the statistical error and overall reproducibil-
                                                                        ity. Each sample was assigned a U–Th modeled age (tmod )
                                                                        from the StalAge model, revealing a generally decreasing
Figure 3. U-series ages vs. depth. Error bars reflect 2σ statistical    14 C activity for older parts of M1-5 but also large variations
uncertainty but are mostly covered by the data points. The solid line
represents the established age model obtained by sectional imple-
                                                                        on decadal timescales. For comparison with atmospheric 14 C
mentation of the StalAge algorithm (Scholz and Hoffmann, 2011).         levels, the data are converted to conventional radiocarbon
Two data points implying age inversions (empty circles) in an oth-      years (t14 C ).
erwise steady record were omitted. Diamonds represent data from
a previous study (Shakun et al., 2007). Growth discontinuities D1       t14 C = −8033 years · ln(a 14 Cmeas )                            (2)
and D2 are highlighted by gray bars.
                                                                        The 14 C ages of stalagmite M1-5 are significantly older
                                                                        than the contemporaneous atmospheric 14 C calibration curve
                                                                        (Reimer et al., 2013). Throughout the literature, this effect
rate of stalagmite M1-5 is fairly constant during the last              in stalagmites has been referred to and quantified in many
glacial termination as well as interstadials from approxi-              different ways. For this article, we follow the definition of
mately 17.2 kyr until 11.7 kyr BP at an average growth rate             “DCF” as given by Genty et al. (1999) notwithstanding that
of roughly 0.23 mm yr−1 . A distinct 800-year hiatus was                all results can be understood as an equivalent “reservoir age”
identified at 110 mm (from top) from 11.7 to 10.9 kyr BP                in the unit “14 C years”. The reporting of reservoir ages in
(henceforth referred to as discontinuity “D1”). Above this              14 C studies on speleothems is described in detail by Soulet et
hiatus, the stalagmite growth continued at a high rate of ap-           al. (2016). In this study, the DCF varies substantially, as seen
proximately 0.30 mm yr−1 for a short period at the begin-               in comparison to the Hulu Cave speleothem record (Cheng et
ning of the Holocene. Dating results obtained by Shakun                 al., 2018) (Fig. 4a). Based on the StalAge model for M1-5,
et al. (2007), and the rapid texture and color changes of               the initial 14 C activity (a 14 Cinit ), at the time when the respec-
the growth layers in the uppermost part of the stalagmite               tive stalagmite layer was deposited, was reconstructed.
above 5 cm from the top, indicate sporadic growth through-
out the Holocene. For the older part of the stalagmite, a               a 14 Cinit = a 14 Cmeas · exp(tmod /8267 years)                  (3)
lower growth rate is observed: from 27.2 to 17 kyr BP, the
average rate is 0.086 mm yr−1 with another 1200-year-long               DCF was calculated by comparing each a 14 Cinit to the atmo-
hiatus after 23.5 kyr BP (discontinuity “D2”). Overall, the             spheric 14 C level (a 14 Catm ) at the respective time, as obtained
growth is mostly continuous with two discontinuities of mul-            from Reimer et al. (2013). 1σ errors were calculated using a
ticentennial duration with an overall rate of approximately             Monte Carlo approach following the procedure described in
0.130 mm yr−1 between 27.2 and 11 kyr BP, implying a high               Griffiths et al. (2012).
temporal resolution of 7.5 yr mm−1 .
                                                                                        a 14 Cinit

   The initial δ 234 U at the time of deposition (δ 234 Uinit ) can     DCF = 1 − 14                 · 100 %                             (4)
be calculated from the measured δ 234 Umeas by correcting it                            a Catm
for 234 U decay with the determined age t:                              DCF values for stalagmite M1-5 range from 27.33 ± 0.24 %
                                                                        at approximately 13 kyr BP to values as high as 64.6 ± 1.1 %
δ 234 Uinit = δ 234 Umeas · exp(λ234 · t).                       (1)    at 20.7 kyr BP (Fig. 4b). The M1-5 DCF record shows very
                                                                        high values before 18 kyr BP and a decreasing trend towards
δ 234 Uinit of stalagmite M1-5 is consistently below zero with          lower DCF values until 13 kyr BP. The following period be-
minimal values of around −130 ‰, which implies a strongly               tween 13 and 11 kyr BP is characterized by higher, and highly
leached and subsequently 234 U-depleted host rock. δ 234 Uinit          variable, DCF values of between 40 % and 50 %, and these
increases from the 234 U-depleted LGM ∼ 21 kyr BP towards               values exhibit rapid fluctuations on decadal timescales as
the Bølling–Allerød warm period (−25 ‰, ∼ 15 kyr BP)                    seen in a 9 % drop in a time interval of only 60 years modeled
where the growth rate is significantly higher.                          age at approximately 11.9 kyr BP.

www.clim-past.net/16/409/2020/                                                                          Clim. Past, 16, 409–421, 2020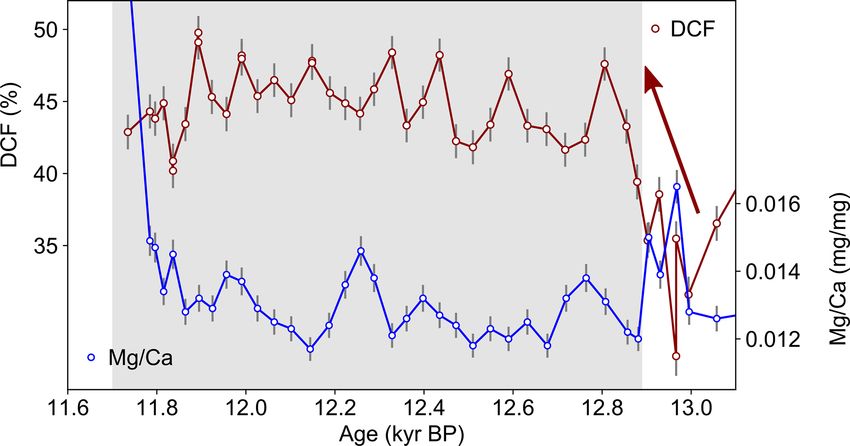
414                                                           S. Therre et al.: Climate-induced speleothem radiocarbon variability

                                                                        5     Discussion

                                                                        5.1    U-series dating and age–depth model

                                                                        The revised chronology for stalagmite M1-5 is far more
                                                                        accurate and precise in comparison to the previously pub-
                                                                        lished chronology, which was based on much fewer U-series
                                                                        ages (Shakun et al., 2007). Average uncertainties of the cor-
                                                                        rected U-series ages have decreased from 1.19 ± 0.30 % in
                                                                        Shakun et al. (2007) to 0.408 ± 0.161 % in this study. The
                                                                        refined age record helped to identify the two growth discon-
                                                                        tinuities (see Fig. 3). 238 U concentrations remain fairly con-
                                                                        stant around 2 ppm before 14 kyr BP when a dilution effect
                                                                        is visible and concentrations decrease to less than 1 ppm at
                                                                        ∼ 11 kyr BP. The StalAge model reveals a general trend to-
                                                                        wards higher growth rates in the younger part of the stalag-
Figure 4. Upper graph (a) shows the 14 C ages of stalagmite M1-5        mite with the highest growth rates of 0.30 mm yr−1 at around
(red squares) plotted vs. age derived from the StalAge model. Error     13 kyr BP, more than a factor of 2 higher than during the
bars are mostly smaller than symbol size. Also shown is the atmo-
                                                                        last glacial period. The general growth patterns can even be
spheric 14 C age (solid red line) from Reimer et al. (2013), with the
                                                                        distinguished by mere optical examination of the stalagmite
recently published DCF-corrected stalagmite record from Cheng et
al. (2018). The DCF of stalagmite M1-5 is shown in (b).                 lamination. At a depth of ∼ 1.5 m (17 kyr BP), a transition
                                                                        from marked lamination and darker colors to lighter layer
                                                                        coloring is visible. Synchronously, the width of the stalag-
                                                                        mite decreases gradually from more than 15 cm to less than
                                                                        10 cm in the younger half (see Fig. 2), where the growth
                                                                        rate is highest. According to stalagmite growth modeling
                                                                        studies (Dreybrodt, 1999; Kaufmann, 2003; Kaufmann and
                                                                        Dreybrodt, 2004), higher drip rates and higher temperatures
                                                                        cause a larger stalagmite diameter and higher growth rates.
                                                                        A rise in temperature on Socotra Island of about 2–3.5 ◦ C
                                                                        from the LGM to the Holocene was postulated by Shakun
                                                                        et al. (2007). A parallel increase in precipitation will be dis-
                                                                        cussed in Sect. 5.3. For stalagmite M1-5, a smaller diameter
                                                                        is observed in a time where the drip rate most likely increased
Figure 5. Mg/Ca ratio of stalagmite carbonate vs. modeled age.
                                                                        significantly, which contrasts with the aforementioned stud-
Error bars reflect the data reproducibility (overall 3 % of measured
                                                                        ies. Nonetheless, the times of highest growth rates correlate
values). Growth discontinuities D1 and D2 are highlighted by gray
bars. The data show a general decreasing trend from the LGM to-         with both increasing precipitation and temperatures.
wards Termination I, which is interrupted by highly increased val-
ues around D1 at approximately 11.7 kyr BP. Both hiatuses inferred
                                                                        5.2    DCF and implications for radiocarbon calibration
from U-series dating are shaded in gray.
                                                                        With the implemented age model for stalagmite M1-5, the
                                                                        DCF can be accurately assessed for the time interval of sta-
4.3 Mg/Ca ratio
                                                                        lagmite growth overlapping with both the dendrochronolog-
Mg/Ca ratios range from 0.01100 ± 0.00033 to 0.03217 ±                  ical records till 12.4 kyr BP and the wiggle-matched floating
0.00097 and display a continuous decrease from 22 to                    late glacial pine tree-ring chronology going back to 14 kyr BP
12 kyr BP. After this decrease, Mg/Ca ratios rise sharply to            (Hua et al., 2009; Schaub et al., 2008). Both are a substan-
their highest values around D1. After a few very high values,           tial part of the intercalibration record IntCal13 (Reimer et
the ratio drops back to the level measured before the major             al., 2013). For this reference time, the atmospheric 14 C con-
excursion (Fig. 5).                                                     centration is well known. Figure 6 compares the record of
                                                                        M1-5 to the speleothem-based 14 C records previously imple-
                                                                        mented in IntCal13 (Reimer et al., 2013). For the time in-
                                                                        terval overlapping with the tree-ring-based atmospheric 14 C
                                                                        calibration data (including floating tree-ring chronologies),
                                                                        stalagmite M1-5 reveals high DCF variability over centen-
                                                                        nial and decadal timescales: between 27 % at approximately

Clim. Past, 16, 409–421, 2020                                                                       www.clim-past.net/16/409/2020/
S. Therre et al.: Climate-induced speleothem radiocarbon variability 415
tion. This finding is in contrast to the Hulu Cave speleothems
which come from an a priori comparable temperate setting,
which is under the influence of pronounced monsoonal pat-
terns (Southon et al., 2012).
Potential atmospheric 14 C variations are overprinted in
stalagmite M1-5 by sub-centennial changes in DCF, which
must be driven by site-specific factors such as changes of soil
carbon age, open- vs. closed-system conditions (Fohlmeis-
ter et al., 2011; Griffiths et al., 2012), or short-term de-
velopments affecting soil carbon dynamics above Moomi
Cave. Other potentially relevant mechanisms include the in-
fluence of non-carbonic acids such as sulfuric acid (Bajo et
al., 2017). Since most of the aforementioned factors are in-
fluenced by climate, stalagmite M1-5 provides an excellent
opportunity to study climatic controls on the DCF values in
stalagmites.
5.3 Climatic controls of DCF at Moomi Cave
Figure 6. Very high and varying DCF for stalagmite M1-5 (this
study) in comparison to records included in calibration data sets Low DCF values in stalagmites are primarily caused by
(Beck et al., 2001; Hoffmann et al., 2010; Southon et al., 2012). open-system recharge conditions, with enhanced uptake of
Whereas H82 DCF values are low and constant, the Bahamas DCF
soil CO2 and limited water–bedrock interaction. Both condi-
values are higher and show nonrandom structures between 11.2 and
12.7 kyr BP. Empty symbols indicate the used reference area for
tions prevail at Hulu Cave, where the seepage water perco-
the respective calibration study; the shaded colored areas represent lates through predominantly sandstone rather than carbonate
mean values and standard deviation of DCF values in the respective limestone (Cheng et al., 2018). In our study very high av-
reference areas. Areas of available tree-ring records (Reimer et al., erage DCF values of 56.2 ± 3.4 % are revealed during the
2013) are indicated on top of the graph. last glacial period between 18 and 27 kyr BP with a maxi-
mum of 65 % at approximately 20.6 kyr BP (Fig. 7a). Such
high DCF values are only conceivable under closed-system
13 kyr BP and 50 % at approximately 11.9 kyr BP. A dou- limestone-dissolution conditions (Hendy, 1971). However, in
bling of DCF values is observed at the onset of the YD the conventional approach, considering only the two carbon
around 12.9 kyr BP (Fig. 6). Furthermore, rapid increases and end-members from near-atmospheric soil gas CO2 and the
decreases by a few percent DCF occur frequently between 14 C-free carbonate from dissolved limestone, DCF can reach
12.9 and 11.9 kyr BP. The data implicating these fluctuations maximum values of 50 % (Fohlmeister et al., 2011; Griffiths
have been replicated several times to exclude the possibil- et al., 2012; Hendy, 1971). DCF values higher than 50 %
ity of outliers. This highlights the large DCF variability of have been recently reported in a speleothem from Corchia
stalagmite M1-5 on sub-centennial timescales, which puts Cave (Italy) as a suggested consequence of additional dead
this 14 C record in stark contrast to the IntCal13 stalagmite carbon input by enhanced limestone carbonate contribution
records. to DIC through the presence of other organic or non-organic
For instance, no comparable variability is visible in the (sulfuric) acids in the soil zone (Bajo et al., 2017). This pro-
Hulu Cave speleothem, H82, in which the DCF remains cess also influences stable carbon isotopes in the stalagmite
rather constant at 5.6 ± 0.8 % (Southon et al., 2012). The calcite, i.e., δ 13 C, which shift values towards those observed
Bahamas stalagmite records show substantial and systematic in the limestone host rock. However, overall δ 13 C in M1-
changes in DCF between 11.2 and 12.7 kyr BP (Hoffmann et 5 (Fig. 7c) primarily ranges between −4 and −8 ‰ (av-
al., 2010), which coincides with the YD cold reversal and erage −6.2 ± 1.4 ‰) with corresponding DCF values vary-
was therefore attributed by the authors to vast changes in lo- ing from 27 % to 65 %. Furthermore, no significant correla-
cal vegetation and climatic conditions. Regardless of these tion between δ 13 C and DCF can be observed (r 2 = 0.206,
effects and the resulting large uncertainty in the corrected p < 0.01) in M1-5. It is therefore unlikely that increased
atmospheric 14 C concentrations, the Bahamas record was in- limestone dissolution by sulfuric acids is the key factor for
cluded in the IntCal13 data, as the benchmark Hulu Cave DCF variations in stalagmite M1-5. Alternatively, aged SOM
record was not available. The 14 C record of stalagmite M1- could cause the observed enhanced DCF values (Genty et
5 does not predominantly reflect atmospheric 14 C variations al., 2001). Fresh labile soil organic matter, as well as older
due to the large offset to the atmosphere and the high vari- carbon stocks in deeper soil layers on the Moomi Plateau,
ability across the tree-ring-based period. Hence, M1-5 can- may have contributed to soil gas CO2 , creating 14 C-depleted
not be used as a contribution to atmospheric 14 C calibra- CO2 (Fohlmeister et al., 2011; Trumbore, 2009). The pres-
www.clim-past.net/16/409/2020/ Clim. Past, 16, 409–421, 2020416 S. Therre et al.: Climate-induced speleothem radiocarbon variability
than 50 %. For instance, if an extreme case baseline DCF
of 50 % under closed-system conditions is assumed for the
record before 18 kyr BP, an age of the active carbon pool of
2500–3000 years can generate DCF values between 63 % and
65 %. If the carbon pool is composed of one young (root res-
piration) and one old carbon reservoir (microbial decompo-
sition of aged SOM) in equal proportions, the aged carbon
contributing to soil CO2 must be older than 5000 years and
contribute a share of 50 % to the soil gas budget to cause such
extreme DCF values. None of these scenarios have been re-
ported before in a study on speleothem 14 C, which makes
M1-5 a unique record in terms of aged SOM contribution to
stalagmite DCF.
All available geochemical proxies (shown in Fig. 7) in-
cluding DCF (Fig. 7a) reflect a clear climate signal: the LGM
is manifested in this stalagmite by low net-infiltration levels
and rather low precipitation on the archipelago (Shakun et
al., 2007). In a recent study by DiNezio et al. (2018) it was
argued that the exposure of the Sahul shelf during the Last
Glacial Maximum created a positive ocean–atmosphere feed-
back loop causing a drier and wetter dipole across the Indian
Ocean and subsequent hydroclimate changes, i.e., reduced
moisture levels in the Arabian Sea. The M1-5 multiproxy
record suggests that towards the end of the glacial period the
regional climatic conditions on Socotra Island likely shifted
to a higher net infiltration which is reflected in a systematic
Figure 7. Combined results from stalagmite M1-5. DCF (a),
growth rate from StalAge modeling (b), adapted stable isotope data
long-term decrease of the Mg/Ca ratio from approximately
from Shakun et al. (2007) (c), Mg/Ca mass ratio (d), and δ 234 U 20 to 15 kyr BP. We interpret the Mg/Ca decrease here as
from this study (violet circles) and Shakun et al. (2007) (gray di- a proxy for incongruent host rock dissolution and prior cal-
amonds) (e). The gray bars indicate Bølling–Allerød interstadial cite precipitation effect, reflecting shifts from drier to wet-
(B/A) and Younger Dryas (YD) cold reversal. Oxygen data were ter conditions above the cave (Fairchild et al., 2000), while
interpreted as an increase in monsoonal rainfall over Termination I. peaks in Mg/Ca coincide with the two growth discontinuities
This is corroborated by Mg/Ca precipitation proxy data, showing and thus dry periods. This interpretation is supported by nu-
its lowest values in the YD, where growth rate is highest, with a merous studies that showed a negative correlation between
decreasing trend over the end of the last glacial period. DCF shows Mg/Ca ratio in stalagmite calcite and precipitation amount
an obvious decreasing trend after the LGM until it increases at the (Fairchild and Treble, 2009; Flohr et al., 2017; Noronha et
onset of YD. δ 18 O reaches its lowest values during the B/A warm
al., 2014; Warken et al., 2018).
period, indicating an intensified monsoonal precipitation (Shakun et
al., 2007).
δ 234 Uinit can also be used to derive changes in infiltration
and thus drip rate (Dreybrodt, 1999). In our study, the in-
creasing but still negative values in δ 234 Uinit (Fig. 7e) after
22 kyr BP point to a shift towards less leached host rocks or a
ence of (aging) organic matter in the soil above the cave is stronger contribution of excess 234 U from the leached rocks.
corroborated by several studies describing the modern veg- This change coincides with a doubling of the growth rate
etation on Socotra Island and its limestone plateaus (Mies from slightly below 0.10 to more than 0.20 mm yr−1 , sug-
and Beyhl, 1998; Popov, 2008). They observed a mixture gesting that δ 234 Uinit is influenced by infiltration changes.
of annual grass vegetation and permanent scrubland on the It may also be affected by the geochemical composition of
limestone plateaus as well as populations of the endemic the seepage water (Zhou et al., 2005). However, in com-
Dracaena cinnabari species. Moreover, in sheltered valleys, parison to the other proxies for this record, it appears most
where the soil is well developed, dense thickets occur. In the likely that the drip rate in Moomi Cave has increased due to
rocky surface on the limestone plateaus, pockets of dark rich higher net infiltration. Therefore, our record contrasts with
soil can form (Popov, 2008), giving rise to stabilizing carbon the findings of Dreybrodt (1999) and Kaufmann and Drey-
pools, where soil matter can aggregate and decay over long brodt (2004) where higher drip rate is correlated to increased
periods, thus contributing to the soil CO2 reservoir. stalagmite width. Stalagmite M1-5, on the other hand, de-
Together with nearly closed-system karst dissolution con- creases in width (see Fig. 2) towards higher infiltration in
ditions, the 14 C-depleted CO2 can cause DCF values higher a time where temperatures have increased by 2–3.5 ◦ C and
Clim. Past, 16, 409–421, 2020 www.clim-past.net/16/409/2020/S. Therre et al.: Climate-induced speleothem radiocarbon variability 417 precipitation rises (Shakun et al., 2007). This climatic shift contribution by CO2 , which originates from the decomposi- is initiated during peak glacial conditions at 20 kyr BP, and tion of aged SOM. This decoupling of precipitation and DCF it is also reflected in higher seepage water excess 234 U, as is evidence for a climate-induced forcing on stalagmite 14 C, marked through the vanishing depletion of 234 U (−25 ‰ af- which is at least to some extent independent of the direct ter 16 kyr BP). influence of soil humidity on calcite dissolution. On Soco- The inferred increase in precipitation over Socotra Is- tra Island the precipitation is sparse and occurs only season- land after the LGM coincides with the steady warming of ally when the ITCZ crosses the archipelago. A proposed sce- the Southern Hemisphere until 15 kyr BP. Synchronously, nario for the interpretation of M1-5 is that the vegetation in δ 13 C decreases by 2 ‰ and reveals sub-centennial variabil- (semi)arid regions like Socotra Island (in contrast to temper- ity of the speleothem calcite composition. During the time ate, more humid settings) is much more sensitive to small in which the Northern Hemisphere climate goes through changes in net infiltration. Previous studies showed that an swings between the warm and humid B/A and cold and dry increased monsoonal activity during Termination I (Gupta et YD (Ivanochko et al., 2005; Schulz et al., 1998), δ 13 C and al., 2003; Overpeck et al., 1996; Shakun et al., 2007) can Mg/Ca in M1-5 remain at their respective lowest values. In have dramatic effects on the prevalence and spread of plants contrast to δ 13 C values, the δ 18 O values show a moderate de- in arid and semiarid areas (Lotsch et al., 2003). Hence, for crease of 1.5 ‰ across Termination I (20–11 kyr BP), which this study, an increase in soil CO2 input by active vegetation occurs rather suddenly at ∼ 14.8–15 kyr BP. Stalagmite M1- caused by increasing net infiltration or precipitation at the 5 δ 18 O values are mainly interpreted in terms of the so-called end of the last glacial period is most likely the cause for the “amount effect”, describing the negative correlation between observed soil carbon dynamics, ultimately causing strongly rainfall amount and δ 18 O (Dykoski et al., 2005; Griffiths et decreased DCF. al., 2010). Shakun et al. (2007) have used this relation to in- Since the ITCZ passes Socotra Island twice a year, caus- fer a rise in rainfall towards the end of the last glacial, es- ing increased precipitation, the question that arises is whether pecially after 15 kyr BP. Both stable isotopes thus share a the observed trends are linked to a shift in the seasonal pat- common deglacial climate trend with punctuated strong cor- terns of either summer or winter monsoon season or the relation during growth perturbations (dry events), but they intermediate ITCZ migration. Overall, we can only specu- differ significantly through the period from 19 to 14 kyr BP, late on the role of the monsoon in shifting the local climate indicating a dominant influence of vegetation above the cave from a glacial, possibly Southern Hemisphere-driven, state which affected δ 13 C but not δ 18 O. The decoupling of δ 18 O with a stable state aged soil carbon pool (summer-monsoon- and δ 13 C might also be a representation of regional moisture driven) to a Northern Hemisphere (or mixed) state beyond dynamics as described by Cheng et al. (2016) for a monsoon 15.5 kyr BP with an increasingly labile non-steady-state soil stalagmite record from central Asia. In that study, the corre- carbon age profile. lation of δ 13 C and Mg/Ca in combination with out-of-phase Consequently, we have traced a clear multimillennial in- δ 18 O suggested wetter hydrological conditions, but not nec- crease in precipitation on the archipelago from the LGM to essarily an increase in precipitation amount. Similar observa- the 15 kyr Northern Hemisphere sudden warming, which is tions were made by Myers et al. (2015) for northeastern In- accompanied by major changes in soil activity and thus veg- dian stalagmites where δ 18 O was attributed to reflect changes etation. in monsoonal moisture transport routes or sources rather than rainfall amount. On Socotra Island, seasonal shifts to- 5.4 Glacial termination climate dynamics on Socotra wards more distributed rainfall at the end of the last glacial Island may have changed the soil net infiltration without significant amount changes visible in δ 18 O, and thus they cause wetter Beyond the strong B/A warming, the tracers resolve sub- conditions above Moomi Cave. centennial variability of DCF, δ 234 Uinit , and Mg/Ca. This is Although all available proxies point to an increase in pre- possibly indicative of a strong local climate–monsoon cou- cipitation or net infiltration after the LGM, M1-5 14 C data do pling that is only resolved in the area with the highest tem- not reflect the processes predicted if the established depen- poral data density in the record. Nonetheless, one striking dence of calcite dissolution systematics on soil infiltration feature stands out: at approximately 13 kyr BP, DCF abruptly holds. In contrast to studies from zones more humid when jumps to values higher than 40 %, indicating sudden changes compared to Socotra Island (Genty et al., 2001; Griffiths et in soil carbon cycling. It was argued that sudden events al., 2012; Lechleitner et al., 2016; Noronha et al., 2014), the caused by climatic variations or wildfires can have a ma- predicted positive feedback of rainfall amount on DCF does jor influence on soil carbon dynamics (Treble et al., 2016; not appear to apply here. Instead, increasing rainfall and the Trumbore, 2009). For instance, an event like a wildfire or respective increase in infiltration seem to go along with a landslide could have drastically changed the soil configu- shift to a less closed carbonate dissolution system and an ration by depleting active vegetation and thus halting CO2 increased forcing towards higher 14 C levels in the soil gas input at near-atmospheric 14 C/12 C ratios (Coleborn et al., CO2 by enhanced root respiration compared to a decreasing 2016; Markowska et al., 2019), and it could, therefore, ac- www.clim-past.net/16/409/2020/ Clim. Past, 16, 409–421, 2020
418                                                          S. Therre et al.: Climate-induced speleothem radiocarbon variability

                                                                       6   Conclusions

                                                                       Stalagmite M1-5 from Moomi Cave, Socotra Island, might at
                                                                       face value seem similar to other speleothems that have been
                                                                       used for atmospheric 14 C calibration. Precise U-series dating
                                                                       revealed an overall growth rate of more than 0.13 mm yr−1 .
                                                                       The geographical setting in a subtropical climate in the west-
                                                                       ern Arabian Sea under the influence of the East African–
                                                                       Indian monsoon is comparable to those of the Bahamas
                                                                       and Hulu Cave speleothems (Beck et al., 2001; Hoffmann
                                                                       et al., 2010; Southon et al., 2012) that have contributed
                                                                       to 14 C calibration. However, the DCF values of M1-5 are
Figure 8. DCF and Mg/Ca of stalagmite M1-5 for the YD (gray            very high, being among the highest that have been re-
area). DCF increases sharply at the onset of the YD (red arrow).
                                                                       ported, and additionally show distinct trends over the entire
The high data resolution reveals pronounced changes in DCF on ex-
                                                                       growth period of the stalagmite, thus proving the climatic
tremely short time periods, highlighting the vast soil dynamics dur-
ing the YD where growth rate was very high (> 0.20 mm yr−1 ). The      impact on speleothem 14 C. Large short-term DCF changes
hydrological proxy Mg/Ca ratio remains relatively low, indicating      on sub-centennial timescales emphasize the importance of
a high infiltration rate. The correlation between DCF and Mg/Ca        local carbon-cycling variability on stalagmite 14 C. Whereas
ratio is insignificant in this time (r 2 = 0.23, p < 0.01).            the Hulu Cave record (Cheng et al., 2018; Southon et al.,
                                                                       2012), with its low DCF that remains constant even dur-
                                                                       ing pronounced climate changes, has been referred to as the
count for the sudden increase in DCF. Except for short-term            “Holy Grail of 14 C dating”, records like M1-5 are crucial
excursions, all other proxies remain at virtually the same lev-        for the understanding of soil carbon cycling and karst hydro-
els on average over the event with Mg/Ca ratios indicating             geochemistry.
persistent high precipitation during the YD. Hence, this fea-             We conclude that M1-5 grew under near-closed conditions
ture of the M1-5 record is only visible in the 14 C data.              with a high influence of aged SOM prevailing throughout the
   The high-resolution data from speleothem M1-5 (exempli-             LGM. This causes the DCF to exceed its theoretical maxi-
fied by DCF and Mg/Ca records in Fig. 8) reveal marked                 mum of 50 % before increasing precipitation and wetter con-
variability in DCF on sub-centennial timescales, exempli-              ditions triggered a gradual increase in 14 C-enriched CO2 in-
fied by a sudden decrease of almost 10 % within less than              put, most likely caused by denser vegetation coverage on the
100 years. Several of these peaks can be seen throughout the           plateau above the cave.
whole period of high temporal resolution, although they are               With most proxies pointing to a higher net-infiltration rate
not represented in Mg/Ca variations, and correlation in this           towards Termination I, M1-5 shows a trend opposed to pre-
period is insignificant (r 2 = 0.231, p < 0.01). The high DCF          vious observations, suggesting a positive correlation between
volatility suggests a pronounced influence of local effects on         soil humidity and DCF due to the influence of hydrology on
the soil carbon dynamics on the Moomi Plateau. Other prox-             carbonate dissolution. Rather, the data reveal a probable in-
ies, while still showing some sub-centennial variability, do           tensified vegetation occurrence on the Moomi Plateau, caus-
not suggest a persistent change for the YD. δ 13 C values re-          ing a higher influx of CO2 at high 14 C levels into the soil gas
main at comparable levels at the end of the glacial period,            regime that shifts DCF to lower levels. These findings moti-
which indicates a high influence of organic or biogenic CO2            vate the implementation of 14 C in stalagmites as a tracer for
on stalagmite formation and contradicts enhanced limestone             vegetation and emphasize the distinction between temperate
carbonate dissolution. δ 18 O values remain roughly within             and humid settings and semiarid or arid regions when assess-
the state which suggests intensified precipitation during B/A,         ing the influence of precipitation changes on DCF in stalag-
which was attributed to a stronger monsoon (Shakun et al.,             mites. Soil carbon dynamics and the influence of vegetation
2007). Hence, a persistent change in climatic conditions on            and SOM seem to exert significant forcings on DCF, exem-
Socotra Island appears not likely for the YD. Although from            plified in our record by both the long-term trend towards Ter-
our data we cannot conclusively derive the direct cause for            mination I and the significant variability on sub-centennial
the observed fluctuations in DCF, which are not represented            timescales during the YD.
in hydrological proxies, we propose that labile conditions of             Our work is an important contribution to future efforts to
the soil carbon pool above the cave or short-term changes in           understand soil dynamics and their connection to stalagmite
carbonate dissolution systematics might have played a vital            DCF, in particular as this bears on the search for suitable 14 C
role.                                                                  calibration records.

Clim. Past, 16, 409–421, 2020                                                                      www.clim-past.net/16/409/2020/
S. Therre et al.: Climate-induced speleothem radiocarbon variability 419
Data availability. The data presented in this paper were up- topes and dead carbon proportion (DCP) in a near-closed-
loaded to the PANGAEA data library and are available at system situation: An interplay between sulphuric and carbonic
https://doi.org/10.1594/PANGAEA.906003 (Therre et al., 2019). acid dissolution, Geochim. Cosmochim. Ac., 210, 208–227,
https://doi.org/10.1016/j.gca.2017.04.038, 2017.
Beck, J. W., Richards, D. A., Edwards, R. L., Silverman, B.
Author contributions. The scientific project was designed and W., Smart, P. L., Donahue, D. J., Hererra-Osterheld, S.,
conducted by ST, JF, and NF. ST performed the sampling for all Burr, G. S., Calsoyas, L., Jull, A. J. T., and Biddulph,
measurements and the data evaluation and wrote the paper with D.: Extremely large variations of atmospheric 14 C concentra-
contributions by the other co-authors. JA performed the U-series tion during the last glacial period, Science, 292, 2453–2458,
measurements and quality assessment. AM and SJB played a major https://doi.org/10.1126/science.1056649, 2001.
role in the investigations and expedition that led to the collection Burns, S. J.: Indian Ocean Climate and an Absolute Chronology
of the stalagmite. RF conducted the 14 C measurements. ASR per- over Dansgaard/Oeschger Events 9 to 13, Science, 301, 1365–
formed the elemental measurements. All co-authors contributed to 1367, https://doi.org/10.1126/science.1086227, 2003.
the discussion of the results and interpretations. Cheng, H., Edwards, R. L., Hoff, J., Gallup, C. D., Richards, D. A.,
and Asmerom, Y.: The half-lives of uranium-234 and thorium-
230, Chem. Geol., 169, 17–33, https://doi.org/10.1016/S0009-
Competing interests. The authors declare that they have no con- 2541(99)00157-6, 2000.
flict of interest. Cheng, H., Spötl, C., Breitenbach, S. F. M., Sinha, A., Wassen-
burg, J. A., Jochum, K. P., Scholz, D., Li, X., Yi, L., Peng,
Y., Lv, Y., Zhang, P., Votintseva, A., Loginov, V., Ning, Y.,
Kathayat, G., and Edwards, R. L.: Climate variations of Cen-
Acknowledgements. We thank René Eichstädter at the Institute
tral Asia on orbital to millennial timescales, Sci. Rep., 6, 36975,
of Environmental Physics for conducting the MC-ICP-MS mea-
https://doi.org/10.1038/srep36975, 2016.
surements with the help of Sandra Rybakiewicz, Hanna Rosenthal,
Cheng, H., Lawrence Edwards, R., Southon, J., Matsumoto,
and Carla Roesch, as well as Marleen Lausecker for the ICPQMS
K., Feinberg, J. M., Sinha, A., Zhou, W., Li, H., Li,
measurements. We are grateful to Silvia Rheinberger and Chris-
X., Xu, Y., Chen, S., Tan, M., Wang, Q., Wang, Y., and
tian Scholz for the elemental measurements at the Institute of Earth
Ning, Y.: Atmospheric 14 C/12 C changes during the last
Sciences at Heidelberg University. We thank Evan C. Border for his
glacial period from Hulu Cave, Science, 362, 1293–1297,
help concerning the language of the article.
https://doi.org/10.1126/science.aau0747, 2018.
The authors are very grateful to the editor Luke Skinner and to
Coleborn, K., Spate, A., Tozer, M., Andersen, M. S., Fairchild, I.
two anonymous referees for their constructive feedback and sug-
J., MacKenzie, B., Treble, P. C., Meehan, S., Baker, A., and
gestions. Their comments considerably improved the quality of our
Baker, A.: Effects of wildfire on long-term soil CO2 concentra-
article.
tion: implications for karst processes, Environ. Earth Sci., 75,
330, https://doi.org/10.1007/s12665-015-4874-9, 2016.
DiNezio, P. N., Tierney, J. E., Otto-Bliesner, B. L., Timmermann,
Financial support. This research has been supported by the DFG A., Bhattacharya, T., Rosenbloom, N., and Brady, E.: Glacial
(grant nos. FR1341/4-1, FO809/2-1 and INST35-1143-1 FUGG). changes in tropical climate amplified by the Indian Ocean, Sci.
This project is TiPES contribution no. 14: this project has received Adv., 4, 12, https://doi.org/10.1126/sciadv.aat9658, 2018.
funding from the European Union’s Horizon 2020 research and in- Douville, E., Sallé, E., Frank, N., Eisele, M., Pons-Branchu,
novation programme under grant agreement no. 820970. E., and Ayrault, S.: Rapid and accurate U-Th dating
of ancient carbonates using inductively coupled plasma-
quadrupole mass spectrometry, Chem. Geol., 272, 1–11,
Review statement. This paper was edited by Luke Skinner and https://doi.org/10.1016/j.chemgeo.2010.01.007, 2010.
reviewed by two anonymous referees. Dreybrodt, W.: Chemical kinetics, speleothem growth and cli-
mate, Boreas, 28, 347–356, https://doi.org/10.1111/j.1502-
3885.1999.tb00224.x, 1999.
References Dykoski, C. A., Edwards, R. L., Cheng, H., Yuan, D., Cai, Y.,
Zhang, M., Lin, Y., Qing, J., An, Z., and Revenaugh, J.: A high-
Adolphi, F., Muscheler, R., Friedrich, M., Güttler, D., Wacker, resolution, absolute-dated Holocene and deglacial Asian mon-
L., Talamo, S., and Kromer, B.: Radiocarbon calibration uncer- soon record from Dongge Cave, China, Earth Planet. Sc. Lett.,
tainties during the last deglaciation: Insights from new float- 233, 71–86, https://doi.org/10.1016/j.epsl.2005.01.036, 2005.
ing tree-ring chronologies, Quaternary Sci. Rev., 170, 98–108, Fairchild, I. J. and Treble, P. C.: Trace elements in speleothems
https://doi.org/10.1016/j.quascirev.2017.06.026, 2017. as recorders of environmental change, Quaternary Sci. Rev., 28,
Arnold, J. R. and Libby, W. F.: Age determinations by radiocarbon 449–468, https://doi.org/10.1016/j.quascirev.2008.11.007, 2009.
content: Checks with samples of known age, Science, 110, 678– Fairchild, I. J., Borsato, A., Tooth, A. F., Frisia, S., Hawkesworth,
680, https://doi.org/10.1126/science.110.2869.678, 1949. C. J., Huang, Y., McDermott, F., and Spiro, B.: Controls on trace
Arps, J.: Towards ε-Precision of U-series Age Determinations of element (Sr-Mg) compositions of carbonate cave waters: Impli-
Secondary Carbonates, Heidelberg University, 2017. cations for speleothem climatic records, Chem. Geol., 166, 255–
Bajo, P., Borsato, A., Drysdale, R., Hua, Q., Frisia, S., Zanchetta, 269, https://doi.org/10.1016/S0009-2541(99)00216-8, 2000.
G., Hellstrom, J., and Woodhead, J.: Stalagmite carbon iso-
www.clim-past.net/16/409/2020/ Clim. Past, 16, 409–421, 2020420 S. Therre et al.: Climate-induced speleothem radiocarbon variability Fleitmann, D., Burns, S. J., Mudelsee, M., Neff, U., Kramers, J., the early Younger Dryas, Quaternary Sci. Rev., 28, 2982–2990, Mangini, A., and Matter, A.: Holocene forcing of the Indian https://doi.org/10.1016/j.quascirev.2009.08.013, 2009. monsoon recorded in a stalagmite from southern Oman, Science, Ivanochko, T. S., Ganeshram, R. S., Brummer, G. J. A., Ganssen, 300, 1737–9, https://doi.org/10.1126/science.1083130, 2003. G., Jung, S. J. A., Moreton, S. G., and Kroon, D.: Variations Fleitmann, D., Burns, S. J., Mangini, A., Mudelsee, M., in tropical convection as an amplifier of global climate change Kramers, J., Villa, I., Neff, U., Al-Subbary, A. A., Buet- at the millennial scale, Earth Planet. Sc. Lett., 235, 302–314, tner, A., Hippler, D., and Matter, A.: Holocene ITCZ and In- https://doi.org/10.1016/j.epsl.2005.04.002, 2005. dian monsoon dynamics recorded in stalagmites from Oman Kaufmann, G.: Stalagmite growth and palaeo-climate: The nu- and Yemen (Socotra), Quaternary Sci. Rev., 26, 170–188, merical perspective, Earth Planet. Sc. Lett., 214, 251–266, https://doi.org/10.1016/j.quascirev.2006.04.012, 2007. https://doi.org/10.1016/S0012-821X(03)00369-8, 2003. Flohr, P., Fleitmann, D., Zorita, E., Sadekov, A., Cheng, H., Bo- Kaufmann, G. and Dreybrodt, W.: Stalagmite growth and palaeo- somworth, M., Edwards, L., Matthews, W., and Matthews, R.: climate: An inverse approach, Earth Planet. Sc. Lett., 224, 529– Late Holocene droughts in the Fertile Crescent recorded in a 545, https://doi.org/10.1016/j.epsl.2004.05.020, 2004. speleothem from northern Iraq, Geophys. Res. Lett., 44, 1528– Kromer, B., Lindauer, S., Synal, H. A., and Wacker, L.: MAMS – 1536, https://doi.org/10.1002/2016GL071786, 2017. A new AMS facility at the Curt-Engelhorn-Centre for Achaeom- Fohlmeister, J., Kromer, B., and Mangini, A.: The influence of etry, Mannheim, Germany, Nucl. Instrum. Meth. B, 294, 11–13, soil organic matter age spectrum on the reconstruction of at- https://doi.org/10.1016/j.nimb.2012.01.015, 2013. mospheric 14 C levels via stalagmites, Radiocarbon, 53, 99–115, Lechleitner, F. A., Baldini, J. U. L., Breitenbach, S. F. M., Fohlmeis- https://doi.org/10.1017/S003382220003438X, 2011. ter, J., Mcintyre, C., Goswami, B., Jamieson, R. A., van der Genty, D., Massault, M., Gilmour, M., Baker, A., Verheyden, S., Voort, T. S., Prufer, K., Marwan, N., Culleton, B. J., Kennett, and Kepens, E.: Calculation of past dead carbon proportion and D. J., Asmerom, Y., Polyak, V., and Eglinton, T. I.: Hydrological variability by the comparison of AMS(14)C and TIMS U/Th and climatological influences on a very high resolution tropical ages on two holocene stalagmites, Radiocarbon, 41, 251–270, stalagmite radiocarbon record, Geochim. Cosmochim. Ac., 194, https://doi.org/10.1017/S003382220005712X, 1999. 233–252, https://doi.org/10.1016/j.gca.2016.08.039, 2016. Genty, D., Baker, A., Massault, M., Proctor, C., Gilmour, Lotsch, A., Friedl, M. A., Anderson, B. T., and Tucker, C. M., Pons-Branchu, E., and Hamelin, B.: Dead carbon in J.: Coupled vegetation-precipitation variability observed from stalagmites: Carbonate bedrock paleodissolution vs. ageing satellite and climate records, Geophys. Res. Lett., 30, 14, of soil organic matter. Implications for 13 C variations in https://doi.org/10.1029/2003GL017506, 2003. speleotherms, Geochim. Cosmochim. Ac., 65, 3443–3457, Markowska, M., Fohlmeister, J., Treble, P. C., Baker, A., An- https://doi.org/10.1016/S0016-7037(01)00697-4, 2001. dersen, M. S., and Hua, Q.: Modelling the 14 C bomb- Griffiths, M. L., Drysdale, R. N., Gagan, M. K., Frisia, S., Zhao, J. pulse in young speleothems using a soil carbon contin- xin, Ayliffe, L. K., Hantoro, W. S., Hellstrom, J. C., Fischer, M. uum model, Geochim. Cosmochim. Ac., 261, 342–367, J., Feng, Y. X., and Suwargadi, B. W.: Evidence for Holocene https://doi.org/10.1016/J.GCA.2019.04.029, 2019. changes in Australian-Indonesian monsoon rainfall from sta- Mies, B. and Beyhl, F. E.: The vegetation ecology of Soqotra, in: lagmite trace element and stable isotope ratios, Earth Planet. Proceedings of the First International Symposium on Soqotra Is- Sc. Lett., 292, 27–38, https://doi.org/10.1016/j.epsl.2010.01.002, land: Present and Future, Aden (March 1996), edited by: Du- 2010. mont, H., Vol. 1, 35–82, United Nations Publications, Global Griffiths, M. L., Fohlmeister, J., Drysdale, R. N., Hua, Q., John- Environment Facility, Conservation and Sustainable Use of Bio- son, K. R., Hellstrom, J. C., Gagan, M. K., and Zhao, J. diversity of Soqotra Archipelago, Vol. 1, ISBN 90-804341-1-6, x.: Hydrological control of the dead carbon fraction in a New York, NY, USA, 1998. Holocene tropical speleothem, Quat. Geochronol., 14, 81–93, Myers, C. G., Oster, J. L., Sharp, W. D., Bennartz, R., Kelley, N. https://doi.org/10.1016/j.quageo.2012.04.001, 2012. P., Covey, A. K., and Breitenbach, S. F. M.: Northeast Indian Gupta, A. K., Anderson, D. M., and Overpeck, J. T.: Abrupt stalagmite records Pacific decadal climate change: Implications changes in the Asian southwest monsoon during the holocene for moisture transport and drought in India, Geophys. Res. Lett., and their links to the North Alantic Ocean, Nature, 421, 354– 42, 4124–4132, https://doi.org/10.1002/2015GL063826, 2015. 357, https://doi.org/10.1038/nature01340, 2003. Noronha, A. L., Johnson, K. R., Hu, C., Ruan, J., Southon, J. R., and Hendy, C.: The isotopic geochemistry of speleothems – I. The cal- Ferguson, J. E.: Assessing influences on speleothem dead car- culation of the effects of different modes of formaion on the iso- bon variability over the Holocene: Implications for speleothem- topic composition of speleothems and their applicability as pa- based radiocarbon calibration, Earth Planet. Sc. Lett., 394, 20– leoclimatic indicators, Geochim. Cosmochim. Ac., 35, 801–824, 29, https://doi.org/10.1016/j.epsl.2014.03.015, 2014. https://doi.org/10.1016/0016-7037(71)90127-X, 1971. Overpeck, J., Anderson, D., Trumbore, S., and Prell, W.: The south- Hoffmann, D. L., Beck, J. W., Richards, D. A., Smart, P. west Indian Monsoon over the last 18000 years, Clim. Dynam., L., Singarayer, J. S., Ketchmark, T., and Hawkesworth, C. 12, 213–225, https://doi.org/10.1007/BF00211619, 1996. J.: Towards radiocarbon calibration beyond 28 ka using Popov, G. B.: The vegetation of Socotra, Bot. J. Linn. Soc., 55, 706– speleothems from the Bahamas, Earth Planet. Sc. Lett., 289, 1– 720, https://doi.org/10.1111/j.1095-8339.1957.tb00031.x, 2008. 10, https://doi.org/10.1016/j.epsl.2009.10.004, 2010. Reimer, P. J., Bard, E., Bayliss, A., Beck, J. W., Blackwell, P. Hua, Q., Barbetti, M., Fink, D., Kaiser, K. F., Friedrich, M., Kromer, G., Bronk Ramsey, C., Buck, C. E., Cheng, H., Edwards, R. B., Levchenko, V. A., Zoppi, U., Smith, A. M., and Bertuch, L., Friedrich, M., Grootes, P. M., Guilderson, T. P., Haflida- F.: Atmospheric 14 C variations derived from tree rings during son, H., Hajdas, I., Hatté, C., Heaton, T. J., Hoffmann, D. L., Clim. Past, 16, 409–421, 2020 www.clim-past.net/16/409/2020/
You can also read


