Inverse modelling of CH4 emissions for 2010-2011 using different satellite retrieval products from GOSAT and SCIAMACHY
←
→
Page content transcription
If your browser does not render page correctly, please read the page content below
Atmos. Chem. Phys., 15, 113–133, 2015
www.atmos-chem-phys.net/15/113/2015/
doi:10.5194/acp-15-113-2015
© Author(s) 2015. CC Attribution 3.0 License.

Inverse modelling of CH4 emissions for 2010–2011 using different
satellite retrieval products from GOSAT and SCIAMACHY
M. Alexe1 , P. Bergamaschi1 , A. Segers2 , R. Detmers3 , A. Butz9 , O. Hasekamp3 , S. Guerlet3 , R. Parker4 , H. Boesch4 ,
C. Frankenberg5 , R. A. Scheepmaker3 , E. Dlugokencky6 , C. Sweeney6,7 , S. C. Wofsy8 , and E. A. Kort10
1 European  Commission, Joint Research Centre, Institute for Environment and Sustainability, Air and Climate Unit, Ispra, Italy
2 Netherlands  Organisation for Applied Scientific Research (TNO), Utrecht, the Netherlands
3 Netherlands Institute for Space Research (SRON), Utrecht, the Netherlands
4 Earth Observation Science Group, Space Research Centre, University of Leicester, Leicester, UK
5 Jet Propulsion Laboratory, California Institute of Technology, Pasadena, California, USA
6 Global Monitoring Division, NOAA Earth System Research Laboratory, Boulder, Colorado, USA
7 CIRES, University of Colorado, Boulder, Colorado, USA
8 School of Engineering and Applied Science and Department of Earth and Planetary Sciences, Harvard University,

Cambridge, Massachusetts, USA
9 Karlsruhe Institute of Technology (KIT), Karlsruhe, Germany
10 Department of Atmospheric, Oceanic and Space Sciences, University of Michigan, Michigan, USA

Correspondence to: M. Alexe (mihai.alexe@jrc.ec.europa.eu)

Received: 13 March 2014 – Published in Atmos. Chem. Phys. Discuss.: 8 May 2014
Revised: 31 October 2014 – Accepted: 21 November 2014 – Published: 9 January 2015

Abstract. At the beginning of 2009 new space-borne obser-         independently by the Netherlands Institute for Space Re-
vations of dry-air column-averaged mole fractions of atmo-        search (SRON)/Karlsruhe Institute of Technology (KIT), and
spheric methane (XCH4 ) became available from the Thermal         the University of Leicester (UL), and the RemoTeC “Full-
And Near infrared Sensor for carbon Observations–Fourier          Physics” (FP) XCH4 retrievals available from SRON/KIT.
Transform Spectrometer (TANSO-FTS) instrument on board            The GOSAT-based inversions show significant reductions in
the Greenhouse Gases Observing SATellite (GOSAT). Until           the root mean square (rms) difference between retrieved and
April 2012 concurrent methane (CH4 ) retrievals were pro-         modelled XCH4 , and require much smaller bias corrections
vided by the SCanning Imaging Absorption spectroMeter             compared to the inversion using SCIAMACHY retrievals,
for Atmospheric CartograpHY (SCIAMACHY) instrument                reflecting the higher precision and relative accuracy of the
on board the ENVironmental SATellite (ENVISAT). The               GOSAT XCH4 . Despite the large differences between the
GOSAT and SCIAMACHY XCH4 retrievals can be com-                   GOSAT and SCIAMACHY retrievals, 2-year average emis-
pared during the period of overlap. We estimate monthly           sion maps show overall good agreement among all satellite-
average CH4 emissions between January 2010 and Decem-             based inversions, with consistent flux adjustment patterns,
ber 2011, using the TM5-4DVAR inverse modelling system.           particularly across equatorial Africa and North America.
In addition to satellite data, high-accuracy measurements         Over North America, the satellite inversions result in a sig-
from the Cooperative Air Sampling Network of the Na-              nificant redistribution of CH4 emissions from North-East to
tional Oceanic and Atmospheric Administration Earth Sys-          South-Central United States. This result is consistent with
tem Research Laboratory (NOAA ESRL) are used, provid-             recent independent studies suggesting a systematic under-
ing strong constraints on the remote surface atmosphere.          estimation of CH4 emissions from North American fossil
We discuss five inversion scenarios that make use of dif-         fuel sources in bottom-up inventories, likely related to nat-
ferent GOSAT and SCIAMACHY XCH4 retrieval products,               ural gas production facilities. Furthermore, all four satellite
including two sets of GOSAT proxy retrievals processed            inversions yield lower CH4 fluxes across the Congo basin

Published by Copernicus Publications on behalf of the European Geosciences Union.
114                                                     M. Alexe et al.: Inverse modelling of CH4 emissions for 2010–2011

compared to the NOAA-only scenario, but higher emissions         aschi et al., 2013a; Houweling et al., 1999; Bousquet et al.,
across tropical East Africa. The GOSAT and SCIAMACHY             2006; Hein et al., 1997; Mikaloff Fletcher et al., 2004a, b).
inversions show similar performance when validated against       Smaller-scale regional patterns, however, largely remain de-
independent shipboard and aircraft observations, and XCH4        termined by the prior emission inventories (due to lack of
retrievals available from the Total Carbon Column Observing      observations).
Network (TCCON).                                                    Since 2002, satellite retrievals of total-column CH4 mix-
                                                                 ing ratios have been available from the SCanning Imag-
                                                                 ing Absorption spectroMeter for Atmospheric CHartogra-
                                                                 phY (SCIAMACHY) instrument on board the ENVironmen-
1   Introduction                                                 tal SATellite, ENVISAT (Frankenberg et al., 2005, 2006,
                                                                 2008, 2011; Buchwitz et al., 2005; Schneising et al., 2012).
Atmospheric methane (CH4 ) is the second-most important          The SCIAMACHY data were the first space-borne XCH4 re-
anthropogenic greenhouse gas (GHG) – after carbon dioxide        trievals sensitive to the atmospheric boundary layer. This new
(CO2 ) – in terms of net radiative forcing (RF). Emissions of    data set, along with an extension in data coverage to previ-
CH4 have caused an RF of 0.97 W m−2 (Stocker et al., 2013),      ously observation-poor areas, such as the tropics, led to the
about twice the concentration-based estimate (0.48 W m−2 ).      first global and regional inversions of CH4 fluxes (Bergam-
After a period of stabilization from 1999 to 2006 (Dlugo-        aschi et al., 2007, 2009; Frankenberg et al., 2008; Meirink
kencky et al., 2003; Simpson et al., 2006), CH4 concentra-       et al., 2008a). Due to the relatively long operational life-
tions in the atmosphere have started to rise again (Dlugo-       time of SCIAMACHY (almost one decade), the XCH4 re-
kencky et al., 2009; Rigby et al., 2008; Nisbet et al., 2014),   trievals from this instrument were useful for analysing the
and are currently estimated to be 160 % higher than pre-         interannual CH4 variability (IAV) during this period (Berga-
industrial (1750) values (WMO, 2013). Previous research has      maschi et al., 2013a). However, the impact of the serious
identified the main sources and sinks of atmospheric CH4 ;       detector pixel degradation, which occurred at the end of
however, there remain considerable uncertainties regarding       2005, remains difficult to evaluate, despite overall consis-
their relative importance (Kirschke et al., 2013).               tency of the SCIAMACHY time series with surface obser-
   Since large-scale regional or global CH4 fluxes cannot        vations (Frankenberg et al., 2011).
be directly measured, attempts at estimating these quantities       Since 2009, XCH4 retrievals have also become available
have traditionally relied on two complementary techniques:       from the Greenhouse Gases Observing SATellite (GOSAT)
“bottom-up” emission inventories, and inverse modelling          Thermal And Near infrared Sensor for carbon Observations–
(“top-down”). Bayesian inverse modelling (Tarantola, 2004)       Fourier Transform Spectrometer (TANSO-FTS) instrument
of CH4 emissions operates under a well-defined mathemat-         (Parker et al., 2011; Yoshida et al., 2011; Butz et al., 2011).
ical framework that combines a priori information on CH4         Given the limited lifetime of satellite instruments (the com-
emissions, atmospheric observations, and an atmospheric          munication link to ENVISAT was lost in April 2012, while
chemistry and transport model (CTM), to yield a statistical      the GOSAT mission plans extend only until 2014), inverse
best estimate of CH4 emissions and concentrations over the       modelling comparison studies using different satellite re-
time period of interest. The quality of the estimates obtained   trievals are of great importance for understanding the dif-
through inverse modelling depends in large part on the qual-     ference between products. Such analyses are a crucial step
ity of the observation data available for the spatial and tem-   when using satellite data to analyse IAV and trends. Within
poral domains of interest, and on the quality of the CTM.        the European project Monitoring Atmospheric Composi-
   Surface measurements of CH4 concentrations are available      tion and Climate – Interim Implementation (MACC-II) pre-
from global networks such as the Cooperative Air Sampling        operational “delayed-mode” CH4 flux inversions are per-
Network of the National Oceanic and Atmospheric Admin-           formed, which are updated every six months (Bergamaschi
istration Earth System Research Laboratory (NOAA ESRL)           et al., 2013b). Beginning in 2012 the assimilated satellite data
(Dlugokencky et al., 1994, 2009, 2013). However, surface         set changed from SCIAMACHY IMAPv5.5 to GOSAT Re-
observations provide only sparse global coverage, with the       moTeC v2.0 (Bergamaschi et al., 2013b). Furthermore, alter-
exception of certain regions, mainly Europe and North Amer-      native XCH4 products from GOSAT and SCIAMACHY have
ica, where regional monitoring stations, including tall towers   been developed within the European Space Agency GHG
and aircraft profiles, have been set up in recent years (e.g.    Climate Change Initiative (ESA-GHG CCI) project (Buch-
Vermeulen et al., 2007). Surface measurements provide ef-        witz et al., 2013).
fective constraints on regional emissions (Bergamaschi et al.,      This study will present a detailed comparison of global
2010; Kort et al., 2008; Miller et al., 2013); however, they     CH4 flux inversions constrained by different GOSAT and
are not available in many important emission regions, such       SCIAMACHY retrieval products and surface measurements,
as the tropics. Inversions based on global background sites      covering the 2-year period between January 2010 and De-
have provided a good picture of global and continental CH4       cember 2011. The availability of multiple satellite retrieval
emissions, their trends, and inter-annual variability (Bergam-   products covering the same time interval allows for a de-

Atmos. Chem. Phys., 15, 113–133, 2015                                              www.atmos-chem-phys.net/15/113/2015/
M. Alexe et al.: Inverse modelling of CH4 emissions for 2010–2011 115
Table 1. Satellite data used in the inversions.
Satellite/Instrument Algorithm Proxy CO2 model Data provider Temporal data coverage
ENVISAT/SCIAMACHY IMAP v5.5 CarbonTracker SRON Jan 2009–Mar 2012
GOSAT/TANSO-FTS OCPR v4.0 LMDZ Univ. of Leicester Jun 2009–Dec 2011
GOSAT/TANSO-FTS RemoTeC Proxy v1.9/v2.0 CarbonTracker 2013 SRON/KIT v1.9: Jan 2009–Oct 2011
v2.0: Oct 2011–Jun 2012
GOSAT/TANSO-FTS RemoTeC FP v2.1 – SRON/KIT Jun 2009–Jun 2012
tailed comparison of their consistency and added value in acteristics of each set of satellite retrievals. Further details
inverse modelling, which is the main objective of this pa- are provided in the studies of Parker et al. (2011), Butz et al.
per. Three recent inverse modelling studies (Fraser et al., (2011), Frankenberg et al. (2011), and Schepers et al. (2012).
2013; Monteil et al., 2013; Cressot et al., 2014) have made
use of SCIAMACHY and GOSAT XCH4 to estimate global 2.1 The GOSAT retrievals
CH4 fluxes and concentrations. Our approach differs sig-
nificantly from previous studies in that we examine an ex- The TANSO–FTS, on board the satellite GOSAT (launched
tended time period, use a different inversion set-up, and em- by JAXA in January 2009), provides dry-air column-
ploy several distinct (optimized) bias correction strategies for averaged CH4 mole fractions that can be used in global and
the SCIAMACHY and GOSAT retrievals. Another novel ele- regional CH4 source and sink inversions. The GOSAT XCH4
ment of this study is the comparison of two different satellite are retrieved from a short-wave infrared spectral analysis
proxy retrievals: the GOSAT RemoTeC data set (Schepers of sunlight backscattered by the Earth’s surface and atmo-
et al., 2012) from SRON/KIT, and the OCPR GOSAT re- sphere.
trievals from the University of Leicester (UL) (Parker et al., The proxy retrieval algorithms rely on the small spectral
2011). We also assimilate the “Full-Physics” (FP) GOSAT distance between CO2 and CH4 sunlight absorption bands
retrievals from SRON/KIT, which do not require the use (1.6 µm for CO2 and 1.65 µm for CH4 ), using the CO2
of modelled CO2 fields. Furthermore, we invert the SCIA- column-average dry-air mole fraction (XCO2 ) as proxy for
MACHY IMAPv5.5 retrievals as used in the MACC reanal- the sampled air mass. This helps minimize systematic errors
ysis (Bergamaschi et al., 2013a). In addition to the GOSAT which may arise due to aerosol scattering and instrument-
and SCIAMACHY satellite retrievals, all inversions are con- related effects.
strained by high-accuracy CH4 surface data from the NOAA The equation used to obtain the XCH4 reads as follows:
ESRL Cooperative Air Sampling Network. We also present [CH4 ]GOSAT
a detailed validation of the inversion results against inde- XCH4 = × XCO2modeled . (1)
[CO2 ]GOSAT
pendent NOAA ship and aircraft profile samples, the aircraft
transects from HIPPO – the High-performance Instrumented The proxy retrieval algorithms considered herein use differ-
Airborne Platform for Environmental Research (HIAPER) ent XCO2 model fields. The OCPR (OCO-Proxy) version 4
Pole-to-Pole observation (HIPPO) campaigns from 2010 and retrieval algorithm (Parker et al., 2011) from UL, developed
2011, and XCH4 data from the Total Carbon Column Obser- under the ESA GHG-CCI initiative, derives the column-
vation Network (TCCON) FTS (Wunch et al., 2010). Finally, averaged mole fractions of CO2 from the LMDZ model
we discuss the impact of several bias correction approaches ((Chevallier et al., 2010); MACC-II CO2 fields, optimized
on the estimated total emissions. for the whole period until the end of 2011). The RemoTeC
This paper is organized as follows. Section 2 summarizes Proxy algorithm (version 1.9/2.0) (Schepers et al., 2012)
the main characteristics of the satellite and surface observa- uses modelled CO2 total columns obtained from Carbon-
tions used in the inversion. The inverse modelling framework Tracker (Peters et al., 2007) version 2013, with optimized
is described briefly in Sect. 3. In Sect. 4, we present and dis- CO2 fields for 2009–2012. Perturbations in the optical path
cuss the CH4 emission estimates for the various inversion will mostly cancel out when taking the ratio [CH 4 ]GOSAT
[CO2 ]GOSAT of
scenarios, and the validation of the model simulations against the two measurements. However, Eq. (1) implies that errors
independent measurement data. Finally, the conclusions of in the modelled CO2 columns propagate directly into the de-
the study are summarized in Sect. 5. rived XCH4 . The quality of the latter depends thus on the
accuracy of the modelled CO2 fields.
The third GOSAT XCH4 data set used in this
2 Observations study is the RemoTeC FP version 2.1 from SRON/KIT
(Butz et al., 2011). The CH4 and CO2 columns are re-
Table 1 gives an overview of the satellite data used in the in- trieved simultaneously with three effective aerosol parame-
versions. The following sub-sections briefly discuss the char- ters (amount, size, and height) from GOSAT-FTS measure-
www.atmos-chem-phys.net/15/113/2015/ Atmos. Chem. Phys., 15, 113–133, 2015116 M. Alexe et al.: Inverse modelling of CH4 emissions for 2010–2011
Figure 1. Observation data map indicating the locations of NOAA surface stations used in the inversions (triangle symbols; see also Table T1
in the Supplement). The squares indicate the TCCON station locations. Some of the NOAA and TCCON stations are co-located. The regions
covered by NOAA ship cruises (labelled as POC) are displayed through the horizontal blue lines, which indicate the longitudinal range
within each 5◦ latitude band. In addition, we show the NOAA aircraft profile locations (red crosses), and the HIPPO 3–5 transects used for
validation.
ments at the oxygen (O2 ) A-band around 0.76 microns (µm), Variations in the CO2 atmospheric columns are accounted for
the CH4 and CO2 absorption bands around 1.6 µm, and the through the use of modelled CarbonTracker carbon dioxide
strong CO2 absorption band around 2.0 µm. Dividing the fields (Frankenberg et al., 2011). Problems with the detec-
CH4 column by the dry-air column from the European Cen- tor on the SCIAMACHY instrument occurred unexpectedly
tre for Medium-Range Weather Forecast (ECMWF) ERA- at the end of 2005, and led to a considerable degradation of
Interim data yields the CH4 dry-air mixing ratios (XCH4 ). the instrument performance in the 1.6 µm region relevant for
The full physics approach does not require a proxy CO2 CH4 retrievals. The main feature of the IMAP v5.5 algorithm
field; instead, the amount of sunlight scattering is estimated that set it apart from its predecessor, version 5.0 (Franken-
directly, together with the XCH4 , from the measured spec- berg et al., 2008), is the extension of the time series beyond
tra. However, this method can only account for a fraction of 2005, using a coherent, uniform pixel mask for the entire re-
the total scattering (Butz et al., 2011). A further trade-off is trieval period, so as to minimize the impact of pixel degra-
the lower tolerance to cloud cover (i.e. the method requires dation (Frankenberg et al., 2011). The pixel deterioration re-
a stricter cloud filter). Possible biases in the satellite data mains visible in the IMAP v5.5 retrievals (higher noise lev-
are corrected using XCH4 observations from the TCCON els are noticeable from November 2005). Nonetheless, com-
(Wunch et al., 2010) as anchor points. parisons with measurements at NOAA surface sites indicate
The filter settings for the GOSAT SRON FP retrievals fol- relatively good consistency of the satellite data time series
low the approach of Butz et al. (2011). We use only observa- (Frankenberg et al., 2011). There remain some systematic
tions taken over land (no sun glint ocean data) that have been differences between IMAP v5.5 and v5.0 retrievals (Franken-
screened for clouds. Scenario S1-GOSAT-SRON-FP also as- berg et al., 2011; Bergamaschi et al., 2013a). Following
similates M-gain data (recorded over highly reflective land Bergamaschi et al. (2013a), we use a re-processed version
surfaces). There are considerable differences in the total ac- of the IMAP v5.5 retrievals. This version includes Carbon-
cepted pixel counts for the FP vs. the GOSAT proxy meth- Tracker release 2010 CO2 fields for the year 2009, while
ods. Furthermore, GOSAT has a generally much sparser spa- CO2 fields for years 2010 through 2012 are based on non-
tial sampling (due to the FTS integration time) compared to optimized TM5 forward model runs using optimized CO2
SCIAMACHY. Table 4 reports the total number of satellite emissions from previous years (Bergamaschi et al., 2013a).
data points that were used in each scenario (see also Fig. 4). We assimilate only satellite data over land between 50◦ N
and 50◦ S. We also discard all pixels whose average sur-
2.2 The SCIAMACHY retrievals face elevation is not within 250 m of the TM5 model surface
height (Bergamaschi et al., 2009, 2013a). To avoid spurious
outliers that may have a large impact on the inversion, we
The SCIAMACHY Iterative Maximum A Posteriori (IMAP)
filter out any SCIAMACHY or GOSAT XCH4 retrievals of
version 5.5 retrievals used in this study (Frankenberg et al.,
2011) are calculated by the proxy method outlined above.
Atmos. Chem. Phys., 15, 113–133, 2015 www.atmos-chem-phys.net/15/113/2015/M. Alexe et al.: Inverse modelling of CH4 emissions for 2010–2011 117
2011. These observations allow us to evaluate the simu-
lated concentrations in the marine boundary layer, down-
wind of continental sources. Further important validation
data sources are the NOAA aircraft-based vertical profiles
(across North America and the Pacific Ocean, http://www.
esrl.noaa.gov/gmd/ccgg/aircraft/index.html, and Fig. 1), to
validate the modelled CH4 vertical gradients in the tropo-
sphere.
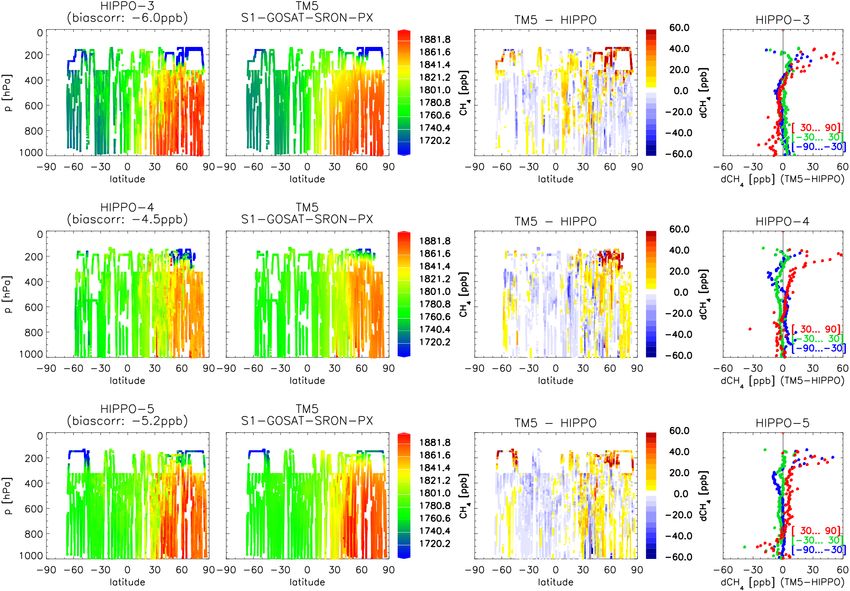
2.4.2 HIPPO aircraft campaigns
Simulated CH4 fields are also validated against campaigns 3,
Figure 2. The inversion settings, as described in Sect. 3.2. Inver- 4 and 5 of the HIPPO program (Wofsy, 2011). The three cam-
sion blocks 2 and 3 start on 1 January 2010 and 1 January 2011, paigns were run during March–April 2010 (HIPPO-3), June–
respectively, from the optimized 3-D CH4 fields calculated by the July 2011 (HIPPO-4), and August–September 2011 (HIPPO-
previous block. 5), for the most part over the Pacific Ocean (see Fig. 1),
but also partially above North America (between 87◦ N and
67◦ S). The HIPPO data consist of continuous profiles be-
less than 1500 nmol mol−1 (henceforth abbreviated as ppb), tween ca. 150 m and 8500 m altitude. Several profiles extend
or larger than 2500 ppb. up to 14 km altitude. For details on the measurement process,
A SCIAMACHY pixel covers a ground area of 30 km which makes use of a quantum cascade laser spectrometer
(along track) times 60 km (across track), whereas TANSO- (QCLS), the reader is directed to Kort et al. (2012). In addi-
FTS has a ground pixel resolution of 10.5 km (at nadir). Sin- tion, air samples collected using the NOAA Programmable
gle GOSAT and SCIAMACHY XCH4 retrievals are averaged Flask Package were taken during the HIPPO campaigns.
on a regular (longitude × latitude) 1◦ × 1◦ grid over the indi- Comparison of QCLS measurements and NOAA flask sam-
vidual 3 h assimilation time slots. The TM5 XCH4 are then ples taken within the same 10 s interval showed a small bias
obtained by vertical integration of the 3-D modelled CH4 in the HIPPO data which has been accounted for in our vali-
fields interpolated to the same 1◦ × 1◦ grid, using the aver- dation (see Fig. 11 and the Supplement): 6 ppb for HIPPO-3,
aging kernels of the SCIAMACHY and GOSAT retrievals 4.5 ppb for HIPPO-4, and 5.2 ppb for HIPPO-5.
(Bergamaschi et al., 2009).
2.4.3 TCCON XCH4 retrievals
2.3 The NOAA surface observations
TCCON measures dry-air column-averaged mole fractions
All inversions use high-accuracy CH4 dry-air mole frac-
of atmospheric CH4 at several sites across the globe (Ta-
tion measurements from a subset of 30 NOAA ESRL sites
ble T2 in the Supplement) using FTS. The TCCON XCH4
(Dlugokencky et al., 2013), globally distributed as shown in
observations have an uncertainty of 7 ppb, and a relative re-
Fig. 1. Due to the coarse 6◦ × 4◦ resolution of the model, we
peatability of 0.2 % (Wunch et al., 2010). Only stations with
include only marine and continental background sites. Other
sufficient data coverage during 2010–2011 are used for the
locations, e.g. located near the coast or strongly influenced
validation. The modelled XCH4 at the TCCON site locations
by sub-grid local sources, are excluded from the assimilation.
were calculated using prior TCCON profiles and averaging
Moreover, the list contains only sites with sufficient data cov-
kernels (Rodgers and Connor, 2003).
erage for 2010–2011. The NOAA surface measurements are
calibrated against the NOAA 2004 CH4 standard scale, or,
equivalently, the World Meteorological Organization Global
Atmosphere Watch (WMO GAW) CH4 mole fraction scale
3 Modelling
(Dlugokencky et al., 2005).
2.4 Measurement data used for validation 3.1 Inverse modelling with TM5-4DVAR
2.4.1 NOAA observations We estimate the monthly averages of CH4 surface fluxes be-
tween January 2010 and December 2011 using the TM5-
The simulated CH4 mixing ratios from all inversions are 4DVAR inverse modelling system (Meirink et al., 2008b).
evaluated against independent observations which have not We also incorporate the further developments described in
been assimilated. First, modelled CH4 mixing ratios are com- Bergamaschi et al. (2009, 2010). The statistical best fit of
pared against NOAA ship cruise data acquired in 2010 and the model-generated 3-D CH4 fields and observations is
www.atmos-chem-phys.net/15/113/2015/ Atmos. Chem. Phys., 15, 113–133, 2015118 M. Alexe et al.: Inverse modelling of CH4 emissions for 2010–2011
Figure 3. Frequency distributions of model–observation residuals (dCH4 ) for satellite and station data (2010–2011). Both station and satellite
data are distributed across 1 ppb bins. The total number of surface measurements or retrievals is denoted by n. The bias and root mean square
(rms) of each inversion are shown in Table 4.
achieved by minimization of the following cost functional: flexibility when optimizing their seasonal variation. As in
Bergamaschi et al. (2010), the temporal correlation of the
1
J (x) = (x − x B )T B−1 (x − x B ) remaining emissions – assumed to have little seasonal varia-
2 tion – is set to 9.5 months. A Gaussian function of the spatial
n
1X distance between model grid cells is used to model the spa-
+ (Hi (x) − y i )T R−1
i (Hi (x) − y i ). (2)
2 i=1 tial emission error correlations, using a correlation length of
500 km, for all emission categories and all scenarios. Hor-
Here x = (xconc , xem , s) is the state vector, which comprises
izontal error correlations in the initial CH4 fields are mod-
the initial CH4 fields at the beginning of each inversion se-
elled using a Gaussian distance of 500 km, while error corre-
ries xconc , the monthly average emissions xem , and the bias
lations in the vertical direction are described by the National
parameters s (Bergamaschi et al., 2009, 2013a). The obser-
Meteorological Center (NMC) method (Parrish and Derber,
vations are denoted by y, while H(x) is the correspond-
1992; Meirink et al., 2008a). For the satellite data, the re-
ing model simulation. Finally, B and Ri are the parameter
ported error is taken as the measurement uncertainty. For the
and observation error covariance matrices, where the index i
surface observations we prescribe a measurement uncertainty
indicates the assimilation window (set to 3 h). We ensured
of 3 ppb, while also taking into account the model representa-
a posteriori CH4 emissions were positive through the ap-
tion error, estimated from local emissions and 3-D gradients
plication of a “semi-lognormal” probability density function
of simulated CH4 mixing ratios (Bergamaschi et al., 2010).
(PDF) for the a priori emissions (xem )B (Bergamaschi et al.,
In all inversions the tropospheric CH4 sink is simulated
2009, 2010). This particular choice of a priori PDF intro-
using hydroxyl (OH) radical fields from a TM5 full chem-
duces a non-linearity in Eq. (2). The 4DVAR functional J
istry run using the Carbon Bond Mechanism 4 optimized
in Eq. (2) is minimized using the algorithm M1QN3 (Gilbert
based on methyl chloroform measurements (Bergamaschi
and Lemaréchal, 1989). The adjoint model (Meirink et al.,
et al., 2009, 2010, 2013a). The lifetime of CH4 is calcu-
2008b; Krol et al., 2008) allows for an efficient computation
lated at 10.1 years (total CH4 vs. tropospheric OH). The
of the gradient of J during the minimization process.
fifth generation European Centre Hamburg general circula-
TM5 is an offline transport model (Krol et al., 2005) driven
tion model (ECHAM5) Modular Earth Submodel System
by the ERA-Interim re-analysis meteorological data (Dee
version 1 (MESSy1) (Jöckel et al., 2006) is used to parame-
et al., 2011) from ECMWF. We use the standard TM5 ver-
terize the stratospheric chemical destruction of CH4 by OH,
sion (cycle 1), with a global horizontal resolution of 6◦ × 4◦
Cl, and O(1 D), using sink averages from 1999 to 2002.
(longitude-latitude), and 25 hybrid pressure vertical layers.
The number of optimization iterations required to mini-
3.2 Inversion settings mize the cost functional (Eq. 2) increases with the length
of the assimilation window. For this reason, we have split
The prior emission inventories are identical to those used all our inversions into 18-month blocks (Fig. 2), with 6-
by Bergamaschi et al. (2013a). We independently optimize month spin-down periods (Bergamaschi et al., 2013a). Con-
four groups of CH4 emissions: wetlands, rice, biomass burn- secutive blocks overlap by 6 months. The first block starts
ing, and other remaining sources (Bergamaschi et al., 2010, on 1 January 2009; the third 18-month inversion block ends
2013a). A priori uncertainties for each emission category are on 1 July 2012. The inversion for 2009 is considered as
set to 100 % (per model grid cell and month), with the ex- spin-up, and not further analysed in this study. The results
ception of the “remaining sources” whose uncertainty is set for the 6-month spin-down periods are also not used in the
to 50 %. Wetland, rice, and biomass burning emissions are analysis. A priori 3-D CH4 concentration fields for 1 Jan-
assumed to be uncorrelated in time, to allow the maximum uary 2009 are taken from a CH4 inversion constrained only
Atmos. Chem. Phys., 15, 113–133, 2015 www.atmos-chem-phys.net/15/113/2015/M. Alexe et al.: Inverse modelling of CH4 emissions for 2010–2011 119 Figure 4. Column-averaged CH4 mixing ratios (XCH4 ): bias-corrected satellite retrievals vs. TM5-4DVAR. The left plots show the monthly average bias corrections (in ppb) applied to the satellite data for January 2010–December 2011. The panels on the right display the two- year latitudinal average XCH4 values (red: satellite; blue: TM5-4DVAR) and the corresponding minimum and maximum values across the longitude. www.atmos-chem-phys.net/15/113/2015/ Atmos. Chem. Phys., 15, 113–133, 2015
120                                                             M. Alexe et al.: Inverse modelling of CH4 emissions for 2010–2011

Table 2. Inversion scenarios.

            Inversion                   Assimilated observations
            S1-NOAA                     NOAA ESRL surface measurements only
            S1-GOSAT-SRON-PX            NOAA ESRL surface measurements and GOSAT RemoTeC Proxy v1.9/v2.0 XCH4
            S1-GOSAT-SRON-FP            NOAA ESRL surface measurements and GOSAT RemoTeC FP v2.1 XCH4
            S1-GOSAT-UL-PX              NOAA ESRL surface measurements and GOSAT OCPR v4.0 XCH4
            S1-SCIA                     NOAA ESRL surface measurements and SCIAMACHY IMAP v5.5 XCH4
            S2-GOSAT-SRON-FP            as S1-GOSAT-SRON-FP, with a constant bias correction instead of 2nd order polynomial
            S3-GOSAT-SRON-FP            as S1-GOSAT-SRON-FP, with a smooth bias correction
            S2-GOSAT-UL-PX              as S1-GOSAT-UL-PX, with a constant bias correction instead of 2nd order polynomial
            S3-GOSAT-UL-PX              as S1-GOSAT-UL-PX, with a smooth bias correction

Table 3. Inversion settings: current study vs. Monteil et al. (2013).

                                        Current study                               Monteil et al. (2013)
           Prior PDFs                   Semi-lognormal                              Gaussian (may result in negative a posteriori
                                                                                    emissions)
           Satellite retrievals         ENVISAT/SCIAMACHY IMAP v5.5                 ENVISAT/SCIAMACHY IMAP v5.5
                                        GOSAT/TANSO-FTS RemoTeC Proxy               GOSAT/TANSO-FTS RemoTeC Proxy v1.0
                                        v1.9/2.0
                                        GOSAT/TANSO-FTS RemoTeC FP                  GOSAT/TANSO-FTS RemoTeC FP v1.0
                                        v2.1
                                        GOSAT/TANSO-FTS OCPR v4.0
           Bias correction              Function of latitude and month, opti-       GOSAT RemoTeC FP v1.0: Correction by a sin-
                                        mized in the inversion (for all satellite   gle coefficient (1.0037).
                                        products).
                                                                                    GOSAT RemoTeC Proxy v1.0: no bias correc-
                                                                                    tion applied.
                                                                                    SCIAMACHY IMAP v5.5: Constant factor, plus
                                                                                    seasonally varying bias correction term based on
                                                                                    specific humidity (Houweling et al., 2014).
           Stratospheric sink           ECHAM5/MESSy1.                              Cambridge 2-D model (Velders, 1995) with a
                                                                                    correction based on HALOE/CLAES climatol-
                                                                                    ogy applied above 50 hPa.
           Tropospheric OH              TM5 full chemistry run based on CBM4        Spivakovsky et al. (2000), with a scaling factor
                                        (see Section 3.2)                           of 0.92.
           Satellite retrieval errors   Uses reported XCH4 errors.                  The reported GOSAT retrieval uncertainties are
                                                                                    scaled by a factor of 1.5 before the inversion.
           Emission categories          Four categories optimized indepen-          Total emissions.
                                        dently.
           Prior emission uncer-        50–100 % per category, grid cell, and       50 % per grid cell and month.
           tainties                     month (see Sect. 3.2).
           Target period                January 2010–December 2011                  April 2009–August 2010

by surface measurements (scenario S1-NOAA of Bergam-                          Initial CH4 3-D fields are optimized only for the first in-
aschi et al., 2013a), with the exception of scenario S1-SCIA,              version block. The other two 18 month blocks start on 1 Jan-
which uses the optimized concentrations from inversion S1-                 uary from the optimized initial fields of the previous inver-
SCIA of Bergamaschi et al. (2013a). Sixty iterations of the                sion block. This methodology guarantees a closed CH4 bud-
M1QN3 optimization algorithm are used for the cost func-                   get across the entire inversion period, i.e. total sources minus
tion minimization in each inversion block for all inversions               total sinks yield the variation in the global CH4 burden. Ad-
which include satellite data, and 40 iterations for S1-NOAA                ditionally, the spin-down periods ensure that surface fluxes
(which assimilates only the NOAA surface data).                            for 2010–2011 are constrained by all available observations
                                                                           for at least 6 months after emission.

Atmos. Chem. Phys., 15, 113–133, 2015                                                          www.atmos-chem-phys.net/15/113/2015/
M. Alexe et al.: Inverse modelling of CH4 emissions for 2010–2011 121
Table 4. Statistics for inversions S1-NOAA through S1-SCIA: NOAA surface measurements (left) and satellite data (right). See Fig. 3 for
the frequency distributions of fit residuals.
Inversion NOAA ground stations Satellite
n Bias [ppb] rms [ppb] n Bias [ppb] rms [ppb]
S1-NOAA 3418 0.2 11.5 – – –
S1-GOSAT-SRON-PX 3418 0.3 12.4 106 854 −0.3 9.2
S1-GOSAT-SRON-FP 3418 0.4 12.1 31 201 −0.3 10.4
S1-GOSAT-UL-PX 3418 0.4 11.8 129 916 −0.1 8.9
S1-SCIA 3418 0.3 12.0 432 008 −0.9 32.3
(Bergamaschi et al., 2013a): one bias parameter per degree of
latitude and month, 10 ppb prior uncertainty, and a prescribed
20◦ latitude Gaussian error correlation length. The bias cor-
rection coefficients used for S2-GOSAT-SRON-FP and S2-
GOSAT-UL-PX are variable in time, but constant with lati-
tude. The choice of bias correction scheme is not found to
have a significant impact on the posterior regional emission
estimates (shown in Table 5).
The aim of this study is to quantify the impact of the differ-
ent satellite retrievals on the inverted CH4 fluxes and concen-
trations. Hence, all inversions use the same a priori emission
inventories (as in Bergamaschi et al., 2013a), and identical
OH fields. It is important to note that the surface observations
act as constraints (or “anchor points”) for the bias correction
Figure 5. The TRANSCOM emission regions used in this study (at scheme.
1◦ × 1◦ resolution). The land regions are labelled as follows: bo-
real North America (BNA), temperate North America (TNA), trop-
ical South America (TrSA), temperate South America (TSA), Eu- 4 Results and discussion
rope (Eur), North Africa (NAf), South Africa (SAf), boreal Eurasia
(BEr), temperate Eurasia (TEr), tropical Asia (TrAs), and Australa- 4.1 Assimilation statistics
sia (Aus). White areas (ice) are not assigned to any region.
The posterior statistics of S1-NOAA through S1-SCIA are
summarized in Table 4. Figure 3 shows the frequency distri-
The inversion scenarios considered in this study are sum- butions of fit residuals (difference between model and obser-
marized in Table 2. Scenario S1-NOAA is intended as a base- vations). The data in Table 4 show that bias is close to zero
line for all the other inversions; it uses only NOAA ESRL for both surface measurements and satellite XCH4 . More-
surface station data. Scenarios S1-GOSAT-SRON-PX, S1- over, the model performance at the NOAA sites remains vir-
GOSAT-SRON-FP, and S1-GOSAT-UL-PX assimilate both tually identical when satellite data are assimilated: compar-
NOAA surface data and GOSAT XCH4 retrievals, whereas ing the satellite-based inversions with S1-NOAA we note
S1-SCIA uses SCIAMACHY retrievals and NOAA sur- only a marginal increase in the bias of 0.1–0.2 ppb, and in
face observations. The S1-satellite inversions make use of the root mean square (rms) difference of about 0.3–0.9 ppb
a second-order polynomial bias correction scheme that is (see also Fig. 3). The statistics of the three GOSAT inver-
a function of latitude and month (Bergamaschi et al., 2009, sions are almost identical in terms of posterior bias, standard
2013a). Table 3 lists the main technical differences between deviation, and rms difference between retrieved and assimi-
the inversion system considered in the current study and the lated XCH4 . While the large global bias in the SCIAMACHY
set-up used by Monteil et al. (2013). XCH4 retrievals is, for the most part, compensated by the
To assess the impact of the bias correction scheme on the bias correction mechanism (Fig. 4), the average standard de-
posterior emission estimates, we have considered four addi- viation of the posterior distribution of SCIAMACHY–TM5
tional scenarios: S2-GOSAT-SRON-FP, S3-GOSAT-SRON- fit residuals (sigma = 32 ppb) is much larger than that of
FP, S2-GOSAT-UL-PX and S3-GOSAT-UL-PX. These dif- the GOSAT inversions (sigma = 9–10 ppb for S1-GOSAT-
fer from S1-GOSAT-SRON-FP and S1-GOSAT-UL-PX by SRON-PX through S1-GOSAT-UL-PX). The significantly
their bias correction scheme. Inversions S3-GOSAT-SRON- lower standard deviations of the fit residuals of all GOSAT-
FP and S3-GOSAT-UL-PX use a “smooth” bias correction based inversions demonstrate the much higher precision and
www.atmos-chem-phys.net/15/113/2015/ Atmos. Chem. Phys., 15, 113–133, 2015122 M. Alexe et al.: Inverse modelling of CH4 emissions for 2010–2011 Figure 6. Left: a posteriori 2-year average emissions for S1-NOAA and S1-GOSAT-SRON-PX. The a priori emissions are shown in the topmost plot. White areas indicate grid cells with very low emissions (less than 5 mg CH4 m−2 day−1 ). Right: for S1-NOAA the difference between posteriori and a priori emissions is shown, while for all satellite inversions the panels show the difference between the a posteriori emissions of these inversions and S1-NOAA. Atmos. Chem. Phys., 15, 113–133, 2015 www.atmos-chem-phys.net/15/113/2015/
M. Alexe et al.: Inverse modelling of CH4 emissions for 2010–2011                                    123

Figure 6. Scenarios S1-GOSAT-SRON-FP, S1-GOSAT-UL-PX and S1-SCIA.

www.atmos-chem-phys.net/15/113/2015/                                Atmos. Chem. Phys., 15, 113–133, 2015
124                                                            M. Alexe et al.: Inverse modelling of CH4 emissions for 2010–2011

                                                                        4.2   Modelled XCH4

                                                                        Figure 4 shows the column-averaged CH4 mixing ratios for
                                                                        2010–2011 (2-year averages). The bias-corrected XCH4 re-
                                                                        trievals are plotted in the maps on the left, while the maps on
                                                                        the right show the assimilated XCH4 . Note the much denser
                                                                        data coverage of the SCIAMACHY XCH4 retrievals (last
                                                                        row of Fig. 4) compared to that of the GOSAT products. For
                                                                        GOSAT, the more stringent selection criteria applied to the
                                                                        FP retrievals result in significantly lower pixel density than
                                                                        that achieved by the two proxy XCH4 retrievals (see also Ta-
                                                                        ble 4).
                                                                           The 4DVAR assimilation system is able to capture most
                                                                        major regional patterns of the observed XCH4 fields, e.g.
                                                                        the pronounced XCH4 enhancements over South-East Asia.
                                                                        Over tropical South America, the agreement between re-
                                                                        trieved and assimilated XCH4 patterns is generally better for
                                                                        the three GOSAT-based inversions than for SCIAMACHY
                                                                        (e.g. over Columbia and Venezuela). Note, however, the
                                                                        lower data density of the GOSAT retrievals (especially of the
                                                                        GOSAT FP retrievals) over those areas compared to SCIA-
                                                                        MACHY. The different GOSAT products show very good
                                                                        consistency overall regarding the spatial XCH4 patterns (in
                                                                        particular the two GOSAT proxy retrievals), and result in
                                                                        only small-to-moderate calculated bias corrections (maxi-
                                                                        mum 10–20 ppb), indicating good consistency with the sur-
                                                                        face observations. In contrast, the SCIAMACHY XCH4 re-
                                                                        quire a significantly higher bias correction (varying with lat-
                                                                        itude by up to ca. 40 ppb). There are various indications
                                                                        that the SCIAMACHY IMAP v5.5 XCH4 have a complex
                                                                        bias structure (e.g. the comparison with previous IMAP v5.0
                                                                        XCH4 retrievals examined by (Frankenberg et al., 2011)),
                                                                        which cannot be fully compensated by our polynomial bias
                                                                        correction. Furthermore, Houweling et al. (2014) showed re-
                                                                        cently that the bias of the SCIAMACHY IMAP v5.5 re-
                                                                        trievals is strongly correlated with water vapour.
Figure 7. Two-year latitudinal averages of CH4 emissions, shown
for the different source categories optimized in the inversions, and    4.3   A posteriori CH4 fluxes
for the total emissions. The gray areas correspond to the prior emis-
sions.                                                                  Figure 6 shows the spatial distribution of emissions, averaged
                                                                        over the 2 years (2010–2011). The maps on the left side show
                                                                        the a priori (top) and a posteriori fluxes. The maps on the
relative accuracy of the GOSAT XCH4 products (compared
                                                                        right display the differences between a posteriori and a priori
to the SCIAMACHY retrievals). We note that the GOSAT in-
                                                                        emissions for our baseline inversion S1-NOAA, and for the
versions presented by Monteil et al. (2013) yielded a higher
                                                                        satellite inversions S1-GOSAT-SRON-PX through S1-SCIA
standard deviation (14.7–15.8 ppb). Since they used a pre-
                                                                        the difference between the a posteriori emissions of these in-
vious retrieval version (RemoTeC Proxy v1.0 and FP v1.0
                                                                        versions and S1-NOAA. While the satellite inversions yield
XCH4 ), the lower standard deviation obtained in our study
                                                                        significantly different spatial emission patterns compared to
may reflect the further improvement of the GOSAT retrievals.
                                                                        the NOAA-only inversion (due to the constraints of the satel-
Furthermore, the optimization of the bias correction is likely
                                                                        lite data over the continents), they show overall good qualita-
a contributing factor: while Monteil et al. (2013) applied
                                                                        tive agreement across all satellite inversions. This is particu-
a constant correction to the GOSAT FP retrievals before the
                                                                        larly visible in the difference plots on the right side of Fig. 6,
inversion, based on the comparison with the TCCON data,
                                                                        which show similar regional emission increments relative to
they did not use any bias correction for the GOSAT proxy
                                                                        the NOAA-only inversion, especially over tropical Africa
retrievals.
                                                                        and the United States. While the NOAA-only inversion re-

Atmos. Chem. Phys., 15, 113–133, 2015                                                      www.atmos-chem-phys.net/15/113/2015/
M. Alexe et al.: Inverse modelling of CH4 emissions for 2010–2011 125 Figure 8. Average yearly CH4 emissions for the pre-defined regions. Top panels show total surface fluxes (in Tg CH4 yr−1 ), while increments from the prior are given in the bottom panels. Yearly totals are shown on the left along with surface fluxes attributed to each 30◦ latitude band. The Antarctic region (not shown here) is estimated to be responsible for less than 0.1 Tg yr−1 of CH4 . The two panels on the right show the TRANSCOM region emissions (see Fig. 5 for the region definitions). Figure 9. Validation against independent measurement data sets for all inversions. The plot shows the rms (in ppb) of differences between modelled CH4 mixing ratios, and observation data in the boundary layer (“BL”), free troposphere (“FT”), and upper troposphere/lower stratosphere (“UT/LS”). Observation data sources: NOAA shipboard samples, vertical profiles from NOAA aircraft sampling, and the HIPPO campaigns 3–5. Validation results for the Fourier Transform Spectrometer CH4 total column data from TCCON are shown in a separate panel (“FTS”). The prior (APRI) is already partly optimized (see Sect. 3.2). sults in a significant increase of the emission hot spot over ern Hemisphere can be partly attributed to an attenuation of the Congo Basin (which is a prominent feature in the applied EDGAR anthropogenic emission hot spots over Eastern Eu- wetland inventory, see Bergamaschi et al., 2007, 2009), all rope, as seen in the panel labelled “other”. However, there satellite inversions significantly reduce the emissions from remain noticeable inter-scenario differences in the category this hot spot, and instead increase the emissions in tropical averages, particularly for wetland and biomass-burning emis- East Africa (see also the “wetlands” panel in Fig. 7). Note sions at tropical latitudes. that S1-GOSAT-SRON-FP calculates slightly lower emission Over North America, the satellite inversions result in a rates for equatorial Africa, likely due to the absence of ob- significant redistribution of CH4 emissions from North-East servations available directly over that region (Fig. 4). Espe- United States to the middle South. A similar spatial pattern, cially for the NOAA-only inversion, the a posteriori CH4 with significantly higher CH4 emissions over South-Central fluxes over the tropics depend in large part on the choice United States compared to bottom-up inventories, has re- of prior inventory. Unfortunately, their uncertainties remain cently been reported by Miller et al. (2013), and attributed very high, and the comparison of global wetland models by by the authors of that study mainly to fossil fuel emissions. Melton et al. (2013) shows large discrepancies in estimated Furthermore, a recent comprehensive review by Brandt et al. CH4 emissions among the models. The relatively consistent (2014), which analysed a large number of bottom-up and top- spatial patterns over tropical Africa found in this study for down studies ranging from facility level, over regional level the different satellite inversions demonstrate that the satellite and up to country level, suggested a systematic underesti- data combined with the inverse models provide significant mation of CH4 emissions from North-American natural gas constraints on the CH4 emissions from this region. systems in bottom-up inventories. Although the spatial redis- The total emission latitudinal averages (shown in the bot- tribution of CH4 emissions over the United States calculated tom panel of Fig. 7) are relatively consistent among all five by our satellite inversions appears to be consistent with these scenarios. The decrease in fluxes over the temperate North- studies, we emphasize that the applied coarse model resolu- www.atmos-chem-phys.net/15/113/2015/ Atmos. Chem. Phys., 15, 113–133, 2015
126                                                         M. Alexe et al.: Inverse modelling of CH4 emissions for 2010–2011

Figure 10. Model validation against TCCON data across all measurement stations with significant data coverage during our inversion period.
Prior values are given by the grey bars. Upper panel: bias (in ppb). Lower panel: standard deviation.

Table 5. Two-year average CH4 emissions (Tg CH4 yr−1 ) for the TRANSCOM land regions (Fig. 5) and 30◦ latitude bands. The prior
emission inventories are as used by Bergamaschi et al. (2013a). The global total includes the contribution of ocean regions.

                     Prior   S1-NOAA      S1-GOSAT-SRON-PX          S*-GOSAT-SRON-FP            S*-GOSAT-UL-PX          S1-SCIA
      Region                                                         S1    S2    S3             S1    S2     S3
      BNA             13.0    11.5                11.0              12.2     13.3     12.2      10.3   11.4      10.2      10.3
      TNA             38.5    47.6                44.7              44.8     41.3     43.1      52.1   47.3      51.5      45.6
      TrSA            63.7    74.9                68.9              79.4     79.6     80.7      70.7   72.4      71.6      71.8
      TSA             37.5    40.9                40.9              41.7     41.5     40.5      41.3   42.3      40.7      40.2
      NAf             36.7    43.0                36.1              48.0     52.7     48.1      38.3   41.7      40.2      50.6
      SAf             28.5    36.4                41.6              36.4     37.7     36.2      38.4   40.0      35.7      42.0
      BEr             18.1    18.1                20.6              16.8     16.7     17.0      17.0   17.4      16.7      15.4
      TEr            131.4    110.1               107.5            110.4    104.7    108.9     104.0   98.1     103.0     109.6
      TrAs            69.6    75.9                74.2              67.7     73.4     68.6      77.2   81.4      77.4      76.8
      Aus              5.8     4.8                 9.1              4.7      3.5      4.4       6.9    6.2       7.8       4.3
      Eur             46.4    29.5                38.6              33.8     29.0     35.7      36.8   32.9      38.0      28.9
      Global total   535.5    538.1               537.3            537.7    537.9    537.2     538.2   538.2    538.4     540.5
      Arctic          19.9    17.6                21.1              18.3     19.7     18.3      17.7    20.1     17.3      18.2
      NH-mid         183.8    156.2               163.9            166.7    156.0    165.2     161.7   149.7    158.5     146.2
      NHTr           193.8    202.8               182.9            192.1    196.7    193.8     197.2   199.7    207.7     215.1
      SHTr           127.7    153.9               157.4            148.1    156.5    148.5     150.6   160.1    141.6     154.8
      SH-mid          14.3    11.6                15.0              16.1     12.9     14.8      13.7    11.5     16.0      8.9

tion and the limitations of the inverse modelling system in            for the SCIAMACHY-based S1-SCIA. Emissions in the mid
differentiating between source categories do not allow us to           latitudes of the Northern Hemisphere are reduced in all sce-
attribute these emission increments to specific sources.               narios (mainly across Europe and Temperate Eurasia, see
   CH4 fluxes aggregated over the TRANSCOM regions                     Fig. 8) although there are considerable differences between
(see Fig. 5 and Gurney et al., 2008) are shown in Fig. 8,              the flux adjustments calculated for each inversion. The nega-
and Table 5. All inversions show a small increase in                   tive increments in the Northern Hemisphere are compensated
the 2-year global total emissions over the prior, from                 by across-the-board increases in tropical emissions (between
1.8 Tg CH4 yr−1 for S1-GOSAT-SRON-PX to 5 Tg CH4 yr−1                  30◦ N and 30◦ S) over the prior, between 18.6 Tg CH4 yr−1

Atmos. Chem. Phys., 15, 113–133, 2015                                                        www.atmos-chem-phys.net/15/113/2015/
M. Alexe et al.: Inverse modelling of CH4 emissions for 2010–2011 127 Figure 11. Scenario S1-GOSAT-SRON-PX: validation against HIPPO campaigns 3–5 (southbound and northbound flights). Right panels show the average bias as a function of latitude: extra-tropical Northern Hemisphere in red, extra-tropical Southern Hemisphere in blue, and the tropics in green. HIPPO validation results for the other inversions are shown in the Supplement. for S1-GOSAT-SRON-FP, and 48.4 Tg CH4 yr−1 for S1- data set. We noticed a similar pattern in our inversions, par- SCIA. The net increase in the Southern Hemisphere fluxes ticularly above tropical Asia, where S1-GOSAT-SRON-FP can be mainly attributed to increased emissions over Brazil flux estimates are ca. 6.5 Tg CH4 yr−1 lower than those of and sub-equatorial Africa. Part of the net increase in the the GOSAT SRON proxy scenario S1-GOSAT-SRON-PX. Southern Hemisphere could be due to a bias in the inter- Schepers et al. (2012) attribute this discrepancy in the emis- hemispheric mixing of TM5, as recently diagnosed by SF6 sion estimates to a regional overestimation of CH4 mix- simulations (Patra et al., 2011; Monteil et al., 2013). To ing ratios in the proxy retrieval algorithm, caused by defi- tackle this problem, a new parameterization of convective ciencies in the applied CO2 fields. The two GOSAT proxy fluxes has been implemented for TM5, based on ERA- retrievals yield relatively similar emission patterns overall. Interim convective fluxes (Berrisford et al., 2011), instead There are, however, some differences in the exact magnitude of the scheme of Tiedtke (1989) used in this study. While it of the regional-scale fluxes calculated by S1-GOSAT-SRON- increases inter-hemispheric transport, the new parameteriza- PX and S1-GOSAT-UL-PX, e.g. a larger decrease in temper- tion has a significant impact on the simulated mixing ratios ate Eurasian fluxes when the GOSAT OCPR retrievals are in the continental boundary layer (results not shown). Fur- assimilated (see Fig. 6). ther investigations are needed to fully evaluate the impact Several recent studies (Butz et al., 2011; Schepers et al., and quality of the new convection scheme (which is beyond 2012) indicated that the reported precision of XCH4 satel- the scope of the present study). lite retrievals may be too high. To investigate the impact of Monteil et al. (2013) have reported that inversions us- applied satellite uncertainties, we considered one additional ing the GOSAT SRON proxy retrievals led to larger Asian scenario, in which the reported errors of the GOSAT-SRON- emissions than those estimated using the SRON FP XCH4 PX retrievals were scaled by a factor of 1.5. This sensitivity www.atmos-chem-phys.net/15/113/2015/ Atmos. Chem. Phys., 15, 113–133, 2015
128                                                         M. Alexe et al.: Inverse modelling of CH4 emissions for 2010–2011

experiment did not lead to significant changes in the a poste-       (2009) with balloon measurements, and comparisons with
riori regional emission patterns (results not shown).                HIPPO data in Sect. 4.4.2 and Fig. 11). However, there is
                                                                     also some uncertainty in the TCCON FTS data, since the
4.4     Model validation                                             stratospheric contribution is not directly calibrated and val-
                                                                     idated (Wunch et al., 2010; Geibel et al., 2012). In future
All the inversion results are thoroughly validated against in-       studies, the AirCore CH4 data from NOAA ESRL (Karion
dependent measurement data sets covering the atmospheric             et al., 2010) may also serve as an independent benchmark of
boundary layer (BL), the free troposphere (FT), as well as           both model and TCCON XCH4 in the stratosphere.
the upper troposphere and lower stratosphere (UTLS). Since
the observations considered for validation have not been used        4.4.2   HIPPO aircraft campaigns
in the assimilation, they provide an independent verification
of the modelled XCH4 . Figure 9 gives an overview of the             Figure 11 shows the bias corrected HIPPO data for all three
results for all inversions and validation data sets (for a total     campaigns (left panels), and modelled mixing ratios for sce-
of slightly more than 80 900 observations). See Sect. 2.4 and        nario S1-GOSAT-SRON-PX. There is a good agreement
Fig. 1 for details on each data set. The rms differences shown       overall between the model simulations and the HIPPO ob-
in Fig. 9 have been averaged over all available measurements         servations (similar results for scenarios S1-GOSAT-SRON-
during 2010–2011. In general, the optimized CH4 mixing ra-           FP through S1-SCIA are reported in the Supplement).
tios have lower rms differences than the prior concentrations.          The panels on the right in Fig. 11 show the average bias
It is important to note that the a priori shown in Fig. 9 is al-     as a function of altitude and latitude band: extra-tropical
ready partly optimized, given that inversion blocks 2 and 3          Northern Hemisphere (red points), tropics (light green), and
(for 2010, and 2011, respectively) start from optimized ini-         extra-tropical Southern Hemisphere regions (blue). Agree-
tial fields (see the discussion in Sect. 3.2). The validation per-   ment between model simulations and the HIPPO measure-
formance of scenario S1-NOAA is generally no worse than              ments in the free troposphere is generally very good for all
that of the satellite inversions. This is likely due to the fact     inversions. However, the bias increases significantly above
that validation data are generally located far from the regions      300 hPa for all three HIPPO campaigns, particularly in the
where the changes in emissions patterns occur (see Fig. 1 and        extra-tropical regions. A similar bias pattern has been re-
6), an exception being continental United States, where the          ported by Bergamaschi et al. (2013a, Fig. 10). This abrupt de-
agreement between the modelled mixing ratios and boundary            terioration of model performance in the stratosphere is likely
layer NOAA aircraft data improves slightly when assimilat-           caused by deficiencies of the parameterization of the strato-
ing satellite retrievals (“BL” panel in Fig. 9). This result is,     spheric sink at high latitudes, and the inability of the coarse-
however, difficult to interpret given the coarse resolution of       resolution TM5 model to resolve the small-scale dynamics
the model.                                                           of the stratospheric–tropospheric exchange.

4.4.1    TCCON XCH4 data
                                                                     5   Conclusions
TCCON provides retrievals of CH4 concentrations at glob-
ally distributed locations using ground-based FTS (Wunch             This study compares several inversions of global CH4
et al., 2010). We compare our modelled XCH4 with                     emissions for 2010–2011, using four different satel-
GGG2012 TCCON retrievals. Figure 10 shows the bias and               lite XCH4 products: the SCIAMACHY IMAPv5.5
rms difference between the TM5 and TCCON XCH4 , aver-                retrievals (Frankenberg et al., 2011), the SRON/KIT
aged over the entire inversion period. Only stations with suf-       GOSAT RemoTeC Proxy v1.9/v2.0 and FP v2.1
ficient measurement data coverage for 2010–2011 are shown.           (Butz et al., 2011; Schepers et al., 2012) retrievals, and the
The grey bars indicate the a priori bias and rms. There is a no-     GOSAT OCPR v4.0 product from UL (Parker et al., 2011).
ticeable improvement in the bias over the prior at the north-        All inversions considered are further constrained by high-
ernmost TCCON stations in Fig. 10. At other regional sta-            accuracy CH4 measurement data from the NOAA ESRL
tions the improvement is modest, and at some stations, e.g. at       global station network (Dlugokencky et al., 2013). The mod-
Four-Corners (FCO), the XCH4 bias slightly deteriorates af-          elled 3-D CH4 fields have been validated against multiple
ter the assimilation. However, a recent high-resolution study        sets of independent observations that were not assimilated.
by Kort et al. (2014) identified the FCO area as a large CH4            The inversion results demonstrate clear improvements in
anomaly, likely caused by regional sources such as oil, gas,         the precision and relative accuracy of the GOSAT XCH4 re-
and coal-bed CH4 mining and processing.                              trievals over SCIAMACHY. The standard deviations of the
   We note a systematic trend in the bias from north to south        model-to-observation fit residuals of the GOSAT-based in-
(except for FCO). The positive bias at high northern latitudes       versions (9–10 ppb) are significantly lower than the value cal-
could be partly due to overestimated CH4 mixing ratios in            culated for the SCIAMACHY scenario (∼32 ppb). Further-
the stratosphere (see the comparison of Bergamaschi et al.           more, the monthly bias corrections applied to the GOSAT

Atmos. Chem. Phys., 15, 113–133, 2015                                                  www.atmos-chem-phys.net/15/113/2015/
You can also read