Backbone-independent NMR resonance assignments of methyl probes in large proteins - Nature
←
→
Page content transcription
If your browser does not render page correctly, please read the page content below
ARTICLE
                  https://doi.org/10.1038/s41467-021-20984-0                 OPEN

                  Backbone-independent NMR resonance
                  assignments of methyl probes in large proteins
                  Santrupti Nerli1,2,4, Viviane S. De Paula                  2,3,4,   Andrew C. McShan2 & Nikolaos G. Sgourakis                      2✉

                  Methyl-specific isotope labeling is a powerful tool to study the structure, dynamics and
                  interactions of large proteins and protein complexes by solution-state NMR. However,
1234567890():,;

                  widespread applications of this methodology have been limited by challenges in obtaining
                  confident resonance assignments. Here, we present Methyl Assignments Using Satisfiability
                  (MAUS), leveraging Nuclear Overhauser Effect cross-peak data, peak residue type classifi-
                  cation and a known 3D structure or structural model to provide robust resonance assign-
                  ments consistent with all the experimental inputs. Using data recorded for targets with known
                  assignments in the 10–45 kDa size range, MAUS outperforms existing methods by up to
                  25,000 times in speed while maintaining 100% accuracy. We derive de novo assignments for
                  multiple Cas9 nuclease domains, demonstrating that the methyl resonances of multi-domain
                  proteins can be assigned accurately in a matter of days, while reducing biases introduced by
                  manual pre-processing of the raw NOE data. MAUS is available through an online web-
                  server.

                  1 Department of Biomolecular Engineering, University of California, Santa Cruz, CA 95064, USA. 2 Center for Computational and Genomic Medicine,

                  Department of Pathology and Laboratory Medicine, The Children’s Hospital of Philadelphia and Department of Biochemistry and Biophysics, Perelman School
                  of Medicine, University of Pennsylvania, 3501 Civic Center Boulevard, Philadelphia, PA 19104, USA. 3 Núcleo Multidisciplinar de Pesquisa em Biologia,
                  Universidade Federal do Rio de Janeiro, Duque de Caxias, RJ 25245-390, Brazil. 4These authors contributed equally: Santrupti Nerli, Viviane S. De Paula.
                  ✉email: nikolaos.sgourakis@pennmedicine.upenn.edu

                  NATURE COMMUNICATIONS | (2021)12:691 | https://doi.org/10.1038/s41467-021-20984-0 | www.nature.com/naturecommunications                               1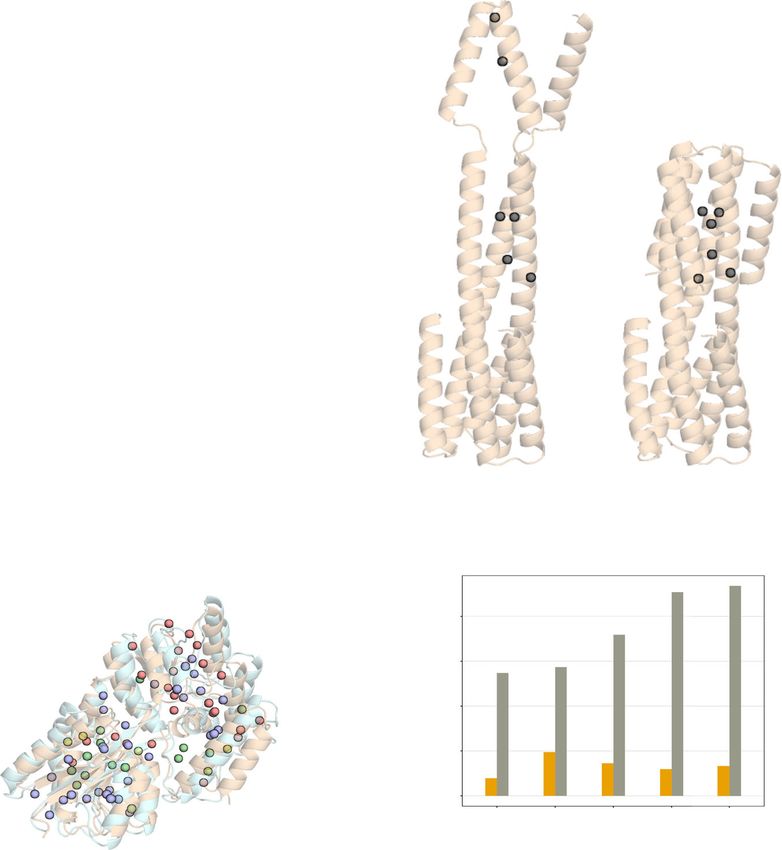
ARTICLE                                                                NATURE COMMUNICATIONS | https://doi.org/10.1038/s41467-021-20984-0

T
        he use of methyl probes has opened new avenues for the               determine all valid ways of mapping every H into G (termed
        application of nuclear magnetic resonance (NMR) meth-                subgraph isomorphism), which respects all the experimental
        ods to study large molecular machines1. The signal                   inputs. We test our method on a benchmark set of protein targets
enhancement offered by methyl-transverse relaxation optimized                in the 10–45 kDa size range and show that MAUS maintains a
spectroscopy (TROSY) techniques2 and a suite of experiments for              robust performance, providing 100% accurate assignments at
quantitative characterization of protein dynamics occurring over             high levels of completeness, while offering a significant perfor-
a broad range of timescales3 have rendered methyl-based NMR a                mance advantage relative to existing methods using the same
formidable tool for detailed mechanistic studies of important                inputs. Using MAUS, the methyl resonances of large, multi-
biological systems4. The main bottleneck in applications of                  domain proteins can be assigned accurately in a matter of days,
methyl-based NMR is obtaining confident resonance assign-                     completely bypassing the need for more laborious backbone-
ments. In the conventional approach, backbone assignments are                based NMR spectroscopy approaches.
first established using triple-resonance experiments5. Then,
methyl resonances are connected to the backbone using either
                                                                             Results and discussion
methyl out-and-back experiments6 or, more commonly, using
15N and 13C edited amide-to-methyl nuclear Overhauser effect                 Methyl assignments as a subgraph isomorphism problem.
                                                                             Rather than treating the methyl assignments as a maximum
(NOE) measurements7. However, in the absence of previously
                                                                             subgraph matching problem13, MAUS models the NOE data as a
established backbone assignments, deriving confident assign-
                                                                             sparse sample of all possible connectivities present in the input
ments for methyl resonances remains a challenge. Although site-
                                                                             structure. MAUS uses the NOE network together with additional
directed mutagenesis of individual methyl-bearing residues8
                                                                             experimental inputs, such as peak residue type information and
provides unambiguous assignments, the laborious, costly, and
                                                                             geminal methyl resonance connectivities, to build a system of
time-consuming nature of this approach limits applications to
                                                                             hard constraints. The constraints outline a subgraph isomorph-
study larger, multi-domain proteins.
                                                                             ism problem of fitting a sparse data graph H, into the original
   Recently, several automated methyl assignment methods have
                                                                             structure graph G (see “Methods” and Fig. 1a).
been proposed9–12. To circumvent the need for existing backbone
                                                                                To fully account for all methyl connectivities consistent with
assignments, methyl NOE data and a known structure of the
                                                                             the input structure and spin diffusion effects16, alternative side-
target protein can be used to derive a set of possible assignments,
                                                                             chain rotamers are modeled using the program Rosetta17 and
by fitting local NOE networks to methyl distances derived from
                                                                             maximum distances of 8 and 10 Å are applied to derive a
the three-dimensional (3D) structure. In general, these methods
                                                                             structure graph, G, containing all possible short- and long-range
start from fitting sub-sets of NOE connectivities to local clusters
                                                                             NOEs, respectively (Fig. 1b). In addition, MAUS explicitly
of methyls in the structure and then expand those to derive self-
                                                                             considers (i) all possible mappings of 3D NOE cross-peaks to
consistent assignments for the remaining methyl resonances. The
                                                                             two-dimensional (2D) reference peaks, or clusters (Fig. 1c), and
NOE peak intensities are then used in an optimization process
                                                                             (ii) all possible matchings between upper-diagonal and lower-
aiming to further reduce the space of solutions. However, any
                                                                             diagonal NOE cross-peaks, formally analyzed as connected
method that uses local information is bound to make mistakes
                                                                             components of a bipartite symmetrization graph (Fig. 1d). This
globally and, as a result, most of these methods can miss the
                                                                             approach relieves the user from the burden of interpreting the
correct (ground truth) assignments from their scope of solutions,
                                                                             raw data (3D or 4D NOE peaks), through an explicit and
yielding a significant (up to 55%) error rate. An alternative
                                                                             exhaustive consideration of all possible data graphs consistent
approach is to perform an exhaustive mapping of the global NOE
                                                                             with the input NOE peaks (Fig. 1e).
network to the target structure. This strategy was first outlined in
                                                                                MAUS leverages a special-purpose constraint satisfaction
the method MAGMA13, which treats methyl assignments as a
                                                                             solver (SAT) to enumerate all valid assignments using an iterative
maximum subgraph matching problem, and invokes a graph
                                                                             ansatz (see “Methods”). Using 3275 simulations of NOE data and
theory algorithm14 to enumerate all assignments, which satisfy
                                                                             structure graphs from a non-redundant set of 147 protein
the maximum number of NOE connectivities. If the input con-
                                                                             structures, we show that, relative to the VF2 algorithm15, SAT
tains only true positive NOE data (i.e., the NOE data graph is a
                                                                             maintains a robust performance for problems of different sizes,
subgraph of the structure graph), then MAGMA resorts to the
                                                                             topologies, and data sparsity levels, delivering accurate assign-
VF2 algorithm15. Alternatively, maximum subgraph matching
                                                                             ments in a matter of seconds (Supplementary Fig. 1). Finally,
provides a reasonable compromise to account for the minimum
                                                                             using the MAGMA benchmark set of eight targets13 with the
number of false-positive NOEs, with the caveat that the ground
                                                                             identical structure and data graphs provided to both programs,
truth solution may entail additional misidentified NOEs in the
                                                                             we find that, although MAGMA is marginally faster than MAUS
input. Moreover, MAGMA requires users to provide an anno-
                                                                             for targets, which can be solved relatively quickly by both
tated data graph, derived through an extensive, manual analysis
                                                                             methods, MAUS maintains a consistent performance across all
of 3D or four-dimensional (4D) NOE spectroscopy (NOESY)
                                                                             targets, including larger, more complex cases such as the 81.4 kDa
peak data, which introduces an additional processing step, lim-
                                                                             maltose synthase G (Supplementary Table 1, Supplementary
iting its use by non-experts.
                                                                             Results).
   In the present work, we describe an automated system (MAUS:
Methyl Assignments Using Satisfiability), which first formulates a
set of rules, and then provides a compact description of all                 MAUS workflow and results on targets with known assign-
assignment possibilities that are consistent with these rules.               ments. We tested MAUS using representative data sets recorded
Specifically, MAUS generates a structure graph, G, representing               for a benchmark set of four protein targets spanning a range of
all methyl NOE connectivities present in an input Protein Data               sizes, folds and domain complexities: human β2-microglobulin
Bank (PDB) structure or structural model of the protein of                   (Hβ2m; 12 kDa, all-β-fold, single domain), maltose-binding pro-
interest, and multiple independent data graphs, H, containing all            tein (MBP; 41 kDa, all-α-fold, two-domain), and two major his-
possible NOE networks, which can be derived from a list of raw               tocompatibility complex class-I (MHC-I) molecules of divergent
3D or 4D NOESY peaks. The NOE network is supplemented with                   heavy-chain sequences (HLA-A01; 45.5 kDa and HLA-A02;
residue type, stereospecificity, and geminal methyl connectivity              44.8 kDa, mixed α/β-fold, three-domain) (Table 1). The X-ray
constraints. Then, MAUS leverages an efficient algorithm to                   structures and ground truth assignments for these targets were

2               NATURE COMMUNICATIONS | (2021)12:691 | https://doi.org/10.1038/s41467-021-20984-0 | www.nature.com/naturecommunications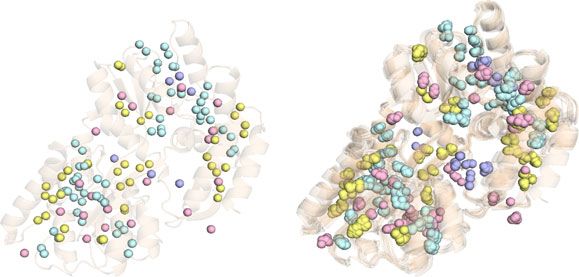
NATURE COMMUNICATIONS | https://doi.org/10.1038/s41467-021-20984-0 ARTICLE
a c NOE clustering CCH
(~230 possibilities)
Overlapping peaks
CCH
C (ppm)
2D HMQC peaks
NOESY peaks PDB structure/s
2D HMQC
C (ppm)
13
P2
C (ppm)
Cluster NOEs Sample low-energy 1
H (ppm) CCH
13
P8
side chain rotamers
13
C (ppm)
1
H (ppm) P1 P7 P6
Construct
symmetrization Construct structure NOESY
P3 P4 P5
13
graph graph
1
H (ppm)
Simple 1
H (ppm)
components millisecond d NOE symmetrization graph (~2 14
possibilities)
No computation
Exit Is SAT? CCH CCH Reduced graph
Constraints + MMs of CC4
cannot {
Satisfiable
simplify NS Next
Yes (keep edges)
(i) CC
CC4
Simplify ambiguous
Unsatisfiable
...
...
symmetries (ii)
CCn Round-1
Upper Lower
Construct data diagonal Long-range NOEs Short-range NOEs
diagonal
graphs Structure graph (C1 > C2) (C2 > C1)
Data graphs
e Clustering/Symmetrization H1
Enumerate all valid
assignments alternatives
b H2
H3 G
G Subgraph
....
PDB structure Alternative side Structure graph
........ isomorphism
or model chain rotamers Geminal connectivities (230 x 214 possibilities) (~2100 possible mappings)
(~50 - 150 methyls) Short-range
Long-range Hn
Fig. 1 Exhaustive enumeration of methyl assignments from raw NOE peaks. a Iterative workflow of the MAUS system. b Description of a structure graph,
G with (~50–150) methyls as nodes. The edges of G correspond to all possible short-range (blue; up to 6–8 Å), long-range (black; from 6 up to 10 Å), and
geminal methyl connectivities (green). c The 2D projections of 3D or 4D NOESY peaks are clustered (within tolerances; gray circles) to 2D HMQC
reference peak positions (P1…P8). A NOESY peak can be clustered uniquely (red) or ambiguously (green and blue; overlapping peaks), leading to ~230
clustering combinations for typical 3D CM-CMHM NOESY data. d The observed chemical shift coordinates (C1,C2,H2) of all NOE peaks are used to
construct a symmetrization graph, S, with partitions representing upper (C1 > C2) and lower (C2 > C1) diagonal cross-peaks. S has nodes represented by
short-range (blue) and long-range (black) NOEs, and edges connecting potentially symmetric NOE peaks. S has components of sizes 1 (no symmetry or
NS), 2 and 3 (simple), and >3 (complex, CC), producing ~214 possibilities in the case of data recorded for maltose-binding protein, MBP. Simple
components are used as constraints whereas complex components are reduced using an iterative process within MAUS: the maximum matchings (MMs)
of each complex component are tested for satisfiability; satisfiable edges are retained in S. e A N-ary tree showing data graphs (H1,H2,H3,…,Hn) generated
from all clustering and symmetrization alternatives (~244 possibilities); a majority of these data graphs do not lead to satisfying assignments and are
eliminated by MAUS (red circles). Each remaining H can be mapped in ~2100 possible ways onto G; all valid methyl resonance assignments are enumerated
and presented to the user in a compact form.
obtained from the PDB and BMRB, respectively. To obtain a determination of geminal connectivities for resonances corre-
consistent set of experimental data for all targets, we prepared sponding to 13Cγ1/13Cγ2 and 13Cδ1/13Cδ2 methyls of Val and Leu
13C/1H (MA)ILV-methyl-labeled samples and acquired one 2D residues, respectively. Finally, towards reducing spectral overlap
reference 1H-13C heteronuclear multiple quantum coherence in the 2D reference spectra of larger (>20 kDa) targets, we pre-
(HMQC) and two 3D 13CM-13CM1HM NOESY-HMQC spectra, pared proS-labeled samples, stereospecifically defining the reso-
recorded with short (50 ms) and long (300 ms) mixing times nances of Leu/Val methyls (Fig. 2). Using this information as
(Fig. 2, Supplementary Fig. 2, and Supplementary Table 2). input for MAUS, we find that among all possible clustering/
Besides providing supplementary short-range (ARTICLE NATURE COMMUNICATIONS | https://doi.org/10.1038/s41467-021-20984-0
Table 1 MAUS methyl resonance assignment statistics.
Target MW (kDa) PDB ID Origin/resolution (Å) Number of Labeling Short-range NOE % Unique % Options ≤ 3
methyls scheme distance assignments and >1
Hβ2ma 11.9 1JNJ NMR 35 AILV 6.5 89 11
HLA-A01 45.5 6AT9 X-ray/2.9 87 AILV 7.2 64 30
HLA-A02 44.8 1DUZ X-ray/1.8 94 AILV 6.0 70 15
MBP 40.7 1DMB X-ray/1.8 76 MILVproS 6.0 75 21
IL-2 15.4 1M47 X-ray/1.9 61 ILV 6.5 74 23
HNHb 15.7 6O56 NMR/1.9 53 ILV 8.0 89 11
REC2 15.6 4CMP X-ray/2.6 69 ILV 6.5 59 12
REC3 24.5 4ZT0 X-ray/2.9 85 ILV 8.0 67 28
aNon-stereospecific.
bUsed symmetrization and clustering tolerances of 0.1 ppm for 13C.
NMR samples
MAUS input MAUS output
(MA)ILV labeling sample 1
Leu-δ1 δ2 / Val-γ1 γ2
Ile
10
2D 1H-13C HMQC
13
CH3 Sequence
C (ppm)
15
- residue type
KVLPKHSLLYEYFTVYNEL Methyl assignment
12
CD 13
CH3 20 - distinguish Leu/ Val statistics
13
Leu/Val - reference methyl resonance
(MA)ILV 25
1.0 0.5 0.0 -0.5
Residue type
or 1
H (ppm)
classification
10
3D CCH-HMQC NOESY PDB structure/s
Leu-δ1 δ2 / Val-γ1 γ2
or model
C (ppm)
-short τmix: Leu/Val geminal
15
13
CH3 20
and short-range connectivities NOE assignments
13
13
CD 12 -long τmix: long-range connectivities
CD3 25
ILV* 25
13
20
C (ppm)
15 10
Valid assignment
2D peak list
Input data options
proS or proR labeling sample 2 3D peak lists
Leu-δ2 / Val-γ2 10
2D 1H-13C HMQC
- stereospecificity of Leu/Val
13 14
CH3 Expert NOE
C (ppm)
12 - confirm Leu/Val geminal
CD 12
18
Previous intensity analysis and
CD3 connectivities
13
22
- resolve overlap
partial assignments iterative assignment
(proS) 26
completion
1.0
1
0.6
H (ppm)
0.2 -0.2
- discrimination of Met/Ala
Fig. 2 Sample preparation, data collection, and methyl assignment workflow. Two separate protein samples are recommended for generating the
standard inputs of MAUS. Sample 1 uses non-stereospecific methyl labeling with either (i) 13C/1H labeling only at the methyls of Met, Ala, Leu, Val, and Ile
residues, on a 12C/2H background or (ii) 13C/1H labeling at the methyls and 13C/2H at the sidechains of methyl-bearing residues on a 12C/2H background,
creating linearized spin systems43, which can be used to unambiguously distinguish Leu/Val methyl resonances18 (Supplementary Figs. 4–6). When
sample i is used, resonances of Leu/Val peaks can be partially distinguished using an automated chemical shift-based classifier within MAUS (“Methods”).
Both samples can be used to define reference methyl chemical shifts using real-time (sample i) or constant-time (sample ii) 2D methyl-HMQC
experiments. Long-range (up to 10 Å) NOEs are recorded using a 3D CM-CMHM SOFAST NOESY experiment (300 ms mixing time). A complementary
NOESY experiment recorded with a short (typically 50 ms) mixing time is used to identify short-range NOEs, including between the geminal methyl
resonances of Leu and Val residues. An additional protein sample 2 is prepared with stereospecific labeling (proS or proR) of Leu and Val methyls, which
resolves spectral overlap in the 2D reference HMQC spectrum, and, together with sample 1, allows unambiguous determination of geminal methyl pairs for
Leu/Val. 13C nuclei are displayed in red. Steps of NMR data analysis are colored green, with the resulting data set illustrated as a red rectangle. The
standard input files for MAUS (blue) are the primary sequence, the PDB coordinate file or model structure, the 2D 1H-13C HMQC peak list, and two 3D
CM-CMHM SOFAST NOESY peak lists (recorded with short and long mixing time). MAUS also accepts partial assignments that could be included in the
user-annotated 2D 1H-13C HMQC list, together with a specification of allowed residue types, stereospecificity, and geminal methyl connectivities (if
present) for each 2D reference peak. The output includes methyl assignment statistics, residue type classification, NOE assignments, and final lists of
assignment options. Although MAUS does not consider the NOE peak intensities, this information can be evaluated by the user toward further reducing
assignment ambiguities in the output lists.
exhaustive subgraph isomorphism (H into G) enumerations using Robustness of MAUS to missing experimental inputs. For
the SAT algorithm (Fig. 1e). Given the sparsity of experimental optimal results, MAUS normally requires an NOE network with
NOE data sets and our definition of a valid solution, each sub- degree connectivity of 3.5 or greater (corresponding to an average of
graph isomorphism instance has up to 2100 valid solutions for a 1.75 experimentally observed NOE peaks per methyl). In order to
typical 100-methyl protein. However, the solution space is not unambiguously define the resonances of Leu and Val methyls and
uniformly distributed among methyl peaks; remarkably, results for apply these as constraints to MAUS, we recommend the use of a
all targets in our set show that the NOE network, residue type and homonuclear decoupling method18 (Supplementary Fig. 4c, d).
stereospecificity constraints are sufficient to provide unambiguous However, to account for cases where peak residue type information
assignments for a large fraction (64–89%) and low-ambiguity (two is not available experimentally, we also tested MAUS on all targets
to three) options for the majority (11–30%) of remaining methyl by either (i) defining resonances in the Leu/Val region as either Leu
resonances (Tables 1 and 2, and Supplementary Fig. 3). or Val, or (ii) engaging a chemical shift-based classifier, within
4 NATURE COMMUNICATIONS | (2021)12:691 | https://doi.org/10.1038/s41467-021-20984-0 | www.nature.com/naturecommunicationsNATURE COMMUNICATIONS | https://doi.org/10.1038/s41467-021-20984-0 ARTICLE
Table 2 Performance comparison of different methyl assignment programs.
Target (labeling No. of MAUS all MAUS LV MAGIC all MAGIC LV FLAMEnGO 2.4 MAP-XSII MethylFLYA
scheme) methyls defined ambiguous defined ambiguous
Hβ2m (AILV) 35 31/0 21/0 27/4 16/8 17/1 30/5 NDa
4/0 14/0 2/0 5/3 8/0 0/0
0/0 0/0 0/0 0/0 0/0 0/0
0 0 2 3 9 0
0% 0% 12% 34% 4% 14%
7 7 29 147 6 5
HLA-A01 (AILV) 87 56/0 48/0 58/4 50/11 56/3 79/8 64/0
26/0 30/0 17/1 11/0 1/0 0/0 0/0
5/0 9/0 3/0 2/4 0/0 0/0 0/0
0 0 4 9 27 0 0
0% 0% 6% 15% 5% 9% 0%
15 18 296 422 23 12 704
HLA-A02 (AILV) 94 66/0 45/0 57/5 NDb 64/3 78/16 77/0
14/0 14/0 24/0 0/0 0/0 0/0
14/0 35/0 3/0 0/0 0/0 0/0
0 0 5 27 0 0
0% 0% 6% 4% 17% 0%
17 18 203 31 15 1024
MBP (MILVproS) 76 57/0 46/0 49/5 NDb NDb 66/10 52/0
16/0 20/0 10/1 0/0 0/0
3/0 10/0 5/0 0/0 0/0
0 0 6 0 0
0% 0% 9% 13% 0%
19 21 100 17 853
IL-2 (ILV) 61 45/0 6/0 23/23 NDb 21/4 36/25 23/2
14/0 32/0 5/1 0/0 0/0 0/0
2/0 23/0 2/0 0/0 0/0 0/0
0 0 7 36 0 0
0% 0% 46% 16% 41% 9%
5 9 451 30 13 2553
HNH (ILV) 53 47/0 27/0 39/0 38/0 29/2 38/15 44/0
6/0 18/0 12/2 3/2 4/0 0/0 0/0
0/0 8/0 0/0 6/4 0/0 0/0 0/0
0 0 0 0 18 0 0
0% 0% 4% 5% 6% 28% 0%
4 4 50 79 15 12 814
REC2 (ILV) 69 41/0 37/0 21/3 26/7 23/4 28/35 7/2
8/0 12/0 20/4 14/5 0/0 0/0 0/0
20/0 20/0 6/3 3/1 0/0 0/0 0/0
0 0 12 13 42 6 0
0% 0% 15% 23% 15% 56% 29%
5 5 87 218 35 7 814
REC3 (ILV) 85 57/0 28/0 58/0 54/2 47/3 61/24
24/0 28/0 19/0 19/3 8/0 0/0 NDa
4/0 29/0 7/0 6/0 0/0 0/0
0 0 1 1 27 0
0% 0% 0% 6% 5% 39%
14 14 58 131 51 16
ND not determined.
For results using a chemical shift-based classifier of Leu/Val resonances, see Supplementary Table 4.
First row: number of methyls with one option correct/wrong.
Second row: number of methyls with 2–3 options correct/wrong.
Third row: number of methyls with >3 options correct/wrong.
Fourth row: number of unassigned methyls.
Fifth row: error rate (in %).
Sixth row: run time in minutes.
aMethylFLYA returned an error.
bThe simulations were allowed to run for at least 96 h but did not complete.
MAUS (see “Methods”). Removing Leu/Val residue type informa- assigned peaks. Nonetheless, the accuracy of all assignments
tion has a significant impact on MAUS performance, resulting in an remained 100% and the ground truth solution was valid across all
average of 27% decrease in assignment completeness across our targets (Table 2 and Supplementary Table 4). For example, for
benchmark set (Table 2, columns 3 and 4). Here, the use of the MBP, MAUS assigned 71% of resonances uniquely and an addi-
MAUS classifier to distinguish between confident Leu and Val tional 17% with two or three options while maintaining 100%
methyl resonances led to an improved average of 18% less uniquely accuracy, despite the absence of experimental residue type
NATURE COMMUNICATIONS | (2021)12:691 | https://doi.org/10.1038/s41467-021-20984-0 | www.nature.com/naturecommunications 5ARTICLE NATURE COMMUNICATIONS | https://doi.org/10.1038/s41467-021-20984-0
a b
0.3
Density
0.2
Assignments with 1-3 options (%)
1500
0.1
Time (in minutes)
90
0.0 1000
100 200 300 400 80
Target size (Number of methyls)
70
Number of cases
30 500
60
20
0
10
100 200 300 400
Target size (Number of methyls)
0
3.5 3.6 3.7 3.8 3.9 4.0 4.1 4.2
Degree connectivity
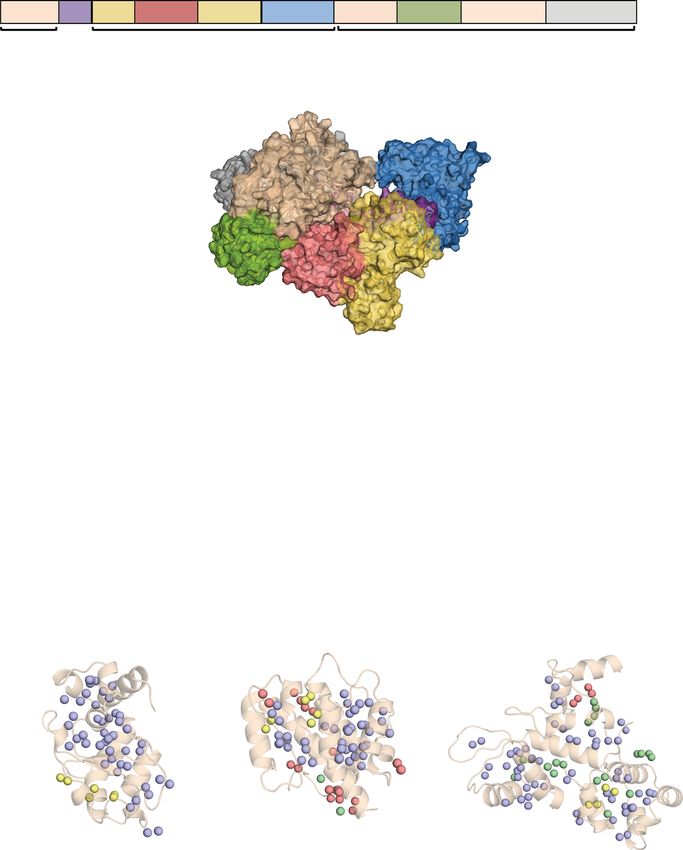
Fig. 3 Performance of MAUS on simulated ILV data graphs from larger proteins. a Top: target size distribution (in terms of number of methyl groups
from Ile, Leu, and Val residues) of 63 proteins with high-resolution PDB structures of sizes up to 116 kDa (352 methyls; PDB ID: 5WTI) (top). For each
target, a data graph H was simulated by removing edges from the corresponding structure graph G (defined as all methyl connectivities up to 10 Å present
in the 3D structure) until a degree connectivity (defined as 2 × number of edges/number of nodes) in the range of 3.5–4.2 was reached, corresponding to
1.75–2.1 simulated NOEs/methyl. Bottom: bar plot showing the distribution of degree connectivities among all simulated data graphs. b Scatter plot
showing run time (in minutes) taken by MAUS to perform exhaustive enumeration of the possible methyl assignment options for each H into G mapping
case. Colors indicate % of methyls with up to three assignment options, according to the scale on the right.
information. In addition, if users cannot provide any annotations of domain, PDB ID: 6FB3), albeit in a longer time (11 h on a single
the 2D reference peaks in the input, then MAUS inherently loses CPU), which is still feasible from a computational standpoint.
geminal connectivity constraints for all methyl resonances corre-
sponding to Leu and Val residues, in addition to the residue type. It
is therefore recommended, when using data sets where both gem- De novo resonance assignments of Cas9 nuclease domains. We
inal methyls are labeled, that MAUS is run using either missing further evaluated the performance of MAUS on deriving de novo,
geminal connectivity or Leu/Val residue type information, but blind assignments for four representative targets; three domains
not both. of the Cas9 nuclease and the therapeutic cytokine interleukin-2
(IL-2) (15.4 kDa) (Fig. 4 and Supplementary Figs. 5–7). These
comprise biomedically relevant proteins of mostly α-helical folds,
Performance of MAUS using simulated NOE networks from leading to a high degree of spectral overlap, which challenges
PDB structures. Although results using our benchmark set of automated assignment methods. Cas9 is a 160 kDa RNA-guided
four targets with known assignments and recently recorded data endonuclease, which introduces DNA double-strand breaks upon
highlight the utility of our method for proteins of sizes up to site-specific recognition of a short nucleotide Protospacer Adja-
~46 kDa, methyl-based NMR can be applied on much higher- cent Motif, preceding the cleavage site19. The Cas9 enzyme
molecular weight proteins. To test the size limit supported by comprises of a recognition lobe (REC) that forms an RNA:DNA
MAUS, we expanded our simulation benchmark set to include 63 hybrid through three subdomains (REC1–3), and a nuclease lobe
PDB structures with structure graphs containing more than 100 with HNH and RuvC domains, which cleave the DNA strand
methyls from Ile, Leu and Val residues (corresponding to system that is complementary and non-complementary to the guide
sizes of up to 116 kDa) (Fig. 3). We chose to simulate assignment RNA, respectively (Fig. 4a, b). Towards establishing methy-
cases corresponding to the Isoleucine-Leucine-Valine (ILV), as l assignments, we designed optimized constructs of individual
opposed to the Alanine-Isoleucine-Leucine-Valine (AILV) label- Cas9 domains, HNH (15.7 kDa), REC2 (15.6 kDa), and REC3
ing scheme, as a large fraction of the resonances corresponding to (24.5 kDa), showing well-dispersed methyl NMR spectra (Fig. 4c).
Ala methyls are missing from the spectra of larger proteins. For For these three domains, MAUS assigned 89%, 59%, and 67% of
each target, a data graph was simulated by removing edges from methyl resonances uniquely, and further provided assignment
the corresponding structure graph (defined as all methyl con- lists with two to three options for 11%, 12%, and 28%, respec-
nectivities up to 10 Å present in the 3D structure) until a degree tively, while always maintaining 100% accuracy, relative to the
connectivity (defined as 2 × number of edges/number of nodes) of ground truth assignments (Fig. 4d, Table 1, and “Methods”). We
3.5 or higher was reached. This value was chosen to represent applied a selective-decoupling experiment to distinguish Leu/Val
experimental cases with 1.75–2.1 observed NOEs/methyl reso- resonances18 (Supplementary Figs. 6 and 7) and used conven-
nance, which are characteristic of real-life data sets. We find that, tional methods to obtain reference backbone and methyl
as long as this requirement is satisfied, MAUS can efficiently assignments for validating the MAUS results (Supplementary
tackle the computational complexity of the graph-matching Results). Concurrently with the development of the present work,
problem and provide meaningful assignments in a reasonable the backbone and side-chain assignments for the HNH domain
time (up to 4 h on a single central processing unit, CPU), even for were obtained using a conventional backbone-based approach
larger targets. Specifically, our simulation results show that and released in the Biological Magnetic Resonance Data Bank
we can obtain a high coverage (60–80%) of methyl groups with (BMRB, entry 27949)20,21. The MAUS-derived methyl assign-
1–3 residue assignment options for targets up to 352 methyls. ments were in full agreement with the published results, which
Moreover, MAUS can address proteins of up to 716 methyls/ further highlights the practical utility of our method in saving
200 kDa (as exemplified by the Teneurin 2 partial extracellular machine time and manual effort spent.
6 NATURE COMMUNICATIONS | (2021)12:691 | https://doi.org/10.1038/s41467-021-20984-0 | www.nature.com/naturecommunicationsNATURE COMMUNICATIONS | https://doi.org/10.1038/s41467-021-20984-0 ARTICLE
a
1 56 94 167 307 506 714 776 908 1099 1368
RuvCI BH REC1 REC2 REC1 REC3 RuvCII HNH RuvCIII PI
NUC lobe Recognition (REC) lobe Nuclease (NUC) lobe
b
PI RuvC REC3
REC1
HNH
REC2
c
HNH Domain REC2 Domain REC3 Domain
I242δ1 I572δ1
I226Iδ
10 I801δ1
I852δ1
I697δ1
I186δ1 I201δ1 I580δ1
I170δ1 I632δ1
I282δ1 I619δ1
I795δ1 I305δ1 I211δ1 I600δ1 I670δ1
14 I784δ1
I830δ1
I615δ1
I679δ1 I601δ1
I667δ1
I892δ1 I708δ1
I300δ1
C (ppm)
I841δ1 I548δ1
18 V856γ2
V801γ1
V507γ2
V870γ2
V583γ1 V583γ2 V520γ1
V530γ1 V578γ1
V842γ2 L886δ2 V206γ1 V559γ2
L597δ2 V620γ1
V875γ1 V824γ2 V838γ1 V181γ1 V189γ1 L623δ2 V549γ1
13
L828δ2 V527γ1 V559γ1
L258δ2 L244δ2
22 V801γ2 L806δ2 V824γ1
V842γ1 V838γ2 L816δ2
V856γ1 V206γ2
L279δ2
L212δ2 L289δ2 L275δ1 V647γ2 L636δ2
V530γ2
V561γ1 L616δ2 V507γ1 V578γ2
V647γ1 L591δ2
V876γ2 L908δ2 L248δ2 L306δ2 L291δ2 L598δ1
L791δ2 L900δ2 L651δ2
V875γ2 V870γ1 L796δ2 L887δ1 L237δ1 L184δ2
V527γ2
L662δ2 V520γ2 V549γ2
L833δ2 L229δ2 V189γ2 L524δ2
V876γ2 L891δ2 L847δ1 L811δ1 L813δ2 L246δ2 L222δ1 L278δ1 L508δ2 L625δ2 L651δ1 L696δ2
L296δ1L306δ1
L188δ1 L248δ1
L264δ2 L621δ1 L666δ1 V561γ2
L857δ1 L847δ2
L908δ1 L816δ1 L266δ1 L551δ1 L607δ2 L607δ1
L791δ1 L900δ1 L258δ1 L212δ1
L241δ1 L241δ2 L666δ2
26 L796δ1
L811δ2 L891δ1 L833δ1 L887δ2
L296δ2
L279δ1
L222δ2 L289δ1
L264δ1
L621δ2
L616δ1
L514δ2
L680δ2
L702δ1
L524δ1
L662δ1
L886δ1 L828δ1 L184δ1 L246δ1 L188δ2 L278δ2 L564δ2 L513δ1
L806δ1 L266δ2 L244δ1 L508δ1 L591δ1
L237δ2 L540δ1 L683δ1
L857δ2 L813δ1 L291δ1 L229δ1
L696δ1
1.4 1.0 0.6 0.2 -0.2 1.4 1.0 0.6 0.2 -0.2 1.4 1.0 0.6 0.2 -0.2
1 1 1
H (ppm) H (ppm) H (ppm)
d
Fig. 4 Streamlined resonance assignments of Cas9 domains using MAUS. a Domain organization of SpyCas9 composed of the recognition lobe (REC)
and nuclease lobe (NUC). BH, bridge helix; PI, PAM-interacting. b Surface representation of SpyCas9 (PDB ID 4cmp) depicting the bilobed architecture.
Protein domains are colored as in a. c Single domains used in the divide-and-conquer approach. 1H-13C HMQC spectra of selectively labeled HNH (green),
REC2 (red), and REC3 (blue) domains at Ile δ1-13CH3; Leu, Val-13CH3/13CH3 positions, acquired at 800 MHz, 25 °C. The spectra of the individual domains
of Cas9 indicate that they retain their proper fold when in isolation. d Number of valid assignment options for each residue identified by MAUS for HNH,
REC2, and REC3, respectively. The colored spheres represent final valid resonance assignment options: violet (1 option), green (2 options), yellow
(3 options), and red (>3 options).
For IL-2, MAUS identified unique assignments for 74% and practically useful tool to study not only larger systems with
provided a short list (two to three) of confident options for an intractable backbone amide spectra, but also enabling routine
additional 23% of all methyl resonances (Table 1 and Supple- applications for the study of medium-sized targets.
mentary Fig. 3). With the MAUS lists in hand, we manually
considered the NOE peak intensities to reach complete (>95%)
assignments for all targets in a matter of hours. Our results show Comparison with previous methods. When compared with
that, together with the quality of the NMR sample, the protein other methyl assignment tools (MAGIC/FLAMEnGO2.4/MAP-
fold and methyl chemical shift dispersion is equally important for XSII) using the same inputs for all targets with known assign-
obtaining complete assignments. Notably, the amide 15N-1H ments in our benchmark set, MAUS produces 100% accurate
TROSY spectrum of the Cas9 REC3 domain exhibits a significant results, while the previous methods show error rates of up to
fraction of missing backbone amide resonances (~55%, residues (34/16/56%), and significantly lower assignment completeness
660–712), likely due to conformational exchange-induced line rates (Table 2 and Supplementary Table 5). Consistently with the
broadening. Thus, methyl-based NMR supported by MAUS, is a results obtained for our benchmark set, MAUS maintains an
NATURE COMMUNICATIONS | (2021)12:691 | https://doi.org/10.1038/s41467-021-20984-0 | www.nature.com/naturecommunications 7ARTICLE NATURE COMMUNICATIONS | https://doi.org/10.1038/s41467-021-20984-0
improved performance on the 4 blind targets in our set (IL-2, due to a subset of NOE constraints that are violated by more than
REC2, HNH, and REC3), in terms of both unambiguous 25 Å (Fig. 5b). This result justifies our choice of an exact subgraph
assignments and error rate (Table 2). isomorphism approach, since any attempt to arbitrarily remove
A recent commercially available method, MethylFLYA12, NOEs (i.e., edges of H) not explained by the input structure (i.e.,
outperforms the existing publicly available methyl assignment edges of G) could lead to a cascade effect, resulting to global
tools. We carried out a detailed comparison of MAUS (also changes in the space of solutions.
readily available to users via an online interface) with Methyl- In summary, we demonstrate that a satisfiability-based
FLYA on the eight targets used in our study, by providing the approach can deliver reliable assignments for a range of targets
identical inputs to both methods. Upon comparison of the amenable to solution-state NMR, using unprocessed NOE peak
number of resonances assigned uniquely by MAUS and with high data (3D or 4D peak lists) and an existing structural model with
confidence by MethylFLYA, we find that MAUS outperforms the correct overall fold. Our results using NOESY spectra
MethyFLYA for 6/8 targets in our set (Hβ2m, MBP, IL-2, HNH, recorded for proteins with known assignments as well as for
REC2, and REC3). Specifically, (i) for IL-2 and REC2, Methyl- several blind targets show that, unlike previous methods, MAUS
FLYA reports a significantly lower number of confident assign- provides 100% accurate solutions for a large fraction (60–80%) of
ments (38% and 10%) relative to MAUS (74% and 60%), while methyl groups, thereby reducing manual effort, costs, and errors
also producing two incorrect assignments for each target, (ii) for introduced due to manual pre-processing and validation of the
HNH and MBP, it produces confident assignments at lower data. We further demonstrate that, in the absence of high-
completeness levels, and (iii) for Hβ2m and REC3, MethylFLYA resolution structures or structural homologs in the PDB, sequence
crashes (segmentation fault), producing no results. Although co-evolution-based models can be used by MAUS, without
MethylFLYA assigns a higher fraction of methyl resonances for compromising the correctness of produced assignments. Alter-
the two larger targets in our set (HLA-A01 and HLA-A02), it natively, for larger, multi-domain proteins with complex methyl
requires a prohibitively longer computation time on a single CPU spectra, a user may apply a divide-and-conquer strategy,
and, in general, it is less efficient than MAUS by two to three supported by MAUS. Using our online web-server, users can
orders of magnitude (Table 2). Finally, although MethylFLYA now assign the methyl spectra of large, multi-domain proteins in
provides low-confidence options for some of the unassigned a matter of a few days, also considering the time it takes to record
methyl resonances, MAUS provides a list of valid options for each the NMR data. Our method opens new possibilities for studying
2D reference peak, which contains the correct assignment, challenging, complex molecular machines, as illustrated here for
owning to the fact that it applies a satisfiability-based enumera- the Cas9 nuclease.
tion process that is both exact, and exhaustive.
Methods
Protein expression and purification of benchmark targets. DNA corresponding
Consistent methyl assignments guided by sequence-based to the luminal domains of Hβ2m, HLA-A*01:01, and HLA-A*02:01 expressed in
models. The structures of targets which lack a representative Escherichia coli BL21 (DE3) cells, refolded and purified as described27,28. Briefly,
Hβ2m, HLA-A*01:01, and HLA-A*02:01 induced with 1 mM isopropyl β-D-1-
template in the PDB can be modeled using homology-based thiogalactopyranoside (IPTG) at an OD600 of 0.7 at 37 °C for 4 h, isolated from
methods22 or, in cases with no identifiable sequence homologs in inclusion bodies and refolded in vitro. Inclusion bodies were isolated from E. coli
the PDB, sequence co-evolution approaches23,24. To examine the cell pellets by sonication, following by a wash with 100 mM Tris pH 8, 2 mM
latter, more challenging case, we used trRosetta (transform- EDTA, 0.1% (v/v) deoxycholate, and solubilization in 5.5 M guanidine hydro-
restrained Rosetta)25, which has demonstrated high accuracy for chloride under reducing conditions. For in vitro refolding of Hβ2m, 100 mg protein
was slowly diluted dropwise over 24 h into refolding buffer (0.4 M arginine-HCl,
complex Critical Assessment of Structure Prediction26 targets. 2 mM EDTA, 4.9 mM reduced L-glutathione, 0.57 mM oxidized L-glutathione,
We derived a set of models for a representative case in our 100 mM Tris pH 8.0) at 4 °C while stirring. For in vitro refolding of HLA-A*01:01
benchmark set, MBP using the trRosetta web-server, and used and HLA-A*02:01, 10 mg of peptide (ILDTAGKEEY for HLA-A*01:01 and
this together with our experimental NOE data recorded on a LLFGYPVYV for HLA-A*02:01), and 100 mg heavy chain and 100 mg Hβ2m were
slowly diluted dropwise over 24 h into refolding buffer (0.4 M arginine-HCl, 2 mM
MILVproS sample (Supplementary Table 2) to run MAUS. The EDTA, 4.9 mM reduced L-glutathione, 0.57 mM oxidized L-glutathione, 100 mM
models showed a 3.3 Å average all-atom root-mean-square Tris pH 8.0) at 4 °C while stirring. All refolding proceeded for 4 days at 4 °C
deviation (RMSD) from the X-ray structure, nonetheless, without stirring. Purification of Hβ2m, HLA-A*01:01, and HLA-A*02:01 was
MAUS still provided unique and low-ambiguity (two to three performed by size-exclusion chromatography (SEC) with a HiLoad 16/600
Superdex 75 pg column at 1 mL/min with running buffer (150 mM NaCl, 25 mM
options) assignments for 68% of resonances (relative to 96% Tris pH 8).
using the X-ray structure), while maintaining 100% accuracy XAA was expressed in E. coli BL21 Star (DE3) cells and purified as described26.
(Fig. 5a). Briefly, XAA was induced with 0.1 mM IPTG at an OD600 of 0.6 and expressed at
As structure prediction methods may also lead to globally 18 °C for 17 h. Cells were resuspended in lysis buffer (25 mM Tris pH 8, 300 mM
NaCl, 20 mM imidazole) and lysed by sonication. Supernatant was applied to
incorrect models, we examined whether MAUS can distinguish nickel-nitrilotriacetic acid (Ni-NTA) resin pre-equilibrated with lysis buffer. The
between two closely related structures of the same protein column was rinsed with ten column volumes of wash buffer (25 mM Tris pH 8,
sequence directly from unprocessed 3D NOE peaks (picked 300 mM NaCl, 20 mM imidazole). XAA was eluted using two column volumes
directly from 3D NOESY data using a signal-to-noise (S/N) elution buffer (25 mM Tris pH 8, 300 mM NaCl, 250 mM imidazole). The
ratio ≥ 5). To test this, we used a designed homotrimeric protein hexahistidine tag was removed via thrombin cleavage by incubating with 1 : 5000
thrombin (EMD, Millipore) for 15 h at 25 °C. Cleaved XAA was purified by SEC
(XAA) consisting of a multi-layer, three-helix bundle with using a Superdex 75 10/300 GL column (GE Healthcare) at 1 mL/min with running
modular termini that may adopt two divergent structures buffer (150 mM NaCl, 25 mM Tris pH 8).
corresponding to an open (observed by X-ray) and a closed The MBP-cyclodextrin complex was prepared as described previously29. Briefly,
state, which corresponds to the solution structure determined MBP was expressed in E. coli strain BL21(DE3) cells, induced with 1 mM IPTG at
an OD600 of 0.7 and expressed at 37 °C for 5 h. Purification of MBP-cyclodextrin
using manual NOE assignments by our group27. Starting from the was achieved as follows. First, MBP was bound to an amylose affinity column in the
unassigned NOE peaks, we ran MAUS using both models as presence of binding buffer (150 mM NaCl, 25 mM Tris pH 8, 1 mM EDTA) and
inputs including both intra- and inter-chain connectivities in the then eluted using eluted buffer (150 mM NaCl, 25 mM Tris pH 8, 1 mM EDTA,
structure graph G, and found that only the closed state led to 10 mM maltose). Second, MBP was further purified by SEC with a HiLoad 16/600
Superdex 75 pg column at 1 mL/min with running buffer (150 mM NaCl, 25 mM
assignments which satisfy the global NOE network within our Tris pH 8). MBP was then partially unfolded for 3 h at 25 °C in 150 mM NaCl,
default 10 Å upper limit. MAUS finds that the data graph is not 25 mM Tris pH 8, 2.5 M guanidinium hydrochloride, and refolded by dilution into
isomorphic to the structure graph derived from the open state, GuHCl-free buffer containing 2 mM β-cyclodextrin. Following purification all
8 NATURE COMMUNICATIONS | (2021)12:691 | https://doi.org/10.1038/s41467-021-20984-0 | www.nature.com/naturecommunicationsNATURE COMMUNICATIONS | https://doi.org/10.1038/s41467-021-20984-0 ARTICLE
a b L93S
Sequence
L86S
Deep residual
neural network
I65 I66
Distance restraints & I65 I66
L86S
trRosetta
Orientation distributions
V59S V59S
A56
A56 L93S
Rosetta energy
minimization
Low-resolution
models
Sample low-energy
side chain conformations
High-resolution models Open (X-ray) Closed (Solution NMR)
NMR data MAUS MAUS: UNSAT MAUS: SAT
Open Closed
Resonance assignments
40
Assignment
Distance (Å)
options 30
1
20
2
3 10
>3
0
S
56
S
6
5
-I6
-I6
59
86
-A
6S
6S
-V
-L
3S
9S
3S
L8
L8
L9
trRosetta model 1DMB
V5
L9
Fig. 5 Robustness of MAUS assignments from different structural models. a Top: flowchart showing the combined de novo structure modeling and
methyl resonance assignment strategy using trRosetta (transform-restrained Rosetta) and MAUS, respectively. (bottom) Overlay of trRosetta model
(wheat) and X-ray structure (PDB ID: 1DMB; pale cyan) of maltose-binding protein. Number of resonance assignment options identified by MAUS are
indicated by colored spheres (violet: 1, green: 2, yellow: 3 and red: >3). b Top: structures of a designed homotrimeric protein27, in the open (solved by X-ray
crystallography) and closed (solved by solution NMR) states showing inter-methyl distances corresponding to experimental NOEs identified in a 3D
CM-CMHM NOESY spectrum, assigned manually27. Gray spheres show methyl residues participating in the NOE network. The dashed lines represent
pairwise distances in the two models, also shown as bar plots (bottom) for the open (gray) and closed (golden) states. The dashed line in the bar plot
highlights the 10 Å NOE upper distance limit used by MAUS. Using the unassigned NOE peaks, MAUS delivers a set of satisfying assignments when
provided with a model of the closed, but not of the open structure as input.
proteins were exhaustively buffer exchanged in their respective buffers (see section TEV (Tobacco Etch Virus) protease and the cleaved affinity tag, and further
“Stereospecific isotopic labeling”). purified by SEC on a Superdex 200 16/60 column (GE Healthcare) in 20 mM Tris
pH 7.5, 200 mM KCl, 1 mM TCEP, and 5% (vol/vol) glycerol.
Streptococcus pyogenes Cas9 domain constructs. The coding sequences for Cas9
Human IL-2 expression, refolding, and purification. Codon optimized DNA
HNH (residues 776–908) and REC2 domains (residues 167–307) were synthesized,
encoding the human IL-2 (amino acids 1–133) with a site-specific mutation
codon optimized for expression in E. coli, and subcloned into a His10-MBP
(C140S) (Supplementary Table 6) was expressed in BL21 (DE3) E. coli cells as
expression vector (Genscript) (Supplementary Table 6). pSHS325 bacterial
inclusion bodies. Protein expression was achieved by induction with 1 mM IPTG at
expression plasmid for SpCas9 REC3 domain was a gift from Jennifer Doudna &
an OD600 of 0.6 followed by cell growth at 37 °C for 5 h at 200 r.p.m. For in vitro
Keith Joung (Addgene plasmid #101205)30. Each protein was expressed in E. coli
refolding, ~30 mg of inclusion bodies was dropped diluted into 200 mL of refolding
BL21 (DE3) containing chaperone plasmid pG-KJE8 (TAKARA, 3340) to enhance
buffer (1.1 M guanidine, 6.5 mM cysteamine, 0.65 mM cystamine, 110 mM Tris pH
protein folding31 and purified as described below32. Briefly, when cells reached an
8.0) at 4 °C while stirring. Refolding proceeded overnight at 4 °C without stirring.
OD600 of ~0.6, IPTG was added to a final concentration of 0.5 mM to induce
The solution was dialyzed into a buffer of 20 mM MES pH 6.0, 25 mM sodium
protein expression. Cells were then grown for an additional 18 h at 23 °C. Collected
chloride. Purification of refolded IL-2 was performed by cation exchange chro-
cells were resuspended in lysis buffer (50 mM Tris pH 7.5, 500 mM NaCl, 5% (v/v)
matography with a CAPTO-SP column using a 25 mM to 1 M NaCl gradient in a
glycerol, and 1 mM Tris(2-carboxy-ethyl) phosphine (TCEP) containing an EDTA-
buffer with 25 mM MES pH 6.0 followed by SEC with a Superdex 75 column (GE)
free protease inhibitor tablet (Roche). The cell suspension was sonicated on ice and
at 0.5 mL/min with running buffer (50 mM NaCl, 20 mM sodium phosphate pH
clarified by centrifugation at 27,000 × g for 15 min. The soluble lysate fraction was
6.0). Protein concentrations were determined using A280 measurements on a
bound in batch to Ni-NTA agarose (Qiagen). The resin was washed extensively
NanoDrop with extinction coefficients estimated with the ExPASy ProtParam tool.
with 20 mM Tris pH 7.5, 500 mM NaCl, 1 mM TCEP, 10 mM imidazole, and 5%
(vol/vol) glycerol, and the bound protein was eluted in 20 mM Tris pH 7.5,
500 mM NaCl, 1 mM TCEP, 300 mM imidazole, and 5% (vol/vol) glycerol. The Preparation of NMR samples, backbone, and methyl assignments. All proteins
His10-MBP affinity tag was removed with His10-tagged TEV protease during were overexpressed in M9 medium in 2H2O containing 2 g l−1 2H13C glucose
overnight dialysis against 20 mM Tris pH 7.5, 500 mM NaCl, 1 mM TCEP, and 5% (Sigma #552151) and 1 g l−1 15NH4Cl. Selective methyl labeling, referred to as
(vol/vol) glycerol. The protein was then flowed over Ni-NTA agarose to remove ILV*, was achieved by the addition of appropriate precursors (ISOTEC Stable
NATURE COMMUNICATIONS | (2021)12:691 | https://doi.org/10.1038/s41467-021-20984-0 | www.nature.com/naturecommunications 9ARTICLE NATURE COMMUNICATIONS | https://doi.org/10.1038/s41467-021-20984-0
Isotope Products (Sigma-Aldrich) as detailed previously28,33. ILV-methyl (Ile distance between all pairs of protons from the two methyl groups (Eq. (1)):
13Cδ ; Leu 13Cδ /13Cδ ; Val 13Cγ /13Cγ ) U-[15N, 2H]-labeled proteins were ! 1
1 1 2 1 2
1X 3 X3 6 6
prepared in M9 medium in 2H2O, supplemented with 2 g l−1 2H12C glucose (Sigma ð1Þ
−1 15 Δs ðp; qÞ ¼ d pi ; qj
#552003) and 1 g l NH4Cl. De novo stereospecific methyl assignments were 9 i¼1 j¼1
achieved by utilizing three independently prepared isotopically labeled samples:
AILV or ILV (Ala Cβ; Ile 13Cδ1; Leu 13Cδ1/13Cδ2; Val 13Cγ1/13Cγ2 in an
13 Where p and q are methyl groups and pi and qj represent protons of each methyl
otherwise U-[15N, 12C, 2H] background), ILVproS (Ile 13Cδ1; Leu 13Cδ2; Val 13Cγ2 group in an input structure s, and d denotes the Euclidean distance. When cal-
in an otherwise U-[15N, 12C, 2H] background), and ILV* (Ile 13Cδ1 only; Leu culating an effective distance between the nine pairs of methyl protons, the average
13Cδ /13Cδ ; Val 13Cγ /13Cγ in an otherwise U-[15N, 13C, 2H] background). We
1 2 1 2
value of the distances (i.e., multiplicity correction) used here results in a minor
employed a multipronged approach where backbone assignments are used to aid increase in upper distance bounds relative to more commonly used r−6 summa-
the assignment of side-chain methyl groups. Specifically, we first obtained back- tion. For instance, if we have three distance measures 4 Å, 5.5 Å, and 7 Å, the
bone assignments using TROSY-based 3D HNCA, HN(CA)CB, and HNCO regular r−6 summation results in a value of 3.9 Å, whereas the average value is
experiments recorded with the ILV*-labeled samples. Acquisition times of 30 ms 4.7 Å, which remains within the range of the observed interproton distances. Due
(15N), 14 ms (13CO), and 10/5 ms (13Cα /13Cβ) in the indirect dimension were to the fact that MAUS explicitly considers different side-chain rotamers in addition
used. Backbone amide assignments were confirmed using amide-to-amide NOEs to applying relatively large upper distance thresholds, the exact choice of distance
obtained from 3D HM-NHN and 3D N-NHN SOFAST NOESY-HMQC experi- averaging does not influence our results significantly (as opposed to a more precise
ments7. Final backbone assignments were further validated using TALOS-N. Next, estimate of upper bounds that is required for NMR structure determination
Ala, Ile, Leu, and Val methyl assignments were achieved using methyl-to-methyl applications).
NOEs observed in 3D HM-CMHM and 3D CM-CMHM SOFAST NOESY-HMQC in To account for alternative side-chain rotamers, the input structure is subjected
addition to methyl-to-amide NOEs observed in 3D HN-CMHM and 3D CM-NHN to n (quick: 10 or thorough: 100) independent relaxations using the FastRelax38
SOFAST NOESY-HMQC experiments7 recorded on the AILV- or ILV-labeled protocol in Rosetta. Therefore, the element of the adjacency matrix Δ(p, q) is
samples. For the 3D HN-CMHM SOFAST NOESY, the acquisition parameters were defined by taking the minimum of the distance functions observed among all
64, 48, and 1280 complex points in the 1HN, 13CM, and 1HM dimensions with sampled conformations (Eq. (2)):
corresponding acquisition times of 14.5, 10.8, and 79 ms with eight scans/FID. For Δðp; qÞ ¼ mins2S Δs ðp; qÞ ð2Þ
the 3D N-CMHM SOFAST NOESY, the acquisition parameters were 48, 40, and
1280 complex points in the 15N, 13CM, and 1HM dimensions with corresponding We call an edge of the structure graph, G (i) geminal, if it corresponds to a
acquisition times of 26, 9, and 79 ms with eight scans/FID (free induction decay), connectivity between the γ1/γ2 and δ1/δ2 methyls of Leu and Val residues, (ii) long-
respectively. range if 6 Å < Δ(p, q) ≤ 10 Å, and (iii) short-range if Δ(p, q) ≤ 6 Å.
Leu/Val geminal pairs were determined by comparing NOE strips in 3D
CM-CMHM SOFAST NOESY experiments recorded using short (50 ms) and long Deriving all possible data graphs, H, from the input NOE data. The two 3D
(300 ms) mixing times. The acquisition parameters for the 3D HM-CMHM SOFAST NOESY spectra (recorded with short and long mixing times) are picked at a typical
NOESY and 3D CM-CMHM SOFAST NOESY are provided in Supplementary S/N level of 5 or higher and provided as an input list of (C1, C2, H2) coordinates.
Table 2. Ile δ1 methyl types were identified by their characteristic upfield chemical In addition, a high-resolution 2D reference methyl-HMQC spectrum is picked to
shifts. Leu and Val methyl types were identified using phase-sensitive 2D 1H-13C identify all reference (C, H) methyl resonances. For larger (>20 kDa) protein tar-
HMQC experiments recorded on the ILV*-labeled sample18. Alanine methyl types gets, simultaneous consideration of the 2D spectrum from a separate, stereo-
were identified by comparing 2D 1H-13C HMQC spectra of AILV and ILVproS specifically labeled proS sample helps resolve overlap, to identify the exact 13C and
samples, and by comparing Ala Cβ chemical shifts from HN(CA)CB experiments. 1H chemical shifts corresponding to each observable methyl in the NMR sample.
Finally, stereospecific Leu δ2 and Val γ2 methyl assignments were obtained by The 2D reference and two 3D NOESY peak lists are provided as inputs to MAUS.
comparison of 2D 1H-13C HMQC spectra of AILV- and ILVproS-labeled samples. We model all alternative NOE connectivities resulting from overlap in the input
All the data were recorded at a 1H field of 750 or 800 MHz at 25 °C. The 3D 2D and 3D spectra, to allow an explicit consideration of all possible data graphs, H,
SOFAST NOESY experiments were recorded at 800 MHz, 25 °C using a recycle which are consistent with the input data. First, a 3D NOESY cross-peak can be
delay of 0.2 s, and NOE mixing time of 50 ms and 300 ms. Typical data acquisition projected to one or several 2D reference peaks (Fig. 1c). In particular, a 3D
times were 1 h for the 2D HMQC, 8–10 h for the 50 ms, and 12–14 h for the 200 ms maximum (C1, C2, H2) can be projected to a 2D maximum (C, H) if and only if
3D SOFAST NOESY-HMQC experiments. All spectra were acquired using the following holds true (Eqs. (3) and (4)):
Topspin 3 acquisition software from Bruker. The data were processed in
NMRPipe34 and analyzed in NMRFAM-SPARKY35 and CcpNMR36 programs. jC2 Cj < Ctol
cluster
ð3Þ
Stereospecific isotopic labeling. A specifically methyl-labeled acetolactate pre- jH2 H j < cluster
Htol ð4Þ
cursor (2-[13CH3], 4-[2H3] acetolactate) was obtained through deprotection and The tolerance values are set, by default, to 0.15 p.p.m. for 13C and 0.02 p.p.m.
exchange of the protons of the methyl group in position four of ethyl 2-hydroxy-2- for 1H chemical shifts. NOE peaks with no identifiable projection, as well as
(13C)methyl-3-oxobutanoate (FB reagents) achieved in D2O at pH 1337. Typically, diagonal NOEs are eliminated. This process yields clusters of tentative NOE
300 mg of ethyl 2-hydroxy-2-(13C)methyl-3-oxobutanoate was added to 24 mL of a connectivities for each peak in the 2D reference set.
0.1 M NaOD/D2O solution. After 30 min, the solution was adjusted to neutral pH Second, each valid (true positive) connectivity present in the input data must
with DCl and 2 mL of 1 M Tris pH 8.0 in D2O was added. For the production of arise from one upper-diagonal NOE cross-peak with one corresponding,
highly deuterated [U-2H], I-[13CH3]δ1, L-[13CH3]proS, V-[13CH3]proS samples, symmetry-related lower-diagonal counterpart. However, identifying unique
300 mg/L of 2-[13CH3], 4-[2H3] acetolactate, prepared as described above, was symmetry relations between pairs of 3D NOE cross-peaks can be challenging due
added 1 h prior to induction (OD600 ≈ 0.55). Forty minutes later (i.e., 20 min prior to spectral overlap. Specifically, two 3D NOE peaks (C1, C2, H2) and (C1′, C2′,
to induction), 3,3-[2H2],4-[13C]-2-ketobutyrate (SIGMA #589276) was added to a H2′) are potentially symmetric (Eqs. (5) and (6)) if and only if
final concentration of 60 mg/L. Each protein was induced as described above.
jC2 C10 j < Ctol
sym
ð5Þ
For each labeled protein sample, the concentration and buffer composition was
as follows:
jC1 C20 j < Ctol
sym
- 0.5 mM HLA-A01 in 20 mM sodium phosphate (pH 7.2), 50 mM NaCl, 5% ð6Þ
D2O. To explore all possible symmetry relations present in the input data, we
- 0.5 mM HLA-A02 in 20 mM sodium phosphate (pH 7.2), 50 mM NaCl, 5% construct a bipartite symmetrization graph connecting upper-diagonal to lower-
D2O. diagonal NOE cross-peaks (Fig. 1d). An edge appears between all pairs of peaks
- 1.3 mM Hβ2m in 20 mM sodium phosphate (pH 7.2), 50 mM NaCl, 5% D2O. that are potentially symmetric. For typical NOE data sets, the bipartite
- 0.5 mM XAA domain in 20 mM sodium phosphate (pH 6.2), 100 mM NaCl, symmetrization graph consists of several connected components (Fig. 1d). Isolated
5% D2O. peaks are eliminated. Components of sizes 2 and 3, termed simple, provide edges of
- 0.8 mM MBP domain in 20 mM sodium phosphate (pH 7.2), 50 mM NaCl, the data graph, H. Larger, complex components are iteratively reduced to smaller
5% D2O. ones using explicit satisfiability, eliminating edges that do not yield satisfying
- 2.0 mM HNH domain in 20 mM HEPES (pH 7.5), 80 mM KCl, 5% D2O. assignments in exhaustive enumerations, as outlined in detail below (Fig. 1d).
- 0.5 mM REC2 domain in 20 mM sodium phosphate (pH 7.2), 50 mM NaCl,
5% D2O. Reducing subgraph isomorphism to satisfiability. A boolean function ƒ on a set
- 0.7 mM REC3 domain in 20 mM HEPES (pH 7.5), 200 mM KCl, 5% of boolean variables x ¼ fx1 ; x2 ; x3 :::; xn g is said to be satisfiable if there exists
deuterated glycerol-d8, 1 mM TCEP, 0.01% NaN3, 5% D2O.
an assignment x 2 f0; 1gn such that ƒ(x) evaluates to 1. The question of whether a
- 0.4 mM IL-2 in 20 mM sodium phosphate (pH 6.0), 50 mM NaCl, 5% D2O.
function f is satisfiable is known as the satisfiability (SAT) problem in computer
science. A boolean function ƒ is in conjunctive normal form (CNF) if it is a
Generating a structure graph G in MAUS system. The input PDB structure is conjunction of one or more clauses, where a clause is a disjunction of literals; in
utilized by MAUS to construct an undirected graph G (Fig. 1b). First, for all pairs of other words, it is an AND of ORs. Although satisfiability is NP-complete, i.e.,
methyls in the input structure, we compute the following function of the average theory suggests that no polynomial-time algorithm exists, in practice, efficient
10 NATURE COMMUNICATIONS | (2021)12:691 | https://doi.org/10.1038/s41467-021-20984-0 | www.nature.com/naturecommunicationsYou can also read