Projecting Pharmaceutical Expenditure in EU5 to 2021: Adjusting for the Impact of Discounts and Rebates
←
→
Page content transcription
If your browser does not render page correctly, please read the page content below
Applied Health Economics and Health Policy
https://doi.org/10.1007/s40258-018-0419-1

 ORIGINAL RESEARCH ARTICLE

Projecting Pharmaceutical Expenditure in EU5 to 2021: Adjusting
for the Impact of Discounts and Rebates
Jaime Espin1 · Michael Schlander2,3 · Brian Godman4,5 · Pippa Anderson6 · Jorge Mestre‑Ferrandiz7                        ·
Isabelle Borget8,9,10 · Adam Hutchings11 · Steven Flostrand12 · Adam Parnaby12 · Claudio Jommi13,14

© The Author(s) 2018

Abstract
Background Within (European) healthcare systems, the predominant goal for pharmaceutical expenditure is cost contain-
ment. This is due to a general belief among healthcare policy makers that pharmaceutical expenditure—driven by high
prices—will be unsustainable unless further reforms are enacted.
Objective The aim of this paper is to provide more realistic expectations of pharmaceutical expenditure for all key stakeholder
groups by estimating pharmaceutical expenditure at ‘net’ prices. We also aim to estimate any gaps developing between list
and net pharmaceutical expenditure for the EU5 countries (i.e. France, Germany, Italy, Spain, and the UK).
Methods We adjusted an established forecast of pharmaceutical expenditure for the EU5 countries, from 2017 to 2021,
by reflecting discounts and rebates not previously considered, i.e. we moved from ‘list’ to ‘net’ prices, as far as data were
available.
Results We found an increasing divergence between expenditure measured at list and net prices. When the forecasts for the
five countries were aggregated, the EU5 (unweighted) average historical growth (2010–2016) rate fell from 3.4% compound
annual growth rate at list to 2.5% at net. For the forecast, the net growth rate was estimated at 1.5 versus 2.9% at list.
Conclusions Our results suggest that future growth in pharmaceutical expenditure in Europe is likely to be (1) lower than
previously understood from forecasts based on list prices and (2) below predicted healthcare expenditure growth in Europe
and in line with long-term economic growth rates. For policy makers concerned about the sustainability of pharmaceutical
expenditure, this study may provide some comfort, in that the perceived problem is not as large as expected.

                                                                        Key Points for Decision Makers

                                                                        Pharmaceutical policy is sometimes driven by limited
                                                                        data.
                                                                        Our aim was to fill an important gap in the difference
                                                                        between list and net pharmaceutical expenditure in the
                                                                        EU5 and describe how that difference might evolve in
                                                                        the near future.
                                                                        Available data indicate that the list versus net pharma-
                                                                        ceutical expenditure gap is significant and increasing.
                                                                        Our results suggest that pharmaceutical expenditure is
                                                                        under control, below predicted healthcare expenditure
                                                                        growth in Europe, and in line with long-term economic
                                                                        growth rates.

* Jorge Mestre‑Ferrandiz
  jormesfer13@gmail.com
Extended author information available on the last page of the article

                                                                                                                    Vol.:(0123456789)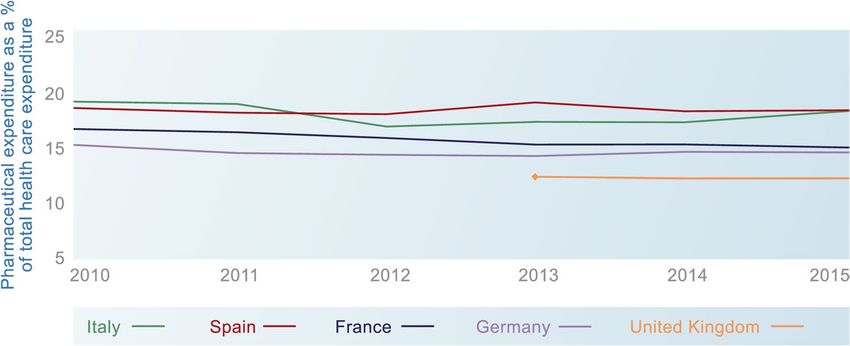
J. Espin et al.

1 Introduction                                                  and budgeting activities are also increasing among Euro-
                                                                pean countries [6–8]. Some forecasts are also available for
European healthcare systems are under pressure to manage        orphan medicines, where the high cost per patient does
rising healthcare costs associated with changing demo-          not necessarily translate into issues of ‘affordability’ [9].
graphics, rising patient expectations, and the launch of            Forecasts are available from commercial organisations,
new, premium-priced medicines (and healthcare technolo-         with two different fundamental methodologies utilised. Most
gies more generally) addressing areas of unmet need. A          common are predictions based on reported sales data from
seminal paper on the drivers of healthcare costs pointed        pharmaceutical company financial returns, which extrapolate
to ‘innovation’ as the major cost driver; this was consid-      forward based on historical trends. These forecasts tend to
ered more important than demographics [1]—bearing in            be global in perspective, as many companies do not report
mind that the analysis focused on the US healthcare mar-        sales data split out by region. Such forecasts are not particu-
ket, which is significantly different from that in Europe.      larly informative for European policy makers, as they do not
Within (European) healthcare systems, the predominant           reflect the differences in drug markets between Europe, the
goal for pharmaceutical expenditure is cost contain-            USA, and Asia. In addition, such forecasts may have less
ment, with a tendency to adopt a ‘silo mentality’ and           use if they report sales at ‘list’ prices without considering
separately consider expenditure on particular healthcare        rebates, ‘basket deals’, and discounts (the latter being a com-
resources, in this case pharmaceuticals [2]. According to       mon feature of sales to secondary care organisations).
the most recent Organisation for Economic Co-operation              The other forecast methodology is that applied by IQVIA
and Development (OECD) data (2018), pharmaceutical              (formerly Quintiles IMS) using its proprietary audited vol-
expenditure accounts for between 11.4% (UK) and 19.1%           ume data collected from representative samples of pharma-
(Spain) of total healthcare expenditure across the five larg-   cies and hospitals globally. These data are used to provide
est European drug markets, i.e. France, Germany, Italy,         estimates of historical pharmaceutical expenditure at the
Spain, and the UK (the EU5) [3]. This proportion in the         country, region, and global level and to forecast future trends
EU5 has fallen slightly since 2008, largely due to both         in market growth [10]. The most recent (2016) IQVIA fore-
cost-containment mechanisms imposed after the global            cast for European pharmaceutical expenditure growth pre-
financial crash and to a wave of patent expiries [3]. How-      dicts a compound annual growth rate (CAGR) of between
ever, it is worth noting the limitations in the OECD data       1 and 4% across EU5 countries between 2016 and 2021 [5,
(discussed in Sect. 4), such as excluding drugs used in         11].
inpatient settings in some countries (although Italy does           While IQVIA data are considered robust and are used by
include that data) and including over-the-counter products;     commercial, governmental, and academic researchers, cer-
overall, total pharmaceutical expenditure should be higher.     tain aspects of the methodology may affect policy makers’
   There is a general belief among healthcare policy mak-       interpretations of the estimates. One consideration is that
ers that pharmaceutical expenditure—driven by high              IQVIA forecasts include pharmaceutical expenditure by both
prices—will be unsustainable in future unless further           public (reimbursed) and private (out of pocket, private insur-
reforms are enacted. A recent OECD initiative on access         ance) sources, whereas policy makers are primarily inter-
to innovative pharmaceuticals and sustainability of phar-       ested in the former. More importantly, the IQVIA methodol-
maceutical expenditure stated that “high prices compro-         ogy (described in more detail in Sect. 2) estimates historical
mise patient access and put an unsustainable strain on          and future expenditure using ‘list’ (also referred to ‘official’)
healthcare budgets” [4, 5]. The same premise underlies the      prices (net of published discounts), which do not reflect
recent European Council conclusions on “strengthening           confidential discounts and rebates (‘discounts’) provided
the balance in the pharmaceutical systems in the European       to public healthcare systems by manufacturers, especially
Union and its Member States” [5].                               for new medicines used in the hospital setting (rather than
   While this concern is widespread, there is a lack of         dispensed by retail pharmacists) [12–14]. Broadly speak-
agreement about what constitutes a ‘sustainable’ rate of        ing, two types of discounts are most commonly applied: (1)
growth for pharmaceutical expenditure and a paucity of          discounts or agreements at the product level, which may be
forecasts of future growth rates upon which to inform pol-      negotiated by national, regional, or local payers; (2) rebates
icy making in Europe. We were unable to identify any pub-       at the industry level, whereby manufacturers retrospectively
lished forecasts from governmental bodies, at either Euro-      pay back money to national payers when total pharmaceuti-
pean or member state levels, that predict pharmaceutical        cal expenditure exceeds a certain threshold. As mentioned
expenditure from 2018 onwards. However, forecasting of          in the following, the level of discounts for some agreements
pharmaceutical expenditure has been undertaken in some          are publicly available, albeit in aggregate.
European regions (e.g. Stockholm), and horizon scanning             The existence of such discounts has potentially impor-
                                                                tant implications for policy makers. Historical and future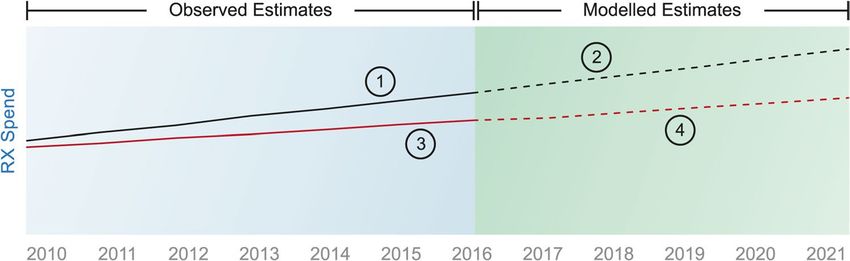
Projecting Pharmaceutical Expenditure in EU5 to 2021: Adjusting for the Impact of Discounts and Rebates
Fig. 1 Methodological
approach. Numbers in circles
indicate steps—see main text
for explanation. Rx medicines
that require a prescription
estimates of pharmaceutical expenditure that are based on realistic expectations of pharmaceutical expenditure for all
list prices, rather than net prices, will overstate aggregate key stakeholder groups. Adjustments were made to the list
pharmaceutical expenditure and its proportion of overall forecast as follows:
healthcare expenditure. Equally, if the magnitude of dis-
counts is changing over time, excluding these from forecasts • Historical estimates of pharmaceutical expenditure from
will also affect the predicted growth rate of future pharma- 2010 to 2016 (‘historical list estimate’) were adjusted to
ceutical expenditure. Discounts may be applied differently in reflect discounts not previously considered (‘historical
different countries or healthcare settings and may be driven net estimate’).
by different mechanisms and incentives in different settings. • Forecasts of future expenditure from 2017 to 2021 were
While many discounts are confidential (hence their exclu- re-run using the adjusted historical data to derive the net
sion from IQVIA estimates), their prevalence and impor- forecast.
tance are believed to have increased in Europe over the last
decade [15]. Indeed, the use of such agreements may in part The focus of the analysis was the EU5 countries individu-
explain the decline in relative pharmaceutical expenditure ally and in aggregate, as they contribute appreciably to the
observed by the OECD between 2008 and 2015—noting overall expenditure of medicines in Europe. An example of
the caveats around OECD data as mentioned and that most the type of sensitivity analyses that could be performed is
discounting takes place at the hospital level, which is not also provided (impact of biosimilars).
included in OECD data. This is in addition to substantial
savings made during this period when several standard med-
icines lost their patents, including atorvastatin, clopidogrel,
2 Methods
and esomeprazole, as well as various angiotensin receptor
blockers and atypical antipsychotics. The increase in the use
We followed a four-step approach, as depicted in Fig. 1.
of discounts has been driven by increasing price pressures
Our starting point (‘1’ in Fig. 1) was the IQVIA historical
and international reference pricing systems [16] that incen-
list estimates of pharmaceutical expenditure (2010–2016),
tivise manufacturers to negotiate confidential agreements
which are the basis for the list forecasts of future expenditure
that do not affect list prices [15].
(2017–2021) (‘2’ in Fig. 1). We then estimated the discounts
A factor that may influence pharmaceutical prices and
that historically have been observed in each country and that
level of discounts are patient access agreements that are
are not included in the historical list estimates to create the
based on achievement of a mutually agreed treatment out-
historical net estimates (‘3’ in Fig. 1). Finally, we adjusted
come (see, for instance, Jommi [17], Adamski et al. [18],
the list forecast for each country to reflect the historical net
Pauwels et al. [19] and Clopes et al. [20]). Whilst these
estimates to arrive at a net forecast (‘4’ in Fig. 1).
agreements may be confidential, restricted at present to cer-
tain specific treatment and health problems, and have a pro-
portionately small impact on pharmaceutical expenditure, it 2.1 Step 1: Historical List Estimate (2010–2016)
is important to acknowledge that the impact could be greater
if some countries increase their use of these schemes. Our starting point was IQVIA’s data and forecasts, which
Against this context, the objective of this study was to we revised accordingly. IQVIA MIDAS® data are volume
estimate future pharmaceutical expenditure growth rates based, tracking virtually every medicine through retail and
in France, Germany, Italy, Spain, and the UK (EU5) at net non-retail channels, with official, non-confidential prices
prices by adjusting the established IQVIA analysis (‘list applied at pack level to assess value spend [11, 21]. Price
forecast’) for discounts that are not currently incorporated data are captured at different points in the supply chain
(‘net forecast’). In doing so, the paper aims to provide more by market, e.g. pharmacy selling price, wholesaler price,J. Espin et al.
Table 1 Discount mechanisms in EU5. Adjustments to ‘list’ pharmaceutical expenditure in EU5 (and not included in IQVIA model)
France Germany Italy Spain UK
QI Adj QI Adj QI Adj QI Adj QI Adj
Industry Mandatory Industry rebates Industry rebates PPRS industry
rebates discounts in rebates
Clawback SHI Mandatory Compulsory Pa ent access ~
payments discounts paybacks schemes (NICE)
MEAs (e.g. AMNOG price Product-level Product-level Na onal ~
pay for reduc on discounts discounts tenders/contractua
performance, Sick fund MEAs + PVAs Nego ated l agreements
etc.) clawbacks discounts
Tenders/disco Tenders/disco Tenders/discounts Tenders/discounts Tenders/discounts ~
unts unts
Rebates Rebates Rebates Rebates Rebates ~
Light grey shading indicates the national level; the regional/hospital level is not shaded
Adj adjusted forecast, AMNOG Arzneimittelmarkt-Neuordnungsgesetz, MEA managed entry agreement, NICE National Institute for Health and
Care Excellence, PPRS Pharmaceutical Price Regulation Scheme, PVAs price-volume agreements, QI QI forecast, SHI statutory health insurance
✓ indicates included in forecast, ✗ indicates excluded in forecast, ~ indicates in the UK, those factors were adjusted only for the PPRS part of the
market
ex-manufacturer price. However, country-specific mark-ups analogue analysis (i.e. based on past experience in other
are used to reflect price at the publicly available ex-manu- therapeutic areas) and interviews with market experts.
facturer level. The baseline forecast is refined and adjusted with inter-
IQVIA data capture expenditure on medicines that require nal expertise and insight within each country. This is sup-
a prescription (labelled as Rx), as well as those that do not plemented with extensive primary and secondary research
(non-Rx). Rx expenditure represents the majority of sales among all key stakeholders in the industry, including gov-
value, given the high levels of reimbursement across EU5 ernment representatives, regulatory authorities, key opinion
markets—ranging between 87% in France and 97% in the leaders, specialists, physicians, pharmacists, pharmaceutical
UK (IQVIA data on file). The value split between Rx and companies and wholesalers.
non-Rx has remained mostly stable over the last 10 years. It
should be noted that we are interested in total pharmaceuti- 2.3 Step 3: Historical Net Estimate (2010–2016)
cal expenditure and thus do not report the expenditure on
branded medicines and generics separately. However, given IQVIA data use publicly available prices. These can reflect
the future importance of biosimilars, we report the impact the real cost to public payers in some cases, but further
of some sensitivity analysis around biosimilar uptake and discounts also exist in many situations. As previously dis-
price competition. cussed, a range of (complex) mechanisms now impact net
pharmaceutical expenditure. Step 3 was to adjust the his-
2.2 Step 2: List Forecast (2017–2021) torical list estimate to reflect these discounts and derive the
historical net estimates.
IQVIA’s country-specific forecasts combine historical sales Table 1 describes the most important discount mecha-
data, macroeconomic indicators, and expected events (e.g. nisms across the five countries and whether they were
new product launches) to estimate future pharmaceutical already accounted for within the IQVIA list forecast. These
expenditure [11, 21]. First, historical volume and price data include discounts at the national level agreed between indi-
are analysed and plotted. Second, baseline projections are vidual manufacturers (or industry collectively) and govern-
developed using exponential smoothing techniques to repre- ment agencies and agreements at the regional or hospital
sent the extrapolation of underlying conditions. Third, events level, usually on a product basis.
are assessed, quantified, and applied to baseline projections. At the national level, four countries have some form of
Events can include major new product launches (informed national rebate, whereby a cap is set on total pharmaceuti-
by IQVIA LifeCycle R&D Focus, a global database covering cal expenditure and rebates are paid by industry collectively
more than 31,000 medicines in research or development), if the limit is exceeded. These limits may take the form of
generic competition, and legislative/policy change (among agreed growth rates for a specific period (e.g. 2014–2018
others). Macroeconomic trends are based on econometric for branded medicines in the UK, via the Pharmaceutical
modelling from the Economist Intelligence Unit. For each Price Regulation Scheme [PPRS]), linking pharmaceutical
event, the date, probability of occurrence, time to impact, expenditure growth rate to gross domestic product (GDP)
and level of impact are assessed and modelled, drawing on growth rate (Spain), or allocating a maximum percentageProjecting Pharmaceutical Expenditure in EU5 to 2021: Adjusting for the Impact of Discounts and Rebates
of public healthcare expenditure (Italy). Other national- meant using the total net expenditure returns reported by
level agreements include mandatory discounts applied the Department of Health as part of the PPRS agreement
across a particular drug class (e.g. discounts applied to that controls pharmaceutical expenditure for most branded
retail medicines in Germany) and product-specific confi- medicines in the UK. In Spain, where discount-specific sav-
dential discounts that are negotiated with national payer ings were also not available, aggregate net expenditure data
agencies at the time of launch (e.g. the Italian Medicines were obtained from reports from the Ministry of Finance and
Agency [AIFA] in Italy and the Ministry of Health in Spain). Public Administration.
These national product-specific discounts also encompass To compare IQVIA historical list estimates with net data
more complex managed entry agreements (MEAs); these reported by governments, it was necessary to ensure that
could be financial-based, such as most of the Patient Access both estimates included the same types of expenditure (e.g.
Schemes used by the National Institute for Health and Care whether over-the-counter medicines were included) and
Excellence (NICE), the All Wales Medicines Strategy Group costs (e.g. wholesaler or pharmacy margins). Where differ-
(AWMSG), and the Scottish Medicines Consortium (SMC) ences existed, we adjusted the IQVIA forecast accordingly.
in the UK, or outcome-based agreements, such as the pay- Notwithstanding, recognising the potential for discrepancies
ment-by-results schemes used by AIFA in Italy. in the absolute aggregate estimate of expenditure, the focus
At the local level, product-specific discounts are often of this analysis was on change in the size of the list-to-net
negotiated by regional payer bodies, hospitals networks, and gap over time (growth rate) rather than absolute estimates of
individual hospitals. Tenders, which are sometimes used at expenditure. Thus, any form of discount that has remained
the national level, are commonly used at the local level and flat in the past will not affect the growth rate of (net) phar-
tend to apply to a specific part of the market, either high- maceutical expenditure relative to list expenditure, and the
usage products, hospital-only medicines, or generics dis- adjustment is not included in the analysis. This would be a
pensed in primary care [22, 23]. A significant part of the conservative assumption if those ‘flat’ discounts increase
discounting takes place at the hospital level as a result of in the future.
confidential contracting between companies and individual
hospitals (or groups of hospitals). 2.4 Step 4: Net Forecast (2017–2021)
At both national and local levels, discounts are usually
confidential, especially for product-specific agreements. It After the derivation of historical net estimates, the IQVIA
is therefore not possible to adjust the list historical estimates list forecast model was re-run using the revised historical
or list forecast on a product-by-product basis. Alternative data to generate a new net forecast. As described in Step 2,
approaches were taken to estimate the impact of these dis- the IQVIA list forecast comprises two main components:
counts, depending upon the data available in each country. a projection forward based on historical trends combined
Data with which to inform the adjustments were identi- with adjustments for expected ‘events’ (e.g. new product
fied through two channels: (1) a review of peer-reviewed and launches). The new net forecast reflected the revised his-
grey literature, including government agency websites and torical data, while keeping unchanged the adjustments for
reports, and (2) interviews with health economic experts in expected events.
each of the countries to discuss data sources. Details on the
data available and the specific adjustments made for each
country are summarised in Table 2. 3 Results
Wherever data were available, list-to-net adjustments
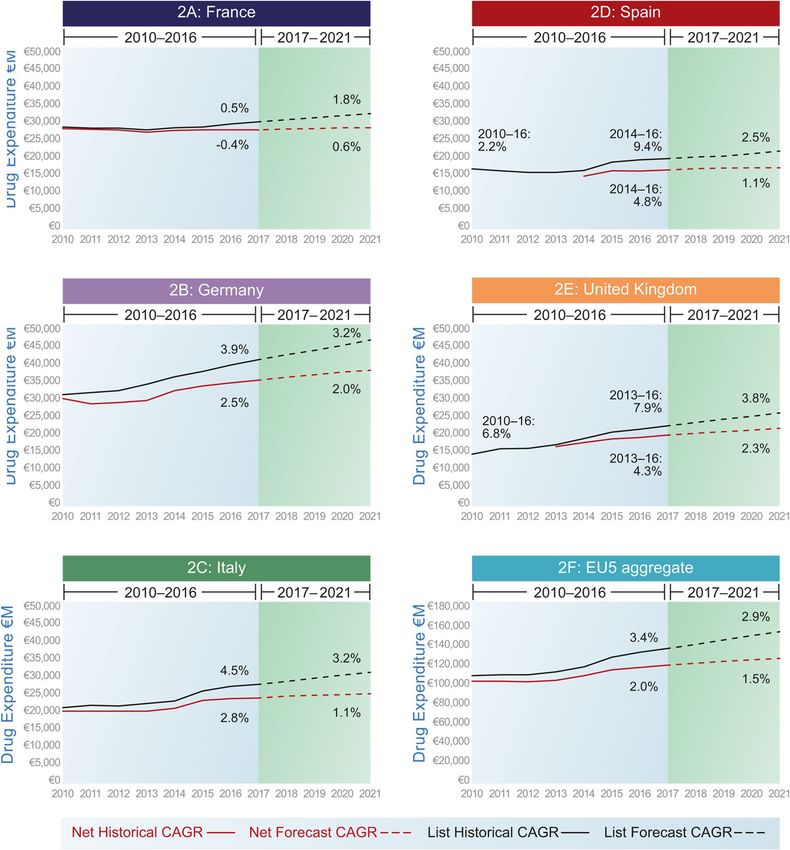
were made specific to a particular type of discount. For CAGRs are presented in Table 3 and Fig. 2.
example, in Italy, aggregate data were available on the The value of the adjustments (i.e. rebate, discounts)
rebates paid by industry at the national level due to exceed- increases over time and in doing so also represents an
ing the expenditure cap, rebates paid as a result of product- increasing share of total (list) expenditure. For instant, for
level MEAs, and net expenditure after discounts for both EU5 in aggregate, the estimated level of adjustments was €9
retail and hospital medicines. billion (representing 7% of total list pharmaceutical expendi-
In other countries, such as the UK, it was not possible to ture) in 2014. By 2021, the level is estimated at €27 billion,
obtain data on specific forms of discounts (such as savings representing 17% of total list expenditure.
made as a result of Patient Access Schemes agreed with
NICE, SMC, and AWMSG as they are confidential [24]). In 3.1 France
these situations, the difference between list and net expendi-
ture was estimated based on comparing historical aggregate Historical list estimates of expenditure in France showed
net expenditure data from official sources with the histori- low average growth rates of 0.5% CAGR between 2010 and
cal list expenditure estimates from IQVIA. For the UK, this 2016. Historical net growth estimates were derived fromTable 2 Country-level adjustments and publicly available data used for country adjustments
Country Data used for adjustments Proportion of pharmaceutical market to Estimated list to net v ariancea Source
which adjustment applies
France Aggregate net expenditure data on reim- Reimbursed medicines only; excludes OTC 6% (2016) CEPS activity reports (2010–2015) [26]
bursed medicines reported by CEPS medicines and private prescriptions. Esti-
(2010–2015) mate to account for 71% of total market
Manufacturer payback data reported by [25]
CEPS (2010–2015)
Germany Mandatory discounts for SHI medicines in Medicines covered by SHI 12% (2016). This does not include Arzneiverordnungsreport (2008–2016)
retail setting (2008–2016) Excludes OTC, private prescriptions and AMNOG discounts that are non- [27–35], WHO [36]
Aggregate net expenditure data on SHI hospital-only medicines. Estimate to confidential
medicines (2005–2016) account for 84% of total market [25]
SHI clawbacks (savings due to discount
agreements) (2008–2016)
Italy Aggregate net expenditure data for NHS Reimbursed medicines only (retail drugs 14% (2016)b L’uso dei Farmaci in Italia. AIFA reports
reimbursed medicines, including dis- and drugs procured by hospitals and (2010–2016) [36–43]; Determina AIFA
counts applied at national and local levels other healthcare organisations) (62% of 1406 (20 October 2016) [44]; Monitorag-
(2009–2016) total drugs expenditure) [25]. It excludes gio della spesa farmaceutica regionale
Actual industry-level payback where total co-payment, private prescriptions for (2013–2016) [45]
pharmaceutical expenditure caps are reimbursable drugs and non-reimbursable
exceeded (2013–2016) drugs
Rebates from managed entry agreements,
including HCV medicines (2013–2016)
Spain Aggregate net expenditure data reim- Medicines reimbursed through healthcare 17% (2016) Ministerio de Hacienda y Función Pública
bursed medicines (split by hospital/retail) system. Excludes OTC and private pre- [46]; Spanish legislation [47]
(2014–2016)c scriptions
Industry-level rebates (not applied since Estimate to account for 59% of total market
introduction) (2014–2016) [25]
Compulsory payback levels (2006–2016)
UK Aggregate net expenditure for PPRS- PPRS medicines, excluding generics, OTC, 21% (2016) for PPRS medicines only Aggregate net sales and payment information
covered medicines (‘measured spend’) private prescriptions and companies not May 2017 and annual reports DoH [48–52]
(2013–2017) signed to PPRS agreement
Industry PPRS rebate payments (2013–2017) Estimated to account for 51% of total phar-
maceutical expenditure [46]
AIFA Italian Medicines Agency, AMNOG Arzneimittelmarkt-Neuordnungsgesetz, CEPS Comité Économique des Produits de Santé, DoH Department of Health, HCV hepatitis C virus, NHS
national health service, OTC over the counter, PPRS Pharmaceutical Price Regulation Scheme, SHI social health insurance
a
Expressed as the ratio between the adjustment (in €) and total list expenditure resulting from the modelling
b
For Italy in particular, a bottom-up analysis of AIFA data suggests that, for 2016, the share could be 22.7% [36–45]
c
Data on net pharmaceutical expenditure for Spain are only available since 2014
J. Espin et al.Projecting Pharmaceutical Expenditure in EU5 to 2021: Adjusting for the Impact of Discounts and Rebates
Table 3 EU5 aggregate and country-specific data: list/net pharmaceu- countries. Given that the Comité Économique des Produits
tical expenditure compound annual growth rates (2010–2021) de Santé (CEPS) has publicly stated a target of €1 billion
CAGR (%) reduction in aggregate pharmaceutical expenditure in 2018,
growth could in fact be lower than this [53].
List Net
France 3.2 Germany
Historical (2010–2016) 0.5 − 0.4
Forecast (2017–2021) 1.8 0.6 The retail segment is dominant in Germany (86% of mar-
Germany ket), with many ‘hospital-type’ treatments delivered through
Historical (2010–2016) 3.9 2.5 office-based physicians (IQVIA data on file). According to
Forecast (2017–2021) 3.2 2.0 the historical list estimates, total market and retail expendi-
Italy ture have both been growing historically at around 4%
Historical (2010–2016) 4.5 2.8 CAGR. Arzneimittelmarkt-Neuordnungsgesetz (AMNOG)
Forecast (2017–2021) 3.2 1.1 rebates, which are publicly visible, are already captured
Spain in the historical list estimate and list forecast, but as more
Historical (2010–2016) 2.2 NC products become subject to them over time, the impact on
Historical (2014–2016) 9.4 4.8 total expenditure has increased (partly accounting for a
Forecast (2017–2021) 2.5 1.1 lower list forecast growth rate of 3.2% compared with his-
UK torical growth rate). Two mechanisms substantially reduce
Historical (2010–2016) 6.8 NC net expenditure estimates: the mandatory discounts applied
Historical (2013–2016) 7.9 4.3 to retail products and the sick fund clawbacks (rebates paid
Forecast (2017–2021) 3.8 2.3 because of negotiated contractual agreements—noting
EU5 that individual agreements are confidential, but the overall
Historical (2010–2016) 3.4 2.0 SHI impact is published yearly, which we have used in our
Forecast (2017–2021) 2.9 1.5 analysis). The former (mandatory rebates) have fluctuated
between 6 and 16% since 2010 [30]. The latter (clawback
CAGRs compound annual growth rates, NC could not be calculated
because of lack of data payments) increased threefold over 7 years, from €1310 mil-
lion in 2010 to €3890 million in 2016 [28, 34].
Overall, the effect in Germany is to reduce the net fore-
French government returns (net of discounts), which were cast CAGR for 2017–2021 from 3.2 to 2.0%. By 2021, the
further adjusted to reflect rebates and payback agreements level of discounting is estimated to represent 18% of total
with manufacturers. Historical net data showed a small list pharmaceutical spend in that country, which is similar to
decline in pharmaceutical expenditure of − 0.4% CAGR over the EU5 average. The effects of the mandatory discounts and
this period. The impact of including discounts is of nearly the paybacks can be separated historically; the importance of
1% point over the 7 years, which is significant. the mandatory discount was higher than the payback system,
Expenditure in the French retail sector fell with the imple- although by 2015 its weight decreased to 60% of the total
mentation of cost-control methods, loss of exclusivity of adjustment. For the forecast, the effect of both adjustments
major products and generic entry, and some shift towards is aggregated, but the increase is driven by the increased SHI
hospital expenditure. Hospital expenditure is also largely clawbacks, as mentioned.
controlled at the list price level, with growth remaining rela-
tively slow despite the launch of high-budget-impact hepa- 3.3 Italy
titis C virus (HCV) products in recent years.
Health authorities in France actively manage aggregate Historical estimates of pharmaceutical expenditure in Italy
pharmaceutical expenditure against annual targets and utilise from 2010 to 2016 were 4.5% (list) and 2.8% (net). Italian
payback agreements and price cuts to control growth. For retail sector pharmaceutical sales have been falling since
example, paybacks by industry doubled from €520 million 2010, with overall market growth attributed to the hospital
in 2014 to €1020 million in 2015 [25]. sector. This is due partly to a shift towards new product
The list forecast for France was 1.8% CAGR between launches in specialty medicines and partly to the increas-
2017 and 2021, which fell to 0.6% in the net forecast—an ing role taken by hospitals in procuring medicines used
impact of over 1% point. By 2021, the level of discounting outside of hospitals [54]. These medicines are distributed
(as a result of manufacturers’ paybacks in the hospital sec- either directly by hospitals (e.g. new medicines for HCV) or
tor) is estimated to represent 12% of total list pharmaceutical by community pharmacies on behalf of hospitals (e.g. new
spend in that country, which is the lowest across the five oral antidiabetic medicines). The gap between list and netJ. Espin et al. Fig. 2 Historical and forecast pharmaceutical expenditure at list and net prices. CAGRcompound annual growth rate estimates increased from 2014 to 2016—at a time when both over list prices applied to all medicines, excluding the ‘inno- were growing faster than the historical trend—as a conse- vative’ ones) are as follows: quence of a sharp increase in savings related to deals agreed with manufacturers of HCV medicines. 1. Industry-level payback based on level of hospital and The most important discounts in the Italian system that outpatient pharmaceutical public expenditure as propor- are not already captured in the historical list estimate (the tion of total health public expenditure; the actual pay- historical list estimates include a 9.75% binding discount back was estimated at 1.6% of total gross expenditure
Projecting Pharmaceutical Expenditure in EU5 to 2021: Adjusting for the Impact of Discounts and Rebates
for reimbursed medicines between 2013 and 2016 [55]. Retail sector sales have been falling since 2010 in Spain,
These apply to all class reimbursed medicines (orphan with most growth attributed to the hospital sector due to
and innovative drug manufacturers are exempt from pay- oncology costs and short-term expenditure on HCV medi-
ing).1 cines (Spain has particularly high HCV prevalence). In the
2. Discounts negotiated with AIFA and at hospital level, retail setting, compulsory paybacks came in force in 2006
which accounted for a list to-net difference of 8% of (Law 29/2006) [56]. The pharmaceutical industry pays
total public pharmaceutical expenditure on average in money back every 4 months to research institutes (via the
2009–2016, increasing to 14.2% in 2016. Institute Carlos III) and to the government to fund policies
3. Rebates from financial-based MEAs mainly for HCV encouraging healthcare cohesion across Spain and educa-
medicines that averaged 4.3% of total pharmaceutical tion programmes for healthcare professionals, among oth-
expenditure between 2015 and 2016, and outcome-based ers, expressed as a percentage of sales [57]. Such payments
MEAs for cancer drugs medicines that averaged 0.3% are not captured in the historical list estimates, although, as
(2014–2016). they have remained flat (1.5–2%) since their introduction
in 2006, they do not contribute to any divergence in the list
Overall, the forecast CAGR for 2017–2021 reduced from and net forecast.
3.2% (list) to 1.1% (net); this is the biggest decrease in per- Mandatory discounts applied to invoices for all hospital
centage points of the five countries. Indeed, by 2021, the medicines (7.5%; 4% for orphan medicines) have been in
level of discounting is estimated to represent 21% of total list place since 2010 [56]. Increasing use of hospital products
pharmaceutical spend in that country, which is the highest means these savings are forecasted to increase. In addition,
across the five countries. Two adjustments were modelled: a dual pricing system is in place for hospital medicines: the
the discounts in hospital from managed entry agreements list price (‘precio notificado’)—which is the official price for
and industry-level payback, where total pharmaceutical international price referencing—and the reimbursed price
expenditure caps are exceeded, which are expected to rise, (‘precio facturación’). The list price is published, but the
and rebates for HCV medicines, which are expected to reimbursement price is confidential.
decline. Historical net expenditure data for hospital sales were
available from 2014 to 2016 (during this period, HCV medi-
3.4 Spain cines were launched in Spain). These data are published by
the Ministry of Finance,2 and the difference between net
Historical list estimates of pharmaceutical expenditure expenditure on hospital medicines versus aggregate expendi-
growth in Spain were 2.2% CAGR between 2010 and 2016. ture at list prices was 22%, 28%, and 34% for 2014, 2015,
However, growth declined between 2010 and 2014 and then and 2016, respectively [58]. The Ministry of Finance also
increased on the back of expenditure on HCV medicines publishes net expenditure in primary care, but we did not
(between 2014 and 2016, growth at list prices was 9.4%). compare this data with IQVIA’s as we felt IQVIA data cap-
tured an important part of the discounts.
In 2015, a Stability Pact was signed between the Minis-
try of Health and the research-based pharmaceutical trade
1
Regulation of spending caps on drugs has changed many times. In association, Farmaindustria, on behalf of industry [58].
2001 (law n. 405/2001), a spending cap on drugs used outside hospi- This pact links pharmaceutical expenditure growth to GDP
tals, named ‘Spesa farmaceutica territoriale’ (retail sector and drugs growth; over and above this level of growth, the industry is
procured by hospitals and used outside hospitals) was introduced.
The spending cap was set at 13% of overall public health expendi- required to pay back the difference. These limits have not
ture. This legislation was amended in 2008 (law n. 222/2007): the been reached since their introduction because pharmaceu-
spending cap on Spesa farmaceutica territoriale (including patient tical expenditure growth fell below GDP growth over this
co-payments set at regional level) was determined as the 14.0%
ceiling of the overall public health expenditure at both national and
regional levels, whereas the hospital (in-patient) budget for pharma-
ceutical expenditure (named ‘Spesa farmaceutica ospedaliera’) could
not exceed a 2.40% ceiling of the overall public health expenditure.
2
If the budget of the Spesa farmaceutica territoriale was overrun, the In December 2017, the Spanish Ministry of Health started publish-
industry and the distribution would have been required to cover the ing net costs of medicines used in public hospitals, including dis-
full deficit. Since 2013 (law n. 135/2012), the industry was asked to counts. However, the two datasets do not coincide, and differences
cover 50% of the Spesa farmaceutica ospedaliera budget deficit (the are especially big for Valencia and Catalonia (https://www.diariofarm
budget was raised to 3% of overall public health expenditure, whereas a.com/2017/12/04/comparable-gasto-hospitalar io-publica-sanidad-
the budget for the Spesa farmaceutica territoriale was lowered to hacienda). The main reason behind the differences is they are meas-
11.35%). The spending caps have changed again since 2017, set as uring two different things and are thus not comparable. Our analysis
7.96 and 6.89% of the overall public health expenditure for retail uses the Ministry of Finance data, and it is beyond the scope of this
drugs and all drugs procured by hospitals, respectively. paper to analyse the differences between the two different datasets.J. Espin et al.
period [58]. However, this legislation could act as an upper and size of biologics that will lose patent protection in the
limit on future growth. coming years, as the evolution of the market for biosimilars
After adjusting the historical list estimate for the observed will be an important variable impacting future expenditure
difference with the Ministry of Finance net data for hospital growth rates [59]. Three key variables affect biosimilar
pharmaceutical expenditures, the net forecast for 2017–2021 impact: speed of entry, uptake, and degree of price competi-
was 1.1 versus 2.5% under the list forecast. By 2021, the tion (linked to the number of biosimilars, but also with origi-
level of discounting is estimated to represent 20% of total list nators). The assumption in the IQVIA list forecast is that the
pharmaceutical spend in Spain, where the difference in this size of price reductions at the point of loss of exclusivity
case is due to the discounts in the hospital sector, estimated in future will be of the same magnitude as those observed
as the gap between list and net expenditure. historically since the introduction of biosimilars. This could
be an underestimate of future biologic value erosion, as the
3.5 UK biosimilar market is still developing, and greater competi-
tion is expected as it matures. Across the EU5 countries,
In the UK, the historical list estimate of expenditure growth €30–40 billion of cumulative sales can be exposed to bio-
was 6.8% CAGR between 2010 and 2016. At the time of similar competition through 2021 (IQVIA data on file). If
data analysis, publicly available historical net expenditure biosimilars lead to value erosion that is closer to that seen
data were available from 2013 to 2017 and only included the for small molecules, overall future net growth rates in the
51% of the UK drug market covered by the PPRS [48–52]. EU5 based on this analysis would be nearer to 0.5–1% over
The PPRS is estimated to cover 80% of branded medicines the next 5 years, rather than the 1.5%. However, this will
by value. No adjustments were made to account for confi- depend on greater uptake of biosimilars than currently seen
dential discounts and rebates in the non-PPRS market, which through educational and other activities, including the col-
includes generics and HCV expenditure on products mar- lection of high-quality comprehensive outcomes data on
keted by Gilead (which, as of December 2017, was not a the effectiveness and safety of biosimilars and originator
member of the PPRS). Given that these products are likely products [59–61].
to be subject to discounts of a similar magnitude to PPRS
products, the adjustment in the UK is likely to be under-
representative of the true list-to-net difference and to over- 4 Discussion
estimate growth rates. We are aware there is a pharmacy
clawback based on rebates from manufacturers/wholesalers; The results from this study suggest that future growth in
this has been constant under the historic period so would pharmaceutical expenditure in Europe is likely to be lower
not affect the growth rate.3 This clawback is not modelled. than previously understood from forecasts based on list
The unadjusted forecast is 3.8% CAGR for the period prices. The growth in use of confidential discounts over the
2017–2021; the net forecast decreases to 2.3%. By 2021, the last decade (such as those badged as patient access schemes,
level of discounting is estimated to represent 17% of total list e.g. those in the UK and those agreed locally or regionally),
pharmaceutical spend in that country, which is equal to the especially for cancer medicines, which are usually used in
EU5 average—as mentioned, there is only one adjustment the hospital setting (e.g. see Pauwels et al. [13]), has led to
for the UK (PPRS net sales after rebates). increased divergence between list and net prices, with the
associated overstatement of historical expenditure levels.
3.6 EU5 One possible reason for this is the increased use of external
reference pricing, where prices across countries are interde-
When the forecasts for the five countries are aggregated, the pendent; thus, there are incentives to keep these discounts
EU5 (unweighted) average historical growth rate falls from confidential. However, this way of regulating medicines
3.4% at list to 2.5% at net. For the forecast, the net growth prices was recently criticised because of its negative effects
rate is estimated at 1.5% CAGR versus 2.9% at list. [62]. Another factor that can impact the size of the rebates
are ‘product events’. For example, in the period 2015 and
3.7 Some Sensitivity Analysis: Impact of Biosimilars 2016, the new generation of HCV medicines were intro-
duced and, in some markets (such as Italy), were sold with
We did not undertake sensitivity analyses, although we very substantial rebates that momentarily boosted the rebate
illustrate with the case of biosimilars the sort of analyses and created an unreliable trend. However, industry-level pay-
that could be done. We pick biosimilars given the number back because of drug budget overrun is expected to increase,
and, incorporating this effect, the divergent trend of list and
net expenditure is expected to be confirmed. It is also pos-
3
We thank one of the reviewers for pointing this out. sible, but maybe less so, that rebates/adjustments wouldProjecting Pharmaceutical Expenditure in EU5 to 2021: Adjusting for the Impact of Discounts and Rebates Fig. 3 Pharmaceutical expenditure as a percentage of healthcare expenditure in EU5 countries, 2010–2015 (Organi- sation for Economic Co-opera- tion and Development data on pharmaceutical expenditure) decrease over time and, thus, net expenditure growth would the impact of various events on both the expected growth be higher than list expenditure. rate and the increased/decreased divergence between list and The historical and forecast net-price adjustments pre- net expenditure. sented in this paper reflect that divergence as closely as the No other European net price forecasts were identified that publicly available data allow, but the confidential nature could be used to validate the future estimates from this anal- of these arrangements mean they are inherently difficult to ysis. However, the historical adjustments can be compared quantify. Not all confidential discounts or rebates have been with OECD data (Fig. 3), which shows net pharmaceuti- captured for every country. For example, in the UK, net data cal expenditure as flat or falling as a proportion of health- were only available for approximately half of the UK market care expenditure in EU5 countries between 2010 and 2018 by value (medicines covered by PPRS). This analysis also (most recent data available) [3]. These data provide some relied upon published net expenditure data reported at the context to our results, but the differences between IQVIA national level. Rebates paid to hospitals and regional health and OECD data should be noted. Broadly speaking, these are authorities are not fully captured in all countries. This is that (1) OECD numbers are at sell-out price and IQVIA at certainly the main limitation of the paper; however, we are ex-manufacturing price (the differences are wholesaler and not aware of any other sources that will fill the existing infor- pharmacy margins and dispensing fees); (2) OECD numbers mation gaps on the level of discounting. One possible further can capture patient co-payments as part of expenditure, but avenue could be to undertake (confidential) surveys/inter- these are not included for IQVIA expenditure; (3) OECD views with various payers in these countries, or with phar- numbers are based on country reporting, and countries, for maceutical companies. Interaction with payers could also be different reasons, might not always follow the OECD guide- used to validate our results. Moreover, unknown rebates have lines, which means the numbers may be over- or understated; been assumed constant and thus do not impact the growth and (4) hospital data are incomplete for some countries. rate; however, they would have impacted the net value. In the USA, a similar analysis was performed to explore This analysis was based on an IQVIA forecast, which is the impact of discounts on total expenditure [63]. This study considered one of the most established analyses of pharma- estimated that, between 2005 and 2012, manufacturers’ dis- ceutical expenditure and benefits from the comprehensive counts and rebates reduced expenditure on branded medi- country-specific data collected by IQVIA. However, as with cines by approximately 18% each year. However, between all modelling exercises, the IQVIA forecasting methodol- 2010 and 2014, the discounts and rebates increased from 18 ogy incorporates assumptions about future events—such to 28% of total expenditure on brand-name medicines. This as new drug launches and socioeconomic developments— growing divergence between list and net prices in the USA that are fundamentally uncertain. Nevertheless, knowing reflects the similar trend we observed in Europe. Unlike our the current research and development pipeline of potential own study, Aitken et al. [63] did not forecast the implications new medicines and the loss of exclusivity dates of existing for future pharmaceutical expenditure growth in the USA. medicines provides as accurate an estimate as possible of It is beyond the scope of our study to explore the driv- how medicines expenditure may change in the future. The ers of growth in pharmaceutical expenditure, as this is a adjustments to the IQVIA forecast for future years were esti- complex issue. However, we can observe mixed positive mated based on the trend in differences between list and net and negative effects. On one hand, prescribed volumes for observed historically; if the level of discounts and rebates medicines to treat non-communicable diseases, such as dia- changes in future, this prediction may not be accurate. Future betes, hypercholesterolaemia, hypertension, and acid-related research could undertake sensitivity analyses to understand stomach disorders, have appreciably increased in recent
J. Espin et al.
years, with volumes rising several-fold among countries is beyond the remit of our article to compare the expenditure
[64–66]. For instance, and according to AIFA estimates, in pharmaceuticals with the outcomes achieved from their
most of the increase of the pharmaceutical retail market is use, as this is a complex task.
due to an increase in volumes [67]. This is coupled with After adjusting for discounts and rebates, net expenditure
a shift towards more expensive medicines in the hospital growth in EU5 is predicted to be approximately 1.5% CAGR
setting as new innovative medicines are launched in areas over the next 5 years. This is below predicted healthcare
of high unmet need. On the other hand, and as mentioned expenditure growth in Europe and in line with long-term
in Sect. 1, cheaper generics in many large therapeutic areas economic growth rates.
have entered the market, generating significant savings to
third-party payers (i.e. see European Assessment [68]). As Author contributions AH and AP conceived of and designed the paper
and collected the data. All authors were involved in writing or critical
mentioned, one area with more uncertainty is the impact of review of the paper, with important intellectual contributions and col-
biosimilars in the future. lection of some information, and approved the final version of the arti-
Aitken [69] analysed the evolution of pharmaceutical cle for submission. JM-F acts as guarantor that all aspects that make up
expenditure in five countries, including France, Germany, the manuscript have been reviewed, discussed, and agreed among the
authors in order to be exposed with maximum precision and integrity.
and the UK, over 20 years. Among other things, he showed
that pharmaceutical expenditure growth has been roughly
in line with increases in total health expenditure. Indeed,
Compliance with Ethical Standards
our projections, after taking into account adjustments, are Data availability statement The datasets generated during and/or ana-
below predicted healthcare expenditure growth in Europe lysed during the current study are not publicly available because they
and in line with long-term economic growth rates [70, are owned by a third party (IQVIA). Aggregated data might be avail-
71]. Understanding the dynamics of the market in the past able from the corresponding author on reasonable request. The data
we used on the level of rebates and discounts are available publicly
is always an important element in driving the forecasts. (see references in text).
For policy makers concerned about the sustainability of
pharmaceutical expenditure, this study may provide some Conflict of interest JE, MS, BG, PA, CJ have received an honorarium
comfort, in that the perceived problem is not as large as from Celgene International for attending an advisory meeting. JM-F
expected. While there is debate to be had about the merits received an honorarium from Celgene International for attending an
of non-transparent discounts and rebates, they appear to be advisory meeting and to support the writing of the paper. SF and AP
are employees of Celgene International. AH is employed by Dolon
playing an important role in containing the growth of real Ltd, a consultancy that provides services to pharmaceutical compa-
pharmaceutical expenditure whilst allowing reimbursement nies, including Celgene International. All authors have no conflicts of
and funding for new medicines that would not have been interest that are directly relevant to the content of this article.
possible without such schemes. The results of this analysis
suggest that healthcare payers maintain considerable control Open Access This article is distributed under the terms of the Crea-
tive Commons Attribution-NonCommercial 4.0 International License
over pharmaceutical expenditure and have been effective in (http://creativecommons.org/licenses/by-nc/4.0/), which permits any
managing growth historically. Even the introduction of new noncommercial use, distribution, and reproduction in any medium,
HCV medicines, which prompted a very public debate about provided you give appropriate credit to the original author(s) and the
pharmaceutical expenditure sustainability [72, 73], appear source, provide a link to the Creative Commons license, and indicate
if changes were made.
to have led to only a temporary uptick in the growth rate,
mitigated by negotiated discounts and rebates (especially as
a result of competition between different medicines), after
which the growth trajectory quickly reverted to the histori- References
cal average.
1. Newhouse JP. Medical care costs: how much welfare loss? J Econ
Perspect. 1992;6:3–21.
2. Drummond M, Jonsson B. Moving beyond the drug budget
5 Conclusion silo mentality in Europe. Value Health. 2003. https : //doi.
org/10.1046/j.1524-4733.6.s1.8.x/full.
The increasing frequency and magnitude of confidential 3. OECD. Pharmaceutical spending (indicator). 2018. https://doi.
discounts, including MEAs, rebates, and discounts, have org/10.1787/998febf6-en. Accessed 5 Jul 2018.
4. OECD. Ensuring health system sustainability and access to inno-
led to a growing divergence between list and net prices for
vation. http://www.oecd.org/health /health -system s/Ensuri ng-healt
medicines in Europe. This is driven by increasing financial h-system
-sustai nabil ity-and-access -to-innova tion. pdf. Accessed 1
pressures within health systems, policies such as external Aug 2018.
reference pricing, and a shift in pharmaceutical innovation 5. OECD. Pharmaceuticals. http://www.oecd.org/els/health -system s/
pharmaceuticals.htm. Accessed 1 Aug 2018.
from retail to hospital settings with most new medicines for
immunological and cancer conditions in many countries. ItProjecting Pharmaceutical Expenditure in EU5 to 2021: Adjusting for the Impact of Discounts and Rebates
6. Wettermark B, Persson ME, Wilking N, Kalin M, Korkmaz S, technologies in Europe? Health systems and policy analysis,
Hjemdahl P, et al. Forecasting drug utilization and expenditure in policy brief no. 21. 2016.
a metropolitan health region. BMC Health Serv Res. 2010;10:128. 24. National Institute for Health and Care Excellence. List of rec-
7. Eriksson I, Wettermark B, Persson M, Edstrom M, Godman B, ommended technologies that include a commercial arrangement.
Lindhe A, et al. The early awareness and alert system in Sweden: Undated. https://www.nice.org.uk/About/What-we-do/Patient-
history and current status. Front Pharmacol. 2017;8:674. access-schemes-liaison-unit/List-of-technologies-with-appro
8. Godman B, Joppi R, Bennie M, Jan S, Wettermark B. Managed ved-Patient-Access-Schemes. Accessed 1 Aug 2018.
introduction of new drugs. Chapter 20: 210–221. In: Elsevi- 25. OOECD. Health at a glance 2017: OECD indicators. Paris: OECD
ers M, Wettermark B, et al., editors. Drug utilization research: Publishing; 2017. https: //doi.org/10.1787/health _glance -2017-en.
methods and applications. Chichester: Wiley; 2016. ISBN 26. Comite economique des produits de sante. French Healthcare
978-1-118-94978-8. Products Pricing Committee. http://solidarites-sante.gouv.fr/
9. Schlander M, Dintsios C-M, Gandjour A. Budgetary impact and ministere/acteurs/instances-rattachees/article/rappor ts-d-activ
cost drivers of drugs for rare and ultrarare diseases. Value Health. ite-du-ceps. Accessed 1 Aug 2018.
2018;21(5):525–31. 27. Schwabe U, Paffrath D. Arzneiverordnungs—report 2008.
10. IQVIA. Understanding the dynamics of drug expenditure. https Aktuelle Daten, Kosten, Trends und Kommentare. Berlin:
://www.iqvia.com/institute/repor ts/understanding-the-dynam Springer; 2008.
ics-of-drug-expenditure-shares-levels-compositions-and-drive 28. Schwabe U, Paffrath D. Arzneiverordnungs—report. Aktuelle
rs. Accessed 1 Aug 2018. Daten, Kosten, Trends und Kommentare. Berlin: Springer; 2009.
11. QuintilesIMS Institute Forecast. QuintilesIMS Institute Fore- 29. Schwabe U, Paffrath D. Arzneiverordnungs—report 2010.
cast: global drug market will reach nearly $1.5 trillion in 2021 Aktuelle Daten, Kosten, Trends und Kommentare. Berlin:
as spending growth moderates. https://www.iqvia.com/newsr Springer; 2010.
oom/2016/quintilesims-institute-forecast. Accessed 1 Aug 2018. 30. Schwabe U, Paffrath D. Arzneiverordnungs—report 2011.
12. Ferrario A, Arāja D, Bochenek T, Čatić T, Dankó D, Dimitrova Aktuelle Daten, Kosten, Trends und Kommentare. Berlin:
M, et al. The implementation of managed entry agreements in Springer; 2011.
Central and Eastern Europe: findings and implications. Pharma- 31. Schwabe U, Paffrath D. Arzneiverordnungs—report 2012.
coEconomics. 2017;35(12):1271–85. Aktuelle Daten, Kosten, Trends und Kommentare. Berlin:
13. Pauwels K, Huys I, Casteels M, De Nys K, Simoens S. Market Springer; 2012.
access of cancer drugs in European countries: improving resource 32. Schwabe U, Paffrath D. Arzneiverordnungs—report 2013.
allocation. Target Oncol. 2014;9(2):95–110. Aktuelle Daten, Kosten, Trends und Kommentare. Berlin:
14. Vogler S, Paris V, Ferrario A, Wirtz VJ, de Joncheere K, Schnei- Springer; 2013.
der P, et al. How can pricing and reimbursement policies improve 33. Schwabe U, Paffrath D. Arzneiverordnungs—report 2014.
affordable access to medicines? Lessons learned from European Aktuelle Daten, Kosten, Trends und Kommentare. Berlin:
countries. Appl Health Econ Health Policy. 2017;15(3):307–21. Springer; 2014.
15. Morgan S, Vogler S, Wagner A. Payers’ experiences with con- 34. Schwabe U, Paffrath D. Arzneiverordnungs—report 2015.
fidential pharmaceutical pricediscounts: a survey of public and Aktuelle Daten, Kosten, Trends und Kommentare. Berlin:
statutory health systems in North America, Europe, and Australa- Springer; 2015.
sia. Health Policy. 2017;121:354–62. 35. Schwabe U, Paffrath D. Arzneiverordnungs—report 2016.
16. Espin J, Rovira J, Olry de Labry A. Review series on pharmaceuti- Aktuelle Daten, Kosten, Trends und Kommentare. Berlin:
cal pricing policies and interventions: working paper 1: external Springer; 2016.
reference pricing. WHO/HAI Policy Review. 2011. 36. Busse R, Blumel M. Germany: health system review. Health Syst
17. Jommi C. Managed entry agreements and high cost medicines Transit. 2014;16:1–296.
(European perspective). In: Babar Zaheer-Ud-Din, editor. Equita- 37. AIFA (Agenzia Italiana del Farmaco). Osservatorio Nazionale
ble access to high-cost pharmaceuticals. London: Springer; 2018. sull’impiego dei Medicinali in Italia. L’uso dei farmaci in Italia.
18. Adamski J, Godman B, Ofierska-Sujkowska G, et al. Risk sharing Rapporto nazionale anno 2010, Rome. 2011.
arrangements for pharmaceuticals: potential considerations and 38. AIFA (Agenzia Italiana del Farmaco). Osservatorio Nazionale
recommendations for European payers. BMC Health Serv Res. sull’impiego dei Medicinali in Italia: L’uso dei farmaci in italia.
2010;10:153. Rapporto nazionale anno 2011, Rome. 2012.
19. Pauwels K, Huys I, Vogler S, Casteels M, Simoens S. Managed 39. AIFA (Agenzia Italiana del Farmaco). Osservatorio Nazionale
entry agreements for oncology drugs: lessons from the european sull’impiego dei Medicinali in Italia: L’uso del farmaci in italia.
experience to inform the future. Front Pharmacol. 2017;8:171. Rapporto nazionale anno 2012, Rome. 2013.
https://doi.org/10.3389/fphar.2017.00171. 40. AIFA (Agenzia Italiana del Farmaco): Osservatorio Nazionale
20. Clopes A, Gasol M, Cajal R, Segú L, Crespo R, et al. Financial sull’impiego dei Medicinali in Italia: L’uso del farmaci in italia.
consequences of a payment-by-results scheme in Catalonia: gefi- Rapporto nazionale anno 2013, Rome. 2014.
tinib in advanced EGFR-mutation positive non-small-cell lung 41. AIFA (Agenzia Italiana del Farmaco). Osservatorio Nazionale
cancer. J Med Econ. 2017;20(1):1–7. sull’impiego dei Medicinali in Italia: L’uso del farmaci in italia.
21. Quintiles IMS Institute. Outlook for global medicines through Rapporto nazionale anno 2014, Rome. 2015.
2021. Balancing cost and value. https://morningconsult.com/wp- 42. AIFA (Agenzia Italiana del Farmaco). Osservatorio Nazionale
content/uploads/2016/12/QuintilesIMS-Institute-Global-Outlo sull’impiego dei Medicinali in Italia: L’uso del farmaci in italia.
ok-FINAL.pdf. Accessed 1 Aug 2018. Rapporto nazionale anno 2015, Rome. 2016.
22. Kanavos P, Seeley L, Vandoros S. Tender systems for outpatient 43. AIFA (Agenzia Italiana del Farmaco). Osservatorio Nazionale
pharmaceuticals in the European Union: evidence from the Neth- sull’impiego dei Medicinali in Italia: L’uso del farmaci in italia.
erlands, Germany and Belgium. LSE Health London School of Rapporto nazionale anno 2016, Rome. 2017.
Economics. 2009. 44. Determinazione 1406/2016 e importi definitivi di cui all’art. 21,
23. Espin J, Rovira J, Calleja A, et al. How can voluntary cross-bor- comma 8 d.l. n. 113/2016; 2016. http://www.agenziafarmaco.
der collaboration in public procurement improve access to health gov.it/content/deter minazione-14062016-e-impor ti-definitiviYou can also read