Bayesian Network Analysis reveals resilience of the jellyfish Aurelia aurita to an Irish Sea regime shift
←
→
Page content transcription
If your browser does not render page correctly, please read the page content below
www.nature.com/scientificreports
OPEN Bayesian Network Analysis reveals
resilience of the jellyfish Aurelia
aurita to an Irish Sea regime shift
Emily G. Mitchell 1,2,3*, Margaret I. Wallace1,4, V. Anne Smith 2
,
Amanda A. Wiesenthal 1,5 & Andrew S. Brierley 1
Robust time-series of direct observations of jellyfish abundance are not available for many
ecosystems, leaving it difficult to determine changes in jellyfish abundance, the possible causes (e.g.
climate change) or the consequences (e.g. trophic cascades). We sought an indirect ecological route to
reconstruct jellyfish abundance in the Irish Sea: since zooplankton are jellyfish prey, historic variability
in zooplankton communities may provide proxies for jellyfish abundance. We determined the Bayesian
ecological network of jellyfish–zooplankton dependencies using jellyfish- and zooplankton-abundance
data obtained using nets during a 2-week cruise to the Irish Sea in 2008. This network revealed that
Aurelia aurita abundance was dependent on zooplankton groups Warm Temperate and Temperate
Oceanic as defined by previous zooplankton ecology work. We then determined historic zooplankton
networks across the Irish Sea from abundance data from Continuous Plankton Recorder surveys
conducted between 1970 and 2000. Transposing the 2008 spatial dependencies onto the historic
networks revealed that Aurelia abundance was more strongly dependent over time on sea surface
temperature than on the zooplankton community. The generalist predatory abilities of Aurelia may
have insulated this jellyfish over the 1985 regime shift when zooplankton composition in the Irish Sea
changed abruptly, and also help explain its globally widespread distribution.
Over the last few decades it has become increasing apparent that jellyfish play crucial roles in marine
ecosystems1–4. Whilst jellyfish used to be considered merely a trophic dead-end with few predators, through the
use of new approaches such as stable isotope analysis, metabarcoding and ‘critter cams’ we now know that jel-
lyfish are embedded in complex networks of trophic interactions5. However, understanding how these jellyfish
interactions change through time is hampered because jellyfish abundance data are sparse compared to fish stock
assessments, fisheries landing and mesozooplankton records. With a few notable e xceptions2 there is a general
lack of long-term (> 60 years) data on jellyfish a bundance2,6. This paucity of knowledge is partly because jellyfish
lack hard structures (scales, teeth, bones) that can leave some lasting record of historic abundance, partly because
of sampling difficulties (the fragile bodies of jellyfish are broken by nets), and partly because jellyfish have been
dismissed as a nuisance or worse by most researchers conducting the regular and geographically wide-reaching
surveys of abundant economically valuable fish stocks. The scarcity of historical data limits the predictions that
can be made of drivers of changing jellyfish abundance, potential tipping points in jellyfish ecosystems, or of
consequences to fisheries of variation jellyfish abundance2,6,7.
It has been argued that jellyfish ecology should be incorporated in to ecosystem-based approaches fish-
ery management because jellyfish can compete directly in each of their life cycle stages with some fish for
zooplankton8–12, and because jellyfish can predate fish eggs and larvae13. Of major concern is the potential for
the so-called ‘rise of slime’ whereby jellyfish come to dominate ecosystems as a consequence of reduction of fish
stocks by fishing and by marine habitat d egradation14. It is now becoming increasingly accepted that jellyfish
‘blooms’ can have substantial negative consequences for fish and fi shing1. Fisheries face major financial losses
when jellyfish blooms occur in their fishing grounds: these losses can be due to equipment damage, decreased
quality and quantity of catch, or even a complete failure of h arvest3,11,15. In one of the few situations where jellyfish
1
Pelagic Ecology Research Group, Scottish Oceans Institute, Gatty Marine Laboratory, School of Biology, University
of St. Andrews, St Andrews KY16 8LB, Scotland, UK. 2Centre for Biological Diversity, Sir Harold Mitchell Building,
School of Biology, University of St. Andrews, St Andrews KY16 9TF, Scotland, UK. 3Present address: Department
of Zoology, University of Cambridge, Cambridge CB2 3EJ, UK. 4Present address: Scottish Qualifications Authority,
Optima Building, 58 Robertson St, Glasgow G2 8DQ, UK. 5Present address: PharmaceuticalBiology, Saarland
University, 66123 Saarbrücken, Germany. *email: ek338@cam.ac.uk
Scientific Reports | (2021) 11:3707 | https://doi.org/10.1038/s41598-021-82825-w 1
Vol.:(0123456789)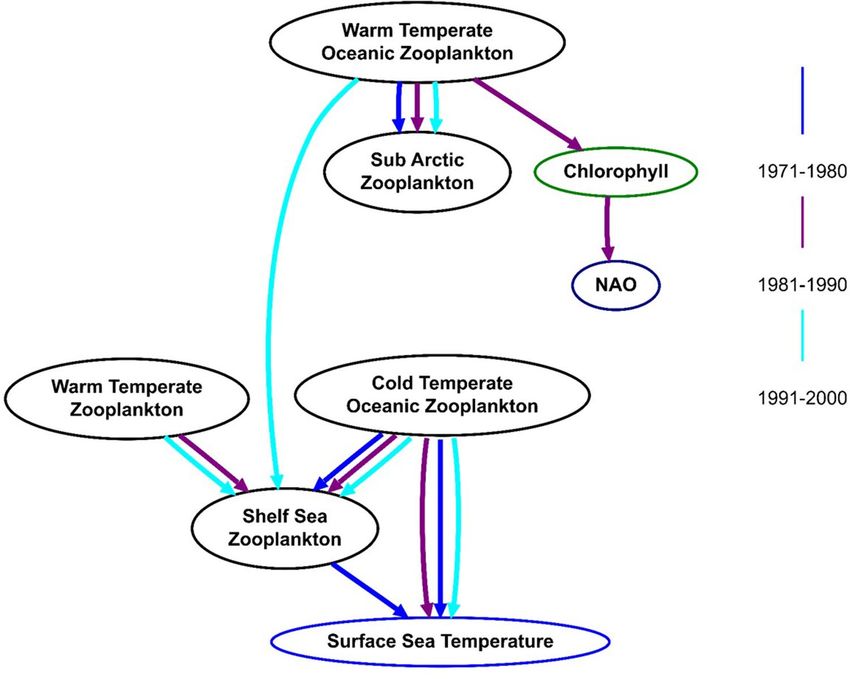
www.nature.com/scientificreports/
Figure 1. Herring landings data for the Irish Sea (modified from Ref.27). X-axis is time measured in years and
y-axis are landings in metric tonnes.
abundance data have been collected during fishery s urveys5, significant negative links between fish recruitment
and jellyfish abundance have been exposed4.
Effects of jellyfish on fish stocks may be direct or indirect, and/or be impacted by wider ecosystem changes.
These ecosystem changes may be gradual, such as the creeping changes in the distribution of species in the face
of warming, or more rapid as ‘regime shifts’ that see wholesale change in community c ompositions1,2,4. Regime
shifts in the phyto- or zooplankton communities such as in the northern Benguela upwelling system have been
shown to potentially impact jellyfish abundance and fish stocks9,16. Therefore, it is key for fisheries management
and marine ecosystem-based management more broadly, and indeed for quantification of fundamental bio-
geochemical processes such as carbon cycling, to understand the timing, causes and consequences of changing
jellyfish abundance11,17. For example, in the Benguela Current Large Marine Ecosystem, overfishing caused a
regime shift from a fish-dominated system to a jellyfish-dominated system3,16. Whether this shift is reversible
remains to be seen but, for fundamental ecological understanding and for management of a sometimes com-
mercially important marine living resources, it is important to understand how jellyfish populations change
through time, and to understand if these are in concert with or independent from changing temperatures or
changing zooplankton communities1,18–22.
In this study we develop a new approach to infer timeseries of jellyfish abundance from historical zooplankton
data, data that were in this instance gathered by the Continuous Plankton Recorder (CPR)23,24. We focussed on
the Irish Sea because this region has historically been a productive and commercially important fishing g round25
although herring stocks there crashed in the late 1970s (Fig. 1) and have declined steadily since, reaching an
all-time low in 201926,27. Between 1970 and 2000 zooplankton abundances have also changed dramatically:
a regime shift around 1985 saw a 10° biogeographic shift of the mesozooplankton community towards the
north28,29, and rapid declines in gadoid and salmon c atches30. The Irish Sea has been something of a focus for
jellyfish research1,31–33, but relationships between jellyfish, zooplankton and herring abundances remain largely
unresolved because of the lack of a jellyfish timeseries: we set out to determine such a timeseries.
The logic underpinning our approach was that if jellyfish in the Irish Sea had a significant association in
space with particular zooplankton (species or suites of species) that we could determine by paired jellyfish and
zooplankton field sampling, then it may be possible to infer historic jellyfish abundance from historic zooplank-
ton data. Such an historical approach would be potentially widely applicable because there are rich historic
zooplankton records for many regions globally.
One method for understanding ecosystem dynamics is to consider the whole ecosystem as a network where
different species or groups of species are defined as “nodes” and where correlations between them are described
as “edges” which link correlating species together34,35. Correlations between species can be purely trophic, in
which case the network represents a food w eb36, or can include other sorts of ecological interactions such as
37
facilitation or competition for r esources . Including physical variables such as temperature or—in the aquatic
realm—depth, also enables mutual habitat associations to be found38. Such multi-process networks can be recon-
structed statistically using methods such as Discrete Bayesian Network Inference Algorithms (BNIAs) which can
find network structures, including non-linear dependencies between nodes. BNIAs have primarily been used to
calculate gene regulatory and neural information-flow n etworks39,40, but more recently have been applied success-
fully to reconstruct ecological35,41, palaeontological42 and—in the marine realm—to abyssal p lain43, Antarctic38
44
and deep-sea benthic n etworks . To the best of our knowledge this study is the first application of BNIAs to a
pelagic ecosystem. It is important to note that the networks found by the BNIAs reflect dependencies caused
by co-localisations (e.g. two species have high abundances) and not by any particular biological interaction, for
example predation. The use of BNIA with ecological datasets enables direct dependencies (i.e. causal relation-
ships) between nodes (here groups of species) to be found, with autocorrelation (i.e. mutual indirect correlations)
between the nodes minimised. For example, if there are direct dependencies between species A and species B,
Scientific Reports | (2021) 11:3707 | https://doi.org/10.1038/s41598-021-82825-w 2
Vol:.(1234567890)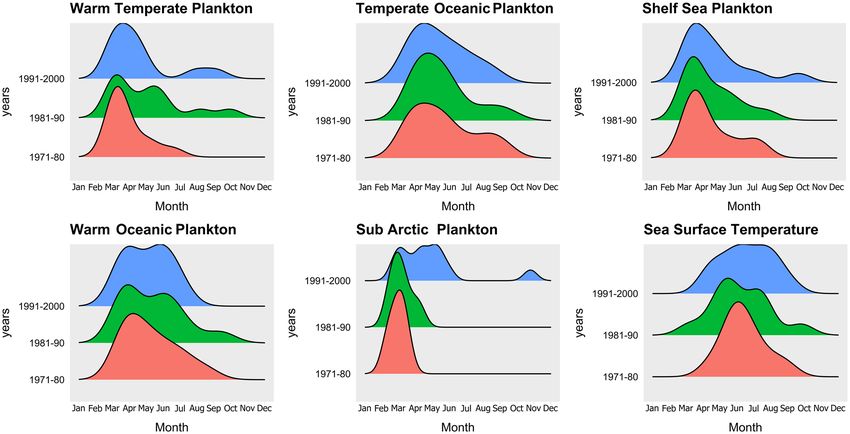
www.nature.com/scientificreports/
Figure 2. Cruise track in May 2008 showing locations for MIK net (pink squares), Otter trawl (yellow
triangles), ring net (dark blue diamonds) and CTD casts (red crosses).
and between B and C, it is likely that there is also an indirect dependency between A and C: the BNIA would
only report the direct dependencies (as two edges), not the indirect one. BNIAs can detect direct positive cor-
relations, which for spatial data indicate spatial co-occurrence, that are quantif by a positive Influence Score (IS).
Negative correlations have a IS < 0 and represent a negative correlation or spatial segregation such that when the
abundance of one species is high, the abundance of the other species will be low. Associations between the two
species will be either positive or negative, dependent on the species abundances are coded within BNs as IS = 0.
Thus, BNs presents information on both magnitude and direction of interactions between variables and select
only those interactions that are direct. These generated BNs can be used to infer how the network is likely to
change under different scenarios.
In this study, we first determine jellyfish–zooplankton interacts by using BNIAs to infer contemporary (2008)
spatial jellyfish–zooplankton networks in Irish Sea field data. Secondly, we built zooplankton networks (using
weekly data grouped into three decades 1971–2000) using historic Irish Sea data from the Continuous Plankton
Recorder, and then thirdly we inferred historic jellyfish abundances (1971–2000) by applying the contemporary
jellyfish–zooplankton interactions to the historic zooplankton networks. It was our hope that these analyses
would enable us to infer how jellyfish abundances may have changed historically in the Irish Sea over a period
when a regime shift occurred and the herring fishery collapsed27,45.
Methods and materials
Contemporary (2008) Irish Sea spatial jellyfish and zooplankton data. The data for the contem-
porary jellyfish–zooplankton network were collected over a 2-week cruise in the Irish Sea on the RV Prince
Madog in May 2008 (Fig. 2).
Net sampling. To determine the mesozooplankton community composition, and abundance of jellyfish (pelagic
medusae of the Cnidarian Classes Hydrozoa and Scyphozoa—these are technically zooplankton, but we call
them jellyfish here for the sake of clarity), net sampling was undertaken using a horizontally-towed midwater
MIK net, a vertically hauled 1 m diameter ring net, and an otter trawl (jellyfish only). A total of 144 stations were
sampled (Fig. 2). Zooplankton were identified (we encountered a total of 111 species) and counts per sample
were standardised to counts per unit volume with reference to flowmeter data that enabled volumes of water
filtered during each haul to be determined. Two MIK net samples contained Aurelia aurita and Cyanea capillata,
as did 65 ring net samples (see supplementary data). Of the 23 otter trawl deployments, (see Fig. 2) 18 contained
Aurelia, 8 contained Cyanea lamarckii, 4 contained Cyanea capillata and 2 contained Rhizostoma pulmo.
Visual, acoustic and aerial sampling for jellyfish. In addition to net sampling, efforts were made to obtain abun-
dance data for jellyfish by visual counts from the foredeck cf.4, scientific echosounding (18, 38 and 120 kHz;
Fig. 3 cf.46) and aerial survey32,47. Visual observations of jellyfish were made from the bow during daytime only.
To derive categorical estimates of abundance for each station the visual observations that occurred 750 m before
the station and 750 m after the beginning of each station were extracted, then the counts per distance were
placed into Low, Medium and High categories.
Visual observation data were available in daylight only, and were heavily influenced by sea state and glare,
so were not used in network analysis. Acoustic data were also ultimately discarded because the combination
of transducer depth (transducers were in the vessel hull) and acoustic near-field e ffects48 left the upper c. 10 m
Scientific Reports | (2021) 11:3707 | https://doi.org/10.1038/s41598-021-82825-w 3
Vol.:(0123456789)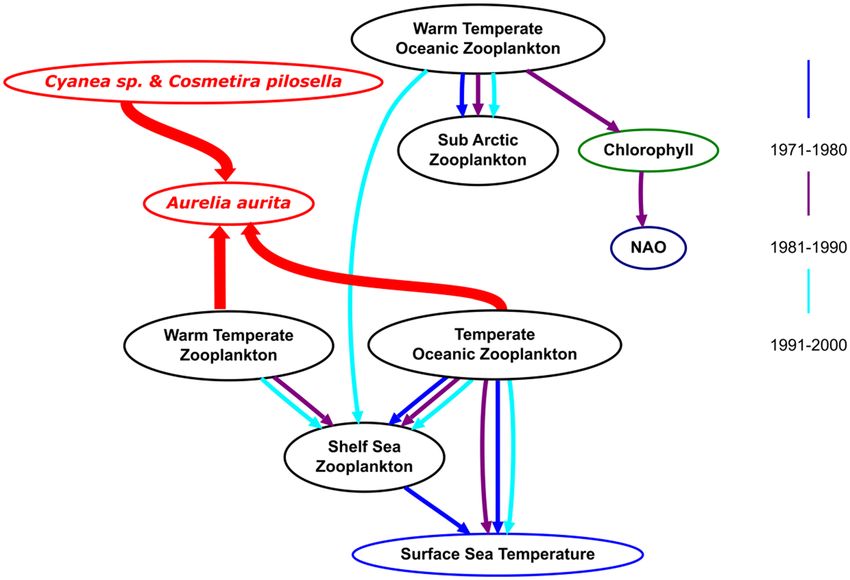
www.nature.com/scientificreports/
Figure 3. Jellyfish abundance sampling along the cruise route. Coloured circles are different jellyfish species:
green Aurelia; red Chrysaora hysoscella; blue Cyanea lamarckii; purple Cyanea capillata and black Rhizostoma
pulmo. The size of the circles is proportional to the log jellyfish count, varying between 0 and 9. The cruise track
is given by the blue lines; observations the green line; the red line shows the aerial survey flight path, and the
yellow line is a zone identified by previous aerial surveys as a jellyfish ‘hotspot’.
unsampled. The aerial survey coincided with a day of very high wind, and sea surface conditions turned out not
to be conducive to quantitative sampling: counting jellyfish is a tricky business!
Historic zooplankton data. Historic zooplankton data were obtained from the Sir Alistair Hardy Foun-
dation for Ocean Science (SAHFOS) Continuous Plankton Recorder (CPR) survey, and consisted of tow data
obtained between 1971 and 2000 on the Dublin—Liverpool route (50°40′–56°N, 15–2°30′W). The CPR is towed
at a depth of approximately 7 m but may actually sample the top 20 m due to t urbulence49. Further details of CPR
methods are given in Refs.23,50,51. Each CPR sample records the number of zooplankton present in approximately
3 m3 of water. 537 species of zooplankton are routinely identified by the analysts, and counts are standardised
to take account of differing volumes of water filtered per sample52. For this study we considered abundant 24
morpho-groups routinely detected by the CPR in the Irish Sea. They consisted of: 9 species, 7 larvae groups,
Isopods, Chaetognatha, Copepod nauplli, Calanus i-iv, Pseudocalanus adults, Para-pseudocalanus spp. and PCI
(Chlorophyl) as a proxy for phytoplankton concentration (see supplementary data). For simplicity these groups
(apart from PCI) will heron be referred to as zooplankton. We collapsed them into the five biogeographic groups
identified previously28,53: Warm Temperate, Warm Temperate Oceanic, Temperate Oceanic, Shelf Sea and Sub
Arctic (Fig. 4).
Data considerations for Bayesian Network Inference Algorithms. The Bayesian Network Inference Algorithm
(BNIA) ingests discrete data to ensure that noise is masked and only the relative abundances of each taxon are
important34,35,39,40,54. Calculation of the best Bayesian network given a data set is computationally intractable,
so BNIA uses a search technique which explores different networks and returns the highest-scoring network
encountered as the solution55. Zooplankton with no strong biogeographical affinities were removed from the
analysis, namely Copepod nauplii, Calanus i–iv, Isopoda, Larvacea, Lamellibranchia, Echinoderm and Poly-
chaete larvae, Chaetognath and Limacina retroversa. We combined the remaining 14 zooplankton species into
five groups as described below (Table 1)54. In order to avoid Type I errors, often associated with high-levels of
zero count data, we performed contingency-test filtering. This filtering disallowed an edge between two variables
whose joint distribution showed no evidence of deviation from the distribution expected from their combined
marginal distributions (chi-squared tests, p > 0.25)35,39,40,54 i.e. those which were correlated due to high levels of
mutual zeros.
The data were grouped as follows:
Scientific Reports | (2021) 11:3707 | https://doi.org/10.1038/s41598-021-82825-w 4
Vol:.(1234567890)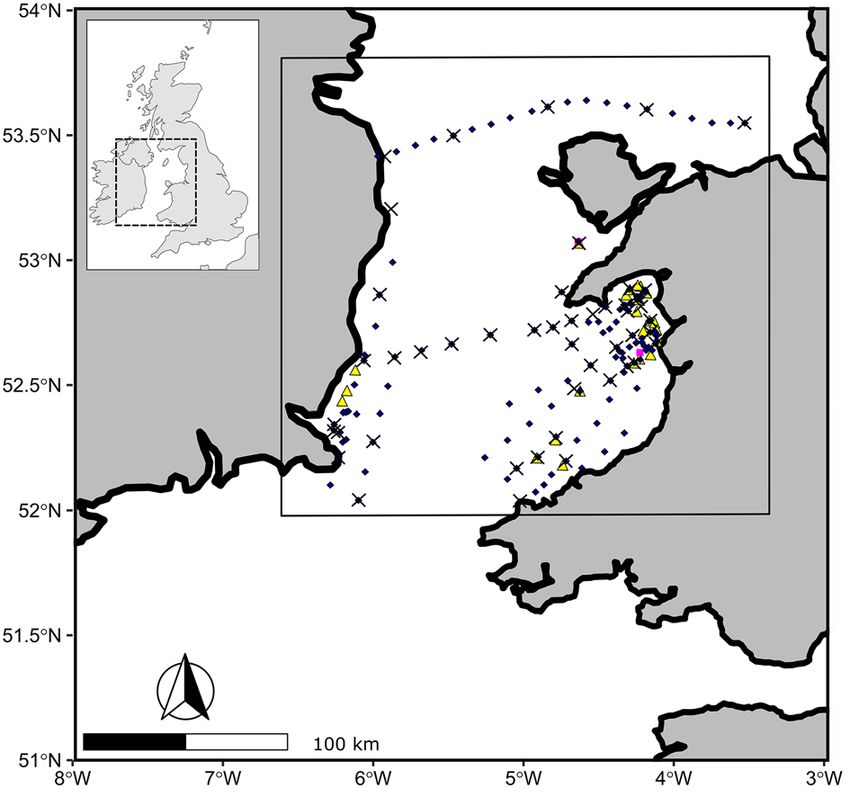
www.nature.com/scientificreports/
Biogeographical group Species present in group
Warm Temperate Cyphonautes larvae
Warm Temperate Oceanic Calanus helgolandicus, Decapod larvae, Cirripede larvae, Euphausiids
Temperate Oceanic Acartia spp., Podon spp., Evadne spp.
Shelf Sea Pseudocalanus, Para-Pseudocalanus spp., Temora longicornis, fish larvae
Sub Arctic Calanus finmarchicus, Tomopteris spp.
Table 1. Biogeographical zooplankton groupings following Ref.53 used in this study.
Step 1: Zooplankton Grouping. The zooplankton species were grouped by their biogeographical association
(cf.28,29,45; see Table 4) to enable us to determine the effect (if any) of the North Atlantic regime shift on
the networks.
Step 2: Weekly Averaging. Weekly averages were taken of the CPR count data to ensure consistent networks.
The number of CPR samples varied between zero and fifteen per week.
Step 3: Temporal Grouping. Previous research indicates that the regime shift occurred in the mid-1980s, with
the exact year of varying between species examined and analysis type28. We split the data into three
temporal groups, 1971–1980, 1981–1990 and 1991–2000 in order to ensure that the entire potential
regime shift window was contained within one temporal group (Fig. 4).
Incorporation of environmental data in BNIA. We included sea-surface temperature (SST) and an index of
the North Atlantic Oscillation (NAOI) as environmental variables in the zooplankton networks. SST data were
obtained as monthly medians from the UK Meteorological O ffice56, and weekly values were calculated by inter-
polation from those. The NAOI was defined as the difference between the normalised sea level pressure over
Gibraltar and the normalised sea level pressure over the southwest UK, and monthly indexes were obtained from
The Climate Research Group, University of East Anglia (http://www.cru.uea.ac.uk/ftpdata/nao.dat). The data we
used were as calculated by Ref.57.
Bayesian network inference. Bayesian network inference (BNI) was performed in Banjo41. Data prepara-
tion for Banjo (grouping and discretisation) and statistical analyses were performed in R v 3.3.2 cf.58. Further
analysis of Banjo outputs, when required, used the functional language Haskell59. The scripts are available on
Github: https://github.com/egmitchell/bootstrap. R code is available a thttps://github.com/egmitchell/jellyfish.
To determine each Bayesian network, the four steps below were followed as per Ref.35:
1. Discretisation. We split the data into three intervals; zero counts, low counts and high counts. Low counts
consisted of counts below the median for the species group and high counts were counts over the median.
Medians were used rather than means because for some groups the high counts were very high and use of the
mean would have resulted in a very small number of samples grouped in the highest interval. Employing a
large number of bins preserves resolution in the dataset, while fewer bins provide more statistical power, and
greater noise masking: three bins has been found to be optimal for ecological d ata35,39,54. Zeros were treated
as a separate entity because the absence of individuals (i.e. zero presence) is ecologically very different to the
presence of just one: this difference is in contrast to zero versus one in measures of gene expression, which
varies on a continuous scale between zero and o ne54 (Table 2).
2. Contingency-test filtering. The CPR dataset (6010 trawls obtained from between 1 and 4 times per week,
with 23 zooplankton and PCI (Chlorophyll Concentration) contained a large number of zeros (56%), which
could potentially have created problems with false positives (Type I errors) due to autocorrelation between
these zeros. We combated this problem in three ways. 1) By grouping zooplankton into biogeographic groups,
instead of just using the individual species data. 2) By taking weekly averages and having zero counts as a
separate bin we reduced the number of zeros to 39%: the BNIA we used requires that the data are evenly
distributed across all the bins, so 39% is adequate for a 3 bin system. 3) We used Chi-squared filtering to
remove edge pairs which showed no evidence of deviation from the distribution expected from their com-
bined marginal distributions (chi-squared tests, p > 0.25 cf.35).
3. BNIA. Banjo was run on each data set to search 10 million possible networks using a greedy search, whereby
at each search point the optimal edge addition to the network was used. The number of possible parents for
each node (the edges that feed into a node) was limited to three to help eliminate a rtefacts54. For each edge
the influence score (IS) was calculated.
4. Model Averaging. If a network suggested by Banjo represented the underlying ecological network, we would
expect the same network to persist even if a few sample points (under 1%) were removed from the input
data. Note that this bootstrapping removes the weekly samples, rather than individual species or groups.
We found, however, that there was variation within the suggested networks when a small number of sample
points were removed, so we applied a model averaging to the networks to overcome this stochasticity. For
each time period, we took 100 random samples, consisting of 90% of the total available data points. For each
edge that occurred, the probability of occurrence was calculated as the number of times the edge appeared
over the total number of 100-random-sample bootstraps conducted. This probability distribution of node
frequencies was bimodal for each of the network (2008, 1970s, 1980s, 1990s). These bimodal distributions
Scientific Reports | (2021) 11:3707 | https://doi.org/10.1038/s41598-021-82825-w 5
Vol.:(0123456789)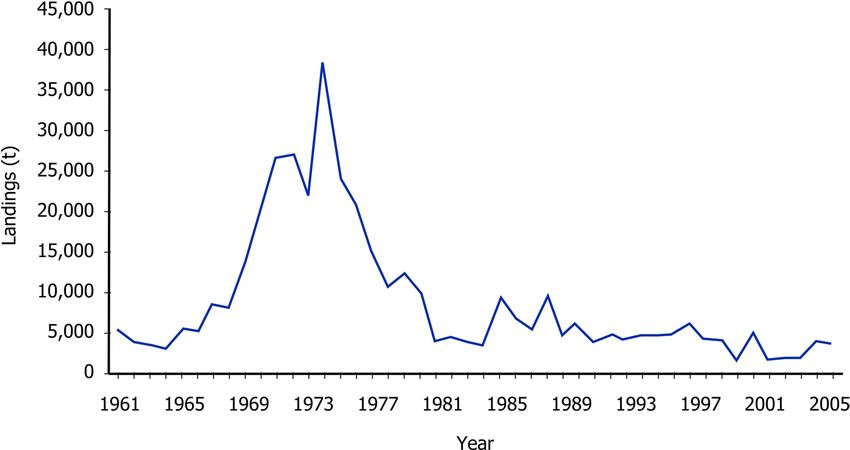
www.nature.com/scientificreports/

                        Warm Temperate Warm Temperate Cold Temperate         Shelf Sea        Sub Arctic   Chlorophyll                  Sea Surface    Herring
                        plankton       Oceanic plankton plankton             plankton         plankton     Concentration   NAO          Temperature    abundance
            70s
            Median      0.71              15.59             72.08            148.83           0.25         0.84            0.13         11.74          21.14
            Zero        2                 0                 0                0                0            0               0            0              0
            Low         4                 5                 5                5                5            5               6            5              5
            High        4                 5                 5                5                5            5               4            5              5
            80s
            Median      2.38              12.71             31.73            114.66           0.33         0.81            0.27         10.15          4.92
            Zero        4                 0                 0                0                0            0               0            0              0
            Low         3                 5                 5                5                5            5               6            5              5
            High        3                 5                 5                5                5            5               4            5              5
            90s
            Median      1.69              10.03             31.16            72.39            0.40         1.01            0.19         9.95           4.56
            Zero        4                 0                 0                0                0            0               0            0              0
            Low         3                 5                 5                5                5            5               7            5              6
            High        3                 5                 5                5                5            5               3            5              4
                                                                                                                           Cold                        Warm
                                                                                                                           temperate    Warm           temperate
                                                            Chlorophyll      Cold temperate   Sub artic    Shelf sea       oceanic      temperate      oceanic
                        Aurelia aurita    Other jellyfish   Concentration    plankton         plankton     plankton        plankton     plankton       plankton
            2008
            Median      4                 2                 1005             3090             3            8073            8073         23             480
            Zero        92                75                0                85               82           0               14           4              4
            Low         12                21                61               19               19           61              46           53             56
            High        15                19                61               19               15           61              60           55             57

                                               Table 2.  Zooplankton count data for the different variables included in the Bayesian network inference.
                                               Median is the median count numbers for each variable which defines the break between the High and Low
                                               category.

                                                   suggest that there are two Gaussian distributions of edges, the rare/low occurrence ones, and the highly
                                                   probable edges. The mean IS for each edge over all bootstraps was also calculated.

                                                  For the BNI analyses, jellyfish count data from net samples were split into two groups: Aurelia aurita, which
                                               was the most abundant species (97.8% by number), and ‘other taxa’ which consisted of Cyanea spp. (1.9%) and
                                               Cosmetira pilosella (0.3%). Rhizostoma were also caught, but due to very low numbers they were not included in
                                               the analyses. The zooplankton were grouped by biogeographic affinity cf.28 (as per Table 1) to ensure consistent
                                               networks. This biogeographic grouping was required because not all zooplankton species were present in all of
                                               the 144 samples, and zero-inflated data are not valid with the Bayesian priors used in this BNIA.

                                               Inference of historical jellyfish abundance. One of the most powerful aspects of BNs is the ability to
                                               make inferences of how the probability of one node (taxa or physical variable) being in each state (zero, low or
                                               high for a taxon) is likely to change given that another node is in a given state (zero, low or high for a taxon)38.
                                               This inference is made by calculating the probability of node A being in a given state given node B is in a given
                                               state. For example, the probability of a given species being in a zero, low or high abundance state can be inferred
                                               for SST being in either a low or high state. This inference can be used to calculate the likely consequence for spe-
                                               cies abundance of changing variables such as SST.
                                                   All nodes that have dependencies between A and B are included in the calculation:
                                                                                                         s=S

                                                                                                n=N−1
                                                                                                            s=1 P(Bn |An+1 )
                                                                                    P(A|B ) =          N
                                                                                                  n=1     m=1 P(B|Am )P(Am )

                                                   The N are the total number of nodes in the network and n and m are the indices for the chain of nodes of
                                               length N connecting the first and last nodes. S are the number of discrete states for each node, which are indexed
                                               s. In order to infer the likely change of one taxon’s (A) abundance on another (B), for example if A changes from
                                               a high abundance state to a zero abundance state, the probabilities of B existing in all states are calculated given a
                                               high abundance state for A, and the probabilities for B existing in all states are calculated given a zero abundance
                                               state for A. The inferred change in one taxon’s abundance is then the difference between these probabilities.
                                                   The abundance probabilities for the biogeographical zooplankton groups (Warm and Cold Temperate) were
                                               calculated (e.g. P(High abundanceǀLow Temperature)) given the SST state for each of the three decades. The

          Scientific Reports |     (2021) 11:3707 |                 https://doi.org/10.1038/s41598-021-82825-w                                                     6

Vol:.(1234567890)
www.nature.com/scientificreports/
mean temperature in the Low SST state was approximately 4 °C lower than the High SST state. An increase in
the probability of a species/group given the probability of another species/group having a zero count represents
the increase or decrease in abundance in that area, for that temperature change.
In order to calculate historic jellyfish abundance probabilities, the dependencies of jellyfish on zooplankton
were assumed to remain static over the three decades. Note the implicit assumption here that Aurelia continue to
feed on the same biogeographic zooplankton groups, although the relative rate of feeding may change. For each
decade the abundance probabilities of the biogeographic zooplankton groups that the jellyfish nodes depended
on were calculated. The jellyfish node probability abundances (zero, low, high) given either Low SST or High
SST were calculated for each decade given the dependencies found in the spatial network inferred from the
2008 field data.
Using Naïve Bayes Classifiers to infer the relative importance of different zooplankton groups
to herring. In order to determine the relationships between zooplankton groups and herring, we used naïve
Bayes Classifiers to determine the relative importance of each zooplankton biogeographic group and environ-
mental group to herring. The herring data were recorded as annual catch data for the period 1970–200027, which
meant there were only 10 samples for each decade: this was insufficient for direct incorporation directly into
the CPR BNs, but naïve Bayes Classifiers can determine and rank the importance of each group relative to each
other60. Herring have a multi-year life-cycle, and there are lags between spawning and recruitment and capture.
Impact by jellyfish on herring is possible as direct predation on eggs and larvae, and by competition for zoo-
plankton prey1. To calculate a calendar years’ worth of zooplankton data we took yearly averages of zooplankton
starting in September (herring spawning time)61, discretized into low and high categories based on median
values for each decade, and compared them to the zooplankton data the following year (Table 2). To rank the
groups, the herring catch data were included in the zooplankton abundance network, linked via an edge to a
zooplankton (and environmental) group, and the network score calculated. This scoring was repeated for all
groups across the three decades. For each decade the rank of the biogeographical zooplankton group was given
by the change in network score between the CPR networks without herring and the networks that included a
forced link between the herring and the group. Note that these analyses make no assumptions or suggestions to
whether the herring did depend on any zooplankton, instead they rank the relative importance of each group, so
provide a different approach to that used with the jellyfish data.
Results
Irish Sea contemporary spatial network from cruise data. The Bayesian Network for the field data
collected in 2008 connected all nodes (Fig. 5). Aurelia was dependent on Cold Temperate zooplankton, Oce-
anic and Warm Temperate zooplankton, and on the Cyanae spp. and Cosmetira pilosella jellyfish group. Note
that because these two zooplankton groups are connected to other zooplankton groups, the implication is that
Aurelia will be effected indirectly by all these other zooplankton groups t oo38. The dependency of Aurelia with
Warm Temperate Zooplankton was negative: high Warm Temperate Zooplankton corresponded to low Aure-
lia abundances whereas dependence on the Cold Temperate Oceanic Zooplankton group was non-monotonic,
i.e. had different effects dependent on zooplankton abundances. Three of the edges between the zooplankton,
Chlorophyll Concentration (indicating phytoplankton) and jellyfish groups showed positive dependences, three
negative and two non-monotonic (Fig. 5).
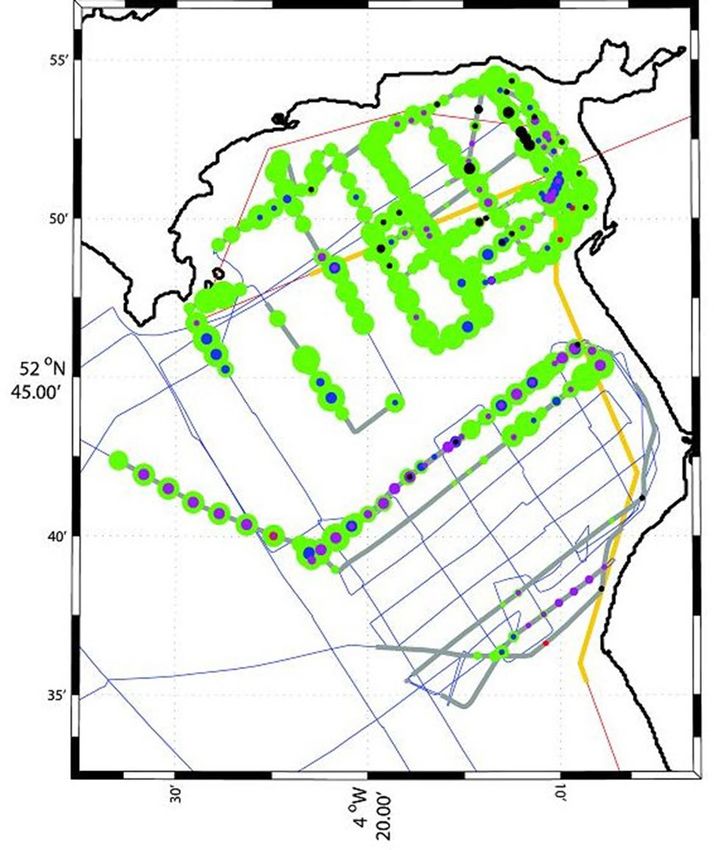
Historic zooplankton networks from CPR data. The Bayesian Networks for CPR-sampled zooplank-
ton across the three decades have different dependencies (Fig. 6). There are two sub-networks for the 1970s and
1980s networks, but these join into a single network for the 1990s. Three dependencies are present throughout
the three networks: Shelf Sea Zooplankton with Cold Temperate zooplankton; Cold Temperate Zooplankton
with SST, and Warm Temperate Oceanic zooplankton with Sub Arctic Zooplankton. The merge of the two sub-
networks from the 1970s and 1980s in the 1990s occurs via the inclusion of the Warm Temperature Zooplankton
in the 1980s network, and with the connection of Warm Temperate Oceanic Zooplankton to Shelf Sea zooplank-
ton in the 1990s.
In order to investigate whether the changes in network structure were statistically significant, tests were
conducted on the occurrence of edges for the three different time periods. There was no significant difference
between the 1980s and 1990s (p = 0.3076), but the 1970s were significantly different to the 1980s (p = 0.0211) and
1990s (p = 0.0156). The network for 1981–1990 represents the time period over which zooplankton community
composition has been recorded as changing elsewhere in the North Atlantic49,53,62. The 1981–1990 network is
the only network where the Chlorophyll Concentration and NAOI variables are connected to other variables:
this connection is via the Warm Temperate Oceanic Zooplankton group.
Changes to the ecological networks over time were also evident as changes in the strengths of the dependen-
cies, as measured by the Interaction Strength (IS). The Shelf Sea Zooplankton and Cold Temperate zooplankton
IS did not change significantly (as assessed by Chi-squared test) between 1970–1980 and 1981–1990, however it
did change significantly (p < 0.0001) between the last two decades. Warm Temperature Oceanic Zooplankton and
Sub Arctic Zooplankton changed significantly (p < 0.0001) between all three periods, with mean ISs of 0.44, 0.17
and 0.53 for the 1970s, 1980s and 1990s respectively. The IS for Cold Temperate Zooplankton and SST increased
significantly over the three time periods, increasing sequentially from 0.24 to 0.47 and then to 0.64 (p < 0.0001).
Ranking of relative importance of zooplankton groups to herring. The naïve Bayes classifiers
found that the ranking of zooplankton groups with respect to influence on herring changed across the regime
shift period (Table 3). The network improved pre-regime shift (1970s) with the additions of Cold Temperate
Scientific Reports | (2021) 11:3707 | https://doi.org/10.1038/s41598-021-82825-w 7
Vol.:(0123456789)www.nature.com/scientificreports/
Figure 4. Historic Plankton group abundances (from CPR data) and sea surface temperature (from UK
Meteorological Office). The three time periods are shown in different colours: Peach 1971–1980; Green 1981–
1990, and Blue 1991–2000. The x-axis is the month of the year, and the y-axis shows the relative zooplankton
abundance (scaled relative to each groups maximum) for each time period. This relative scaling is to enable clear
comparisons of relative abundance between groups for each biogeographical zooplankton group over the three
decades.
Figure 5. Jellyfish—zooplankton network apparent in the 2008 cruise data. The occurrence rate is indicated
by the width of the edge (the line depicting dependencies between two taxa) - the wider the line, the higher
the occurrence rate. Arrows indicate non-mutual dependence between two taxa; for example the Sub Arctic
Zooplankton group has a positive dependency (is aggregated) with Warm Temperate Oceanic Zooplankton,
but Warm Temperate Oceanic Zooplankton do not have a dependency with Sub Arctic Zooplankton. Where
there is a mutual dependency between two groups, such as with Cold Temperate Oceanic Zooplankton and
Aurelia aurita, the edge does not have an arrow. Numbers by the lines are the mean interaction strengths of
the dependencies, with positive interaction strengths indicating aggregation, negative interaction strengths
indicating segregation, and zero indicating different aggregation and segregation behaviours at different
densities. Phytoplankton abundances are given by Chlorophyll Concentration.
Zooplankton to herring (ΔS = − 1.9110) and NAOI to herring (ΔS = − 0.5248), reflecting underlying relation-
ships inferred for our analyses between the time-lagged herring catch data, zooplankton and the environment.
Scientific Reports | (2021) 11:3707 | https://doi.org/10.1038/s41598-021-82825-w 8
Vol:.(1234567890)www.nature.com/scientificreports/
70s 80s 90s
Group Score change IS with herring Group Score change IS with herring Group Score change IS with herring
Warm Temper-
Cold Temperate − 1.9110 − 0.5455 Sub Arctic − 0.9602 − 0.3077 − 4.0144 0.0000
ate Ocean
Chlorophyll Concen-
NAO − 0.7548 0.3791 -0.4704 − 0.3262 NAO − 1.3775 − 0.4952
tration
Sub Arctic 0.0000 − 0.1818 Cold Temperate 0.0000 0.125 Sub Arctic − 0.9555 − 0.3636
Chlorophyll Concen-
0.0000 − 0.1818 Shelf Sea 0.0000 0.125 Cold Temperate 0.0000 0.0000
tration
Warm Temper- Chlorophyll Concen-
0.5628 − 0.1818 NAO 0.0000 − 0.5353 0.0000 − 0.3636
ate Ocean tration
Temperature 0.7548 − 0.1818 Warm Temperate 0.4704 0.0000 Temperature 2.3330 0.0000
Warm Temperate 0.9055 − 0.6593 Warm Temperatecean 0.9602 0.125 Warm Temperate 2.7132 0.3808
Shelf Sea 1.9110 0.1818 Temperature 2.0665 − 0.286 Shelf Sea 3.0000 0.0000
Table 3. The naïve Bayes classifiers for the time-lagged herring catch data with each group. The more negative
the change in score, the better the network fit to the data, which reflects an underlying dependency between
the herring and the group.
70s 80s 90s
Low SST High SST Low SST High SST Low SST High SST
Low Aurelia 13.42% 67.36% 18.32% 61.64% 17.73% 61.44%
High Aurelia 86.58% 32.64% 81.68% 38.36% 82.27% 38.56%
Table 4. Probability of Aurelia being in a low or high abundance state (excluding zero counts) given either low
or high sea surface temperature over the three decades.
Post regime shift (1990s), Cold Temperate Zooplankton were ranked fourth down from 3rd pre regime shift i.e.
were 4th most influential on herring, but did not change the network score (ΔS = 0.0000), suggesting a loss of
influence, while the NAOI remained ranked second and Warm Temperate Oceanic Zooplankton were ranked
first (ΔS = − 4.0144). The NAOI influence score changed from positive pre regime-shift to negative post regime-
shift. This change coincides with a shift in the NAO from a low phase to a high phase between the 1960s and
1990s63.
Inference and probabilities. The Warm Temperate and Cold Temperate Oceanic Zooplankton groups
have higher abundances at high SST (Table 4). The probability of being in a high abundance state given either
high or low SST increases through time for the Warm Temperate Zooplankton group. In contrast, the abundance
of the Cold Temperate Oceanic Zooplankton group remained steady throughout the three time periods given
low SST, but decrease given high SST.
Across the three decades, low SST corresponded to high inferred jellyfish probability, and high SST to low
inferred jellyfish probability (Table 4). For both high and low inferred Aurelia abundance the probability of
being in a high abundance state remained relatively constant, in contrast to the abundances of the zooplankton
groups which changed significantly over the regime shift (Fig. 7).
Discussion
Jellyfish-abundance time-series globally are rare, with less than 40 datasets over 10 years in length as of 2 0132.
Most of these datasets are from the northern hemisphere (87%), and in particular the Atlantic Ocean (17%) and
the Mediterranean Sea (17%)2, so our understanding of how jellyfish abundances are changing globally through
time is extremely limited. The debate on changing frequency of jellyfish bloom occurrences is however lively and
ongoing, with a perception that the frequency of blooms is increasing e.g. Ref.64 due to anthropogenic influences
such a overfishing and climate change6,65. While increases in jellyfish abundance have been found in some areas2,
including in the Irish S ea1, the misreporting of increased jellyfish blooms has led to over-stated generalisations
on the occurrence of bloom events66,67. Global analyses of the available jellyfish time-series in 2013 showed a
negligible overall increase with time, with a weak increasing linear trend that was possibly just an up-phase on
a longer-period global oscillation2: more data and analyses are needed in order to tease apart the potentially
complex interplay of jellyfish with other marine life and environmental variability.
In order to extend time-series of jellyfish abundance to a broader temporal and geographical scale, we pro-
pose an eco-palaeontological method for inferring historic jellyfish abundance from historic zooplankton data.
We demonstrated this approach here by first inferring ecological zooplankton networks for three decades using
historic CPR data from the Irish Sea from 1971 to 2000. Our BNI showed marked changes in zooplankton
networks across these three decades, but three dependencies remained throughout: Cold Temperate Oceanic
Scientific Reports | (2021) 11:3707 | https://doi.org/10.1038/s41598-021-82825-w 9
Vol.:(0123456789)www.nature.com/scientificreports/
Figure 6. Historic zooplankton networks for the three time periods. Arrows indicate non-mutual dependence
between two taxa; for example Shelf Sea Zooplankton are aggregated with respect to Warm Temperate
Zooplankton, but Warm Temperate Zooplankton are not aggregated with respect to Shelf Sea Zooplankton.
Zooplankton with SST and with Shelf Sea Zooplankton, and Warm Temperate Oceanic zooplankton and Sub
Arctic Zooplankton (Fig. 6). In the 1980s, environmental factors became significantly more important—it was
the only decade for which significant dependencies between a zooplankton group (Warm Temperate Oceanic
Zooplankton) and Chlorophyll Concentration and an index of the NAO were found, possibly due to the regime
shift perturbing ecosystem function. The regime shift resulted in fundamental changes to the historic zooplankton
networks. Prior to 1990, the Warm Temperate Oceanic and Sub Arctic plankton did not depend on the other
zooplankton groups, nor SST. As such, prior to 1990, there are two distinct ecological networks of zooplankton so
that changes abundances within one network would not have affected the other network. Then, after the regime
shift of the 1980s, in the 1990s Shelf Sea Zooplankton formed a dependency with Warm Temperate Oceanic
Zooplankton, after the regime shift of the 1980s, so that changing abundances of any zooplankton group began
to have knock-on effects across all the other groups. This increased connectivity likely increased ecosystem
stability68,69 by potentially providing a broader spectrum of prey to predators of zooplankton.
We inferred the likely jellyfish—zooplankton networks for each of the three study decades (1970s, 80s and
90s) by adding the jellyfish—zooplankton interactions determined from the 2008 survey data networks to the
historic CPR networks. Finally, we inferred Aurelia abundances for each of the three decades from the historic
networks (Fig. 7). We found that inferred Aurelia abundances were not markedly impacted by changing zoo-
plankton networks: T the probability of Aurelia existing in a high-abundance state being significantly higher for
colder sea surface temperatures. This higher abundance state occurring despite significant changes over time
in the abundance probabilities and Bayesian network structures for multiple zooplankton groups (Figs. 5, 7). It
thus appears as though Aurelia aurita has been resilient to change in the composition of the zooplankton com-
munity, which is its prey. Our finding here that SST in the Irish Sea has a stronger influence on abundance of A.
aurita than does the composition of the prey fields is consistent with a previous study that showed, using CPR
data, that temperature was a more significant driver of the abundance of shelf jellyfish in the northern Benguela
upwelling ecosystem than was f ood16.
From our results alone it is not possible to determine the underlying basis of the apparent resilience of
Aurelia aurita to the mid 1980’s regime shift. One possibility is whilst the species composition of the Irish Sea
zooplankton community changed, the size spectrum of that community and the nutritional content did not
change, so Aurelia′s preyfield remained functionally similar. Although the regime shift in the 1980s saw changes
in species composition and ecological network structure, ecosystem stability and resilience from the perspective
of Aurelia was maintained via various processes including functional and/or trophic r edundancy70,71, competi-
tion trade-offs72, stabilizing feedback loops36 and/or functional complexity73. Despite this putative functional
similarity in the zooplankton cimmunity from the perspective of Aurelia, there were though major differnces
Scientific Reports | (2021) 11:3707 | https://doi.org/10.1038/s41598-021-82825-w 10
Vol:.(1234567890)www.nature.com/scientificreports/
Figure 7. The network used to infer historic Aurelia abundances across the three decades (70s: purple edges,
80s: blue edges and 90s: cyan edges). The red edges and nodes were inferred from the cruise data, and are
assumed to be constant over the historic study period (1971–2000). Different coloured edges represent different
time periods.
in zooplankton network connectivity pre- and post regime shift. The post regime-shift network (1990s) was
the only one of the three decades where all zooplankton groups connected (Fig. 7). The increased connectivity
within the 1990s zooplankton network may be due to the decreasing month-specificity of zooplankton group
peaks, with a broadening of the abundance peaks for most zooplankton groups, resulting in an increased tem-
poral overlap (Fig. 4). In the context of Cushing’s match-mismatch hypothesis, this may give Aurelia a longer
time window each year to surf the wave of zooplankton production. We suggest that the increased connectivity
between different biogeographical zooplankton groups created redundancy in prey species, and so enabled
prey-switching by Aurelia74. Aurelia had dependencies with the Warm Temperate and Cold Temperate Oceanic
Zooplankton groups, in which cyphyonautes larvae dominate the Warm Temperate group and Calanus helgo-
landicus and barnacle larvae dominate the Cold Temperate Oceanic zooplankton group. Therefore, it is likely
that these taxa are the key drivers for this network, with Aurelia switching prey post regime shift. In our data,
particularly abundant members of the Warm Temperate Zooplankton group included cyphonaute larvae of
bryozoans and numerous species of mesozooplanktic copepods. Aurelia spp. are known to be able to thrive on
very small z ooplankton75 and indeed feeding experiments on Aurelia aurita from the Black Sea suggest that food
items overlooked by researchers appraising prey visually may provide ten times the energy for Aurelia than that
obtained from mesozooplankton76: it is possible that Aurelia medusa could be sustained by cyphonautes. Another
possibility is that environmental conditions that favour strobilation (asexual reproduction) of Aurelia benthic
phases also favour bryozoan reproduction. Our own work, for example, has shown that cold winter conditions
lead to elevated rates of ephyrae production by strobilation77 and that abundance of medusae in the North Sea
is high in years characterised with low NAO index. A similar association is evident between NAO phase and
abundance of cyphonaute larvae in Loch Hyne78.
There was no clear association between Aurelia abundance probabilities (Table 4) and herring catch (Fig. 1),
which suggests that Aurelia abundances and herring recruitment do not directly interact. This lack of interac-
tion can be explained by our 2008 field-data network, which did not include any direct dependencies between
Aurelia (or any other jellyfish) and the Sub Arctic Zooplankton group (Fig. 6) which is dominated by Calanus
finmarchicus (Table 1), historically the primary food source of h
erring79. The ranked zooplankton groups (Table 3)
show that the Cold Temperate Zooplankton (Acartia spp., Podon spp. and Evadne spp.) was the most important
group prior to the regime shift, and afterwards changed to Cold Temperate Oceanic (dominated by cyphyonaute
larvae) and Sub-Artic Zooplankton group (dominated by Calanus finmarchicus). It appears that Aurelia do not
compete directly with herring for larger stages of Calanus finmarchicus, and while small herring may compete
to some extent with Aurelia for the cyphyonaute larvae, these larvae historically formed only a relatively small
proportion (5.4%)80 of the herring diet so are unlikely to have a strong influence on herring success.
Our conclusions on jellyfish—herring interactions in the Irish Sea differ from those drawn by previous stud-
ies of the North Sea, which found that over the period 1958–2007 jellyfish were negatively impacting herring
recruitment4,7. The biogeographical distribution of Calanus finmarchicus changed significantly in the North Sea
Scientific Reports | (2021) 11:3707 | https://doi.org/10.1038/s41598-021-82825-w 11
Vol.:(0123456789)www.nature.com/scientificreports/
during the mid-1980s24, suggesting that Irish Sea herring would have experienced a less substantial change in
their prey field during this time. In any case our networks suggest minimal interaction between Calanus finmar-
chicus in the Irish Sea. It would be instructive to run a network analysis of North Sea zooplankton and jellyfish,
but that is beyond the scoipe of the present study (Fig. 6).
Plankton communities in the Irish Sea, like as in the North Sea, are primarily driven by hydroclimatic
conditions24, with some areas now showing increased autumnal diatom production due to anthropogenic nutri-
ent enrichment81. Future anthropogenic impact and climatic changes are likely to lead to further changes for
Irish Sea plankton communities. These changes are likely to include further zooplankton biogeographic shifts,
with cold-water species being replaced by the warm-water species as the cold-water species retreat north. It is
not possible to predict from our analyses here how these changes will affect jellyfish abundances, and as jellyfish
responses would depend on whether further changes to network structure occur. However, jellyfish abundances
may not necessarily increase: from our inferred historic jellyfish abundances there are noticeably higher abun-
dances with cold sea surface temperature, so any increased warming may have a negative impact on jellyfish
abundances, despite their resilience over the 30 year study period here5.
Our BNI technique has provided a window into the past and revealed a new perspective on jellyfish ecosystem
interactions in the Irish Sea. Using a combination of historic zooplankton data with contemporary jellyfish data
we have been able to demonstrate that, despite a change in the ecological networks of zooplankton between the
1970s and 1990s, the abundance of Aurelia aurita most likely remained stable: we suggest that is a consequence
of Aurelia′s generalist ability to take a wide range of prey. Our work suggests a remarkable resilience of Aurelia
aurita to ecosystem reorganisation experienced in the Irish Sea over the regime shift of the 1980s. The generalist
ability of Aurelia as exhibited in the Irish Sea may help explain the pan-global distribution of the Moon jellyfish
species complex and its success in a diversity of l ocations82,83.
Data availability
Data are available on Figshare: https://doi.org/10.6084/m9.figshare.12620753.
Code availability
Code is available on https://github.com/egmitchell/bootstrap , https://github.com/egmitchell/jellyfish.
Received: 28 July 2020; Accepted: 25 January 2021
References
1. Lynam, C. P. et al. Have jellyfish in the Irish Sea benefited from climate change and overfishing?. Glob. Change Biol. 17, 767–782
(2011).
2. Condon, R. H. et al. Recurrent jellyfish blooms are a consequence of global oscillations. Proc. Natl. Acad. Sci. 110, 1000–1005
(2013).
3. Lynam, C. P., Hay, S. J. & Brierley, A. S. Jellyfish abundance and climatic variation: Contrasting responses in oceanographically
distinct regions of the North Sea, and possible implications for fisheries. J. Mar. Biol. Assoc. 85, 435–450 (2005).
4. Lynam, C. P. et al. Jellyfish overtake fish in a heavily fished ecosystem. Curr. Biol. 16, R492-493 (2006).
5. Hays, G. C., Doyle, T. K. & Houghton, J. D. R. A paradigm shift in the trophic importance of jellyfish?. Trends Ecol. Evol. 33, 874–884
(2018).
6. Gibbons, M. J. & Richardson, A. J. Patterns of jellyfish abundance in the North Atlantic. In Jellyfish Blooms: Causes, Conse-
quences, and Recent Advances: Proceedings of the Second International Jellyfish Blooms Symposium, held at the Gold Coast,
Queensland, Australia, 24–27 June, 2007 (eds. Pitt, K. A. & Purcell, J. E.) 51–65 (Springer Netherlands, 2009). https://doi.
org/10.1007/978-1-4020-9749-2_4.
7. Attrill, M. J., Wright, J. & Edwards, M. Climate-related increases in jellyfish frequency suggest a more gelatinous future for the
North Sea. Limnol. Oceanogr. 52, 480–485 (2007).
8. Brodeur, R. D., Sugisaki, H. & Hunt, G. L. Jr. Increases in jellyfish biomass in the Bering Sea: Implications for the ecosystem. Mar.
Ecol. Prog. Ser. 233, 89–103 (2002).
9. Pauly, D., Christensen, V., Dalsgaard, J., Froese, R. & Torres, F. Fishing down marine food webs. Science 279, 860–863 (1998).
10. Purcell, J. E. & Arai, M. N. Interactions of pelagic cnidarians and ctenophores with fish: A review. Hydrobiologia 451, 27–44 (2001).
11. Robinson, K. L. et al. Jellyfish, forage fish, and the world’s major fisheries. Oceanography 27, 104–115 (2014).
12. Uye, S. Blooms of the giant jellyfish Nemopilema nomurai: A threat to the fisheries sustainability of the East Asian Marginal Seas.
Plankton Benthos Res. 3, 125–131 (2008).
13. Wright, R. M., Le Quéré, C., Buitenhuis, E., Pitois, S. & Gibbons, M. Unique role of jellyfish in the plankton ecosystem revealed
using a global ocean biogeochemical model. Biogeosci. Discuss. https://doi.org/10.5194/bg-2020-136 (2020).
14. Jackson, J. B. C. Ecological extinction and evolution in the brave new ocean. Proc. Natl. Acad. Sci. 105, 11458–11465 (2008).
15. Kintner, A. & Brierley, A. S. Cryptic hydrozoan blooms pose risks to gill health in farmed North Atlantic salmon (Salmo salar). J.
Mar. Biol. Assoc. 99, 539–550 (2019).
16. Flynn, B. A. et al. Temporal and spatial patterns in the abundance of jellyfish in the northern Benguela upwelling ecosystem and
their link to thwarted pelagic fishery recovery. Afr. J. Mar. Sci. 34, 131–146 (2012).
17. Luo, J. Y. et al. Gelatinous zooplankton-mediated carbon flows in the global oceans: A data-driven modeling study. Glob. Biogeo-
chem. Cycles 34, e2020GB006704 (2020).
18. Behrenfeld, M. J. et al. Climate-driven trends in contemporary ocean productivity. Nature 444, 752–755 (2006).
19. Hays, G. C., Richardson, A. J. & Robinson, C. Climate change and marine plankton. Trends Ecol. Evol. 20, 337–344 (2005).
20. Richardson, A. J. & Schoeman, D. S. Climate impact on plankton ecosystems in the northeast Atlantic. Science 305, 1609–1612
(2004).
21. Suikkanen, S. et al. Climate change and eutrophication induced shifts in northern summer plankton communities. PLoS ONE 8,
e66475 (2013).
22. Wiafe, G., Yaqub, H. B., Mensah, M. A. & Frid, C. L. J. Impact of climate change on long-term zooplankton biomass in the upwelling
region of the Gulf of Guinea. ICES J. Mar. Sci. 65, 318–324 (2008).
23. Reid, P. C., Colebrook, J. M., Matthews, J. B. L. & Aiken, J. The Continuous Plankton Recorder: Concepts and history, from Plankton
Indicator to undulating recorders. Prog. Oceanogr. 58, 117–173 (2003).
Scientific Reports | (2021) 11:3707 | https://doi.org/10.1038/s41598-021-82825-w 12
Vol:.(1234567890)www.nature.com/scientificreports/
24. Edwards, M. et al. Plankton, jellyfish and climate in the North-East Atlantic. MCCIP Sci. Rev. 2020, 322–353. https://doi.
org/10.14465/2020.arc15.plk (2020).
25. ICES. Report of the Working Group on the Celtic Seas Ecoregion (WGCSE), 11–19 May 2011, Copenhagen, Denmark. (2011).
26. Bartolino, V. et al. Herring assessment working group for the area south of 62° N (HAWG). (2019) https://doi.org/10.17895/ices.
pub.5460.
27. ICES Advice Book 5. https://www.ices.dk/sites/pub/Publication%20Reports/Advice/2007/may/her-nirs.pdf (2007).
28. Beaugrand, G. The North Sea regime shift: Evidence, causes, mechanisms and consequences. Prog. Oceanogr. 60, 245–262 (2004).
29. Gregory, B., Christophe, L. & Martin, E. Rapid biogeographical plankton shifts in the North Atlantic Ocean. Glob. Change Biol.
15, 1790–1803 (2009).
30. deYoung, B. et al. Regime shifts in marine ecosystems: Detection, prediction and management. Trends Ecol. Evol. 23, 402–409
(2008).
31. Bastian, T. et al. Large-scale sampling reveals the spatio-temporal distributions of the jellyfish Aurelia aurita and Cyanea capillata
in the Irish Sea. Mar. Biol. 158, 2639–2652 (2011).
32. Houghton, J. D. R., Doyle, T. K., Davenport, J. & Hays, G. C. Developing a simple, rapid method for identifying and monitoring
jellyfish aggregations from the air. Mar. Ecol. Prog. Ser. 314, 159–170 (2006).
33. Bastian, T., Lilley, M. K. S., Beggs, S. E., Hays, G. C. & Doyle, T. K. Ecosystem relevance of variable jellyfish biomass in the Irish
Sea between years, regions and water types. Estuar. Coast. Shelf Sci. 149, 302–312 (2014).
34. Heckerman, D., Geiger, D. & Chickering, D. M. Learning Bayesian networks: The combination of knowledge and statistical data.
Mach. Learn. 20, 197–243 (1995).
35. Milns, I., Beale, C. M. & Smith, V. A. Revealing ecological networks using Bayesian network inference algorithms. Ecology 91,
1892–1899 (2010).
36. Mitchell, E. G. & Neutel, A.-M. Feedback spectra of soil food webs across a complexity gradient, and the importance of three-
species loops to stability. Theor. Ecol. 5, 153–159 (2012).
37. Olff, H. et al. Parallel ecological networks in ecosystems. Philos. Trans. R. Soc. B Biol. Sci. 364, 1755–1779 (2009).
38. Mitchell, E. G., Whittle, R. & Griffths, H. J. Benthic ecosystem cascade effects in Antarctica using Bayesian network inference.
Commun. Biol. 3, 582 (2020).
39. Yu, J., Smith, V. A., Wang, P. P., Hartemink, A. J. & Jarvis, E. D. Advances to Bayesian network inference for generating causal
networks from observational biological data. Bioinformatics 20, 3594–3603 (2004).
40. Yu, J., Smith, V. A., Wang, P. P., Hartemink, E. J. & Jarvis, E. D. Using Bayesian network inference algorithms to recover molecular
genetic regulatory networks. In Prof. of Int. (2002).
41. Smith, V. A., Yu, J., Smulders, T. V., Hartemink, A. J. & Jarvis, E. D. Computational inference of neural information flow networks.
PLOS Comput. Biol. 2, e161 (2006).
42. Mitchell, E. G. & Butterfield, N. J. Spatial analyses of Ediacaran communities at Mistaken Point. Paleobiology 44, 40–57 (2018).
43. Mitchell, E. G., Durden, J. M. & Ruhl, H. A. First network analysis of interspecific associations of abyssal benthic megafauna reveals
potential vulnerability of abyssal hill community. Prog. Oceanogr. 187, 102401 (2020).
44. Mitchell, E. G. & Harris, S. Mortality, population and community dynamics of the glass sponge dominated community “The Forest
of the Weird” from the RIDGE seamount, Johnston Atoll, Pacific Ocean. Front. Mar. Sci. 7, 872 (2020).
45. Reid, P. C., Borges, M. D. F. & Svendsen, E. A regime shift in the North Sea circa 1988 linked to changes in the North Sea horse
mackerel fishery. Fish. Res. 50, 163–171 (2001).
46. Brierley, A. S. et al. Acoustic observations of jellyfish in the Namibian Benguela. Mar. Ecol. Prog. Ser. 210, 55–66 (2001).
47. Brierley, A. S. et al. Towards the acoustic estimation of jellyfish abundance. Mar. Ecol. Prog. Ser. 295, 105–111 (2005).
48. MacLennan, D. N. & Simmonds, E. J. Fisheries Acoustics (Springer, Berlin, 2013).
49. Planque, B. & Fromentin, J. Calanus and environment in the eastern North Atlantic. I. Spatial and temporal patterns of C. finmar-
chicus and C. helgolandicus. Mar. Ecol. Prog. Ser. 134, 101–109 (1996).
50. Batten, S. D. et al. CPR sampling: The technical background, materials and methods, consistency and comparability. Prog. Oceanogr.
58, 193–215 (2003).
51. Richardson, A. J. et al. Using continuous plankton recorder data. Prog. Oceanogr. 68, 27–74 (2006).
52. John, E. H. et al. Continuous plankton records stand the test of time: Evaluation of flow rates, clogging and the continuity of the
CPR time-series. J. Plankton Res. 24, 941–946 (2002).
53. Beaugrand, G., Ibañez, F., Lindley, J. A. & Reid, P. C. Diversity of calanoid copepods in the North Atlantic and adjacent seas: Spe-
cies associations and biogeography. Mar. Ecol. Prog. Ser. 232, 179–195 (2002).
54. Yu, J. Developing Bayesian Network Inference Algorithms to Predict Causal Functional Pathways in Biological Systems (Duke Uni-
versity, Durham, 2005).
55. Chickering, D. M. Learning Bayesian Networks is NP-Complete. In Learning from Data: Artificial Intelligence and Statistics V (eds.
Fisher, D. & Lenz, H.-J.) 121–130 (Springer, Berlin, 1996). https://doi.org/10.1007/978-1-4612-2404-4_12.
56. Rayner, N. A. et al. Global analyses of sea surface temperature, sea ice, and night marine air temperature since the late nineteenth
century. J. Geophys. Res. Atmos. 108, (2003).
57. Jones, P. D., Jonsson, T. & Wheeler, D. Extension to the North Atlantic oscillation using early instrumental pressure observations
from Gibraltar and south-west Iceland. Int. J. Climatol. 17, 1433–1450 (1997).
58. Mitchell, E. G. Functional programming through deep time: Modeling the first complex ecosystems on earth. ACM SIGPLAN Not.
46, 28–31 (2011).
59. Jones, S. P. Haskell 98 Language and Libraries: The Revised Report (Cambridge University Press, Cambridge, 2003).
60. Friedman, N., Geiger, D. & Goldszmidt, M. Bayesian network classifiers. Mach. Learn. 29, 131–163 (1997).
61. Dickey-Collas, M., Nash, R. D. M. & Brown, J. The location of spawning of Irish sea herring (Clupea harengus). J. Mar. Biol. Assoc.
81, 713–714 (2001).
62. Nash, R. D. M. & Geffen, A. J. Seasonal and interannual variation in abundance of Calanus finmarchicus (Gunnerus) and Calanus
helgolandicus (Claus) in inshore waters (west coast of the Isle of Man) in the central Irish Sea. J. Plankton Res. 26, 265–273 (2004).
63. Hurrell, J. W. & Deser, C. North Atlantic climate variability: The role of the North Atlantic Oscillation. J. Mar. Syst. 78, 28–41
(2009).
64. Brotz, L., Cheung, W. W. L., Kleisner, K., Pakhomov, E. & Pauly, D. Increasing jellyfish populations: trends in Large Marine Eco-
systems. In Jellyfish Blooms IV: Interactions with Humans and Fisheries (eds. Purcell, J. et al.) 3–20 (Springer Netherlands, 2012).
https://doi.org/10.1007/978-94-007-5316-7_2.
65. Purcell, J. E. Jellyfish and ctenophore blooms coincide with human proliferations and environmental perturbations. Annu. Rev.
Mar. Sci. 4, 209–235 (2012).
66. Pitt, K. A., Lucas, C. H., Condon, R. H., Duarte, C. M. & Stewart-Koster, B. Claims that anthropogenic stressors facilitate jellyfish
blooms have been amplified beyond the available evidence: A systematic review. Front. Mar. Sci. 5, 451 (2018).
67. Sanz-Martín, M. et al. Flawed citation practices facilitate the unsubstantiated perception of a global trend toward increased jellyfish
blooms. Glob. Ecol. Biogeogr. 25, 1039–1049 (2016).
68. Dunne, J. A., Williams, R. J. & Martinez, N. D. Network structure and biodiversity loss in food webs: Robustness increases with
connectance. Ecol. Lett. 5, 558–567 (2002).
Scientific Reports | (2021) 11:3707 | https://doi.org/10.1038/s41598-021-82825-w 13
Vol.:(0123456789)You can also read