Extracting Road Traffic Volume in the City before and during covid-19 through Video Remote Sensing
←
→
Page content transcription
If your browser does not render page correctly, please read the page content below
remote sensing
Article
Extracting Road Traffic Volume in the City before and during
covid-19 through Video Remote Sensing
Elżbieta Macioszek *              and Agata Kurek

                                          Department of Transport Systems, Traffic Engineering and Logistics, Faculty of Transport and Aviation
                                          Engineering, Silesian University of Technology, Krasińskiego 8 Street, 40-019 Katowice, Poland;
                                          agata.kurek@polsl.pl
                                          * Correspondence: elzbieta.macioszek@polsl.pl; Tel.: +48-32-603-41-50

                                          Abstract: Continuous, automatic measurements of road traffic volume allow the obtaining of in-
                                          formation on daily, weekly or seasonal fluctuations in road traffic volume. They are the basis for
                                          calculating the annual average daily traffic volume, obtaining information about the relevant traffic
                                          volume, or calculating indicators for converting traffic volume from short-term measurements to
                                          average daily traffic volume. The covid-19 pandemic has contributed to extensive social and eco-
                                          nomic anomalies worldwide. In addition to the health consequences, the impact on travel behavior
                                          on the transport network was also sudden, extensive, and unpredictable. Changes in the transport
                                          behavior resulted in different values of traffic volume on the road and street network than before.
                                          The article presents road traffic volume analysis in the city before and during the restrictions related
                                          to covid-19. Selected traffic characteristics were compared for 2019 and 2020. This analysis made it
                                          possible to characterize the daily, weekly and annual variability of traffic volume in 2019 and 2020.
                                Moreover, the article attempts to estimate daily traffic patterns at particular stages of the pandemic.
                                   These types of patterns were also constructed for the weeks in 2019 corresponding to these stages of
Citation: Macioszek, E.; Kurek, A.        the pandemic. Daily traffic volume distributions in 2020 were compared with the corresponding ones
Extracting Road Traffic Volume in the     in 2019. The obtained results may be useful in terms of planning operational and strategic activities
City before and during covid-19           in the field of traffic management in the city and management in subsequent stages of a pandemic or
through Video Remote Sensing.             subsequent pandemics.
Remote Sens. 2021, 13, 2329. https://
doi.org/10.3390/rs13122329                Keywords: road traffic volume; traffic flow parameters; video detection; remote sensing data collecting;
                                          covid-19 time
Academic Editors: Biswajeet Pradhan
and Chengbin Deng

Received: 8 April 2021
                                          1. Introduction
Accepted: 11 June 2021
Published: 14 June 2021
                                                The Highway Capacity Manual [1] usually distinguishes between volume and flow
                                          rate to measure the number of vehicles passing over a given point or section of a lane during
Publisher’s Note: MDPI stays neutral
                                          a given time interval. Volume is the number of vehicles that pass a point for one hour [1–4].
with regard to jurisdictional claims in
                                          Flow rate denotes the number of vehicles that pass a point through a time interval of less
published maps and institutional affil-   than 1 h (usually 15 min) but expressed as an equivalent hourly rate. Another relevant
iations.                                  reference unit for road traffic analysis is the day or the average daily traffic, which is the
                                          ratio between the total volume and the duration (in days) of the analysis.
                                                Cyclicality and periodicity should be taken into account when planning the dates and
                                          duration of traffic evaluation and analysis. Traffic research should be conducted on average
Copyright: © 2021 by the authors.
                                          working days such as Tuesday, Wednesday, and Thursday and average months such as
Licensee MDPI, Basel, Switzerland.
                                          March, May, June, September, and October. This selection of measuring periods makes it
This article is an open access article
                                          possible to avoid the traffic peaks corresponding to weekends and holidays.
distributed under the terms and                 It can also cover different periods, e.g., 1 h, 4 h, 12 h, 16 h, etc. Traffic volume
conditions of the Creative Commons        measurement can take place at both nodes (e.g., intersections) and network base at a
Attribution (CC BY) license (https://     different scale (e.g., area, city, region). The smaller the area, the more important it is to
creativecommons.org/licenses/by/          measure variability over the day. Traffic measurements and studies are useful to examine
4.0/).                                    temporal and spatial variability, the traffic split along with the two directions, and the

Remote Sens. 2021, 13, 2329. https://doi.org/10.3390/rs13122329                                       https://www.mdpi.com/journal/remotesensing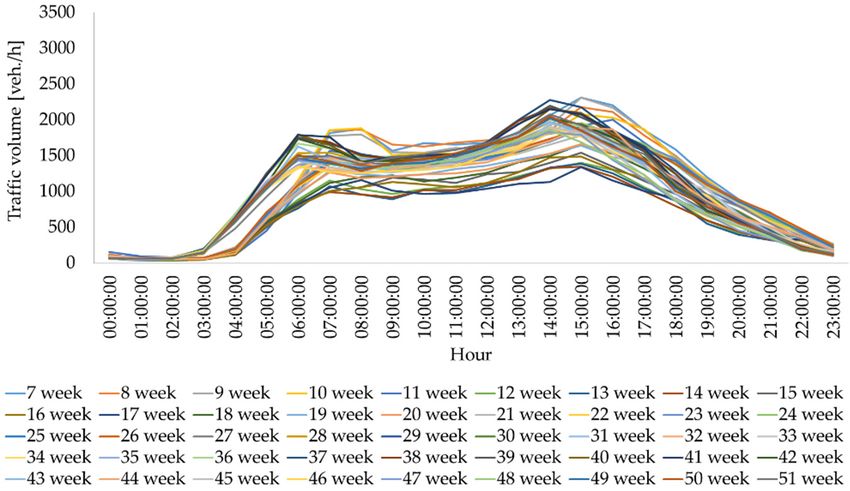
Remote Sens. 2021, 13, 2329                                                                                            2 of 38

                              generic structure of traffic. They are also useful for designing infrastructure as well as
                              regulation strategies. The systematic observation of traffic volume over the years has
                              identified cyclicity patterns under certain conditions. They allowed for some forms of
                              transferability of the results in time and space.
                                   Traffic volume measurements can be carried out by various methods [5–10]:
                              •    manual measurement methods: this is the simplest and most common method that
                                   consists of registering each participant of the traffic passing the road section per unit
                                   time by using manual recording on forms or mechanical or electronic tools,
                              •    automatic measurement methods: consisting of automatic recognition and registration
                                   of passing participants of the traffic by using counters activated by detection loops,
                                   photoelectric sensors, radar sensors, and video detection. Video detection is widely
                                   used in field research. Modern traffic monitoring systems are often part of the area-
                                   based Intelligent Transport Systems (ITS). They can also classify vehicles and collect
                                   information about the speed of vehicles and the time gaps between them.
                                    Major roads in many developed countries are now equipped with automated traffic
                              counters, tolling systems, and other technologies. These technologies can deliver regular
                              and reliable data on daily road traffic volume. The availability of such data for secondary
                              and tertiary routes is limited in most countries [11–17].
                                    The covid-19 pandemic changed the lives of almost all people around the world. Cases
                              of infection with the SARS-CoV-2 virus were also recorded in Poland from 4 March 2020.
                              A timeline (Figure 1) presents the chronology of the implementation of legal regulations
                              in Poland in connection with the increase in the number of SARS-CoV-2 infections in
                              2020. On the first days of week 11 of 2020 (i.e., from 12 to 15 March), restrictions were
                              introduced, such as: suspension of stationary classes in nurseries, kindergartens, children’s
                              clubs, schools, and public and private educational institutions (12 March); closing of
                              restaurants, bars, cinemas, theaters, museums, art galleries, libraries, gyms, fitness clubs,
                              hotels, shops in shopping centers, excluding grocery stores, pharmacies, drugstores and
                              laundries (14 March); and closing borders to foreigners (15 March).
                                    In Poland, the state of epidemic emergency was declared in the 12th week of 2020
                              (20 March), which was also the first full week of lockdown. The number of people in public
                              transport vehicles was reduced to half the number of seats in the 13th week of 2020, to
                              prevent the spread of the SARS-CoV-2 virus. Further restrictions were introduced, i.e.,
                              closure of hairdressing and beauty salons, rehabilitation centers, independent health care
                              facilities, and hotels in the 14th week of 2020, due to the worsening epidemic situation in the
                              country. No possibility of organizing mass cultural, sports, entertainment, and recreational
                              events, being on beaches and green areas, and using bike-sharing systems was introduced
                              on 1 April. A total lockdown was enforced in the country in the following weeks. Forest
                              access and recreation permits were issued in the 17th week of 2020. From the 19th week of
                              2020, hotels, libraries, museums, and art galleries (4 May) and cinemas, theaters, gyms, and
                              fitness clubs (6 May) reopened. Borders (13 May) were opened in the 20th week of 2020.
                              Shopping centers, hairdressing and beauty salons, bars, and restaurants were reopened in
                              the 21st week of 2020. Moreover, the number of passengers in public transport vehicles
                              was increased to 30% of all seats (18 May). Hotels opened in the 22nd week of 2020. The
                              summer vacation period came in Poland from the 23rd to the 32nd week of 2020. The
                              yellow zone for the analyzed area was introduced in the 32nd week of 2020. The beginning
                              of the autumn period and colder days contributed to a rapid increase in the number of
                              SARS-CoV-2 virus infections. This period was called the second wave of the epidemic. The
                              entire country was included in the red zone (24 October) in the 43rd week of 2020. The
                              functioning of many business entities, services, schools, and activities were suspended due
                              to the introduction of a red zone for the entire country. Classes in university, secondary
                              schools, and grades 4–8 in primary schools were conducted only in remote mode from the
                              43rd week of 2020. Additionally, activities were closed such as swimming pools, gyms,
                              fitness clubs, sports events without public spectators, sanatoriums, and restaurants, and
                              passengers in public transport vehicles were reduced to 50% of seats or 30% of all places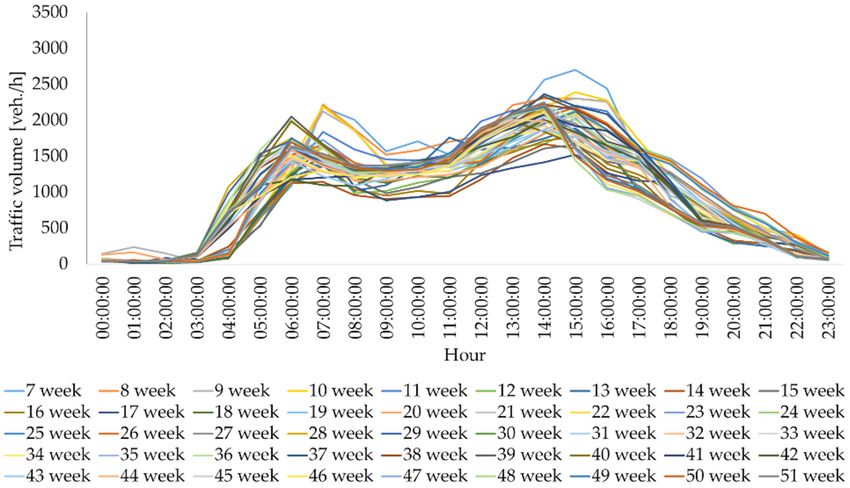
Remote Sens. 2021, 13, x FOR PEER REVIEW                                                                                   3 of 40
Remote Sens. 2021, 13, 2329                                                                                                     3 of 38

                                   sanatoriums, and restaurants, and passengers in public transport vehicles were reduced
                                   to 50% of seats or 30% of all places (sitting and standing). In the 44th week of 2020, ceme-
                                  (sitting and standing). In the 44th week of 2020, cemeteries were closed (30 October)
                                   teries were closed (30 October) because of the celebration of All Saints’ Day on 1 Novem-
                                  because of the celebration of All Saints’ Day on 1 November, which usually gathers many
                                   ber, which usually gathers many people in cemeteries.
                                  people in cemeteries.

      Figure 1. Timeline for legal regulations introduced in Poland in 2020 due to the increase in the number of SARS-CoV-2
      virus infections [18–26]. Solid line indicates the introduction of the selected restrictions, and the dashed line means the
      withdrawal of the selected restrictions.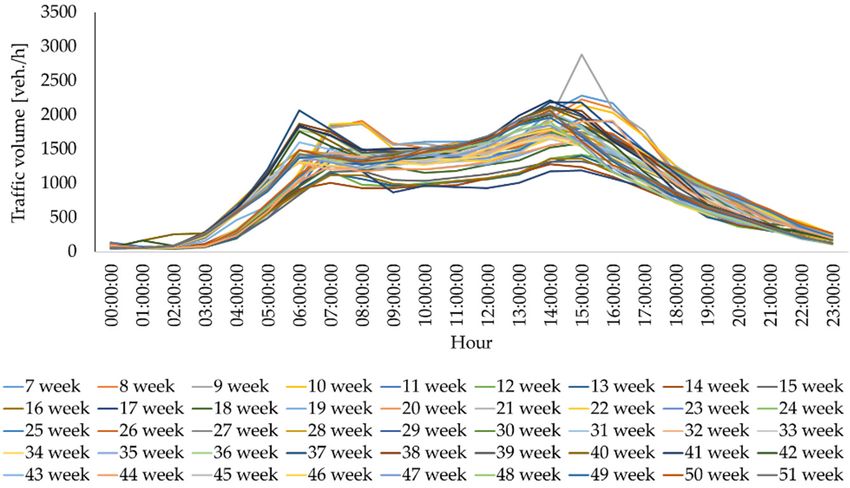
Remote Sens. 2021, 13, 2329                                                                                            4 of 38

                                    In the 45th week of 2020, cemeteries were open (3 November). Classes in grades 1–3
                              of primary schools were suspended due to the increasing number of SARS-CoV-2 virus
                              infections. Activities were suspended, such as: shopping centers (except grocery stores,
                              pharmacies, drugstores, and laundries), hotels (except for business trips), cinemas, theaters,
                              and museums in the 46th week of 2020. Shopping centers (29 November) were reopened
                              in the 48th week of 2020, in connection with the approaching Christmas season. After
                              Christmas (53rd week of 2020) such activities were closed as: shopping centers (except
                              for grocery stores, pharmacies, drugstores, and laundries), sports facilities and ski slopes,
                              gyms, fitness clubs, and restaurants.
                                    So far, research works in the area of monitoring changes caused by covid-19 in the
                              characteristics of road traffic flows have also been published. The covid-19 pandemic has
                              significantly influenced almost every aspect of daily life, including traffic flow parameters.
                              Thus, it is important to measure the impact of covid-19 on traffic flow parameters to
                              properly respond to changes in traffic patterns. Initially, the published works concerned
                              changes in the characteristics of traffic flow in the city of Wuhan in China and modeling
                              the relationship between outbound traffic from Wuhan and coronavirus disease incidences
                              (e.g., [27]). In addition, works were related to the capability of SAR StripMap imaging
                              mode data to monitoring traffic volume on the bridges crossing the Yangtze river in
                              Wuhan [28]. These works related to the analysis of road traffic characteristics in various
                              places around the world affected by covid-19, e.g., USA (e.g., [29,30]) andItaly (e.g., [31]).
                              The research also covered travel behavior before and during restrictions related to covid-19
                              in the USA [32]. However, so far, no studies have been published that analyzed the traffic
                              flow characteristics in Polish cities before and during different stages of restrictions related
                              to covid-19, according to the authors’ knowledge. Hence, there is a need to identify and
                              systematize this type of change in Polish conditions. Therefore, the aim of the article is road
                              traffic volume analysis in the selected city located in Poland before and during restrictions
                              related to covid-19. The research questions are as follows: how have road traffic volume
                              values changed in the selected intersections in the city before and during the restrictions
                              related to covid-19? What are the differences between daily traffic volume distributions on
                              the selected intersections in the city in 2020 and in 2019?
                                    The article consists of seven sections. After the introduction section, the materials and
                              methods are described, which are used in the analysis. In the next section, the characteristics
                              of daily, weekly, and annual variability of traffic volume in 2019 and 2020 in Gliwice
                              (Poland) are presented. After that, an attempt is made to estimate daily traffic patterns at
                              particular stages of the covid-19 pandemic. These types of patterns are also constructed
                              for the weeks in 2019 corresponding to these stages of the pandemic. The last two sections
                              contain a discussion on the obtained results and formulated conclusions.

                              2. Materials and Methods
                                   The main purpose of the study was road traffic volume analysis in the city before
                              and during restrictions related to covid-19. Data were obtained on traffic volume for the
                              analysis of road traffic volume distribution on selected intersections in 2019 and 2020 from
                              the Traffic Control Center (TCC) in Gliwice. The data included each day in 2019 and 2020
                              divided into 15-min intervals, taking into account the direction and structure of traffic,
                              along with the accuracy of the traffic lane.
                                   To characterize changes in the traffic volume values before and during restrictions
                              related to covid-19 for selected intersections, the following traffic characteristics were
                              compared for 2019 and 2020:
                              •    average traffic volume on working days in particular weeks of the year,
                              •    the total traffic volume on particular days of the week in particular months,
                              •    the distribution of total traffic volume on working days in particular weeks and the
                                   forecast traffic volume for 2020,
                              •    the distribution of total traffic volume in particular weeks and the forecast of traffic
                                   volume for 2020,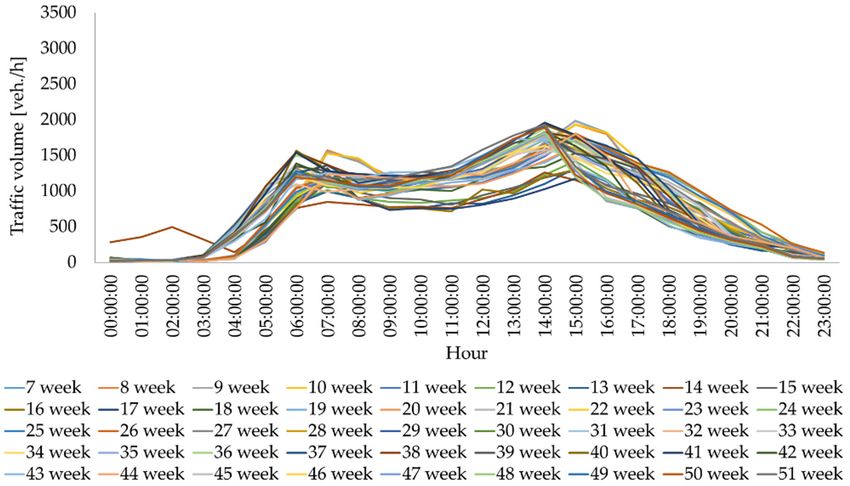
• the distribution of total traffic volume on working days in particular weeks and the
forecast traffic volume for 2020,
• the distribution of total traffic volume in particular weeks and the forecast of traffic
volume for 2020,
Remote Sens. 2021, 13, 2329 5 of 38
• road traffic variability factors in the following weeks of the year,
• road traffic variability factors for annual average daily traffic volume,
• the daily road traffic
• volume distribution in particular weeks.
road traffic variability factors in the following weeks of the year,
• from
Firstly, 24-h data roadMonday to Friday
traffic variability in for
factors particular weeksdaily
annual average were used
traffic for the aver-
volume,
• the daily road traffic volume distribution in particular
age traffic volume on working days in particular weeks of the year analysis. In further weeks.
analysis, public holidaysFirstly,
and 24-h
days data from Monday
before to Friday
and after publicin particular
holidaysweeks
werewerenotused
takenfor the average
into
traffic volume on working days in particular weeks of the year analysis. In further analysis,
account in the values of the average traffic volume in particular weeks.
public holidays and days before and after public holidays were not taken into account in
Eight signalizedtheintersections locatedtraffic
values of the average in the city in
volume ofparticular
Gliwice weeks.
were selected for further
analysis: (1) Andersa-Okulickiego;
Eight signalized(2) Kozielska-Okulickiego;
intersections located in the (3)cityOrlickiego-Portowa-Śli-
of Gliwice were selected for fur-
ther analysis: (1) Andersa-Okulickiego;
wki; (4) Orlickiego-Wyspiańskiego; (2) Kozielska-Okulickiego;
(5) Pszczyńska-Pocztowa; (3) Orlickiego-Portowa-
(6) Chorzowska-Knurow-
Śliwki; (4) Orlickiego-Wyspiańskiego; (5) Pszczyńska-Pocztowa; (6) Chorzowska-Knurowska;
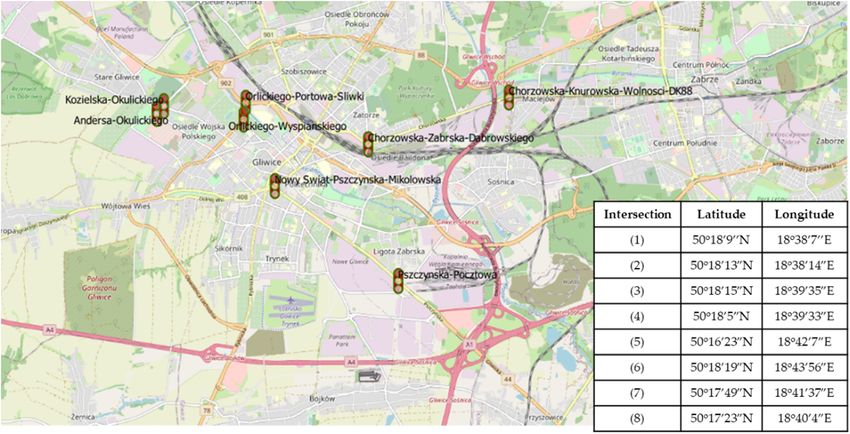
ska; (7) Chorzowska-Zabrska and (8) Nowy Świat-Pszczyńska-Mikołowska (Figure 2). All
(7) Chorzowska-Zabrska and (8) Nowy Świat-Pszczyńska-Mikołowska (Figure 2). All inter-
intersections are located
sections onare
important
located on roads, which
important roads,leading and discharging
which leading and discharging traffic
traffic flows
flows to and
to and from the cityfromcenter. These
the city intersections
center. are also
These intersections important
are also importantcommunication
communication junctions junc- in the
tions in the city transport system, serving significant traffic volume each day.
city transport system, serving significant traffic volume each day.
Figure
Figure 2. Localization
2. Localization of analyzed
of analyzed intersections
intersections in the background
in the background of the city
of the city of Gliwice. of Gliwice.
Source: Source:
Own research based on
Open
OwnStreet Map [33].
research based on Open Street Map [33].
The above-mentioned intersections are equipped with vehicle detection and traffic
The above-mentioned intersections
control systems, are equipped
video detection cameras,with
and vehicle
inductiondetection andaretraffic
loops, which part of the
control systems, video detection
Intelligent cameras,
Transport Systemand induction
in the loops,
city of Gliwice (ITSwhich
Gliwice).are part3 of
Figure the In-
presents schemes
of the analyzed intersections along with views from selected
telligent Transport System in the city of Gliwice (ITS Gliwice). Figure 3 presents schemes vehicle video detection
systems at the
of the analyzed intersections analyzed
along withintersections.
views fromTable 1 presents
selected the indication
vehicle of the week’s
video detection sys-number
in 2019 and 2020 used in further analysis. Some weeks of the year began in one month and
tems at the analyzedended
intersections.
the next.
Table 1 presents the indication of the week’s number
in 2019 and 2020 used in further analysis. Some weeks of the year began in one month and
ended the next.
In the analyzed period, there were missing data on hourly traffic volume for 795 days
(423 in 2019 and 372 in 2020) taking into account all analyzed intersections. Table 2 and
Table 3 present the number of days with missing or defective data in the particular months
of 2019 and 2020. These missing data were caused by system failure, induction loop fail-
ure, lack or interruption of power supply or inability to create a telecommunications con-
nection (modem connection) with the intersection controller, or weather conditions unfa-
vorable for the functioning of the system (heavy rainfall, snowfall, strong sunlight, etc.).
Missing data on the traffic volume of up to one hour a day were supplemented (i.e., de-
termined as average values from data from the neighboring hours). This assumption is a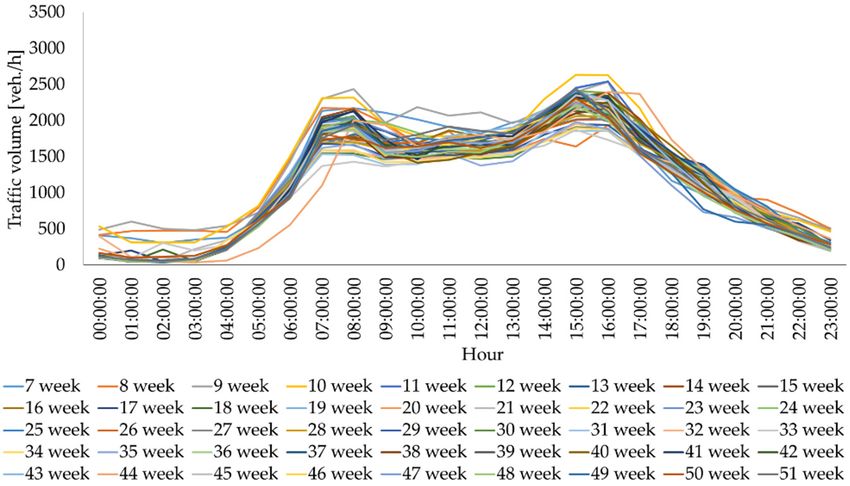
simplification, but using data from neighboring hours or hours from previous days allows
                                                              for the elimination of gross errors from the data. Days with such supplemented data were
                                                              treated as days with complete data. Missing data for more than one hour in a day was
                                                              considered as a lack of data for the entire day. There were also cases where the system
                                                              failed and recorded unrealistically low or high traffic volume (compared to hours and
Remote Sens. 2021, 13, 2329                                                                                                             6 of 38
                                                              days on other days). Such cases were found to be defective and were excluded from the
                                                              analysis. These days constitue from 12.88% to 16.16% of days in 2019 and from 8.74% to
                                                              15.85% of days in 2020.

                               (a)                           (b)                       (c)                          (d)
                               Latitude: 50°18′9″N                                     Latitude: 50°18′13″N
                               Longitude: 18°38′7″E                                    Longitude: 18°38′14″E

                               (e)                           (f)                       (g)                          (h)
                               Latitude: 50°18′15″N                                    Latitude: 50°18′5″N
                               Longitude: 18°39′35″E                                   Longitude: 18°39′33″E

                               (i)                           (j)                       (k)                          (l)
                               Latitude: 50°16′23″N                                    Latitude: 50°18′19″N
                               Longitude: 18°42′7″E                                    Longitude: 18°43′56″E

                               (m)                           (n)                       (o)                          (p)
                               Latitude: 50°17′49″N                                    Latitude: 50°17′23″N
                               Longitude: 18°41′37″E                                   Longitude: 18°40′4″E

                                   Figure 3. Analyzed intersections in Gliwice (a). scheme of intersection with marked locations of video detection zones at
                              Figure 3. Analyzed intersections in Gliwice (a). scheme of intersection with marked locations of video
                                   the inlets of Andersa-Okulickiego intersection; (b). view from selected traffic monitoring camera on Andersa-Okulickiego
                              detection zones at the inlets of Andersa-Okulickiego intersection; (b). view from selected traffic moni-
                              toring camera on Andersa-Okulickiego intersection; (c) scheme of intersection with marked locations
                              of video detection zones at the inlets of Kozielska-Okulickiego intersection; (d) view from selected traf-
                              fic monitoring camera on Kozielska-Okulickiego intersection; (e) scheme of intersection with marked
                              locations of video detection zones at the inlets of Orlickiego-Portowa-Śliwki intersection; (f) view
                              from selected traffic monitoring camera on Orlickiego-Portowa-Śliwki intersection; (g) scheme of
                              intersection with marked locations of video detection zones at the inlets of Orlickiego-Wyspiańskiego
                              intersection; (h) view from selected traffic monitoring camera on Orlickiego-Wyspiańskiego inter-
                              section; (i) scheme of intersection with marked locations of video detection zones at the inlets of
                              Pszczyńska-Pocztowa intersection; (j) view from selected traffic monitoring camera on Pszczyńska-
                              Pocztowa intersection; (k) scheme of intersection with marked locations of video detection zones at
                              the inlets of Chorzowska-Knurowska intersection; (l) view from selected traffic monitoring camera
                              on Chorzowska-Knurowska intersection; (m) scheme of intersection with marked locations of video
                              detection zones at the inlets of Chorzowska-Zabrska intersection; (n) view from selected traffic moni-
                              toring camera on Chorzowska-Zabrska intersection; (o) scheme of intersection with marked locations
                              of video detection zones at the inlets of Nowy Świat-Pszczyńska-Mikołowska intersection; (p) view
                              from selected traffic monitoring camera on Nowy Świat-Pszczyńska-Mikołowska intersection.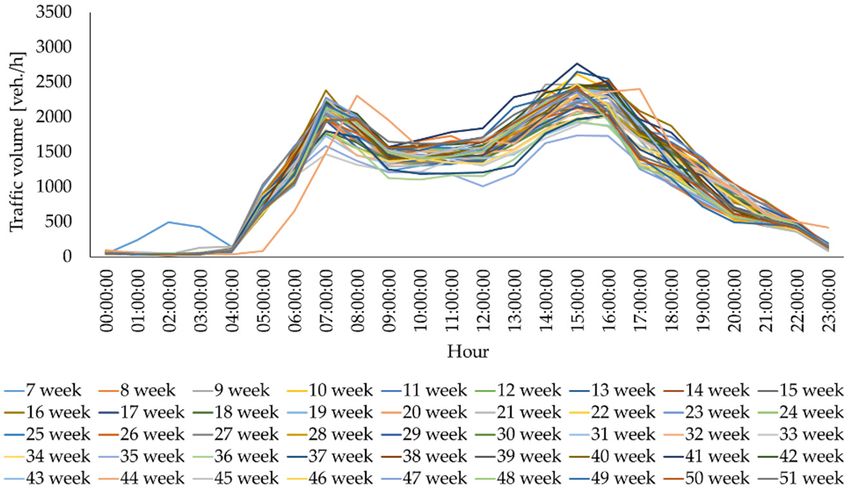
Remote Sens. 2021, 13, 2329                                                                                                             7 of 38

                                   Table 1. The week’s numbers in 2019 and 2020.

                                                                                               Week Numbers
                                               Month
                                                                              2019                                    2020
                                            February                          7, 8, 9                                 7, 8, 9
                                             March                       9, 10, 11, 12, 13                    9, 10, 11, 12, 13, 14
                                              April                    14, 15, 16, 17, 18                       14, 15, 16, 17, 18
                                              May                      18, 19, 20, 21, 22                       18, 19, 20, 21, 22
                                              June                      22, 23, 24, 25, 26                     23, 24, 25, 26, 27
                                              July                      27, 28, 29, 30, 31                      27, 28, 29, 30, 31
                                             August                     31, 32, 33, 34, 35                    31, 32, 33, 34, 35, 36
                                           September                  35, 36, 37, 38, 39, 40                    36, 37, 38, 39, 40
                                            October                     40, 41, 42, 43, 44                      40, 41, 42, 43, 44
                                           November                     44, 45, 46, 47, 48                    44, 45, 46, 47, 48, 49
                                           December                       48, 49, 50, 51                            49, 50, 51

                                        In the analyzed period, there were missing data on hourly traffic volume for 795 days
                                   (423 in 2019 and 372 in 2020) taking into account all analyzed intersections. Tables 2 and 3
                                   present the number of days with missing or defective data in the particular months of 2019
                                   and 2020. These missing data were caused by system failure, induction loop failure, lack
                                   or interruption of power supply or inability to create a telecommunications connection
                                   (modem connection) with the intersection controller, or weather conditions unfavorable
                                   for the functioning of the system (heavy rainfall, snowfall, strong sunlight, etc.). Missing
                                   data on the traffic volume of up to one hour a day were supplemented (i.e., determined as
                                   average values from data from the neighboring hours). This assumption is a simplification,
                                   but using data from neighboring hours or hours from previous days allows for the elimina-
                                   tion of gross errors from the data. Days with such supplemented data were treated as days
                                   with complete data. Missing data for more than one hour in a day was considered as a
                                   lack of data for the entire day. There were also cases where the system failed and recorded
                                   unrealistically low or high traffic volume (compared to hours and days on other days).
                                   Such cases were found to be defective and were excluded from the analysis. These days
                                   constitue from 12.88% to 16.16% of days in 2019 and from 8.74% to 15.85% of days in 2020.

                                   Table 2. The number of days with missing or defective data in 2019.

                                                                                                            Total             Data
  Intersection        I       II   III    IV     V     VI     VII   VIII     IX       X        XI   XII   in 2019          Completeness
                                                                                                           [days]             [%]
       (1)           31       1    1      2       1     4      1      3       1       1         1    1          48              13.15
       (2)           31       4    0      2       3     1      3      2       2       1         2    8          59              16.16
       (3)           31       3    5      1       2     1      0      2       1       4         3    2          55              15.07
       (4)           31       6    1      1       0     3      1      2       1       3         6    3          58              15.89
       (5)           31       2    0      3       2     0      0      1       4       2         2    1          48              13.15
       (6)           31       5    2      1       3     2      1      4       2       1         1    1          54              14.79
       (7)           31       0    2      1       3     4      2      0       1       0         2    1          47              12.88
       (8)           31       2    3      2       4     4      3      1       1       0         1    2          54              14.79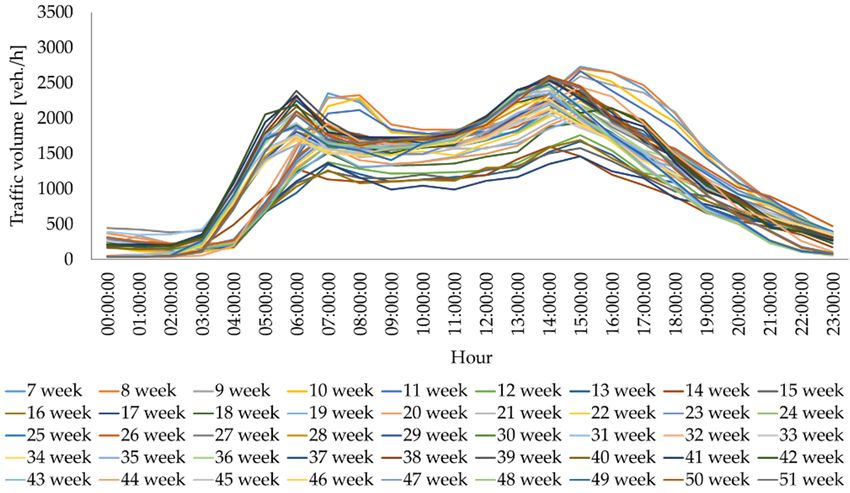
Remote Sens. 2021, 13, 2329                                                                                                          8 of 38

                                   Table 3. The number of days with missing or defective data in 2020.

                                                                                                                  Total      Data
  Intersection        I       II   III    IV     V     VI     VII   VIII         IX          X   XI     XII     in 2020   Completeness
                                                                                                                 [days]      [%]
       (1)            2       1    14     4      2      7     10      5          4           6   2          1     58         15.85
       (2)            3       0     2     8      7      4     3       6          2           1   7          2     45         12.30
       (3)            4       6     2     2      1      2     7       8          3           2   0          5     42         11.48
       (4)           21       2     0     1      2      3      2      8          7           3   7          0     56         15.30
       (5)           16       2     1     0      3      9      3      4          3           1   4          2     48         13.11
       (6)            2       1     3     2      1      2     1       9          4           1   0          6     32         8.74
       (7)            4       7     2     1      1      0     6       8          4           3   1          1     38         10.38
       (8)           11       2     2     7      4      3      2      6          2           2   3          9     53         14.48

                                          The missing data were supplemented based on the conclusions from the litera-
                                    ture [34–36]. The detected missing data was corrected using a weighted moving average
                                    method. The value of the predicted variable is determined as the weighted average of the
                                    last k real implementations of this variable, i.e., the last k elements of the time series [37]:

                                                                                       k
                                                                           ytF =      ∑ wi · yi+(n−k)                                   (1)
                                                                                      i =1

                                   where:
                                       ytF —forecast of the variable Y determined for the moment or period t,
                                       yt —the value of the variable Y as per moment or period t,
                                       k—smoothing constant,
                                       w—weight assigned to observations,
                                       n—number of time series elements of the predicted variable Y.
                                       Positive weight values were adopted due to the aging of the data. Weights should
                                   sum up to one and fulfill the conditions according to the assumptions [37]:

                                                                           k
                                                                          ∑ wi = 1, 0 < wi ≤ 1                                          (2)
                                                                          i =1

                                         Appropriate values of particular weights were selected iteratively based on minimiz-
                                    ing the mean square error of the forecast [38]:

                                                                                n                      2
                                                                        1
                                                                MSE =          ∑
                                                                      n − k t = k +1
                                                                                     yt − ytF → min                                     (3)

                                          The characteristics and features of road traffic were tested with the use of digital
                                    cameras. This method is classified as a passive remote sensing tool. Research with the use
                                    of digital cameras is characterized by very high measurement accuracy [39,40]. Moreover,
                                    this method is often used for the spatial-temporal analysis of traffic patterns [41] or road
                                    traffic density estimation [42]. It is often used for data collection in road traffic analyses
                                    due to its advantages [43,44].

                                    3. Characteristics of Weekly and Annual Variability of Traffic Volume in 2019 and 2020
                                         In the first stage of the work, the total traffic volume at the analyzed intersections on
                                   particular days of the week, in particular months in 2019 and 2020, and AADT in 2019 and
                                   2020, was analyzed (Figure 4). In Figure 4, the solid line marks the data from 2019, while
                                   the dashed line marks the data from 2020. On working days (from Monday to Friday) the
                                   values of traffic volume are at a similar level in all months of 2019 and 2020, with slight
                                   fluctuations on particular days of the week. On weekend days (Saturday and Sunday) there
                                   is a significant decrease in traffic volume compared to the values recorded on working days.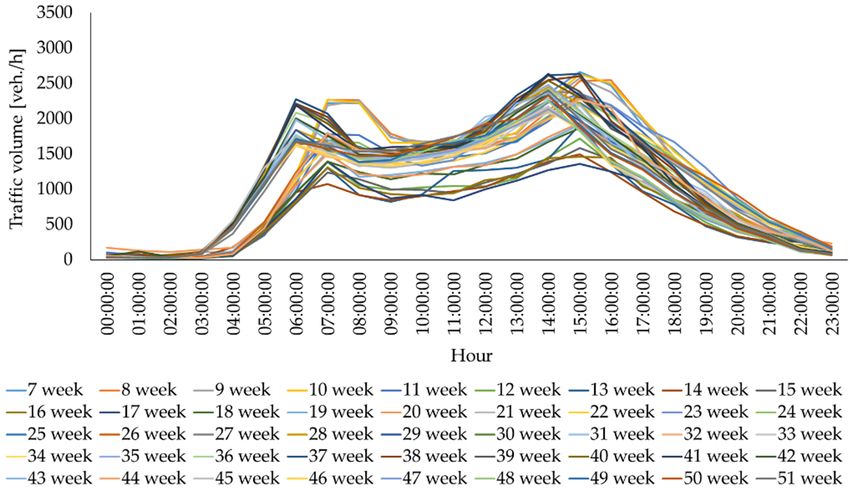
Remote Sens. 2021, 13, 2329 9 of 38
x FOR PEER REVIEW 9 of 40
The obtained results confirm the correctness of the cities observed on the road network,
which is also confirmed in the literature on the subject [45–48].
Figure 4. The total traffic volume at the analyzed intersections on particular days of the week in particular months in 2019
Figure 4. The total traffic volume at the analyzed intersections on particular days of the
and 2020.
week in particular months in 2019 and 2020.
The total traffic volume on particular days of the week in particular months in 2020
The total trafficwas
volume
lower onthanparticular days
in 2019 in all casesofdue
thetoweek in particular
the covid-19 pandemic. months
AADT in 2020
2020was as
was lower than in 2019 in all cases due to the covid-19 pandemic. AADT in 2020 was February,
much as 19% lower than AADT in 2019. In 2019, the values of traffic volume in as
July, and August were lower than the AADT value. This is due to the winter holidays
much as 19% lower than AADT in 2019. In 2019, the values of traffic volume in February,
(February) and summer holidays (July and August) in these months in Poland. In the case
July, and August were lower
of 2020, than the
the lowest AADT
values value.
of traffic volume This
wereisrecorded
due to inthe winter
March holidays
and April. The traffic
(February) and summer volumeholidays
is indeed(July and August)
a random invalue
variable, the theseofmonths
which is in Poland.byInmany
influenced the case
factors, but
of 2020, the lowest values of trafficcase
in the analyzed volume were
the main recorded
determinant of in
lowMarch and April.
traffic volume in theThe traffic
above-mentioned
months was the first wave of the covid-19 pandemic.
volume is indeed a random variable, the value of which is influenced by many factors,
The traffic forecast for 2020 was determined for the analyzed intersections based on
but in the analyzed thecase the main determinant of low traffic volume in the above-men-
data on traffic volume in 2019. The indicator annual percentage increase in road traffic
tioned months was the first(WR)
volume wave was ofused
the for
covid-19 pandemic.
this purpose [49]:
The traffic forecast for 2020 was determined for the analyzed intersections based on
GDP · We
the data on traffic volume in 2019. The indicator WR = annual
Q2019 · percentage
1+ increase
[%] in road traffic (4)
100
volume (WR) was used for this purpose [49]:
where:
GDP
WR—annual percentage ⋅ We in road traffic volume [%],
increase
WR =—traffic
Q2019 Q2019 ⋅ volume
1 + in 2019, [%] (4)
100
GDP—gross domestic product (for Gliwice city for 2020 according to [49] GDP = 3.1%),
We—flexibility factor; for passenger cars in 2016–2040. According to [49] We = 0.8.
where:
Figure 5 presents the distribution of total road traffic volume on working days in
WR—annual percentage increase
particular weeks in and
in 2019 road2020
traffic volume
and the [%],
forecast traffic volume for 2020 at all analyzed
Q2019—traffic volume in 2019,
intersections. The highest values of traffic volume in 2019 occurred at intersections (3),
(4), and (6).
GDP—gross domestic On the other
product hand, in 2020,
(for Gliwice city the
forhighest values of traffic
2020 according volume
to [49] GDPoccurred
= at
intersections (3), (6), and (1). At intersections (2), and (5) were the lowest values of traffic
3.1%),
volume, both in 2019 and in 2020. The forecasting traffic volume for 2020 is on average 1%
We—flexibility higher
factor;than
for the
passenger cars in
traffic volume in 2016-2040.
2019. Only inAccording
a few cases,to the[49]
valueWeof=the
0.8.
forecast for
Figure 5 presents the distribution of total road traffic volume on working days
2020 is at a similar level as the actual values of traffic volume in 2020. The accuracy in of the
particular weeks in 2019 and
forecast 2020 and
of traffic volume thewas
forecast traffic
confirmed volume
for the forweek
following 2020numbers:
at all analyzed
intersections. The highest
• values of(1):
intersection traffic
8, 35,volume
38, in 2019 occurred at intersections (3), (4),
• intersection (2): 8,
and (6). On the other hand, in 2020, the highest values of traffic volume occurred at inter-
sections (3), (6), and (1). At intersections (2), and (5) were the lowest values of traffic vol-
ume, both in 2019 and in 2020. The forecasting traffic volume for 2020 is on average 1%
higher than the traffic volume in 2019. Only in a few cases, the value of the forecast for
2020 is at a similar level as the actual values of traffic volume in 2020. The accuracy of the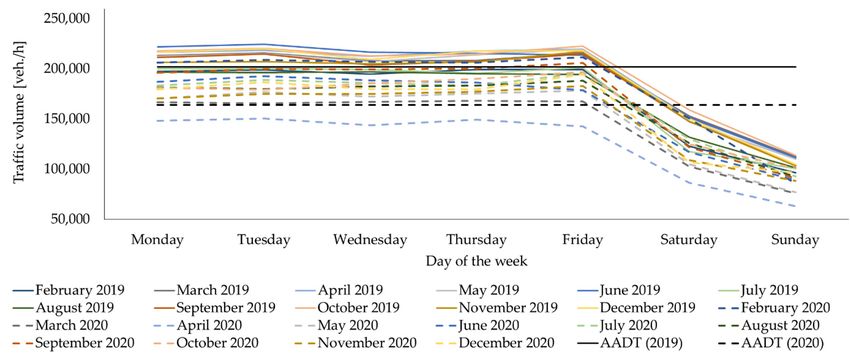
Remote Sens. 2021, 13, 2329                                                                                           10 of 38

                              •    intersection (3):   10, 27, 31, 36,
                              •    intersection (4):   9,
                              •    intersection (5):   8, 27, 29, 35, 36, 40,
                              •    intersection (8):   8, 31.
                                    The forecast of traffic volume did not confirm in any week in the case of intersections
                              (6) and (7). In 2020 the largest decrease in the value of traffic volume at all analyzed
                              intersections occurred in the 12th –17th weeks compared to 2019.
                                    At a later stage of the work, changes in the values of traffic volume in subsequent
                              stages of the pandemic were analyzed (Figure 5). In Poland, the state of the epidemic
                              was introduced on 20 March 2020, i.e., in the 12th week of the year. On 4 May 2020
                              (19th week), some retail and service outlets resumed their activities. A gradual increase in
                              the value of traffic volume at all analyzed intersections occurred from the 19th week. From
                              1 September 2020, children returned to school for full-time education. From 1 October 2020,
                              students began learning in a hybrid form, i.e., some classes were conducted in person,
                              e.g., laboratories, projects, and exercises, and some in a remote form, e.g., lectures. During
                              this period, there was also a noticeable further increase in traffic volume on the transport
                              network (these are the 36th and 40th week of the year, respectively). From 23 October
                              2020 (43rd week), children and students resumed remote classes due to the constantly
                              increasing number of new SARS-CoV-2 infections. The value of traffic volume on the
                              transport network decreased from the 43rd week of 2020. The presented course of the
                              restrictions introduced is reflected in changes in the value of traffic volume on the transport
                              network. At all analyzed intersections (except intersections (6) and (7)), until the 8th week
                              of the year, traffic volume in 2020 was higher than in 2019. Traffic volume decreased from
                              the 9th to the 14th week of 2020 (and in the case of intersection (2) in the 13th week). Then,
                              at all analyzed intersections, except intersection (5), traffic volume increased and fluctuated
                              in the 21st–34th weeks. The traffic volume increased from the 35th week.
                                    Then, depending on the intersection, traffic volume decreased again until the end of
                              the year:
                              •    intersection (1):   19th week of 2020,
                              •    intersection (2):   41st week of 2020,
                              •    intersection (3):   43rd week of 2020,
                              •    intersection (4):   42nd week of 2020,
                              •    intersection (6):   44th week of 2020,
                              •    intersection (7):   42nd week of 2020,
                              •    intersection (8):   42nd week of 2020.
                                    In the case of intersection (5), from the 14th to the 27th week of 2020, the value of
                              traffic volume increased, and then, by the 40th week of 2020, the value of traffic volume
                              was at a similar level as in 2019. From the 42nd week of 2020, traffic volume continued to
                              decrease until the end of the year.
                                    An important element of the analysis of the variability of traffic volume is the charac-
                              teristic of their increase or decrease in the subsequent weeks of the year to AADT (Table 4).
Remote Sens. 2021, 13, 2329 11 of 38
(a)
(b)
Figure 5. Cont.Remote Sens. 13, 2329
2021,Sens.
Remote 2021, 13, x FOR PEER REVIEW 2 of 41 12 of 38
(c)
(d)
Figure 5. Cont.Remote Sens. 2021, 13, 2329 13 of 38
Remote Sens. 2021, 13, x FOR PEER REVIEW 3 of 41
(e)
(f)
Figure 5. Cont.Remote Sens. 2021, 13, 2329 14 of 38
Remote Sens. 2021, 13, x FOR PEER REVIEW 4 of 41
(g)
(h)
FigureFigure
5. The 5. The distribution
distribution of totalofroad
totaltraffic
road traffic
volumevolume in particular
in particular weeksweeks
in 2019inand2019 andand
2020 2020 and
the the forecast
forecast of roadoftraffic
road traffic
volume volume forat2020
for 2020 at intersections:
intersections: (a) Andersa-
(a) Andersa-Okulickiego;
Okulickiego; (b) Kozielska-Okulickiego; (c) Orlickiego-Portowa-Śliwki; (d) Orlickiego-Wyspiańskiego; (e) Pszczyńska-Pocztowa; (f) Chorzowska-Knurowska;
(b) Kozielska-Okulickiego; (c) Orlickiego-Portowa-Śliwki; (d) Orlickiego-Wyspiańskiego; (e) Pszczyńska-Pocztowa; (f) Chorzowska-Knurowska; (g) Chorzowska-Zabrska; (g) Chor-
(h) Nowy
zowska-Zabrska; (h) Nowy Świat-Pszczyńska-Mikołowska. Where: Q(i) in 2019—traffic volume [Veh./h] at the i-th intersection in 2019, Q(i) in 2020—traffic
Świat-Pszczyńska-Mikołowska. Where: Q(i) in 2019—traffic volume [Veh./h] at the i-th intersection in 2019, Q(i) in 2020—traffic volume [Veh./h] at the i-th intersection volume [Veh./h]in 2020,
at the i-th
Q(i)F—traffic intersection
volume forecastinin2020,
2020,Q(i)F—traffic
AADT (2019)—thevolume forecast
annual in 2020,
average AADT
daily (2019)
traffic —the
volume annual
in 2019, average
AADT daily traffic
(2020)—the volume
annual in 2019,
average dailyAADT
traffic(2020)
volume—the annual average
in 2020.
daily traffic volume in 2020.
In the case of intersection (5), from the 14th to the 27th week of 2020, the value of traffic volume increased, and then, by the 40th
week of 2020, the value of traffic volume was at a similar level as in 2019. From the 42nd week of 2020, traffic volume continued to
decrease until the end of the year.
An important element of the analysis of the variability of traffic volume is the characteristic of their increase or decrease in the
subsequent weeks of the year to AADT (Table 4).Remote Sens. 2021, 13, 2329 15 of 38
Table 4. Road traffic variability factors in the following weeks of the year.
Week The Road Traffic Variability Factors Week The Road Traffic Variability Factors
of the [%] of the [%]
Year (1) (2) (3) (4) (5) (6) (7) (8) Year (1) (2) (3) (4) (5) (6) (7) (8)
7 8.83 −4.02 3.93 −3.37 −0.01 −10.30 −0.48 5.96 30 −4.20 −4.57 −12.85 −16.82 −0.50 −18.33 −14.64 −6.78
8 5.76 −3.99 5.38 −5.44 0.51 −5.90 −2.67 3.66 31 −4.58 −2.74 −7.42 −11.80 2.87 −17.91 −12.71 −5.64
9 2.47 −4.87 4.76 −4.37 −3.82 −4.86 −0.35 3.17 32 −10.67 −9.53 −13.36 −18.22 −2.91 −19.66 −16.95 −9.08
10 2.28 −1.71 0.36 −3.62 2.13 −7.99 −3.00 1.28 33 −5.99 −4.11 −12.40 −17.61 −3.13 −20.68 −15.05 −6.65
11 0.54 −12.28 1.18 −15.60 −3.87 −3.93 −14.29 −7.70 34 −10.92 −8.52 −12.57 −18.10 −3.02 −20.00 −16.49 −8.15
12 −23.05 −31.54 −31.93 −42.86 −31.94 −25.27 −36.19 −34.00 35 −5.65 −4.01 −11.27 −12.51 3.41 −17.90 −12.82 −5.12
13 −20.01 −35.23 −35.91 −43.42 −34.93 −17.69 −36.96 −37.07 36 2.78 1.58 −3.09 −9.58 0.76 −12.41 −7.09 −1.91
14 −30.71 −28.99 −37.16 −46.88 −37.90 −29.49 −39.11 −36.75 37 0.14 0.97 1.29 −2.97 2.20 −8.44 −0.16 2.83
15 −22.12 −26.69 −34.36 −42.68 −28.49 −20.86 −33.52 −28.92 38 −1.43 2.07 1.79 −4.78 1.20 −7.19 −2.54 1.18
16 −23.63 −30.54 −34.67 −44.06 −22.79 −29.54 −35.13 −31.33 39 2.59 −3.79 1.69 −6.76 −0.23 −8.77 −4.67 −0.20
17 −26.24 −32.82 −38.67 −45.70 −32.87 −28.68 −37.74 −35.99 40 −7.81 −4.42 1.15 −6.74 −0.21 −9.98 −5.69 −0.86
18 −13.37 −15.78 −23.71 −32.38 −16.83 −22.74 −24.66 −23.07 41 −8.57 0.33 1.84 −7.37 1.59 −6.75 −3.66 0.61
19 −10.27 −13.21 −21.17 −29.46 −8.33 −21.36 −20.96 −19.17 42 −11.24 −12.08 −1.84 −13.06 1.57 −10.72 −9.15 −4.78
20 −11.19 −13.80 −18.89 −27.03 −7.21 −23.41 −21.56 −19.39 43 −14.38 −12.06 −11.94 −15.81 −5.85 −11.58 −11.47 −9.34
21 −3.21 −6.70 −14.81 −16.41 −3.15 −14.71 −15.54 −11.72 44 −9.90 −13.75 −11.17 −18.36 −6.26 −10.88 −14.57 −12.60
22 −4.53 −5.90 −13.71 −18.22 0.85 −17.22 −14.85 −10.21 45 −12.82 −14.41 −14.22 −22.00 −8.56 −14.99 −18.35 −13.31
23 −0.16 −4.36 −11.31 −10.77 1.10 −15.19 −13.11 −7.32 46 −17.02 −15.96 −18.18 −24.17 −15.34 −17.90 −21.20 −15.80
24 −2.42 −2.87 −12.66 −13.86 −0.31 −23.94 −12.74 −7.67 47 −11.26 −15.50 −14.54 −22.39 −3.20 −9.61 −19.07 −13.33
25 −4.57 −5.27 −9.73 −15.47 −1.86 −18.15 −13.64 −8.11 48 −11.51 −15.08 −14.26 −20.79 −5.92 −14.29 −17.98 −13.18
26 1.20 −0.67 −6.26 −11.67 3.25 −15.18 −10.37 −6.66 49 −8.73 −10.57 −12.66 −18.18 −6.34 −10.77 −15.16 −8.10
27 0.99 −3.48 −2.84 −7.37 10.26 −16.54 −10.40 −4.84 50 −9.98 −12.67 −7.34 −17.40 −9.03 −9.78 −13.77 −7.25
28 −0.04 −1.78 −8.57 −9.70 12.57 −13.59 −10.74 −4.10 51 −7.39 −6.65 −7.41 −14.55 −7.46 −9.96 −12.07 −4.02
29 −2.17 −3.17 −10.58 −14.31 1.93 −15.60 −14.75 −5.93Remote Sens. 2021, 13, 2329 16 of 38
The AADT value was adopted as the reference level from 2019 due to the specificity
of 2020. Hence, the variability of the value of traffic volume in the subsequent weeks of
2020 to the AADT from 2019 was determined using the formula:
Qi−2020 − AADT2019
V Ii = · 100 [%] (5)
AADT2019
where:
VIi —road traffic variability factor in the i-th week of the year [%],
Qi -2020 —road traffic volume in the i-th week of 2020 [Veh./h],
AADT2019 —the annual average daily traffic volume in 2019 [Veh./h].
The largest differences between the values of traffic volume and the AADT for 2019
occured in the weeks of partial and full lockdown based on the value of the road traffic
variability factor in the following weeks of the year. In the remaining cases, these differences
take small values.
For all analyzed intersections, the AADT variability factor for 2019–2020 was deter-
mined in the same way:
AADT2020 − AADT2019
V I AADT = · 100 [%] (6)
AADT2019
where:
VI—road traffic variability factor for AADT [%],
AADT2020 —the annual average daily traffic volume in 2020 [Veh./h],
AADT2019 —annual average daily traffic in 2019 [Veh./h].
Table 5 shows that, in all cases, a significant decrease in traffic volume is visible,
ranging from −9.68% to −23.05% depending on the intersection.
Table 5. Road traffic variability factor for AADT in 2019 and 2020.
Intersection (1) (2) (3) (4) (5) (6) (7) (8)
VIAADT [%] −19.63 −23.05 −21.86 −21.59 −9.68 −15.48 −18.68 −19.35
4. Characteristics of the Daily Variability of Traffic Volume in 2019 and 2020
The daily road traffic volume distribution in particular weeks in 2019 and 2020 were
examined (Figure 6) in the next step of the analysis. The road traffic volume distribution in
particular hours on working days usually shows certain patterns on specific types of roads.
Knowledge of the values of traffic volume during the day and their variability allows for the
determination of several measures and parameters assessing traffic conditions prevailing
on the elements of transport networks. Knowledge and understanding of changes in
the distribution of traffic volume during a day are crucial for many aspects of transport
engineering, such as road traffic control, road safety, and forecasting traffic volume. The
distribution of traffic volume in particular hours of the day is characterized by a smaller
spread of particular profiles per day in 2019, at all intersections, than in 2020. Moreover, in
2020, the morning and afternoon rush hours show a greater flattening than in 2019. In 2019,
the morning rush hours at intersections (1), (2), (4), (6) occurred from 06:00–07:00, while
at intersections (3), (5), (7), (8) from 06:00 to 08:00. In turn, the afternoon rush hours at all
analyzed intersections occurred between 14:00–17:00.Remote Sens. 2021, 13, x FOR PEER REVIEW 8 of 41
Remote Sens. 2021, 13, 2329 17 of 38
(a) (b)
(c) (d)
Figure 6. Cont.Remote Sens. 2021, 13, 2329 18 of 38
Remote Sens. 2021, 13, x FOR PEER REVIEW 9 of 41
(e) (f)
(g) (h)
Figure 6. Cont.Remote Sens. 2021, 13, 2329 19 of 38
Remote Sens. 2021, 13, x FOR PEER REVIEW 10 of 41
(i) (j)
(k) (l)
Figure 6. Cont.Remote Sens. 2021, 13, 2329 20 of 38
Remote Sens. 2021, 13, x FOR PEER REVIEW 11 of 41
(m) (n)
(o) (p)
Figure
Figure 6. The daily6.road
The traffic
daily road traffic
volume volume distribution
distribution in particular
in particular weeks at weeks at intersections
intersections in Gliwice
in Gliwice in (a) Andersa-Okulickiego
in (a) Andersa-Okulickiego intersection
intersection in (b)
in 2019; 2019; (b) Andersa-Okulickiego
Andersa-Okulickiego intersection in
intersection in 2020; (c)
2020; (c) Kozielska-Okulickiego Kozielska-Okulickiego
intersection intersection in 2019; (d) Kozielska-Okulickiego
in 2019; (d) Kozielska-Okulickiego intersection in 2020; (e) intersection in 2020; (e) Orlickiego-Portowa-Śliwki
Orlickiego-Portowa- Śliwki intersection in 2019; intersection in 2019; (f)
(f) Orlickiego-Portowa- Śliwki
Orlickiego-Portowa-Śliwki intersection in 2020; (g) Orlickiego-Wyspiańskiego intersection in 2019; (h) Orlickiego-Wyspiańskiego intersection in 2020; (i) Pszczyńska-
intersection in 2020; (g) Orlickiego-Wyspiańskiego intersection in 2019; (h) Orlickiego-Wyspiańskiego intersection in 2020; (i) Pszczyńska-Pocztowa intersection in 2019; (j) Pszczyńska-
Pocztowa intersection in 2019; (j) Pszczyńska-Pocztowa intersection in 2020; (k) Chorzowska-Knurowska intersecection in 2019; (l) Chorzowska-Knurowska intersection
Pocztowa intersection in 2020; (k) Chorzowska-Knurowska intersecection in 2019; (l) Chorzowska-Knurowska intersection in 2020; (m) Chorzowska-Zabrska intersection in 2019;
in 2020; (m) Chorzowska-Zabrska intersection in 2019; (n) Chorzowska-Zabrska intersection in 2020; (o) Nowy Świat-Pszczyńska-Mikołowska intersection in 2019; (p)
(n) Chorzowska-Zabrska intersection in 2020; (o)intersection
Nowy Świat-Pszczyńska-Mikołowska Nowy Świat-Pszczy
in 2020. ńska-Mikołowska intersection in 2019; (p) Nowy Świat-Pszczyńska-Mikołowska intersection in 2020.Remote Sens. 2021, 13, 2329 21 of 38
In 2020, until the 12th week, the morning and afternoon rush hours at the analyzed
intersections occurred at the same hours as in 2019. On the other hand, from the 12th
week of 2020, the morning rush hours at intersections (1), (2), (3), (4), (7), (8) took place
between 05:00–06:00, while at intersections (5), (6) between 04:00 and 06:00. The afternoon
rush hours at all analyzed intersections after the 12th week of 2020 took place between
13:00–16:00.
In the next stage of work, the analysis covered the average values of traffic volume
for each hour during the day in particular months of the year (Figure 7). These analyses
were carried out for both 2019 and 2020. Both daily and monthly variability is visible for
each intersection, with a clear increase in the value of traffic volume during the morning
and afternoon rush hours. The distribution of traffic volume in 2020 is characterized by
lower daily variability than in 2019 in each month of the year (except February) for each
intersection. In addition, there is a different distribution of traffic volume in April 2020,
characterized by much lower hourly traffic volume than in April 2019 or in other months
of the year. In particular months of 2019, the morning and afternoon rush hours at each of
the analyzed intersections occur at similar hours of the day. This regularity is no longer
observed in 2020. Figure 7 shows a significant daily blurring of traffic volume distributions
in particular months of 2020, which is probably largely related to the covid-19 pandemic.Remote Sens. 2021, 13, x FOR PEER REVIEW 13 of 41
Remote Sens. 2021, 13, 2329 22 of 38
(a) (b)
(c) (d)
Figure 7. Cont.Remote Sens. 2021, 13, 2329 23 of 38
Remote Sens. 2021, 13, x FOR PEER REVIEW 14 of 41
(e) (f)
(g) (h)
Figure 7. The average values of traffic volume in particular months of the year for each hour during the day at intersections in Gliwice in 2019 and in 2020. Where: (a) Andersa–Okulickiego;
(b) Kozielska-Okulickiego; (c) Orlickiego-Portowa-Śliwki; (d) Orlickiego-Wyspiańskiego; (e) Pszczyńska-Pocztowa; (f) Chorzowska-Knurowska; (g) Chorzowska-Zabrska; (h) Nowy
Świat-Pszczyńska-Mikołowska.Remote Sens. 2021, 13, 2329 24 of 38
5. Daily Traffic Patterns at Particular Stages of a Pandemic
Earlier analyses showed a different character of daily traffic volume distribution
in particular stages of the covid-19 pandemic from the daily traffic distribution in the
corresponding weeks of 2019. Hence, an attempt was made to estimate daily traffic
patterns at particular stages of the covid-19 pandemic. The daily traffic patterns of this
type were also constructed for the corresponding weeks in 2019. The comparison of these
types of daily traffic patterns will enable the identification of general differences in the
daily traffic patterns in 2019 and 2020. Estimated daily traffic patterns can be a source of
information in traffic management in subsequent waves of the pandemic and other crises,
reflected in a significant reduction in mobility and decrease in the value of traffic volume.
Therefore, the following weeks of 2020, representing different stages of the pandemic, were
selected for further detailed analysis:
• 17–23 February 2020: 8th week of the year (the average week before the pandemic period),
• 16–22 March 2020: 12th week of the year (which was also the first full week of
lockdown in Poland),
• 20–26 April 2020: 17th week of the year (a week at lockdown),
• 18–24 May 2020: 21st week of the year (in the stage of partial opening of the coun-
try’s economy),
• 22–28 June 2020: 26th week of the year (after the reopening of most services while main-
taining the required sanitary regime, after the end of the school and academic year).
In the first stage of the work, the analysis covered changes in the value of traffic
volume during the day for the original 15-min measurement data and aggregated it to
hourly data (Figure 8).
In the case of data with a 15-min interval, there are significant random fluctuations
in the value of traffic volume in subsequent time intervals, which make further analysis
difficult. Random fluctuations do not occur for the most part in the case of traffic volume
aggregated to an hour. Hence, the values of traffic volume aggregated to hourly data were
analyzed in detail. A daily traffic pattern was used which was a linear combination of two
Gaussian functions to describe the variability of traffic volume over the day:
−(t−µ1 )2 −(t−µ2 )2
2 2
Q ( t ) = a0 + a1 · e 2·σ1 + a2 · e 2·σ2 (7)
where:
Q(t)—a daily traffic pattern on working days (from Monday to Friday),
a0 , a1 , a2 —parameters of the function representing the traffic volume in the night,
morning, and afternoon rush hours, respectively,
µ1 , µ2 —normal distribution parameters (expected value),
σ1 , σ2 —normal distribution parameters (variance).
Parameters of the trend function Q(t), i.e., a0 , a1 , a2 were determined by the least
squares method separately for each day of the week and then for each week for each
intersection. The Statistica package was used for this purpose. Values of the determination
coefficients R2 ∈ h0.92, 0.98i were obtained. It can be concluded that the obtained daily
traffic patterns are well-suited to the real distribution of traffic volume values. The assess-
ment of the fit of the Q(t) function to the empirical data was made by determining the
values of the mean relative errors. They correspond to the mean values of the square errors
to the mean value of the measured traffic volume:
q
1 n 2
n ∑i =1 ( Qo,i − Qm,i )
δ= 1 n
· 100% (8)
n ∑i =1 Qo,i
where:
δ—mean relative error [%],
n—number of observations,lockdown in Poland),
• 20–26 April 2020: 17th week of the year (a week at lockdown),
• 18–24 May 2020: 21st week of the year (in the stage of partial opening of the country’s
economy),
•
Remote Sens. 2021, 13, 2329
22–28 June 2020: 26th week of the year (after the reopening of most services while 25 of 38
maintaining the required sanitary regime, after the end of the school and academic
year).
Q —i-th observed traffic volume [Veh./h],
In the first stage ofQo,i
the work, the analysis covered changes in the value of traffic
m,i —i-th traffic volume determined from the bimodal trend function [Veh./h].
volume during the day Tables for the original
6 and 7 present15-min measurement
the determined data
values of the and aggregated
parameters of the traffic it to
volume
hourly data (Figure 8). variability function in the day for 2019 and 2020.
(a)
FOR PEER REVIEW 16 of 40
(b)
Figure 8. Daily variability of the value of traffic volume in intervals of: (a). fifteen minutes, and (b). hourly for the (eighth)
week of 2020 at the Andersa-Okulickiego intersection.
Figure 8. Daily variability of the value of traffic volume in intervals
https://doi.org/10.3390/xxxxx of: (a). fifteen minutes, and (b).
www.mdpi.com/journal/remotesensing
hourly for the (eighth) week of 2020 at the Andersa-Okulickiego intersection.
In the case of data with a 15-min interval, there are significant random fluctuations
in the value of traffic volume in subsequent time intervals, which make further analysis
difficult. Random fluctuations do not occur for the most part in the case of traffic volume
aggregated to an hour. Hence, the values of traffic volume aggregated to hourly data were
analyzed in detail. A daily traffic pattern was used which was a linear combination of two
Gaussian functions to describe the variability of traffic volume over the day:
− (t − μ1 )2 − (t − μ 2 )2
2⋅σ 12 2⋅σ 22
Q (t ) = a0 + a1 ⋅ e + a2 ⋅ e (7)
where:Remote Sens. 2021, 13, 2329 26 of 38
Table 6. Values of the parameters of the function of a daily traffic pattern on working days in
particular weeks for the analyzed intersections in 2019.
Function Parameters Q(t)
Week
Number a0 a1 µ1 σ1 a2 µ2 σ2 δ
[Veh./h] [Veh./h] [h] [h] [Veh./h] [h] [h] [%]
Intersection 1
8 56 1502 07:45 02:16 2166 14:30 02:47 17.40
12 12 1753 07:30 02:17 2418 15:15 02:39 16.56
17 53 1804 07:30 02:17 2424 15:30 02:49 16.18
21 17 1703 07:45 02:19 2311 15:30 02:45 15.39
26 93 1691 07:45 02:22 2143 15:45 02:53 16.44
Intersection 2
8 33 1108 07:45 02:21 1713 15:00 02:35 16.68
12 40 1330 07:45 02:19 1908 15:15 02:33 16.40
17 35 1290 07:45 02:23 1966 15:30 02:53 17.41
21 14 1349 07:45 02:18 1977 15:30 02:40 15.97
26 86 1235 07:45 02:19 1802 15:30 02:51 16.23
Intersection 3
8 100 1662 07:45 02:18 2471 15:30 02:41 16.58
12 57 1949 07:45 02:22 2795 15:30 02:45 16.29
17 115 1738 07:45 02:52 2632 15:30 02:53 17.59
21 32 1959 07:45 02:23 2710 15:30 02:51 15.56
26 162 1657 07:45 02:23 2376 15:15 02:55 17.30
Intersection 4
8 43 1518 07:45 02:18 2315 15:00 02:39 17.30
12 19 2017 07:45 02:16 2710 15:30 02:39 18.15
17 59 1909 07:45 02:16 2665 15:30 02:48 17.14
21 11 2004 07:45 02:14 2665 15:30 02:49 16.45
26 128 1780 07:45 02:18 2454 15:30 02:53 19.26
Intersection 5
8 92 1206 07:45 02:17 1876 15:15 02:35 14.42
12 91 1435 07:45 02:18 1961 15:15 02:39 13.86
17 127 1379 07:45 02:23 1985 15:30 02:43 15.93
21 86 1452 07:45 02:24 2070 15:30 02:45 12.82
26 164 1299 07:45 02:21 2057 15:15 02:43 15.70
Intersection 6
8 300 1343 07:15 02:17 1382 14:30 02:32 17.92
12 310 1383 07:15 02:19 1885 14:30 02:39 17.78
17 230 1952 07:45 02:13 1940 14:45 02:52 16.41
21 295 1451 07:15 02:15 1941 14:30 02:51 16.82
26 203 2023 07:30 02:17 2002 14:04 02:47 17.72
Intersection 7
8 112 1669 07:45 02:19 1562 15:45 02:47 15.84
12 53 1759 07:45 02:21 2336 15:15 02:48 14.22
17 172 1603 07:45 02:25 2166 15:15 02:52 16.31
21 30 1653 07:45 02:27 2228 15:30 02:55 13.90
26 112 1573 07:45 02:25 2017 15:30 02:56 14.91
Intersection 8
8 117 1493 07:45 02:17 2045 15:00 02:43 14.31
12 141 1596 07:45 02:21 2201 15:00 02:49 13.55
17 102 1622 07:45 02:23 2382 15:00 02:52 12.07
21 120 1515 07:45 02:25 2106 15:00 02:52 13.50
26 169 1232 07:45 02:12 2075 14:30 02:53 14.96You can also read