A Road Map for States - State Strategies to Reduce Highway and Traffic Fatalities and Injuries
←
→
Page content transcription
If your browser does not render page correctly, please read the page content below

State Strategies to Reduce Highway and Traffic
Fatalities and Injuries
A Road Map for States
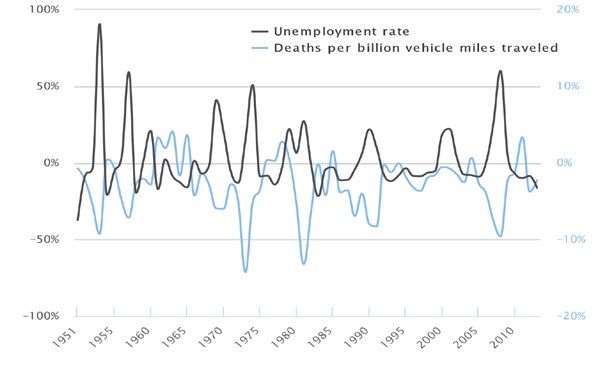
Table of Contents

Executive Summary ...........................................................................................3

Introduction ......................................................................................................5

Background and Scope of the Problem .............................................................6

Steps to Address the Increase in Fatalities ..............................................................10

      Step 1: Assess the Situation................................................................... 10

      Step 2: Coordinate with Key Agencies & Stakeholders......................... 11

      Step 3: Set & Align Goals...................................................................... 12

      Step 4: Develop Strategies & Select Safety Interventions..................... 13

      Step 5: Finalize Policies, Implement and Evaluate................................. 18

Appendices ......................................................................................................20

      A. Examples of Key Decision Makers and Stakeholders........................ 20

      B. State Approaches to Engaging Stakeholders.................................... 21

      C. Background on Current State Planning Efforts ................................ 22

      D. Involving the Governor ..................................................................... 24

      E. Best Practices for Data Use................................................................ 25

      F. Safety in Infrastructure Planning........................................................ 26

      G. Safety in Innovative Technology........................................................ 27

      H. Motor Vehicle Prioritizing Interventions and Cost Calculator
         for States........................................................................................... 28

Endnotes .................................................................................................................29

                                                                                                           A Road Map for States   1
Acknowledgments
State Strategies to Reduce Highway and Traffic Fatalities: A Road Map for States was written
by Lauren Dedon, Sue Gander, Kalyn Hill, Andrew Kambour, Jeff Locke and Jeff McLeod.
The road map is the result of the National Governors Association Center for Best Practices
(NGA Center) Homeland Security and Public Safety Division and Environment, Energy and
Transportation Division’s work to identify solutions for governors to address traffic safety.
The NGA Center would like to thank the many state officials
and national experts for their guidance and involvement in
developing this road map and their steadfast commitment
to improving traffic safety in their states.
The NGA Center would also like to acknowledge the Centers for Disease Control and
Prevention (CDC) for its generous support in developing this tool through Cooperative
Agreement Number U38OT000227. The contents of the road map are solely the responsibility
of the authors and do not necessarily represent the official views of the CDC.
Recommended citation format: L.Dedon, S.Gander, K.Hill, A.Kambour, J.Locke and
J.McLeod, State Strategies to Reduce Highway and Traffic Fatalities: A Road Map for States.
(Washington, D.C.: National Governors Association Center for Best Practices, February 2018).
2 State Strategies To Reduce Highway And Traffic Fatalities And InjuriesExecutive Summary
THE PROBLEM
Motor vehicle crashes are a leading cause of death in the United States. In 2016, there
were 37,461 traffic-related deaths. That number was 5.6% higher than in 2015. This follows
the record number of traffic fatalities in 2015. In 2016, there were an estimated 4.6 million
medically consulted motor vehicle injuries.
MAJOR FACTORS OF THE INCREASE
Many factors have contributed to the historic rise in traffic-related deaths. Safety experts,
researchers and policymakers in the field have identified three that stand out: increased
exposure and mobility, risky road user behavior and, deficiencies in post-crash response.
SUPPORTING GOVERNORS’ TRAFFIC SAFETY EFFORTS
With 39 states reporting an increase in traffic fatalities in 2016, traffic safety policy, programs,
and practices remain a pressing concern across the nation—and governors are an essential
part of the solution. The National Governors Association (NGA) supports governors and their
staff in developing solutions to transportation, public safety and public health challenges.
THE ROAD MAP
This road map highlights existing efforts in the states and serves as a policy development
tool for governors and their senior leadership who seek to improve coordination and bolster
existing efforts across state agencies, including departments of public safety, transportation,
public health, and emergency medical and trauma services. Potential policy development
steps to consider include:
STEP 1 Assess the Situation
STEP 2 Coordinate with Key Agencies & Stakeholders
STEP 3 Set & Align Goals
STEP 4 Develop Strategies and Select Safety Interventions
STEP 5 Finalize Policies, Implement and Evaluate
A Road Map for States 3DEVELOP A SAFE ROAD USER IMPROVE TRAFFIC SAFETY
FRAMEWORK ENFORCEMENT
• Policies that permit violators of seat- • Support targeted enforcement for
belt-use-laws to be stopped and cited speeding-related offenses
independently of any other traffic
• Where authorized, use automated traffic
behavior enforcement, including automated
• Setting appropriate speed limits speed enforcement in high-risk areas
(e.g. school and work zones) and red
• Policies that promote bicycle and
motorcycle helmet use among all light automated enforcement
riders • Increase the use of sobriety checkpoints
and saturation patrols
• Graduated driver’s licenses (GDL)
policies that include restrictions for • Support the deployment of drug
the full length of the learner’s permit recognition experts for impaired driving
period, requirements for a period offenses
of supervised hours and effective • Increase the number of driving while
restrictions for nighttime driving and intoxicated (DWI) courts and encourage
for how and when the GDL holders other courts to impose appropriate
driver passengers. penalties
ENSURE SAFETY MANAGEMENT PLANNING
• Develop standard detection-enforcement methods for law enforcement to identify drug
impairment, including from prescription drugs and marijuana
• Support trainings and informational sessions for judges, prosecutors, and emergency
medical services and law enforcement personnel on the role of impaired driving,
distracted driving, restraint use, aggressive driving and speeding in motor-vehicle
related fatalities and injuries
• Host statewide safety summits for key stakeholders
• Develop, implement, and evaluate public education campaigns to improve public
understanding of highway safety
4 State Strategies To Reduce Highway And Traffic Fatalities And InjuriesIntroduction
The National Highway Traffic Safety Administration (NHTSA) released data that 37,461
individuals died in traffic crashes in 2016, a 5.6 percent increase from 2015. This follows the
record number of traffic fatalities in 2015, which saw the largest year-over-year increase in
fatalities since 1966. Traffic crashes remain a leading cause of death by unintentional injury
for people aged 1-54 in the United States. These data, and that of the past several years,
demonstrate the need to continue targeted efforts to save lives and prevent injuries on our
nation’s roadways.
This road map is a tool to help states reduce traffic With 39 states reporting
fatalities and injuries. It can help states assess their an increase in traffic
capacity to address the problem, determine how to fatalities in 2016,1 traffic
align existing state and local agency efforts, improve safety policy, programs
public health and safety, and explore cost-effective and practices remain
safety interventions for implementation and evaluate a pressing concern
their work. across the nation—
Given that states are already working to improve traffic and governors are an
safety, some steps may overlap with current efforts and essential part of the
are designed to enhance these practices. For example, solution.
under the Fixing America’s Surface Transportation Act,
state departments of transportation are required to
submit a multiyear Strategic Highway Safety Plan (SHSP) on behalf of the state to the Federal
Highway Administration. The SHSP is designed to guide state investment decisions toward
strategies and countermeasures with the most potential to save lives and prevent injuries on
public roadways. This road map highlights these efforts and serves as a policy development
tool for governors and their senior leadership who seek to improve coordination and bolster
existing efforts across state agencies, including departments of public safety, transportation,
public health and emergency medical and trauma services.
What to Expect
This road map is organized into the following sections:
Background and Scope of the Problem
Steps to Address the Increase in Fatalities
Appendices of Supplemental Information,
including State Implementation
and Process Examples
A Road Map for States 5How the Road Map Was Developed
This road map was developed through research and consultation with senior state officials
and other national experts in the fields of transportation, public safety and public health. The
National Governors Association Center for Best Practices conducted an experts roundtable
that brought together over 20 state officials and safety experts from across the country to
discuss strategies available to states to coordinate and enhance efforts to increase traffic
safety.2 The road map reflects the insights and experience of the many experts consulted
during its development.
Background and Scope of the Problem
Motor vehicle crashes are a leading cause of death in the United States. In 2016, there were
37,461 traffic-related deaths.3 That number was 5.6 percent higher than in 2015.4 This follows
the record number of traffic fatalities in 2015, which marked the highest number of traffic
fatalities since 2008.
Although most of the research on traffic crashes has been based on fatal injuries, nonfatal
injuries are also of major concern. In 2016, there were an estimated 4.6 million medically
consulted motor vehicle injuries—that is, injuries serious enough that a medical professional
was consulted.5 However, not as much is known about circumstances leading to nonfatal
crashes and their effects on injury severity because less data are available for nonfatal
injuries.6 Thus, states need to carefully consider how to gather more data, link data together
and craft appropriate strategies with limited information and work to gather more data.
In addition to causing fatalities and injuries, traffic crashes impose a large financial and
economic toll. In 2016, the estimated cost of motor vehicle deaths, injuries and property
damage was $432.5 billion.7 This is a 12 percent increase from 2015.8 These costs include
lost wages, productivity loss, medical
expenses, administrative expenses9
employer costs and property damage.
In 2012, traffic crash injuries totaled “It is recommended that the
$18 billion in lifetime medical expenses mechanism for approval of standards
alone.10 for programs including those
States face two inter-related challenges: dealing with accident records, driver
reducing the number of traffic fatalities education, licensing, performance
and injuries, and identifying the causes and motor vehicle inspection,
of nonfatal traffic injuries in order to traffic controls, highway design and
implement and develop more effective
solutions.11 To address these challenges, maintenance and surveillance of
states must: coordinate state highway traffic be modeled generally...”
safety planning; enforce state policies
Proceedings of the National Governors
and laws on traffic safety; and pursue
Conference, 1966
cost-effective, evidence-based, data-
driven safety interventions.
6 State Strategies To Reduce Highway And Traffic Fatalities And Injuries“... that the National Governors’ Conference
invite the National League of Cities, the United States Conference of Mayors and
the National Association of Counties to join the Governors in sponsoring a national
conference of state and local governments to define and clarify areas of traffic safety
responsibility, and to determine the most effective courses of action with respect to
SLIDE #3
priority needs and financing...”
Major Factors of the Increases
Proceedings of the National Governors Conference, 1966
Supporting Governors’ Traffic Safety Efforts
The National Governors Association (NGA) supports
governors and their staff in developing solutions to Increased
Exposure &
transportation, public safety and public health challenges. Mobility
For decades, states have been seeking to make their
public roadways safer.
During the National Governors’ Conference in
1966, another period when states were seeing Rise in
a historic spike in traffic fatalities, governors Traffic
identified traffic safety as a top priority. In the Fatalities
decades since, states and safety professionals
Deficiencies in Risky Road
have researched driving behaviors, enhanced Post-Crash User
roadway engineering and identified ways Response Behavior
to improve the safety of all persons on
our nation’s roadways. These efforts and
advancements helped to build the evidence
base as to which interventions are most effective
and created opportunities for continued innovation. Today, governors are refocusing on
improving traffic safety as states continue to place an emphasis on evidence-based strategies
and cost-effectiveness and to foster environments for the testing and implementation of
innovative new solutions.
Major Factors for the Increase
A number of factors have contributed to the historic rise in traffic-related deaths. Safety
experts, researchers and policymakers in the field have identified three that stand out:
increased exposure and mobility, risky road user behavior and deficiencies in post-crash
response.
Increased Exposure and Mobility
Over the last five to ten years, the U.S. economy has seen growth and recovery following
the 2008 recession. As the economy has improved, the unemployment rate has declined
and gas prices have dropped. These changes, in turn, encouraged individuals to take to
the road—whether they are going to work, taking vacation road trips, riding motorcycles
A Road Map for States 7Increased Exposure & Mobility
• In 2015 Americans travelled over
3.1 trillion miles, creating a new
record high for total vehicle miles
traveled.
• Economic recovery tends to
correspond with an increase in the
number of vehicle miles traveled,
and, consequently, an increase in
the rate of traffic related deaths.
(Source: Insurance Institute for Highway Safety (2015) Status Report (Vol. 50, No.10))
or bicycles or taking public transportation. The
Federal Highway Administration noted that in
As a direct result
2015, the U.S. passed its 2007 record of miles of more overall use
traveled per capita and that number continues to
climb.12 In 2016, vehicles in the U.S. traveled over
of roadways, traffic
3.1 billion miles.13 Studies indicate that, historically, and exposure of
economic recovery tends to correspond with an
increase in the number of vehicle miles traveled persons on the
and consequently an increase in the rate of traffic- roadways have
increased.
related fatalities and injuries.14
As Americans are driving more miles, states and
cities are encouraging—and residents are taking
advantage of—alternative forms of transportation,
such as walking and biking, to attain health, environmental and traffic congestion relief goals.
These people, including motorcyclists, bicyclists and pedestrians, are placed at greater risk
in traffic and are considered vulnerable road users.
As a direct result of more overall use of roadways, traffic and exposure of persons on the
roadways have increased. With increased exposure comes increased risk for traffic crashes,
and vulnerable road users experienced a significant number of traffic-related deaths in
2016:15
• 5,987 pedestrian fatalities;
• 5,286 motorcyclist fatalities; and
• 840 bicyclist fatalities.
Teen drivers (16 to 19 years of age) and older adult drivers (65 years of age and older) are
considered at-risk road-user populations. Motor vehicle crashes remain the leading cause of
death for American teens. Half of all teens will be involved in a car crash before graduating
from high school.16 Teen drivers are nearly three times more likely than drivers aged 20 and
8 State Strategies To Reduce Highway And Traffic Fatalities And InjuriesSLIDE #5
Risky Road User Behavior
Risky Road User Behavior Other Distracted Driving
The main causes and contributors to 6.1% 9.9%
Unrestrained
traffic fatalities include the following Occupants
risky road user
behaviors:
28%
• Impaired driving
29% Impaired Driving
• Unrestrained occupants
• Speeding
• Distracted driving 27%
(e.g. cell-phone use)
Speeding
older to be in a fatal crash. In 2015, 2,333 teens in the U.S. were killed, and 221,313 were
treated for injuries suffered in motor vehicle crashes in 2014.17
Also in 2014, more than 5,700 older adults were killed and more than 236,000 were treated
for motor vehicle crash injuries.18 This amounts to 16 older adults killed and 648 injured in
crashes on average every day.19
Risky Road User Behavior
Traffic safety experts note that human choice and error are major contributing causes of
traffic crashes. Impaired driving, not using a seat belt
and speeding20, represent a majority of the causes of
traffic fatalities in 2015.21 Additionally, there were 3,477 Half of all
distraction affected traffic fatalities in 2015.22
teens will be
involved in a car
While road users generally view drinking and driving,
texting while driving and speeding as very serious
threats,23 their perceived level of risk from these crash before
graduating from
behaviors is not reflected in how they act. Risky-
road-user behaviors largely stem from a lack of
safety culture. A strong safety culture encompasses
24
high school.
communities’ beliefs, attitudes and norms that value
safety and; where members of the community engage
in serious public dialogue to seek ways to continually
improve traffic safety.25 Many states have identified
strengthening safety culture as a priority. Risky behavior is difficult to change, but it can be
counteracted by strengthening the safety culture through coordinated interventions and
strategies. Most Americans express support for laws aimed at improving traffic safety, such
as banning hand-held cell phone use and texting while driving.26 Public support for such
laws presents policymakers with a potential opening to pursue improved education, rules
and enforcement.
A Road Map for States 9Deficiencies in Post-Crash Response
While policy, programs and practices often focus on prevention, post-crash strategies are
also critical. Not all fatalities occur at the scene of the crash. Post-crash strategies that
mitigate serious injuries can reduce the number of fatalities.
Fatalities occurring post-crash are in part attributed to circumstances of the crash itself, such
as the severity of the injuries, age of the injured person and number of occupants in a vehicle.
But these fatalities may also be affected by systemic circumstances, such as the distance
to emergency medical services or trauma centers, gaps in emergency medical system
communications and a lack of access to real-time data and data linkage systems (linking
crash reports to medical data).27 This data can inform law enforcement and first responders
of where crashes occur in real-time, as #6
SLIDE well as historically, to improve understanding, aid in
reducing response times, and ensure effective deployment of resources.28
Steps to Address the Increase in Fatalities
Access to emergency medical and trauma services presents a challenge for rural communities.
Studies have shown that the farther a fatal crash occurs from a Level 1 or 2 trauma center, the
more likely it is that the driver will be listed as “died at the scene of
the crash.”29 In more rural areas, persons may live more
than 45 minutes away from a Level 1 or 2 trauma Step 1:
center. Assess the
Step 5: Situation
Finalize Policies,
Steps to Address the Increase Implement,
& Evaluate
in Fatalities
Step 2:
Understanding and identifying factors that Coordinate with
contribute to the increase in traffic fatalities Key Agencies &
Stakeholders
and injuries is the first step in addressing this Step 4:
problem. A state must then assess and identify Develop
Strategies &
its specific factors. Governors can assist in these Select
Interventions
efforts by ensuring coordination of key agencies Step 3:
and stakeholders. States are then positioned to Set and
Align Goals
set goals and develop action plans for targeted
improvement. States can use effective strategies and
safety interventions that create a safe-road-user framework,
to ensure traffic safety laws and policies are enforced and prioritize safety management
planning. Finally, states must develop a coordinated statewide work plan, implement and
evaluate their efforts. This policy development sequence is a continuous improvement
process and should be informed by data. Further, it must emphasize the importance of
cross-agency communication, coordination and collaboration.
Step One: Assess the Situation
»» Collect Data and Review Existing Efforts
Take an inventory of existing state efforts and high-level data to improve understanding of
the problem and identify opportunities for advancement. This initial review should include:
• Strategic Highway Safety Plans
(See Appendix C on page 22.);
10 State Strategies To Reduce Highway And Traffic Fatalities And Injuries• Fatality Analysis Reporting System data and state crash injury and fatality data;
• Police reports and medical data; and
• State trauma services and emergency medical service plans.
»» Identify Problem Areas
Review the collected information to identify gaps in data and areas with the greatest need
for improvement.
Conduct a statewide environmental scan to understand challenges, weaknesses and
opportunities. During this process, states should consider surveying transportation
and public safety practitioners, holding focus groups and other activities to engage
stakeholders to understand the environment inside and outside of state government.
As an example of how states can conduct environmental scans, the Centers for Disease
Control and Prevention (CDC) provides a guide to assist states in assessing its graduated
driver licensing practices.30
»» Review Existing Laws And Regulations
Develop an inventory of current laws and Each entity
regulations that have a direct impact on traffic
safety. Cost-benefit analysis tools, such as the
involved must
CDC’s Motor Vehicle Prioritizing Interventions and commit to the
Cost Calculator for States (MV PICCS),31 can
assist with this assessment. An assessment should
state’s goals and
not only take into consideration major factors that objectives to ensure
contribute to the increase in traffic fatalities but
also take into consideration policies for
flow of information
beginning and older drivers, motorcyclists, and collaboration.
bicyclists and pedestrians, as studies show these
vulnerable road users are significantly affected by
traffic crashes.
Assessments of laws and policies should ask:
1. Do these laws include protections for drivers, passengers and vulnerable road users?
2. Have they been shown to be effective in reducing fatalities and improving overall safety?
In Montana, the Department of Transportation compiles an annual report
that provides a description of characteristics for motor vehicle crashes
on Montana’s public roadways. The data are used to identify problem
areas and trends related to highway traffic safety and provides a basis to
help traffic safety specialists and partners develop a statewide plan.32
Step Two: Coordinate with Key Agencies and Stakeholders
Many entities, state and local agencies and stakeholder groups play a role in traffic safety.
States should ensure that a clearly delineated lead entity takes ownership of statewide
coordination. Each entity involved must commit to the state’s goals and objectives to ensure
A Road Map for States 11flow of information and collaboration.
Identify and engage the key decision makers. Ensure they are familiar with the problem,
understand the high-level goals and are involved in implementing the state’s plan. (See
Appendix A on page 20.)
Step Three: Set and Align Goals
States should set clearly articulated target goals that are specific, measurable, achievable,
relevant and time-bound. Target goals can draw from existing or future strategic highway
safety plans but must reflect the governor’s priorities for traffic safety. These goals should
be emphasized as a priority across all affected agencies.
In addition, these goals direct the overarching policies that guide decision making
and address the problem that the state is trying to solve. The state’s policies should be
consistent with, and complemented by, programmatic and implementation efforts.
Each agency and entity involved should be aligned with, and included in, plans to reach the
goal.
Minnesota launched its Toward Zero Death (TZD) program in 2003. TZD is
the state’s cornerstone traffic safety program, employing an interdisciplinary
approach to decreased traffic crashes, injuries and deaths on Minnesota
roads with the vision of reducing fatalities and serious injuries on Minnesota’s
roads to zero.33 A 2015 report found that in 2013, Minnesota’s fatality rate (the
SLIDE #7
number of fatalities per 100 million vehicle miles traveled) was 0.7, the second-
lowest rate in the nation (Massachusetts reported a rate of 0.6).34 This was a
State Strategies to Reduce
77 percent Highway
decline sinceand Traffic
1975 andFatalities
a 34 percent decline since 2001.35
State Strategies to Reduce
Highway and Traffic Fatalities
TRANSPORTATION
Develop Safe Improve Traffic
Road User Safety
Framework Enforcement
PUBLIC SAFETY
PUBLIC HEALTH
Ensure Safety
Management
Planning
12 State Strategies To Reduce Highway And Traffic Fatalities And InjuriesStep Four: Develop Strategies and Select Safety Interventions
Reducing the number of highway and traffic fatalities requires communication, coordination
and collaboration across state and local agencies. These agencies include public safety,
transportation and public health officials.
For the purposes of this road map, public safety, transportation and public health include
the following entities:
Public Safety includes law enforcement (state patrol or state police and local law enforcement
offices), emergency communications (9-1-1), fire departments, judicial officials and the courts.
Transportation includes transportation departments, highway safety offices, departments of
motor vehicles and infrastructure planning entities.
Public Health includes departments of health and emergency medical and trauma services.
These agencies must work in concert with the governor’s office to develop strategies
and select interventions that will develop road user frameworks and improve traffic safety
enforcement and safety management planning.
The following strategies include cost-effective, evidence-based interventions for reducing
highway and traffic fatalities. This selection is not meant to be exhaustive; rather, it highlights
the mostSLIDE
effective
#8 interventions, policies and practices identified through research and
consultation with experts.
State Strategies to Reduce Highway and Traffic Fatalities
To build a comprehensive action plan, states may consider and implement some, or all, of
these strategies, depending on the nature of the problem, existing traffic safety framework
and other state-specific considerations.
DEVELOP A SAFE ROAD USER FRAMEWORK
To reduce traffic fatalities, states should ensure a
traffic safety framework is in place. This framework
can be implemented through agency programs,
TRANSPORTATION
practices and planning processes. Develop Safe Improve Traffic
Road User Safety
In developing such a framework, states should Framework Enforcement
consider information gathered
PUBLIC SAFETYduring the initial
scan of existing laws and regulations. Do they
include policies to address teen and older
drivers, motorcyclists, bicyclists
PUBLIC HEALTHand pedestrians?
It is important to pay close attention to policies Ensure Safety
Management
affecting the major factors contributing to traffic Planning
fatalities most at-risk populations in your state, and
review correlating policies that may address these
factors and protect these vulnerable road users.
The following strategies and interventions inform laws, procedures
and practices that imbed safe roadway use in the state’s policies. These strategies are
designed to address safety challenges involving drivers, passengers and vulnerable road
users.
A Road Map for States 13Strategies that Improve Safety for Drivers and Passengers
Policies that permit violators of seat-belt-use-laws to be stopped and cited independently of
any other traffic behavior;
Implementation of primary seatbelt laws and ordinances;
Increasing seatbelt-use penalties and fees;
Setting appropriate speed limits;
Implementation of youth occupant restraint policies and promoting the use of such restraints;
and
Encouraging the use of driver log books for commercial drivers.
Strategies that Improve Safety for Vulnerable Road Users
Policies that promote bicycle helmet use among all riders;
Policies that promote motorcycle helmet use among all riders; and
Establishing a standard safe passing distance between a motor vehicle and a person on a
bicycle.
Strategies to Ensure Adequate Training Standards and Safeguards for Beginning Drivers
Graduated driver’s licenses (GDL) policies that include restrictions for the full length of
the learner’s permit period, requirements for a period of supervised hours and effective
restrictions for nighttime driving and for how and when the GDL holders drive passengers.
Strategies to Enhance Licensing Standards for Older Drivers
In-person screening and testing for driver’s licenses for older drivers and the ability to tailor
licensing to specific needs, such as daylight driving only.
y and Traffic Fatalities
IMPROVE TRAFFIC SAFETY ENFORCEMENT
Studies and fatality data show that aggressive driving, impaired driving, distracted driving
and speeding are the causes of many traffic crashes that result
in deaths. The involvement of law enforcement, the
courts and other public safety officials responsible for
enforcing traffic laws is critical to maintain safety on
public roads.
Develop Safe Improve Traffic The following strategies and interventions
Road User Safety support law enforcement’s ability to effectively
Framework Enforcement enforce laws when persons engage in illegal
driving or roadway use. These strategies
are designed to deter risky behavior by
emphasizing appropriate sanctions and tools.36
Law enforcement should be provided adequate
Ensure Safety
Management
resources to implement the following strategies.
Planning
14 State Strategies To Reduce Highway And Traffic Fatalities And InjuriesStrategies to Target and Enhance Enforcement of
High-Risk-Speeding Corridors and Areas with High The involvement of
Levels of Traffic Injury and Fatality Reporting
law enforcement,
Support targeted enforcement for speeding- the courts and other
related offenses.
public safety officials
Where authorized, use automated traffic
enforcement, including automated speed responsible for
enforcement in high-risk areas (e.g., schools and enforcing traffic laws
work zones) and red light automated enforcement.
is critical to maintain
Strategies to Ensure Law Enforcement is Properly safety on public roads.
Trained, Equipped to Detect and Able to Implement
Impaired Driving Enforcement
Increase the use of sobriety checkpoints and saturation patrols;
Support the deployment of drug recognition experts for impaired driving offenses;
Enforce administrative license revocation or suspension if a driver
fails or refuses to take a blood alcohol content (BAC) test;
Use preliminary breath test devices to measure driver BAC; and
Invest in and increase the capacity of state toxicology labs to address testing of marijuana
and other substances.
Strategies to Ensure Drivers and Passengers are Wearing their Seatbelts in Accordance with
the Law
Support highly visible law enforcement efforts combined with a publicity strategy to educate
the public on seatbelt use, including nighttime and child car seat, booster seat and seatbelt
use.
Strategies to Support the Enforcement of Distracted Driving Laws
Promote and utilize high-visibility enforcement of laws on texting and cell phone use to
reduce distracted driving.
Strategies to Provide Judicial and Administrative Tools to Ensure Appropriate Driving-
While-Intoxicated Penalties are Implemented
Increase the number of driving-while-intoxicated (DWI) courts and encourage other courts to
impose appropriate penalties;
Allow for limits on diversion and plea agreements for repeat DWI offenders;
Promote the use of alcohol ignition interlock devices and require them for first-time offenses;
Consider license plate and vehicle impoundment penalties for DWI offenders;
In partnership with emergency medical services, use alcohol screening and brief interviews to
estimate the level and severity of alcohol use and to determine whether a person may be at
risk for alcohol misuse and dependence; and
Encourage alcohol problem assessments at the time of DWI arrests and refer to treatment as
determined by a treatment professional.
A Road Map for States 15SLIDE
ENSURE #7 MANAGEMENT PLANNING
SAFETY
VariousState
stateStrategies
agenciestoare integral
Reduce to strategic
Highway planning
and Traffic and safety management initiatives
Fatalities
related to traffic safety and infrastructure growth. However, traffic and highway planning is
not always conducted with a coordinated or collaborative approach.
It is vital for the governor to emphasize the importance
of statewide and cross-agency collaboration on
both the state and local level. This coordination
includes ensuring that appropriate data sets
are being collected, analyzed, linked with
other data setsTRANSPORTATION
and shared with stakeholders;
safety management goals and planning are Develop Safe Improve Traffic
Road User Safety
properly aligned; and sufficient investments
Framework Enforcement
in infrastructure, road planning and innovative
PUBLIC SAFETY
technologies (e.g. automated vehicles) are
made. Highway Safety Offices should engage
directly with governor’s offices (e.g. chiefs
PUBLIC HEALTH
of staff, policy directors, policy advisors). In Ensure Safety
addition, it is important that law enforcement Management
personnel, judicial officials and other stakeholders Planning
are trained in and informed of safety efforts, given
necessary support and updated on new and effective
policies and strategies.
The following are strategies for managing traffic safety throughout the state. These
strategies are designed to coordinate and strengthen safety partnerships for planning
efforts; encourage technological and infrastructure innovation; manage data collection and
ensure data analysis and accessibility; ensure training and education; and support outreach
and public awareness.
Strategies to Coordinate and Strengthen Safety Partnerships for Planning Efforts
Ensure there is a task force, commission or committee charged with safeguarding cross-
agency strategic planning and implementation of the state’s traffic safety goals. (See
Appendix B on page 21.);
Ensure the governor’s involvement in the development of the Strategic Highway Safety Plan.
(See Appendix C on page 22.);
Strengthen and expand strategic highway safety planning and implementation activities.
(See Appendix C on page 22.);
Initiate and support multidisciplinary incident management planning, training and sharing of
best practices;
Establish partnerships with research entities (including universities and state health
departments) for data collection, analysis and evaluation. (See Appendix E on page 25.); and
Consider the safety rating of state vehicles before purchasing and use state vehicle fleets as
models of safe driving practices.
16 State Strategies To Reduce Highway And Traffic Fatalities And InjuriesStrategies to Encourage Technological and Infrastructure Innovation
Support infrastructure, roadway improvements, effective interventions and innovations that
provide safe driving environments for all road users. (See Appendix F on page 26.);
Incorporate the explicit role of safety in the long-range transportation planning process; and
Incentivize innovative vehicle safety technology, including autonomous vehicles, in road
planning, design and regulation. (See Appendix G on page 27.)
Strategies to Manage Data Collection and Ensure Data Analysis and Accessibility
Promote and support standards for data collection and accessibility. (See Appendix E on
page 25.);
Establish data clearinghouses, a central repository or an agency responsible for managing
traffic safety data;
Ensure availability of and access to linked data systems for transportation entities, emergency
medical services, hospitals and law enforcement;
Support the use of data analysis methods and tools at the state and local levels by
stakeholders, including cost-effective analyses for programs, such as MV PICCS. (See
Appendix H on page 28.);
Perform road safety audits and assessments to evaluate risks for crashes;
Use real-time and historical data to identify and evaluate high-risk or at-risk corridors when
planning high-visibility enforcement efforts; and
Encourage cross-agency information sharing to inform law enforcement about high-risk or
at-risk corridors.
Strategies to Ensure Training and Education
Authorize and train drug recognition experts to identify drivers who are impaired by drugs;
Develop standard detection-enforcement methods for law enforcement to identify drug
impairment, including from prescription drugs and marijuana;
Support trainings and informational sessions for judges, prosecutors and emergency medical
services and law enforcement personnel on the role of impaired driving, distracted driving,
restraint use, aggressive driving and speeding in motor-vehicle related fatalities and injuries;
Highlight state training programs and requirements; and
Host statewide safety summits for key stakeholders. (See Appendix B on page 21.)
Strategies to Support Outreach and Public Awareness
Develop, implement and evaluate public education campaigns to improve public
understanding of highway safety;
Conduct media and communications campaigns to increase public awareness and strengthen
enforcement efforts; and
Increase public awareness of traffic safety laws, such as seat belt usage, “move over”
legislation, which requires motorists to change lanes when law enforcement or first
responders are providing roadside assistance.
A Road Map for States 17Step Five: Decide Policies, Implement and
Evaluate
States should develop a
Finalize Priority Policies, Develop Work Plan and work plan or identify an
Implement
existing mechanism, such
States should develop a work plan or identify as the state’s strategic
an existing mechanism, such as the state’s highway safety plan or
strategic highway safety plan or other
statewide plan, to achieve the targeted goals. other statewide plan,
The plan should include: to achieve the targeted
• A process for coordinating the work of all goals.
agencies and entities involved;
• Evidence-based, data-driven interventions;
• Performance measures for evaluation; and
• An ongoing process for evaluation.
Monitor and Evaluate
Ensure that the strategy and intervention lead to the desired outcome. States may consider
creating a logic model to help determine whether a strategy will have its intended effect.
A MONITOR & EVALUATE
logic model is a visual representation that shows how inputs (e.g., policy strategies and
The figure below illustrates a sample logic model
interventions) are expected to lead to outputs (e.g., immediate consequences of the policy),
and how outputs are connected to outcomes (e.g., changes in the underlying problem).37
The resulting “causal chain” depicted by the logic model is a clear road map for how the
policy will solve the problem.38
The figure below illustrates a sample logic model.
CHANGE IN
STRATEGY: INTERVENTION: CHANGE: SOMETHING ELSE: DESIRED RESULT:
Law Enforcement
Enact Primary
Strengthen Officers Issue Increased More
Seatbelt
Traffic Safety Tickets To Seatbelt Lives
Enforcement
Laws Unrestrainted Use Saved
Laws
Occupants
States may also consider using performance measures to monitor and evaluate
implementation. Performance measures and other indicators track improvements and change
using an identified data source. Such performance measures may already be included in
strategic highway safety plans (SHSPs) and other safety plans; however, states may create
additional performance measures tailored to the priorities of the governor and the needs of
the state.
18 State Strategies To Reduce Highway And Traffic Fatalities And InjuriesTo assist in evaluation of its statewide safety plan, the Pennsylvania
Department of Transportation developed the Highway Administration
Performance Dashboard, which monitors high-level performance metrics. This
dashboard allows staff to analyze data, follow trends and adjust procedures to
achieve desired results. The plan includes performance measures identified in
the Fixing America’s Surface Transportation Act: the number of fatalities, rate
of fatalities per 100 million vehicle miles traveled, number of serious injuries
and rate of serious injuries per 100 million vehicle miles traveled.
A Road Map for States 19Index of Appendices
A. Examples of Key Decision Makers and Stakeholders
B. State Approaches to Engaging Stakeholders
I. Create a Task Force
II. Convene Statewide Traffic Safety Summits
C. Background on Current State Planning Efforts
D. Involving the Governor
E. Best Practices for Data Use
F. Safety in Infrastructure Planning
G. Safety in Innovative Technology
H. Motor Vehicle Prioritizing Interventions and Cost Calculator for States
Appendix A: Examples of Key Decision Makers and Stakeholders
Key Decision Makers
Governor; state transportation, highway safety, public safety and public health officials;
attorney general, judges, legislators, county commissioners, mayors
Examples of Key Stakeholders39
Federal Agencies
Centers for Disease Control and Prevention, Federal Highway Administration and
National Highway Traffic Safety Administration
State Agencies
Transportation, motor vehicle, health and human services, public health, trauma and
emergency medical services, public safety, behavioral health and mental health,
substance abuse, corrections, state police, education, aging, disability and related
existing task forces
Professional Associations
Emergency medical, hospital, police chiefs and sheriffs, prosecutors, public defenders,
state and local judges, trauma and advocacy groups
Local Entities
Local police departments; drug courts; county drug and alcohol services
coordinators; drug treatment organizations; community drug prevention coalitions
and task forces; family and peer support organizations; local departments of public
20 State Strategies To Reduce Highway And Traffic Fatalities And Injurieshealth, transportation, zoning and land use; injury health review boards; faith-based
communities; fire departments
Educational Institutions
Universities, community colleges, school district superintendents, high schools,
elementary schools, day cares
Private-Sector Entities
Technology and related transportation industries, restaurant associations, private
transportation companies, business community, safety advocates and other related
industries (i.e. beverage and where applicable, marijuana)
Appendix B: State Approaches to Engaging Stakeholders
Many entities, agencies and stakeholder groups play a role in traffic safety. States should
be sure to identify and engage stakeholders. Two ways that states can keep stakeholders
involved are by creating task forces on traffic safety and holding statewide traffic safety
summits.
Create a Task Force
States have found task forces, committees and commissions useful to maintain coordination
and collaboration among state agencies and stakeholders. These bodies may be charged
with ensuring cross-agency strategic planning of the state’s traffic safety goals. States could
consider either creating such groups or retooling or leveraging an existing one.
In creating a task force, commission or committee on traffic safety, states should:
• Designate highway safety professionals at the state and local levels as members;
• Ensure monthly communication between the governor’s office and the highway safety director;
• Improve coordination among the public safety, transportation and public health communities
to better develop, implement and evaluate state, regional and local safety plans; and
• Include a wide representation of stakeholders.
Arizona established the Governor’s Fatality Task Force in 2017 to develop
strategic measures to counter the increase in traffic fatalities experienced in
the state. The Task Force is led by the Directors of the Governor’s Office of
Highway Safety, Department of Transportation, Department of Public Safety,
Department of Liquor Licensing, Department of Insurance and Department
of Health Services. The Task Force will develop near-term and long-term
countermeasures to reduce traffic fatalities by analyzing cross-agency data.
The agencies have begun the process of clarifying and breaking down data
to identify root causes responsible for this increase, with the goal of finding
potential solutions to reduce the trend downward. Current data trends
indicate speed, impairment and failure to use seatbelts as significant factors in
A Road Map for States 21the increase, coupled with an increase in pedestrian, motorcycle and bicycle
fatalities. The Task Force will report back to the Governor’s Cabinet by the
end of 2017 and begin implementing projects and initiatives in 2018.
Colorado established the Colorado Task Force on Drunk & Impaired Driving
in 2006 to generate more collaboration and consensus for effective solutions
to the impaired driving problem in Colorado. The task force includes
professionals representing prosecutors, safety advocates, human services,
behavioral health, transportation, law enforcement, courts, defense attorneys
and public defenders and researchers.
Convene Statewide Traffic Safety Summits
A statewide safety summit is an opportunity to convene traffic safety policymakers and
stakeholders and to highlight the state’s goals. Participants can share best practices, explore
trends, discuss challenges and learn from experts.
Given the ongoing increase in fatalities, these summits should be hosted annually to ensure
safety policymakers and stakeholders have an opportunity to discuss updates and changes.
Each state’s summit should promote a shared vision and goal and connect regional and local
initiatives.
The state of Nevada holds an annual traffic safety summit to gather safety
professionals, partners and advocates from across the state. The summit is
focused on the goal of Zero Fatalities in Nevada. The summit also includes
a Nevada safety update, workshops, trainings and plenary sessions on
emerging and prevalent topics.40
Alabama held its first Safe Home Alabama Traffic Safety Summit in 2005.
In that year, 1,148 people died on Alabama roadways. In 2010, this number
was 848, a reduction of 26 percent. The Alabama traffic safety community is
committed to reaching zero deaths on its roadways and continues to focus
its summit on that goal.
Michigan has held annual traffic safety summits since 1995. Its 2017 summit
focused on the “4 E’s” of traffic safety—enforcement, education, emergency
medical services and engineering—and explored emerging trends and new
ways to keep road users safe.41
Appendix C: Background on Current State Planning Efforts
Currently, state departments of transportation develop plans regarding traffic safety
programming and funding that are submitted to the U.S. Department of Transportation
(DOT). In considering policies to improve safety on public roadways, states should review
these existing plans, consider how they may better coordinate and correspond with
programs and initiatives in other agencies (e.g., departments of public safety, public health
22 State Strategies To Reduce Highway And Traffic Fatalities And Injuriesand emergency and trauma services) and develop policies and goals that are inclusive of
these efforts and consistent across all agencies.
Strategic Highway Safety Plans
Strategic Highway Safety Plans (SHSPs) are developed by state departments of transportation
to establish statewide goals, objectives and key areas of emphasis. States must review,
evaluate and update SHSPs at least every five years and submit the plan to the Federal
Highway Administration for approval.42
The governor’s office should be an integral part of the SHSP planning process. SHSPs
should incorporate a cross-section of agencies, entities, stakeholders and public and private
partners. States should consider using the SHSP as a blueprint to develop statewide policy
priorities and implement strategies to reduce fatalities and injuries.
Highway Safety Plans
DOT’s National Highway Traffic Safety Administration (NHTSA) awards grants to states to
support efforts to improve occupant protection, improve state traffic information systems,
strengthen impaired driving countermeasures, decrease distracted driving, improve
motorcyclist safety and enhance graduated driver licensing initiatives.43 To receive funds,
highway safety offices of the 55 states and territories must submit annual highway safety
plans to NHTSA that outline programmatic priorities, performance measures and planned
activities for the next fiscal year.44
Highway safety offices are often housed in the state’s transportation department. The office
obtains information about programs administered by state and local agencies, maintains (or
has access to) information in state highway safety data systems and provides financial and
technical assistance to other state agencies and political subdivisions to develop and carry
out highway safety strategies and projects.45 Highway safety offices should engage directly
with governor’s offices on planning efforts towards the statewide goals.
Pennsylvania uses the Strategic Highway Safety Plan (SHSP) process to
create a coordinated, multiagency effort to sustainably reduce traffic
fatalities and serious injuries. Pennsylvania’s Departments of Transportation,
Health, Education and Drug and Alcohol Programs as well as its State Police,
Liquor Control Board and Pennsylvania Turnpike Commission participate.
These agencies are part of a safety team that approves the SHSP, oversees
implementation, administers accountability and meets quarterly to evaluate
the plan. The SHSP evaluation process also includes a steering committee
of over 40 stakeholders and partners.46 Pennsylvania’s plan targets Safety
Focus Areas that have the greatest potential to reduce highway fatalities
and serious injuries.47
In addition to these traffic safety plans that are submitted to the DOT, states also engage
in statewide planning efforts focused on motor vehicle injury prevention. For example,
the CDC funds 23 state health departments through the Core State Violence and Injury
A Road Map for States 23Prevention Program (Core SVIPP). Core SVIPP helps states implement, evaluate and
disseminate strategies that address the most pressing injury and violence issues including:
child abuse and neglect, traumatic brain injury, motor vehicle crash injury and death, and
intimate partner/sexual violence. The overall purpose of the Core SVIPP is to: decrease injury
and violence related morbidity and mortality; and increase sustainability of injury prevention
programs and practices. All 23 funded states are working in motor vehicle crash injury and
death prevention. States are addressing various topics including graduated driver licensing
and safe teen driving, increasing seat belt use, improving child passenger safety, preventing
impaired driving, employee safe driving and data linkage (linking crash data to hospital and
emergency medical service data).48
Appendix D: Involving the Governor
Ensuring public safety and the well-being of citizens is often seen as the primary responsibility
of government. As states’ chief executives, governors play a critical role in achieving that aim.
Encourage Statewide Collaboration
Collaboration is a key element of coordinated, effective safety planning. Governors can
ensure a collaborative approach to traffic safety by prioritizing safety as a state goal, using
their platform to raise awareness of traffic safety and ensuring a statewide approach to the
rise in traffic injuries and deaths. Governors should be briefed on traffic fatality numbers and
statistics, demographics of at-risk populations and encouraged to address the importance
of traffic safety in public addresses.
These efforts should focus on improving injury prevention through cross-agency coordination
of public safety, public health and transportation agencies and facilitating a climate of data
sharing. To create a collaborative data-sharing environment, governors and their staff should
be aware of strategies to increase information sharing, eliminate the barriers to achieving the
state’s goals and communicate information to stakeholders and the public.
Specifically, governors and their policy advisors can improve cross-agency collaboration
by:
• Raising public awareness of the rise in the number of traffic fatalities;
• Identifying statewide and cross-agency strategies that the state can pursue;
• Promoting and encouraging the use of best practices and policies regarding safety;
• Increasing access to and organization of data systems across agencies to optimize their utility
for addressing public health and traffic safety issues; and
• Encouraging a comprehensive, cross-agency strategic highway safety planning process.
Invest Adequate Resources
To effectively execute statewide plans to reduce traffic fatalities and injuries, states should
provide adequate resources for traffic safety policies, programs and trainings.
24 State Strategies To Reduce Highway And Traffic Fatalities And InjuriesParticipate in Events and Activities
In addition to providing leadership and creating a vision, governors can bring awareness to
traffic fatalities and injuries by participating in state-hosted events and activities, including:
• Attending task force meetings, summits and other stakeholder meetings;
• Visiting sobriety checkpoints and other high-visibility enforcement events with state and local
law enforcement officials;
• Encouraging monthly briefings on traffic crash data; and
• Issuing traffic statements and safety messages from the governor’s office.
Appendix E: Best Practices for Data Use
Data analysis is important to support policy efforts and Governors should
inform decision making. Governors should empower empower officials
officials to create data use agreements and share to share information
information among state agencies in a way that breaks
down silos. Such efforts enable transportation, public among state
safety and public health experts to better understand agencies in a way
trends through data collection analysis, training and that breaks down
outreach. In addition, breaking down silos allows for
effective data sharing and development of systems to silos.
link traffic crash data with medical injury data.
Use data to drive and support policy decisions.
Data analysis can assist in identifying resource gaps and problem areas. Use these facts to
inform, implement and support necessary policy changes, program implementation, and
targeted messaging.
The state should encourage best practices and standards for data collection and
accessibility that include:
• Ensuring data-informed decision-making;
• Emphasizing collection of-data on crashes;
• Ensuring data are available from different types of data sources;
• Securing real-time data that are collected and analyzed to help reduce injuries and fatalities;
• Improving reporting of severe injuries from traffic crashes;
• Linking law enforcement, emergency medical and transportation stakeholders to helpful data;
• Instituting data-use agreements to ensure data is shared between agencies; and
• Considering partnering with research universities to improve collection and analysis.
A Road Map for States 25You can also read