Uniting the Bay - Pukerua Bay, New Zealand
←
→
Page content transcription
If your browser does not render page correctly, please read the page content below
Uniting the Bay
PUKERUA BAY NEIGHBOURHOOD ACCESSIBILITY PLAN
Porirua City Council, Pukerua Bay Residents Association
June 2008
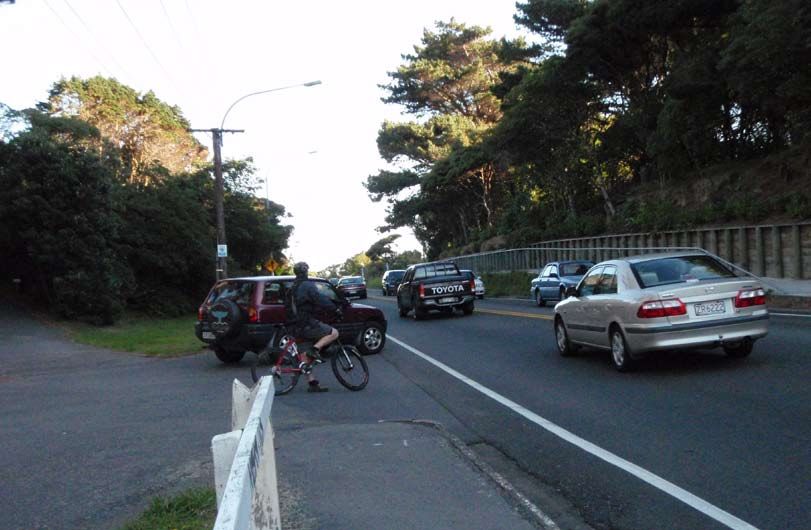
“ Crossing or getting onto State Highway 1 is becoming an ever-increasing problem
for everyone who lives in Pukerua Bay. State Highway 1 divides our village.
”
Pukerua Bay resident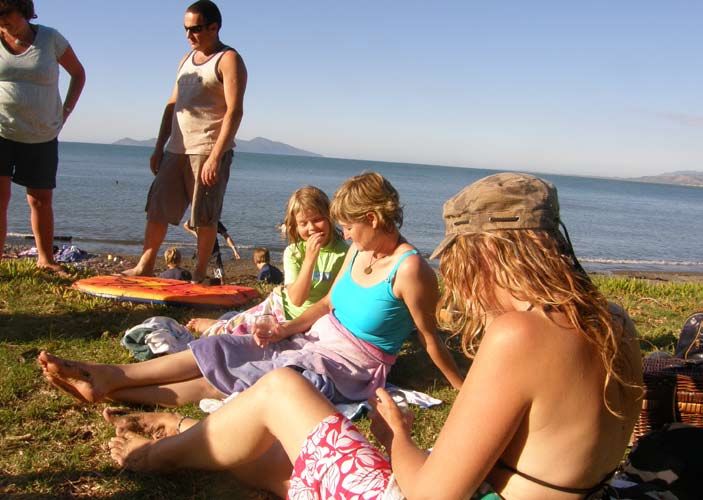
Acknowledgements:
Pukerua Bay Residents Association Sub-committee – Graham McLaughlan,
Dagmar Pesendorfer, Kate Dreaver, Robyn Moore

Porirua City Council – in particular project co-ordinators Ian Barlow and Sue Driver,
and designer Natalie Bould

Photographs: Robyn Moore

LTNZ for contributing to funding this report.
Contents
Foreword.................................................................................................................................4

Introduction............................................................................................................................5

The Issues ...............................................................................................................................7

Background...........................................................................................................................12

Guiding Strategies and Policies..............................................................................................25

The Proposed Neighbourhood Accessibility Plan....................................................................25

What is Already Being Done...................................................................................................28

Neighbourhood Accessibility plan proposals..........................................................................32

Appendices............................................................................................................................38
1. Framework for Neighbourhood Accessibility Plan
2. Pukerua Bay Village Plan 2007
3. Pukerua Bay Village Survey 2006/07
4. Household Survey April 2008
5. Guiding strategies and policies to be considered in the development of options
6. Teihana Road Pedestrian Facilities Consultation Summary (draft) Transit New Zealand June 2005
7. Ara Harakeke Walkway and Cycleway Plans
Foreword
    Managing the urban environment requires an integrated, adaptive,
    coordinated and above all participatory approach. Current urban planning
    increasingly reflects this understanding, but the rhetoric does not always
    translate into successful action.
    This Neighbourhood Accessibility Plan was an inspired idea that has been
    realised through the combined efforts of a diverse group of people, who
    nevertheless share a common goal – for a safer, well connected community.
    This Plan is about ensuring sustainability, both social and environmental.
    It is a Plan for the future, a plan that achieves the best possible outcomes for
    the broadest range of people. We view our Plan as a way forward; as a prime
    example of a coordinated, careful, and credible approach to a complex and
    long standing problem.

    Pukerua Bay Residents Association
    May 2008
Introduction
Having the country’s main highway dissect your community presents a number of problems.

The safety and mobility of pedestrians, cyclists and motorists and the social and psychological
impacts of community severance are all impacts that need to be urgently addressed in
Pukerua Bay.

Over many years, the community of Pukerua Bay has worked to identify the problems
associated with State Highway 1 (SH1) and has advocated for their mitigation. With the
current understanding that, even with Transmission Gully, traffic volumes along the Pukerua
Bay stretch of SH1 will remain high, there is a new urgency to address the impacts of the
highway.

This Neighbourhood Accessibility Plan brings together the work of the community, Porirua
City Council, Transit New Zealand and Land Transport New Zealand. It recommends actions
to mitigate the impacts of SH1 on the Pukerua Bay community, while addressing wider and
connected issues of environmental sustainability and positive health outcomes.
Purpose Statement
    The community’s picture for the future is for Pukerua Bay to be better connected and a safer
    community for pedestrians, cyclists and motorists whilst at the same time acknowledging the need
    for greater safety and efficiency for SH1 traffic. The community also wishes to make a positive and
    lasting contribution to the sustainability of the planet.

    Approach
    The approach to developing this Plan has been for the Pukerua Bay Residents Association and
    community, Porirua City Council, Transit New Zealand and Land Transport New Zealand to
    work together to:

    1    Identify cyclists’, pedestrians’ and motorists’ safety and access problems (real and
         perceived) in the community
    2    Identify the extent to which these contribute to community severance and impact on
         community connectedness
    3    Identify current initiatives that are contributing towards the mitigation of some of these
         impacts and
    4    Develop and recommend actions that will mitigate these impacts.
    The possibility of developing a Neighbourhood Accessibility Plan was raised at a meeting
    held between the Resident’s Association, Porirua City Council, Transit New Zealand and Land
    Transport New Zealand in November 2007.

    Subsequent meetings were held between the four parties in early 2008 and agreement
    reached on the framework for developing the Plan. In these discussions it was acknowledged
    that a considerable amount of consultation and research had already taken place to
    identify issues, priorities and actions and that these would form the basis for the Plan. The
    development of the Plan has been steered by a sub-committee of the Pukerua Bay Residents
    Association and Ian Barlow from Porirua City Council.

    Limited scope
    In the process of developing the Plan a number of issues were raised that fall outside the
    scope of the Plan. However these are important issues that require further discussion and
    action. Amongst them is the question of a bypass: the need for a bypass rated highly with
    respondents to the April 2008 Survey. In a recent Transit New Zealand report it was noted
    that “it is unlikely that any decision will be made on the future bypass until decisions on
    Transmission Gully are made”.

    Objectives of the Plan
    The objectives of this Plan were developed in line with the neighbourhood accessibility plans
    operational policy guideline of Land Transport New Zealand. The objectives are as follows:

    1    To make it safe to travel from one side of Pukerua Bay to the other, improving the
         connections and mobility of residents
    2    To promote safe walking and biking within Pukerua Bay
    3    To improve safety for pedestrians and cyclists
    4    To promote the use of public transport
    5    To reduce environmental emissions by reducing the reliance on short distance car trips

    	   Appendix 1
    	   Transit New Zealand SH1: Pukerua Bay Safety Improvements – Proposed Intersection Upgrades at Gray St, Teihana Rd
         and Pukerua Beach Rd – Scheme Assessment Report, P7, Section 3.4: February 2008.
    	   Neighbourhood Accessibility Plans – Operational Policy. Land Transport New Zealand July 2007.
6 To increase the number of pedestrians, cyclists and public transport users in the
community
7 To seek solutions that enhance the environmental landscape and contribute to the strong
sense of community in Pukerua Bay
8 To support the efficiency (environmental emissions) and safety for traffic using SH1
The Issues
Driving A Wedge Through The Community
In New Zealand, the concept and understanding of community severance as it relates to the
impact of roads and traffic is relatively underdeveloped. Our knowledge is largely informed by
overseas research.
Many definitions of community severance exist but research has indicated that the concept
of community severance is much more multifaceted than the division by, for example, arterial
roads of people from services. In the UK report Understanding Community Severance: Views
of Practitioners and Communities it is noted that if a large or increasingly busy road cuts
through an area it can have the effect of driving a wedge through a community. This can limit
people’s ability or desire to move through that area, which in turn can reduce accessibility to
services and damage local social networks and community ‘cohesion’. The UK Department
of Transport Social Exclusion Unit (SEU) report ‘Transport and Social Exclusion: making the
connections’ (2003) states that it is the cumulative impact of psychological and physical
barriers to movement and social participation created by the transport infrastructure that
constitute ‘community severance’.
Severance reduces the viability of non-motorised travel modes. The Victoria Transport Policy
Institute in their research suggests that severance imposes a number of costs to pedestrians,
cyclists and residents and notes that in several countries attempts have been made to quantify
these costs in financial terms.
Understanding the impacts of severance to a community is seen as a prerequisite to
determining the options and actions to mitigate those impacts.
Consideration of mitigation measures are not just confined to physical solutions such as
bridges or underpasses; other measures such as information campaigns, signposting,
environmental enhancements, community activities/actions also have a role to play.
Considering a total ‘mitigation strategy’ rather than individual mitigation measures is an
effective way of dealing with the various aspects of severance.
Community Severance In Pukerua Bay
Overseas studies have indicated that traffic volumes of 16000 vehicles per day/500 vehicles
per hour create unfriendly streets and make a significant contribution to community
severance. Current levels in Pukerua Bay are around 22000 vehicles per day.
Even with Transmission Gully, the daily numbers will remain at a daily level of 17000 vehicles per day.
The Pukerua Bay community has identified the multiple impacts on their village of SH1 and,
together with Transit New Zealand, have identified significant safety issues with crossing from
one side of the community to the other, particularly at peak times.
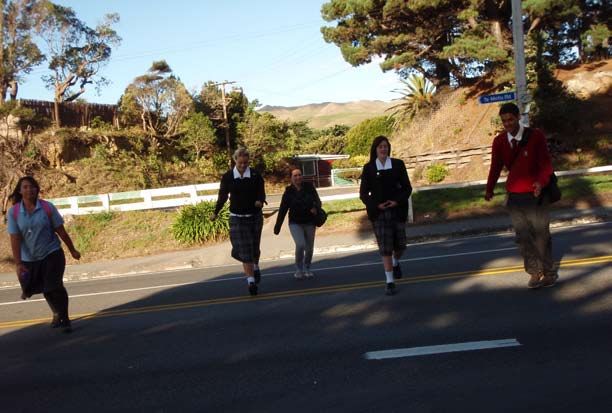
Parents on the eastern side of the village feel unable to let their children go to primary
school, to the shops or to activities such as scouts by themselves and often elect to use cars
to transport their children. Parents worry about their teenagers going to college, particularly
in the morning peak hour when they cross at grade from the western side of the village to
the railway stations’ side. And although the accident statistics are relatively low, residents talk
about a number of near misses when crossing SH1.
Understanding Community Severance: Views of Practitioners and Communities. Emma James, Anya Millington and Paul
Tomlinson (TRL Ltd) for the Department for Transport (UK).
Transportation Costs and Benefit Analysis – Barrier Effects Victoria Transport Policy Institute Canada (www.vtpi.org) May
2007.
Fergus Tait (Transearch May 1996) – Appendix 6, Evidence at Mana Esplanade Hearing.
Residents express surprise that there has not been a death on the road. Local motorists have
    also identified major concerns over turning into SH1 from the Gray Street, Teihana Road West
    and Pukerua Bay Beach Road intersections, particularly at peak times. Long delays and unsafe
    manoeuvres have been identified and confirmed by Transit New Zealand studies of the area.

    Severance in the community is also contributed to by the Main Trunk Railway line, which
    passes to the east of SH1. This major transport link passing through the village, is not referred
    to in either survey, the only reference made being to young people bypassing SH1 by walking
    alongside the train track and going under the Pukerua Bay overbridge. This lack of reference
    could be due to several factors, including the focus of the surveys, severance issues caused
    by the Main Trunk Line being minor relative to those caused by SH1, the community’s sense
    of urgency to mitigate SH1 impacts and the reality that any severance impacts caused by the
    main trunk line are not able to be easily mitigated.

    The major arterial route is not just a physical barrier for pedestrian, cycle and vehicle
    movements – it has social and psychological implications for the community and is an
    impediment to the sense of community and social cohesion. There is no easy way to get from
    one side of the community to the other. Young people find it difficult to drop in on friends
    or play at the local park. Parents’ desire to build their children’s confidence and sense of
    responsibility through simple tasks such as sending them to the dairy or allowing them to go
    to cubs, or bike around the area, are curtailed by the perceived danger of SH1.

    Census data indicates that people over 65 years of age are an increasing proportion of the
    community. Although statistics are not available, there are also residents in the community
    whose disabilities affect their mobility. SH1 presents particular risks for older people and those
    with disabilities – the location of and access to the existing overbridge makes it difficult for
    them to use.

    Current and proposed subdivisions in the community will exacerbate the current situation.

    Pukerua Bay is as close as one gets to an eco-village in a suburban setting in the Wellington
    region. The focus of the Residents Association on the development of a number of walkways
    and the advocacy of the marine reserve; the activities of the Pukerua Bay Primary School
    including their Walking School Bus, pupil’s research projects and cycling project, point to a
    community that is conscious of both their environmental footprint and their health. These
    activities have contributed significantly to the social cohesion of the area and to some degree
    offset the negative impacts to social cohesion of SH1.

    Safety and Access for Pedestrians and Cyclists

    Crossing SH1.
    State Highway 1 forms a formidable barrier for pedestrians and cyclists trying to cross the
    highway.

    More specifically:

    1    Apart from the flush median and pedestrian refuges at the north end of the Village, there is
         no median to provide temporary refuge between lanes when crossing the highway, especially
         where the pedestrians are currently crossing to access the railway stations
    2    Sight distances for crossing pedestrians are limited
    3    Waiting times for pedestrians are long, particularly at peak times
    4    Young people, older people and those with disabilities are particularly at risk in crossing SH1.
         Difficulty of access means the overbridge is not a viable option for many older people and
         those with mobility disabilities
    5    At Teihana Road, the crossing of the highway is complicated by the adjacent intersection and
         southbound right turn bay
    6    Peak weekday and weekend traffic on the state highway exacerbate this situation. In 2006,
         daily levels were at around 22000. Modelling by Greater Wellington Regional Council
         suggests volumes in 2016 could reach 26000 without Transmission Gully, or 17000 by 2021 if
         Transmission Gully is built
    	   SH1: Pukerua Bay Safety Improvements – Proposed Intersection Upgrades at Gray Street, Teihana Road and Pukerua Bay
         Beach Road – Scheme Assessment Report February 2008.
    	   SH1: Pukerua Bay Safety Improvements Proposed Pedestrian Facilities – Scheme Assessment Report Transit New Zealand
         December 2007.
7 Speeds within Pukerua Bay are often in excess of 50 km/h at the points where the majority of
crossing movements are occurring
8 Visibility is impaired by vegetation and the road’s winding course
9 Lighting is inconsistent and poor at critical points, namely intersections and at the existing
overbridge
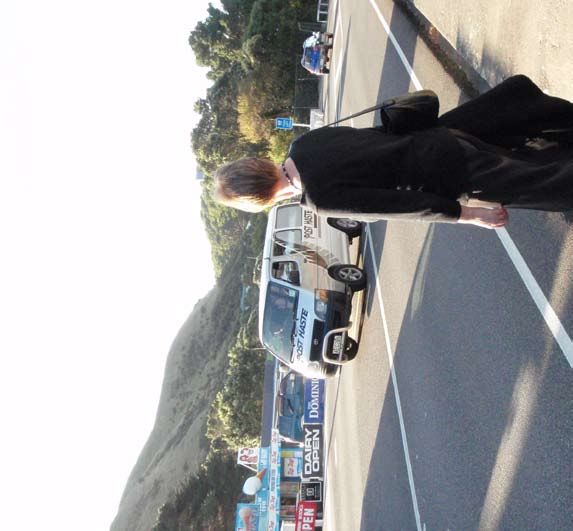
10 The only shopping area at Pukerua Bay is on the northwest side of the Teihana Road West/SH1
intersection. Although small, it still attracts both vehicle and pedestrian traffic. Many of these
pedestrian users are crossing the state highway at Teihana Road. Some of them also come
from or continue on to the rail station, while others access properties on the east side of the
highway
11 The two railway stations that service Pukerua Bay (Pukerua Bay and Muri stations) are on the
east side of the township, which requires rail commuters living on the more populated west
side of the highway to cross SH1
12 The only overbridge to cross the highway lies approximately halfway between the two
stations. This overbridge serves the school and some train commuters, but does not naturally
serve the commuter catchments at the north and south of the village
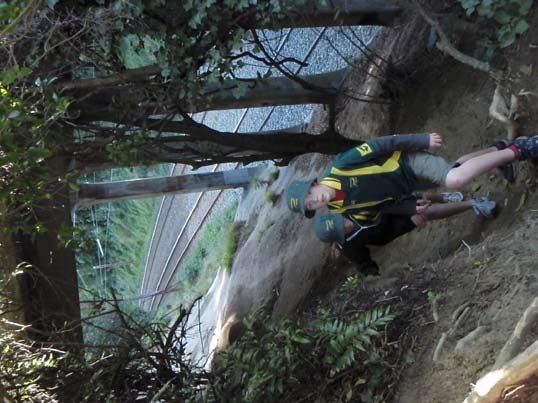
13 Young people have created their own informal pedestrian path to access the railway station
and community facilities, crossing under the SH1 overbridge to the south of the village
Alongside State Highway 1
The footpath along SH1 is narrow, poor quality in parts and feels dangerous.This is particularly
apparent where footpaths meet SH1 – for example, at Wairaka and Pukerua Beach Roads.
There is no continuous cycle path in Pukerua Bay connecting the north and south of the
community, more specifically, connecting the Ara Harakeke walkway/cycleway with the cycle
path along Centennial Highway
Cyclists tend to ride on the footpath, as the main road is too dangerous
There is a great safety concern regarding the Haunui Road/SH1 connecting walkway – it is a
steep zigzag path with no barrier at the bottom end (SH1), which makes it a safety hazard for
people running or cycling down the path
Pedestrians crossing Wairaka Road cannot be seen by motorists turning off SH1 into this road.
Almost all motor vehicles travel at or above the speed limit coming down the hill slope of
SH1. This speed does not provide adequate braking distance when turning into Wairaka Road.
Safety and Access for Motorists entering into SH1
Residents have identified four problem intersections: Gray Street, Teihana Road, Pukerua
Bay Beach Road and Wairaka Road. Transit New Zealand has undertaken assessments and
options for Gray Street, Teihana Road and Pukerua Beach Road. The main problems of the
intersections are described as:
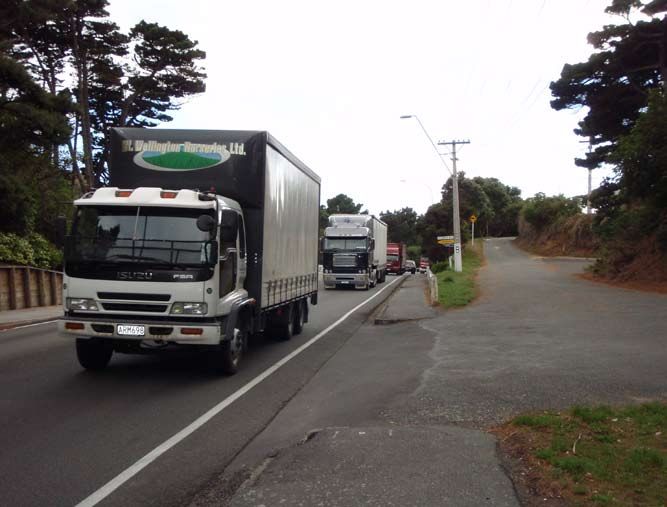
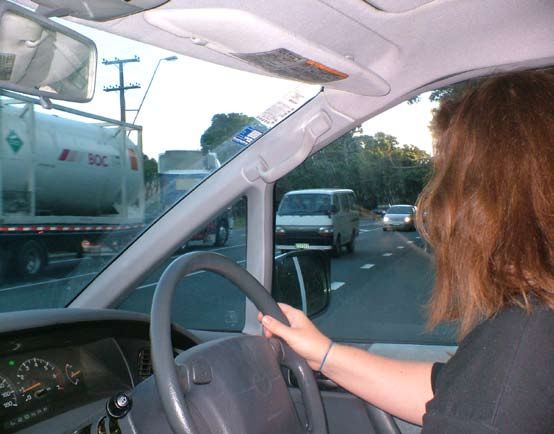
Drivers turning right out of side roads have trouble merging with through traffic. Although
right turn bays are provided at Gray St, Teihana Road and Pukerua Beach Road, the
acceleration lanes downstream of the right turn bays are narrow and relatively short. This
results in many right turners stopping or slowing down in the middle of the highway, waiting
for a gap in through traffic
Larger vehicles turning right need to negotiate a gap in the traffic in both directions before
turning
There is no taper for left turns into to Teihana Road West, which can impede following
through traffic
At Gray Street, the proximity of the 100km/h zone with traffic still decelerating and the
proximity of the rail overbridge results in right turning traffic from Gray Street having a very
restricted acceleration path
At Pukerua Beach Road, the skew angle of the side road forces most traffic turning left from the
side road to encroach on the right turn bay. Also, because entry to SH1 is on an uphill slope,
accelleration is slower and there is a greater likelihood of stalling in front of fast-moving cars.
The approach to SH1 from Pukerua Beach Road is steep, which impedes sight lines and makes
it more difficult to stop or accelerate
The high volume of traffic, especially through AM and PM peaks, on fine days and long
weekends, makes it difficult for side road traffic to join SH1, resulting in considerable traffic
delay for these cars. This causes driver frustration and can lead to unsafe turning manoeuvres.
Traffic demands on this stretch of road are predicted to increase at approximately 2 percent
per annum
Turning right into Wairaka Road from the north is difficult for those accessing pre-school
services. There is no turning bay, the road is narrow, visibility limited and cars tend to drive
above the speed limit.
SH1: Pukerua Bay Safety Improvements – Proposed Intersection Upgrades at Gray Street, Teihana Road and Pukerua
Beach Road – Scheme Assessment Report: Transit New Zealand February 2008. The description is taken from the report.
Additional comments about Wairaka Road are from survey information.
10Environmental Sustainability and Healthy Living
SH1 is a significant barrier to environmental sustainability and healthy living, specifically
because:
Real and perceived dangers associated with SH1 discourage walking and cycling in the area
Opportunities to develop young peoples’ independence are curtailed
Unnecessary short-distance car runs ferrying children to and from school, clubs and friends
mean cars are less efficient, and emissions are increased by more usage
Cars on SH1 are held up by right turning traffic, causing greater pollution than free moving
traffic, which would be enabled by safe turning bays and separate walking and cycling lanes
In addition, there are limited park and ride facilities at the Pukerua Bay station and basically
none at the Muri station. Distance from the stations as well as the need to carry shopping
and work-related material means that many choose to park and ride, rather than walk,
to the stations. However, lack of facilities limits even this as an option for some, who may
alternatively decide to take their cars to work instead, or go to a station south or north of
Pukerua Bay to find sufficient park and ride facilities.
11Background
“A Community Split In Two”
Pukerua Bay has lived with SH1 bisecting its community for over 60 years and over that
time witnessed the steady increase of the impacts of the highway on their community as
the volume of traffic along SH1 continues to grow. Together with SH1, the Main Trunk
Railway line also passes through the community to the east of SH1.The resulting severance,
real and perceived, caused by the nation’s main highway and main trunk line dissecting the
community has impacts on mobility, safety and community connectedness.
Pukerua Bay is often referred to by residents as the “village”. It is a community with a strong
sense of identity and engages in a wide variety of local activities and issues beyond what
might be expected of a community of its size. Protecting and enhancing the environment and
achieving sustainability underpin a number of local projects initiated and led by residents and
the Pukerua Bay primary school.
There is an active, long-standing Residents Association involved in a wide range of activities,
including the Village Plan and managing the Pukerua Bay website. Over several years the
community, through its Residents Association, has worked closely with Porirua City Council
and Transit New Zealand to better understand their unique accessibility issues and to find
workable and sustainable solutions. There is general agreement between the community,
Porirua City Council and Transit New Zealand as to what the issues are and their severity.
12Transit New Zealand has undertaken research and analysis of the issues and developed options
to address some of them. Despite acknowledgement that there are serious severance, mobility
and safety issues for the community and that these will only be exacerbated by future traffic
growth, the narrow criteria of Cost Benefit Ratio (CBR) analysis means that the required ratio
of 1 to trigger funding has not been reached. However Land Transport New Zealand advised
the Western Corridor Plan Hearings Committee that:
“Land Transport New Zealand has no general policy that prevents funding of activities with
Benefit/Cost Ratios of less than 1.
However, the Allocation Process requires that all improvement projects be assessed against
three factors:
1. The seriousness and urgency of the transport issue or problem addressed
2. The effectiveness of the proposed solution in dealing with the issue
3. The economic efficiency of the proposal.
Economic efficiency is represented by the benefit/cost ratio (BCR) of the project (or package
of projects).
Each activity is assessed against these factors and given a “profile”. Each year Land Transport
determines the threshold profile for funding, depending on the funds likely to be available for
the NLTP. Any examples with BCR significantly less than one would have to have very high
ratings for seriousness and urgency and effectiveness to be considered for inclusion in the
NLTP or later for funding approval.
With regard to Crown funding, Land Transport’s Programme and Funding Manual states
“Land Transport NZ may use different thresholds for activities funded using regionally
distributed, or Crown funds than those funded using nationally distributed funds.” In
practice, this usually means acceptance of a lower threshold for BCR. However a decision
to fund at significantly below 1 could only be taken by the Land Transport Board and only
after consideration of the profile of the activity and its contribution to the objectives of the
NZTS.10”
10 Proposed Western Corridor Plan: Hearing Sub-committee’s Report March 2006, p57.
13An Overview of Pukerua Bay Village
The Community’s Vision
Community of choice for residents and families seeking a friendly, small village in a peaceful,
unspoiled natural setting, supported by good local infrastructure and facilities11.
Setting
Pukerua Bay is a small seaside community at the southern end of the Kapiti Coast. In local
government terms it is the northernmost suburb of Porirua City, 12 km north of the Porirua
City Centre on SH1, and 33 km north of central Wellington.
The majority of Pukerua Bay is situated in a saddle between hills, about 60–90m above sea
level. The coast around Pukerua Bay is fairly steep, with only a few houses nestled in a row
behind the two sandy beach areas. In Maori, the words puke rua literally mean two hills. It is
not clear, however, which hills the name refers to.
The community has a young population with a growing middle aged group moving into
retirement. It is a commuting community with a significant number of residents commuting
by train to work or for secondary and tertiary education. Income levels in the community are
above the regional median.
History
The earliest people known to have lived at Pukerua are the Ngati Iri, who built a pa near
today’s Pa Road. Later, the Muaupoko settled in the area near what is now the northern end
of Rawhiti Road. In the 1820s Ngati Toa defeated the Muaupoko and settled in the area where
the iwi continue today as the mana whenua.
In 1849, the coach road north – today’s Paekakariki Hill Road – was opened, bypassing
Pukerua. The only access to Pukerua was by a foot track from Taupo (today’s Plimmerton).
In 1927, Pukerua Bay School was officially opened and electricity put through from
Plimmerton to Pukerua Bay. Hutt County Council authorised the erection of 13 street lamps.
The road from Plimmerton (known as the Old Pukerua Road) was properly formed in 1928.
In the 1950s and 1960s, Pukerua Bay saw significant growth of its residential population. The
completed highway and electric train services made Pukerua Bay a viable choice to live for
people commuting to work to Wellington. The present group of shops between Rawhiti Road
and SH1 was built in 1969.
The 1970s saw significant changes and additions to the community. The community
joined Porirua City, mainly to ensure that water and sewerage infrastructure concerns were
addressed. Work was completed in 1984.
The overbridge over SH1 near Wairaka Road was opened on April 3, 1989, after a long fight
by local residents, which included such measures as continually walking across the pedestrian
crossing to hold up traffic.
For some twenty years, land to the east of Pukerua Bay was designated for a bypass route for
SH1. The designation was in recognition of the projected levels of traffic predicted for SH1,
and the impacts this would have on the community. As recently as 2006 at hearings for the
Proposed Western Corridor, a 2 and 4 lane bypass at Pukerua Bay was considered. However
the Hearings committee12 rejected this proposal in favour of safety improvements. The
Hearings Committee’s recommendations have been adopted as part of the Greater Wellington
Regional Council’s Land Transport Strategy Western Corridor Plan.
11 Pukerua Bay Village Plan, 2007.
12 Proposed Western Corridor Plan, Hearing Sub-committee’s Report, March 2006 P3, Table 1. Pg 45 – “SH1 currently
divides the Pukerua Bay community. There is both a bottleneck at Pukerua Bay which has emerged since the opening of
the Mana Expressway and a need to reduce speeds through the village to reduce traffic related injury and enable local
access. We have already observed that the Pukerua Bay community and submitters do not see the various proposals for a
bypass as acceptable. We note that they believe any severance effects associated with the current road can be mitigated
by the provision of additional underpass, or pedestrian overbridge facilities or lights. We would encourage those
proposals to be discussed at an early stage with the Pukerua Bay community. Pukerua Bay submitters said that they would
accept the current problems with the bottleneck, which has developed since the opening of the Mana expressway, if the
works noted above were undertaken combined with a firm commitment made to proceed with TGM.”
14The Western Corridor Plan, which is a Greater Wellington Regional Council (GWRC) strategy,
identifies three initiatives that directly affect the Pukerua Bay community. These are:
The proposed upgrade of train rolling stock
Increased frequency of commuter train services during peak times to every 15 minutes
Implementation of safety improvements in Pukerua Bay (with an indicative figure of $2M from
central government given).
Consistent with the concerns outlined, Transit New Zealand has undertaken a number of
studies in relation to vehicle movements and pedestrian and cyclist’s safety in Pukerua Bay.
Throughout this period, Pukerua Bay residents and the Pukerua Bay Primary School have been
active in not only identifying issues but in addressing them through a number of projects and
activities.
Community Facilities and Services
There are a number of community organisations, educational services and businesses in
Pukerua Bay.
Community Organisations and Services Education Businesses
Pukerua Bay Residents Assn Pukerua Bay School American Motorcycles
Pukerua Bay Website Pre-School Mr Carrad’s Farm
Walking School Bus Playgroup Flower growers
Cubs and Scouts Kindergarten Huntleigh Down Deer Farm
Tennis Club UCA Children’s Music and
Toy Library book distributor
Monday Playgroup The Wool Shed
Pukerua After School Care The Red Shed farmstay and
Pukerua Bay soccer rental – Mosaics and pottery
Pukerua Bay netball workshops
Pukerua Bay basketball Pukerua Bay Store
Folk Club Reds Hairdressers,
St Marks Church Pukerua Bay Glass Studio
St Marks Friendship Group Cattery
St Marks Youth Group Springhill Dance Academy
St Marks Coffee Morning Archways Book Store
Pukerua Bay Skate Inc. Multiple small businesses
RSA Wairaka Rd
Keep Porirua beautiful
Historical Group
Ecological Group
Secret Valley Conservation Grp
Nga Uruora Trust
Methodist Church
Pukerua Bay Library
“ We don’t use
our local shops,
basically because
we don’t enjoy the
walk, i.e. crossing
the highway.
15Public Transportation
The community is served by two railway stations – Pukerua Bay Railway Station to the south
and Muri Railway Station to the north. Parking is available for approximately 15 cars at
Pukerua Bay Railway Station. There is no parking available at Muri Station. Trains run every 20
minutes in peak times.
In addition, there is a bus that takes some young people to Kapiti College and another that
takes children to the Steiner School.
Future Growth
A new housing subdivision on the east side of SH1 (St Mary’s Housing Development) with
45 sections has been approved and development begun with 10 new houses having been
built to date. In addition, on the eastern side of SH1 there is a small block of land (Kays Farm)
that is zoned residential but is undeveloped. A further development has been indicated by
the owners of Carrads farm on the western side of the highway, which would add significant
development at the southern end of Rawhiti Road if approved.
Pukerua Bay – A Destination For The Region
In addition to being a through route for SH1, Pukerua Bay has a number of destinations that
attract the wider regional population including:
Wairaka Reserve
Brendan Beach
Brendan Beach walkway
Muri Reserve
Greenmeadows Park (soccer)
Tennis Courts
Secret Valley (Waimapihi Stream)
Raroa walkway
Coastal walkway
Skate Park
Archway Book Shop
In addition, there is the popular Ara Harakeke Cycle Way which begins in Plimmerton and
currently finishes at the southern end of Pukerua Bay. Also, tours often visit Peter Jackson’s
family home and the beach and hillside locations where his early ‘splatter’ movies were shot.
Environmentally Aware Kids
Pukerua Bay School is an Enviro School. The school won the Green Gold Enviro Award in
March 2008 and is the first school in the region to do so. Students, staff and the parent body
are fully committed to exploring and implementing sustainable practices across a wide range
of areas.
The students identified two years ago that there needed to be a reduction in the use of fossil
fuels and decided to lead by example.
In order to reduce the number of cars bringing students to school, the school has put in
place a number of initiatives, including the Walking School Bus which involves parents being
rostered to pick up children along three routes and take them to school.
The students also identified the need for students to choose an environmentally friendly way
to get to school. They designed and had built four large sets of bike stands and the school
runs a bikewise programme.
16“ We have major safety concerns as our school community is divided by this road and
on a daily basis we need to get our students safely to and from school, while strongly
promoting the practice of walking or biking to school. Any efforts to reduce the
impact of this major hazard would be fully encouraged from our perspective. .
Pukerua Bay Deputy Principal
Census Data
Total Population and Households
At the 2006 census, Pukerua Bay’s population was 1716. Since the 1996 census there has
been a steady increase in the population (5.7 percent). There are a total of 621 households,
fifty three percent of these being on the west or coastal side of SH1.
The average household size is 2.8 compared to 3.1 for Porirua City and 2.7 for New Zealand.
Age
For the period over the last three censuses there have been increases in the younger and
older age groups with a decline in 20–39 age groups. Currently 8 percent of the population
is between 0–4, (nationally the figure is 6.7 percent) and16 percent between 5 and 14 years
of age. There has been a steady increase in those 40 years of age and over with 8.3 percent of
population over 65 and significant increases in the 45 – 64 age group.
Income
The median household income in Pukerua Bay is $67,900, compared to $62,400 for Porirua
City and $51,400 for New Zealand.
Car Ownership per Household
Over 50 percent of households in Pukerua Bay own two or more vehicles. This percentage is
understandable as Pukerua Bay is predominantly a “family” community with limited public
transport and work places. Most commercial services and secondary and tertiary education
institutions are several kilometres away.
Percentage of Car Ownership per Household 2006
No Vehicle One Vehicle Two Vehicles Three Vehicles
Pukerua Bay 3.3% 41% 39% 13%
Porirua City 10% 35% 35.5% 13.5%
New Zealand 8% 36% 36% 15%
Means of Travelling to Work
Pukerua Bay has an above average number of people working from home. The position and
nature of the community as well as anecdotal evidence suggests that the lifestyle and rural
feel of the community is attractive for those seeking to work from their homes. For those
who commute to work, use of private vehicles is lower than both Porirua City and the rest of
the region. A high uptake in the use of public transport (18 percent) and to a lesser extent an
above average number of people working from home (8.5 percent) accounts for this.
The comparatively lower number of people biking or walking to work is accounted for by the
location and distance of Pukerua Bay to the main centres for employment in the region.
The use of public transport by college and tertiary students travelling north or south by train
or bus is not captured by census data. As all college aged and tertiary students have to travel
out of the community, then it can be assumed that a large percentage of this group (approx
250) do so by train or bus.
Comparing car ownership figures (above) with means of commuting to work it can be reasonably
concluded that despite multiple car ownership, many commuters prefer to use public transport.
17Percentage of Total Main Means of Travel to Work 2006
Work at Home Private vehicle Passenger Private vehicle Walk Bike Public Transport
Pukerua Bay 8.5 49.7 3.7 1 18.7
Porirua City 4.9 54 7.5 3.3 11.4
Wellington Region 5.7 48 5.3 10 13.4
“ Make it easier to get from railway station at Pukerua Bay to the shops without
having to walk down to the overbridge. People endanger their lives trying to walk
across the highway.
National Statistics and Trends13
In assessing the current situation in Pukerua Bay as well as options, key statistics reflecting
patterns of travel at a national level are of assistance.
75 percent of trips made are by motor vehicle, one third of these trips are under 2kms in
length and two-thirds are less than 6kms (New Zealand Travel Survey);
Walking accounts for 20 percent of all household travel trips, and 25 percent of walking trips
are made by children, young people and seniors (NZTS);
Cycling accounts for 2 percent of all trips, mostly made by children and young adults (NZTS)
– but there is evidence in Porirua that most cyclists are adults;
Domestic transport contributes 42 percent of total CO2 emissions and accounts for 40
percent of total energy use for New Zealand (NZTS);
Between 1990 and 1998 the number of cycling trips in New Zealand reduced by 39 percent
(NZ Walk/Cycle Strategy) and New Zealanders undertook approximately 400,000 fewer
journeys solely on foot per day (NZ Pedestrian Profile, 2000);
Around 10 percent of NZ households do not own a motor vehicle (NZWCS);
Over a third of New Zealanders are insufficiently active to benefit their health, and physical
inactivity is estimated to contribute to 9 percent of deaths per annum (NZWCS); and
Recent perception surveys suggest that only 57 percent of adults would allow children to walk to
school and 37 percent would allow children to cycle to school (NRB 2005 quoted in RLTS p27).
Existing Situation SHI
Road Alignment14
The state highway through Pukerua Bay consists of a series of relatively tight curves. A windy
road ultimately means limited visibility. Development and extensive tree cover close to the
road edge also restricts sight distance.
SH1 immediately south of Pukerua Bay is a four-lane divided highway with an open speed
limit of 100 km/hr. On the approach to Pukerua Bay the highway reduces to two lanes with a
posted speed of 70 km/hr. Just 220m to the north the 50 km/hr speed zone begins.
The Teihana Road West intersection is approximately 190m north of the 50 km/hr sign.
Weku Road 2, which accesses the Muri Station, is 1km to the north of Teihana Road West.
Between these two intersections, approximately 300m north of Teihana Road, there is an old
and what some residents describe as “ugly” pedestrian footbridge crossing SH1. The bridge
connects the school to the eastern side of the village and, as it falls between the two railway
stations, it only serves a small number of commuters.
The approach to Pukerua Bay from the north is via Centennial Highway, a two-lane windy
road that climbs up to Pukerua Bay. The speed on this section of road is 80 km/hr before
reducing to 70 km/hr entering the village and then further reduces down to 50 km/hr.
13 Porirua Transportation Strategy Stage 1: Overall Strategy Scope Walking, Cycling and TDM Strategies, Tim Kelly
Transportation Planning Ltd, January 2008.
14 Description taken from SH1: Pukerua Bay Improvements Proposed Pedestrian Facilities.
18“ Crossing or getting onto SH1 is becoming an ever increasing problem for everyone
who lives in Pukerua Bay. SH1 divides our village and because it winds through the
village it creates blind spots.
Traffic Volume
The 2006 Annual Daily Traffic Volume (AADT) north of Pukerua Bay was 21,993, while the
traffic count site at Pukerua Bay north of Wairaka Road, which is between Teihana Road and
Weku Road 2 is 23,09515. Greater Wellington Regional Council Modelling carried out in 2005
predicts that without Transmission Gully the AADT through Pukerua Bay in 2016 will be
26,000 and with Transmission Gully the AADT in 2021 will be 17,00016.
Pedestrian Movements17
Apart from the flush median and pedestrian refuges at the north end of the Village there is
no median to provide temporary refuge between lanes when crossing the highway, especially
where the pedestrians are currently crossing to access the rail stations. An informal pedestrian
path is being used under the SH1 overbridge to the south of the village by young people from
both sides of the community accessing the railway station and community facilities.
“ Not sure if you are aware or not but some local children bypass both SH1 and the
train track by going under the Pukerua Bay overbridge, walking alongside the train
tracks. Quite a dangerous path! But less dangerous than crossing SH1.
Where pedestrians cross at Teihana Road the sight distance from the kerb in both directions
equates to about 5 seconds.
Further north, at the bottom of the zigzag path, where pedestrians cross to access Muri
Station, the sight distance also equates to about 5 seconds when looking to the south. The
crossing point from the east to west side of the highway is undertaken north of the zigzag
path because of the very restrictive sight distance on the inside of the curve.
“ We would love a foot bridge/underpass to the shops. It is only a 5 min walk for us
from home to the shops – but we always get in the car because it is not safe crossing
SH1 at peak times with small children. Our 7 year old does the walking school bus –
but because Te Motu has no footpath I do not want her to walk this route on her own
(without an adult) at other times. Even as she gets older I would not feel safe about it.
Two pedestrian surveys were undertaken by Transit New Zealand in 2004 for a continuous
2 hour morning and evening count to represent typical AM and PM weekday peak periods.
This survey also measured approximate waiting times, which ranged from 1 to 109 seconds,
with an average delay per pedestrian of 38 seconds. During the survey, observations were
made on the pedestrians crossing the highway, including 3 instances of pedestrians stuck
in the middle of the road, in one case for up to 66 seconds, and at least 3 observations of
vehicles sounding their horns and cases of braking by vehicles to avoid pedestrians crossing
the highway.
15 Transit New Zealand Report SH1: Pukerua Bay Safety Improvements Proposed Pedestrian Facilities Scheme Assessment Report
December 2007, p3.
16 Porirua City Council Submission on the Proposed Western Corridor Plan Appendices – Appendix 1
17 Transit NZ Report SH1: Pukerua Bay Safety Improvements Proposed Pedestrian Facilities Scheme Assessment Report
December 2007, p4.
19The survey result was extrapolated, using the weekly train timetable, and it was assessed
that 1006 train passengers were crossing the highway between Monday and Friday in the
peak hours and 377 non-train passengers with an additional 600 crossing in the weekday off
peak. The total volumes calculated for the weekend were 512, which total 2495 pedestrians
crossing the highway at this location during a 7 day week. This is an average daily pedestrian
crossing number of 356 per day
In the household survey undertaken in 2008 a number of respondents referred to how unsafe
they felt cycling or walking alongside SH1 particularly between Haunui Rd and preschool
facilities and shops.
“ We find it far too dangerous walking two preschoolers between Haunui Road and
Preschool/ Kindergartens/shops/Secret Valley /Beach/Toy library etc. We do it
reasonably often but it is very stressful and we know we are taking a risk, which we
are consistently trying to minimize as we walk. We do this because for all the obvious
reasons (i.e. petrol costs, pollution, etc) and because we want our children to be
“walkers” not “car riders
“ Underpass at the shops!!
Not so much an issue of allowing us to do things more often, but it would take only
5 minutes to walk to the shops instead of 15 (i.e. 10 minutes return rather than
30 minutes round trip). I always use the overbridge with my children but it is time
consuming and I fear the day when my kids are older and they decide to try crossing
SH1 to get to “the other side”.
Accidents18
The Land Transport New Zealand (LTNZ) accident database for the past 5 years (2002 to
2006 inclusive) for the section of SH1 within the Pukerua Bay township shows that there have
been 25 reported crashes over the length of the state highway, measured from the 70 km/
hr speed limit signs at either end. One of these accidents was serious; there were 3 minor
injury accidents and 21 non-injury accidents. None of these accidents involved cyclists
or pedestrians. Another 3 crashes have been reported as of August 2007, all non-injury
accidents, and again none involving pedestrian accidents. The accidents in 2007 were all in
the vicinity of Teihana Road West intersection.
However, these recorded accidents do not identify the near misses and evasive action
observed during surveys and site visits undertaken by Transit and the anecdotal comments of
near misses by residents.
“ A crossing (bridge or tunnel) is long overdue at the shops on SH1. The current
situation is appalling and will result in injury and death if it remains as it is.
Traffic Speeds
Speeds within Pukerua Bay are often in excess of 50 km/hr at the points where the majority of
crossing movements are occurring. This is likely to be because of the high volume of through
traffic, the 100 km/hr and 80 km/hr speed limits on either side of Pukerua Bay, the gradient
of the road going north and the relative closeness of the two main pedestrian crossings to the
nearby higher speed zones.
18 P4, section 2.4 SH1: Pukerua Bay Safety Improvements Proposed Pedestrian Facilities – Scheme Assessment Report Transit
New Zealand December 2007.
20In the second half of 2007 a speed board was installed on the highway heading south at the
point where the road slopes down towards Centennial Highway. Transit New Zealand has
recorded speeds before the speed board was introduced and for three separate periods after it
was introduced.
The following figures19 summarise the information of recorded speeds before the speed board
was introduced and for a period in December 2007, when the speed board had been in
operation for three months.
Speeds recorded between 27 July 2007 and 3 August 2007 were as follows:
Average Speed 58km/h
85%ile Speed 61km/h
% above 92.44%
Speeds recorded post speed board installation between 4 December 2007 and 21 December
2007 were as follows:
1 Average Speed 57km/h
2 85%ile Speed 59km/h
Although the speed board seems to have had some impact, average speeds are still well above
the limit of 50km/h.
“ I walk regularly early in the morning (5 am) and traffic even at that time is often
hurtling through above the speed limit. During the day it is impossible to cross the
road other than over the bridge at the school. I have also noticed that it is becoming
increasingly difficult to pull out into morning traffic (even going with the traffic) and
to be able to merge into north bound traffic at 5 pm (going North) is a frightening
experience!
“ My children need to cross at the top of the Beach Road which is dangerous once
again due to the speed of cars turning off SH 1 and lack of indicators
What The Community Says
Two household surveys have been undertaken in the last two years. The first was carried out
by the Residents Association in 2006/07 and this formed the basis for the Pukerua Bay Village
Plan, which was submitted to Porirua City Council for consideration and adoption in 2007.
The second survey has been undertaken jointly by the Residents Association and Porirua City
Council as part of the development of the Neighbourhood Accessibility Plan.
Both surveys’ findings are consistent in relation to identifying what the community values and
issues are.
In addition, the second survey sought to establish how behaviour would change if crossing
SH1 was made safer. Results suggest that walking and cycling would increase and the use of
short term car journeys would reduce (for example, to the primary school).
Village Plan 200620
In 2006 the Pukerua Bay Resident’s Association undertook a survey21 of their community to
identify the key issues of concern and the priorities for action. The responses formed the basis
for the Village Plan.
Having a cohesive, safe and environmentally conscious community was identified as very
important by over 60 percent of respondents. Protection of the environment and safe walking
and cycling were top priorities, strongly favoured by over 70 percent of respondents.
19 Transit New Zealand, PowerPoint presentation.
20 Appendix 3, Village Plan.
21 Appendix 4, Village Survey Results.
21Eighty per cent of respondents identified that key issues were enforcing the 50km/h speed
limit on SH1, improving safe access across SH1, intersection improvements, traffic calming
measures and a safe walking/cycling environment.
The Village Plan contains a number of recommendations relating to pedestrian, cyclist and
motorist safety and accessibility. These are included in the Neighbourhood Accessibility Plan
proposed actions.
The community indicated an interest in extending and providing additional cycle paths,
upgrading existing recreational areas, extending and maintaining walking tracks and
paths around the community, and finally ensuring safety in the area of the then-proposed
pedestrian underpass.
Village Survey April 200822 – Uniting the Bay
Of the 621 households in Pukerua Bay, 207 or 33 percent responded to this survey.
Most respondents live on the primary school or western side of SH1. More than half have children at
home, usually in one and two-child households. The largest proportion have primary school-aged
children.
Improving Movement around Pukerua Bay
Respondents’ suggestions about changes that could make it easier and safer to move in,
out and around Pukerua Bay most commonly include building an overbridge or underpass,
followed by building a bypass and introducing mechanisms to reduce traffic speed and
improve safety.
Crossing SH1
Households cross SH1 on a regular basis for a wide range of reasons, but especially for
socialising; club and sporting activities; going to/from work; cycling/keeping fit; and
community/church activities.
Household Members Needing To Cross Sh1
Activity Need to cross SH1 Total
Yes (#) Yes (%) No
Socialising 146 93% 11 157
Going to/from the local shops 89 61% 56 145
Going to/from the local beach 94 67% 47 141
Cycling/keeping fit 109 79% 29 138
Going to/from work 117 87% 17 134
Club and sporting activities 89 89% 11 100
Community/Church activities 72 73% 26 98
Attending school 45 66% 23 68
Taking children to/from school 30 56% 24 54
Taking children to/from early childhood services 16 39% 25 41
Other 34 94% 2 36
Travel in and out of Pukerua Bay
Survey respondents travel in and out of Pukerua Bay on a frequent basis, by car, on foot, or
using public transport. Of the households surveyed:
Most have members driving in and out of side roads onto SH1 on a daily basis and more than
75 percent experience some degree of difficulty getting onto SH1 from these side roads;
Almost all have members crossing SH1 by foot on a regular or semi-regular basis;
Over 50 percent have household members who currently travel by train or school bus on a
regular basis. Analysis of the travel patterns of 330 Pukerua Bay commuters show that just
over half travel by train or bus at least weekly;
Sixty-seven percent of households expect this would stay the same if trains ran more
frequently.
22 Appendix 5, Uniting the Bay Survey results and questionnaire.
22Mode of Travel within Pukerua Bay
Depending on their household location, and that of the activity, the mode of travel that
householders use varies.
The activities they are most likely to walk or cycle to are: cycling/keeping fit; going to/from
the local shops; going to/from the local beach; taking children to/from school; taking children
to/from early childhood services; and community/church activities.
The activities they are most likely to drive to are socialising; club and sporting activities; and
going to and from work.
There are no activities for which the majority of households usually use public transport.
Usual mode of transport to activities
Activity Mode of travel Total
Car Walking biking Public transport
Going to/from the local beach 62 94 7 163
Going to/from the local shops 42 107 9 158
Cycling/keeping fit 14 130 3 147
Socialising 108 30 4 142
Going to/from work 88 4 44 136
Club and sporting activities 86 21 8 115
Community/Church activities 46 50 1 97
Attending school 13 29 23 65
Taking children to/from school 20 32 4 56
Taking children to/from early childhood services 12 16 2 30
Other 12 12 4 28
Preferred Solutions
The features that are most valued for their capacity to unite the local community are safe
walking and biking in the Bay, and a safe crossing over SH1. A safe crossing at the shops
would be preferred over a safe crossing at Muri station. In noting this result, the Residents
Association observes that the catchment for Teihana Rd is larger than for Muri Station, for a
number of reasons including population and where community facilities are located.
Features that unite the Pukerua Bay community
Activity Level of value given
High Somewhat Neutral Not particularly Not at all
Safe crossing over SH1 88% 10% 2% >1% 1% 0% >1%
School/community environmental activities 53% 35% 11% 1% 1%
Extension to Ara Harakeke cycleway 44% 35% 15% 4% 2%
Bus walking to school 38% 27% 27% 1% 8%
Improved parking at the shops 19% 34% 28% 10% 9%
The Impact on Modes of Travel with Safe Crossing Options
Overall, respondents expect that each of the safe-crossing options will increase householders’
inclination to walk and cycle to specified activities.
25 percent of respondents with school age children indicated that their children would walk
or cycle to school more often, with another 10 percent indicating they would allow their
children to walk to various activities, including school, if there were safe crossing options.
The shops-option (Teihana Road) is anticipated to have the greatest effect, because of its
geographic location and proximity to a number of community facilities.
A crossing at Muri Station was likely to have slightly less impact on how primary school
children travelled to school, with 19 percent of respondents saying their children would walk
or cycle to school more often and 4.5 percent saying they would allow their children to walk
to various local activities, including school or the railway station.
23Mode of transport with safe crossing at the shops
Activity Mode of travel Total
Car Walking biking Public transport
Attending school 9 43 20 72
Taking children to/from school 13 40 5 58
Taking children to/from early childhood services 6 21 3 30
Going to/from work 77 11 38 126
Club and sporting activities 70 35 6 111
Socialising 74 67 8 149
Going to/from the local beach 47 97 22 166
Going to/from the local shops 24 125 23 172
Community/Church activities 34 60 1 95
Cycling/keeping fit 16 144 17 177
Other 10 11 2 23
Mode of transport with safe crossing at Muri Station
Activity Mode of travel Total
Car Walking biking Public transport
Attending school 3 36 13 52
Taking children to/from school 7 28 4 39
Taking children to/from early childhood services 6 14 1 21
Going to/from work 53 4 30 87
Club and sporting activities 44 30 8 82
Socialising 47 55 9 111
Going to/from the local beach 26 80 54 160
Going to/from the local shops 19 77 62 158
Community/Church activities 27 42 86 155
Cycling/keeping fit 8 115 1 124
Other 4 12 3 19
Use of Community Amenities
The survey results show considerable community use of local amenities, especially the
Brendon Beach walkway; Ara Harakeke cycleway; Coastal walkway; Secret Valley (Waimapihi
Stream); Wairaka Reserve; and Raroa walkway. Respondents expect their households’ use of
local amenities to increase if a safe crossing is established at the shops (especially Secret Valley
and the Ara Harakeke cycleway) or at Muri Station (especially Muri Reserve and Brendan
Beach walkway).
Expected use of amenities with a crossing at the shops
Amenities Increase Decrease Stay same
Secret Valley (Waimapihi Stream) (n=166) 36% 64%
Ara Harakeke cycleway (n=164) 31% 70%
Muri Reserve (n=155) 25% 75%
Skate park (n=137) 25% 75%
Coastal walkway (n=165) 24% 76%
Greenmeadows Park (n=143) 21% 79%
Brendan Street walkway (n=168) 20% 80%
Raroa walkway (n=148) 20% 80%
Other local clubs (n=129) 18% 82%
Wairaka Reserve (n=158) 17% 83%
Tennis club (n=138) 15% 85%
24You can also read