Transportation - Plan Bay Area
←
→
Page content transcription
If your browser does not render page correctly, please read the page content below
Transportation

Photos: Karl Nielsen (Top, Bottom Left)                    Photo: Noah Berger
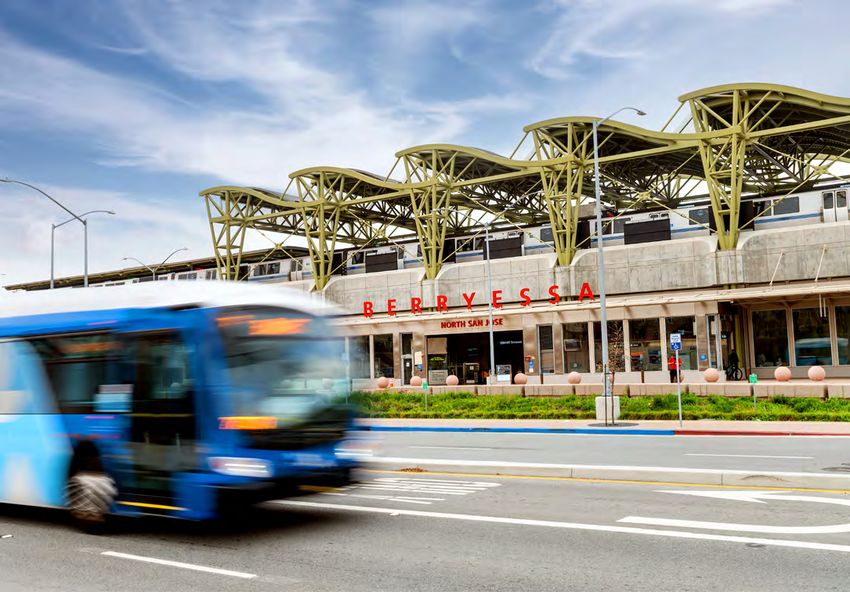
A LONG-RANGE VISION
                                                      FOR TRANSPORTATION

                                                      The network of roads and transit routes
                                                      crisscrossing the Bay Area makes it possible
                                                      for residents and visitors to take millions of
                                                      trips every day, whether commuting to work
                                                      or school, shopping at local businesses, or
                                                      meeting up with family and friends.
                                                      Even more importantly, the transportation choices available to a
                                                      person or a family either expand or limit their options for stable
                                                      housing and employment, quality healthcare and recreation.
                                                      There is also a critical nexus between transportation and climate
                                                      change, with the transportation sector currently producing over
                                                      40% of California’s greenhouse gas (GHG) emissions.1

                                                      Looking out to 2050, transportation investments and policies
                                                      will be central components of the region’s future vitality,
                                                      building toward a well-connected, safe and multimodal regional
                                                      transportation network. Compared to today, the transportation
                                                      system will carry millions more passengers on its trains, ferries,
                                                      buses and roads, but more people may telecommute as well.
                                                      Strategies across the areas of transportation, housing, the
                                                      economy and the environment will need to work in unison
                                                      to reduce GHG emissions and meet California’s ambitious
                                                      climate goals while also increasing access to housing and job
                                                      opportunities for all Bay Area residents.

Photo: Noah Berger                                    1   California Air Resources Board. 2000-2018 GHG Inventory (2020 Edition). https://ww2.arb.
                                                          ca.gov/ghg-inventory-data

         55     D R A F T Pl an B ay A re a 2 0 5 0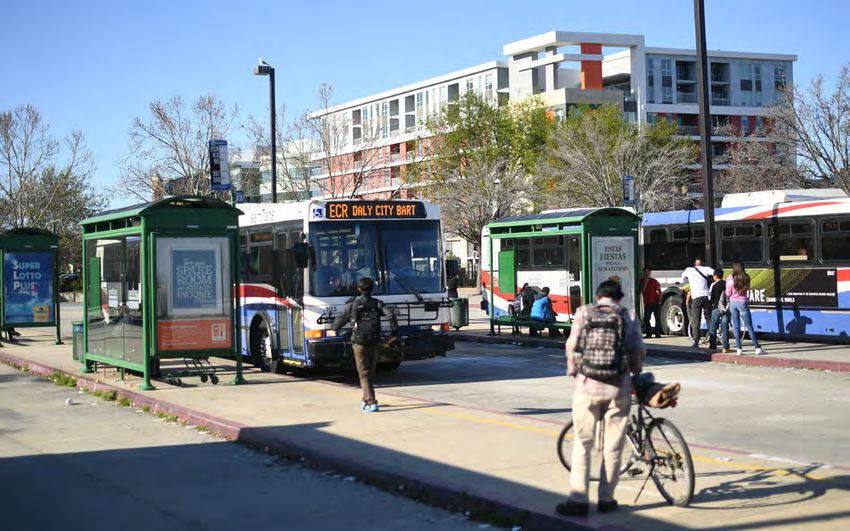
Strategies for Sustainable
                                                                Connections to Opportunity
                                                                Plan Bay Area 2050 envisions a transportation system that,
                                                                above all, prioritizes improved access to opportunity for all
                                                                Bay Area residents. Strategies focus on meeting the needs
                                                                of historically marginalized communities, ranging from more
                                                                frequent bus service to safety-enhancing improvements for
                                                                pedestrians and cyclists. Bold strategies that go beyond
                                                                prior regional planning efforts to reduce climate emissions
                                                                by higher margins and advance equity at the same time can
                                                                demonstrate that climate and equity goals go hand-in-hand.
                                                                The plan’s transportation strategies fall into three themes:

                                                                1. Maintain and optimize the existing transportation
                                                                   system: First and foremost, the plan ensures that our
                                                                   existing system of transit routes, roads and bridges
                                                                   will be maintained, laying a strong foundation for
                                                                   further investments and policies. Strategies include
                                                                   operating the existing system at restored 2019 levels,
                                                                   creating a seamless transit experience with reformed
                                                                   fare payments, addressing near-term highway
                                                                   bottlenecks, implementing road pricing on select
                                                                   corridors for long-term congestion relief, funding
                                                                   community-led transportation investments in Equity
                                          Photo: Karl Nielsen
                                                                   Priority Communities, and supporting ongoing regional
                                                                   programs and local priorities.
ADVANCING EQUITY THROUGH
                                                                2. Create healthy and safe streets: On top of this optimized
TRANSPORTATION                                                     system, roads would be made safer for all drivers, cyclists
An equitable transportation system is one that is                  and pedestrians through context-specific speed limit
safe, affordable and reliable in meeting the needs                 reductions and a network of protected bike lanes and
of all residents, but especially those with the fewest             trails designed for people of all ages. Strategies include
options. Safety ensures that no one is discouraged                 building a Complete Streets network and advancing a
from making a trip out of fear for their well-being,               Vision Zero road safety policy to protect all road users.
whether on transit, in a personal vehicle or simply             3. Build a next-generation transit network: Finally, a slate
walking. Equity also means thoughtful consideration                of investments in transit steers the Bay Area toward a
of who benefits from a transportation investment                   21st century system that meets the needs of a growing
when prioritizing projects. In the short term, Plan Bay            population and delivers fast, frequent and reliable
Area 2050 encourages investment in projects used                   service throughout the region. Strategies invest in
primarily by people with lower incomes, like more                  improving the frequency and reliability of local transit,
frequent local bus service.                                        selectively extend regional rail and increase frequencies
An equitable transportation system is also one                     to address crowding, and build out the express lanes
that does not exclude riders through high fares.                   network with coordinated express bus service.
Quality service should be affordable and accessible.
Plan Bay Area 2050 calls for reform to transit fares
regionwide that would lower fare costs across
the board, particularly for riders that use multiple
transportation systems, and serve those most in
need by offering income-based fare discounts.

                                                                                         D R A F T Pl an B ay A re a 2 0 5 0   56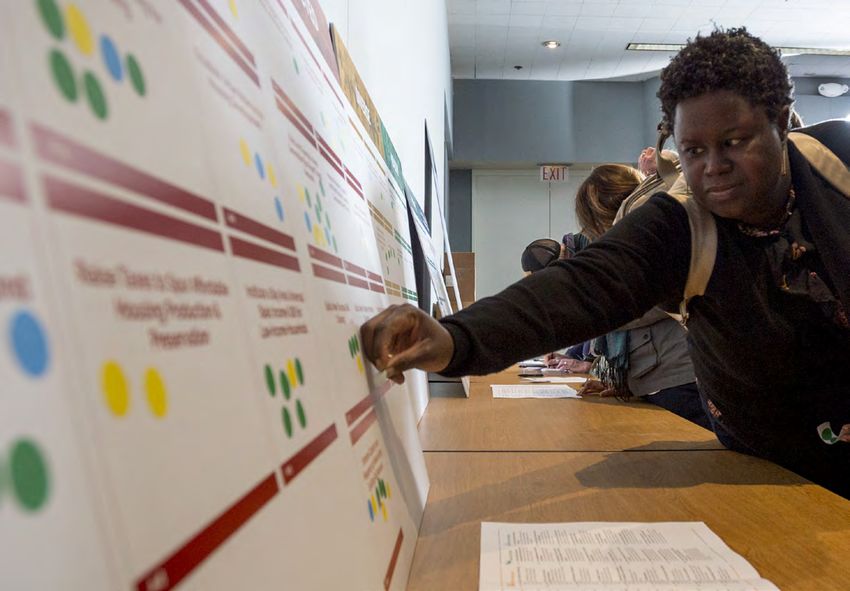
Photo: GoMentum Station

                                                AUTONOMOUS VEHICLES
 While autonomous vehicles (AVs), otherwise known as self-driving cars, may seem like a far-off technology, most
 new vehicles sold today already operate with some level of automation, including automatic braking and lane-drifting
 correction. In San Francisco, the California Department of Motor Vehicles has authorized autonomous vehicles to roam the
 streets without a backup driver at the wheel, testing out this emerging technology.2 Greater degrees of automation
 and increased adoption of AVs could greatly shape transportation’s future in the Bay Area. More automation may make
 longer-distance commutes more feasible, but it may also reduce the attractiveness of more sustainable travel modes
 like transit or biking while increasing congestion and GHG emissions. Poised to launch another revolution in transportation,
 autonomous vehicles are one of the largest sources of uncertainty in planning for the region’s future.

 As home to much of the technological innovation driving the shift to AVs, the Bay Area is uniquely situated to take
 advantage of the opportunities and consider the risks AVs present. Many governmental and non-governmental
 organizations in the Bay Area are planning for a world with AVs: the City of San Jose has advanced a series of pilot
 programs to develop infrastructure and collect data; the GoMentum Station in Concord is a robust AV testing facility with
 road networks, tunnels and railroad crossings that simulate real-world conditions; and the Bishop Ranch Office Park in
 San Ramon is piloting AV shuttles to transport workers around the office park, to name a few.

 As it leads worldwide on AV innovation, the Bay Area has an opportunity to shape the future with thoughtful,
 equitable AV policies and best practices. The San Francisco Municipal Transportation Agency (SFMTA) and the
 San Francisco County Transportation Authority (SFCTA) recently developed their Guiding Principles for Emerging
 Mobility, 3 a policy framework to evaluate new mobility decision-making; the Santa Clara Valley Transportation
 Authority (VTA) is also developing an Automated Driving System Draft Policy; and the California Public Utilities
 Commission is working on a proposed framework for regulating two AV pilot programs. Regional leadership on this
 issue could make an uncertain future more equitable, sensible and understandable.

Plan Bay Area 2050 recognizes that AVs could fundamentally change the way transportation networks are designed and
operated, and shape the future of public transit, climate emissions, labor markets and access to opportunity. These concerns
have been incorporated into planning and analysis work from the start: through the Horizon effort, MTC and ABAG released
an Autonomous Vehicles Perspective Paper4 that assessed potential opportunities and challenges and recommended
strategies that would support the Plan Bay Area 2050 vision in an AV-enabled future. All modeling work for the plan includes
a fairly conservative assumption that 5% of vehicles will be autonomous by 2035, escalating to 20% by 2050.

 2   Korosec, K. (2020, December 9). Cruise begins driverless testing in San Francisco. TechCrunch. https://techcrunch.com/2020/12/09/cruise-
     begins-driveless-testing-in-san-francisco/
 3   SFMTA (© 2021). Emerging Mobility: 10 Guiding Principles. https://www.sfcta.org/policies/emerging-mobility#panelguiding-principles
 4   MTC, ABAG and ARUP. (2018, June). Autonomous Vehicles Perspective Paper. https://mtc.ca.gov/sites/default files/2018-06-25_Autonomous_
     Vehicles_Perspective_Paper.pdf

57    D R A F T Pl an B ay A re a 2 0 5 0
STRATEGIES Maintain and Optimize the Existing System
As the Bay Area emerges from COVID 19-related restrictions, there is a unique opportunity to rebuild
existing transportation systems to serve more people and operate more cost-effectively. All of Plan
Bay Area 2050’s transportation strategies build upon a strong foundation of existing infrastructure and
services. A future transit system that is maintained in good working order, where transit schedules have
been restored to their pre-COVID service levels and transit fares are simplified across operators, would
improve reliability and reduce costs for all passengers under the plan’s vision. New options for planning
and paying for a trip would be easily accessible and include all modes. Equity Priority Communities,
which have historically been denied a seat at the table, would have access to significant funding to
advance their priorities. A handful of road-widening projects would provide short- to medium-term
congestion relief, before a new per-mile fee is applied on select highways with transit alternatives.
This new approach to congestion management could raise billions of dollars for new transportation
investments, leading the system to operate more efficiently and equitably than ever before.

Around two-thirds of the transportation funding in Plan Bay Area 2050 is earmarked for restoring,
operating and maintaining the existing system, in line with MTC’s long-held pledge to “Fix it First.”
This approach includes reserving funds to pay for ongoing replacement of aging buses and other
transit assets, regular paving of local streets and freeways, and a host of other necessary investments
to ensure that the region’s transportation system continues to provide reliable service. Furthermore,
with transit systems forced to cut routes or reduce frequencies during the COVID-19 pandemic, Plan
Bay Area 2050 charts the course for returning transit service to the robust levels that the Bay Area
relied on before the pandemic.

Beyond investing in the existing system, Plan Bay Area 2050 aims to enable a seamless mobility
experience that will help travelers navigate the many options available to them and make more
sustainable choices. To start, a free modern mobile app that assists travelers with trip planning —
including navigating across transit schedules or understanding parking or shared mobility options
at each end of the trip — would help to gather information from disparate sources in one place.
Once a trip is in progress, low-cost measures like schedule coordination between operators to reduce
wait times at transfer locations, as well as wayfinding signage at key transfer hubs, would facilitate
a smoother experience. Complementary investments in bike parking at transit stations and reforms
to transit fares for multi-operator trips, described later in this chapter, further advance a seamless
mobility experience under the plan’s vision.

  Photo: Ron Purdy

                                                                                D R A F T Pl an B ay A re a 2 0 5 0   58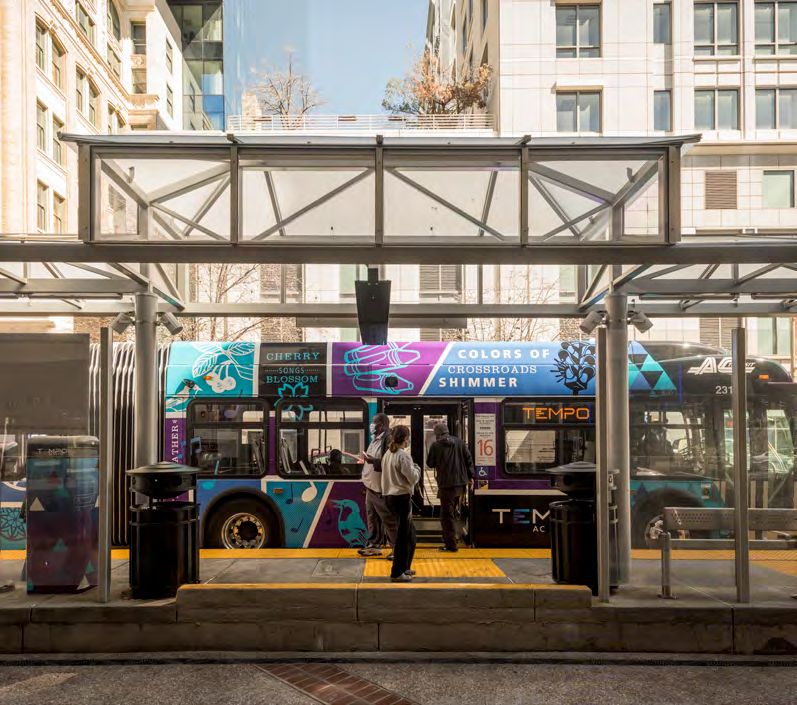
Another barrier to making transit within the Bay Area truly
                                                            seamless and easy to navigate is the region’s currently
                                                            fractured fare structure, wherein dozens of transit
                                                            operators each has its own set of fares and transfer
                                                            discounts. Paired with the schedule coordination and other
                                                            capital investments described previously, a strategy to
                                                            reform regional fare policy could simplify the experience
                                                            of taking transit. Standardizing transit fares across the
                                                            region’s transit operators, with one local fare across all
                                                            operators and free transfers between local routes, could
                                                            greatly reduce fare costs and simplify decisions of how
                                                            to get around. For regional trips, implementing a uniform
                                                            distance-based fare that prices a trip based on mileage,
                                                            rather than the number of independent boardings, would
                                                            reduce costs and be a critical step toward creating a more
                                                            affordable transportation system.

                                                            While these reforms support transit riders of all incomes,
                                                            targeted discounts applied uniformly for riders with
                                                            low incomes, as well as young riders and people with
                                                            disabilities, would make further progress toward Plan Bay
                                                            Area 2050’s affordability goals. MTC’s analysis suggests that
                                                            fare integration alone would be roughly revenue-neutral
                                                            to operators, because it incentivizes an increase in overall
Photo: Karl Nielsen
                                                            transit usage, which offsets lower individual fares. However,
                                                            income-based discounts, including a 50% discount for
 CLIPPER® STARTSM                                           households with low incomes, would involve substantial
 WORKING TOWARD EQUITABLE                                   fare losses. Funding would be needed to ensure that transit
                                                            operators do not experience an overall loss in operating
 REGIONAL STANDARDS                                         revenue that could disrupt service.
 Cost should not be a barrier to riding transit. MTC,
 together with transit operators, social service agencies   Strategies that strengthen the transit network and support
 and community-based organizations, launched                individual behavior change away from single-occupancy
 Clipper® STARTSM, a fare discount pilot program for        driving are critical to Plan Bay Area 2050’s approach to
 adults in the Bay Area whose annual earnings are           tackling traffic congestion. However, these strategies often
 below 200% of the federal poverty level. Introduced in     require time to take hold. In the near term, Plan Bay Area
 summer 2020, in the midst of the COVID-19 pandemic,        2050 includes a strategy to address highway bottlenecks
 the $11 million pilot program currently offers fare        and improve interchanges through a limited selection of
 discounts ranging from 20% to 50%, depending on            widenings or road extensions to serve new developments.
 the operator, with more than 20 participating transit      These road projects may help reduce congestion
 providers. The program moves the Bay Area toward a         temporarily, though they will likely increase vehicle miles
 more consistent regional standard for fare discounts,      traveled in the long-term, with any congestion relief benefits
 and it supports the vision of MTC and ABAG’s Equity        disappearing by the year 2050. As such, Plan Bay Area 2050
 Platform by building upon efforts to make transit more     also includes a suite of long-term solutions to the region’s
 affordable and expand transportation choices for           congestion challenges, including road pricing, transit-
 residents with low incomes.                                supportive land use and transit improvements, that have
                                                            been shown to succeed across a variety of future conditions.

59   D R A F T Pl an B ay A re a 2 0 5 0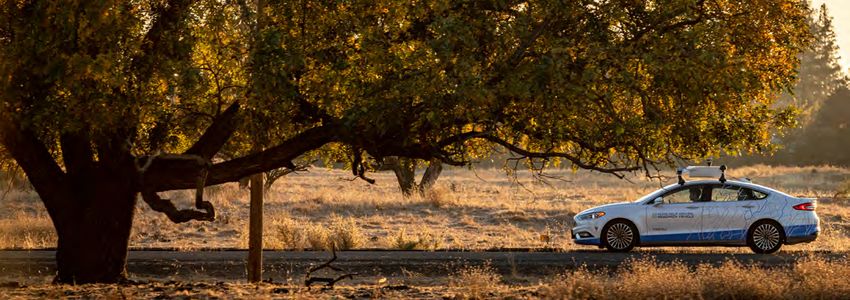
COLUSA
MENDOCINO SUTTER
128
LAKE
29 YOLO
SONOMA 113
101
128 505
Santa Rosa 128
116
29
NAPA
80
12 Vacaville
121 5
Napa
MAP 4.1 Fairfield SACRAMENTO
Petaluma
Highway 116
121
29
12
and Pricing
80 12
680
37 SOLANO
Novato
Investments MARIN
Vallejo
Pittsburg
San 101 4
HIGHWAY WIDENING 1 Rafael 4
80 Antioch
Richmond Concord
New Carpool Lane
580 Brentwood
Walnut 4
New General Purpose Lane Creek
CONTRA
COSTA
101
Berkeley 24
Major Interchange Improvement 80
OAKLAND SAN
EXPRESS LANES SAN 680 San JOAQUIN
Ramon
Existing/Under Construction FRANCISCO Alameda
Dublin 580
580
Existing Lane Conversion Daly City San Leandro Pleasanton Livermore 580
280
New Single Lane Union City
ALAMEDA
880 84
92
New Dual Lane Hayward
San 680
Mateo 101 Redwood Fremont
PRICING 1
City
84
880
Existing Toll Bridge Corridor 92
Mountain
New BATA Toll Corridor Palo View 237 Milpitas
Alto
Per-Mile Tolling (Plan Bay Area 2050 Strategy) Sunnyvale
280 Santa Clara
Congestion Pricing Zone
84
SAN JOSE
Cupertino
SAN SANTA
REGIONAL TRANSPORTATION MATEO 85
CLARA
Major Airport 1
Major Seaport SANTA
Highway and Interstate CRUZ 17
101
Major Road 1
17
Gilroy 152
SCALE
1 152
OAKLAND > 350,000
Novato 50,000 – 350,000 SAN
BENITO
Miles
Kilometers Alignments are for illustrative purposes only. Improvements to local
streets and roads or highway projects costing less than $100 million are MONTEREY
not shown. For more information on the individual transportation projects
Source: TomTom North America, 2019 included in Plan Bay Area 2050, see the Transportation Project List.
Map Author: PB, 5/21 D R A F T Pl an B ay A re a 2 0 5 0 60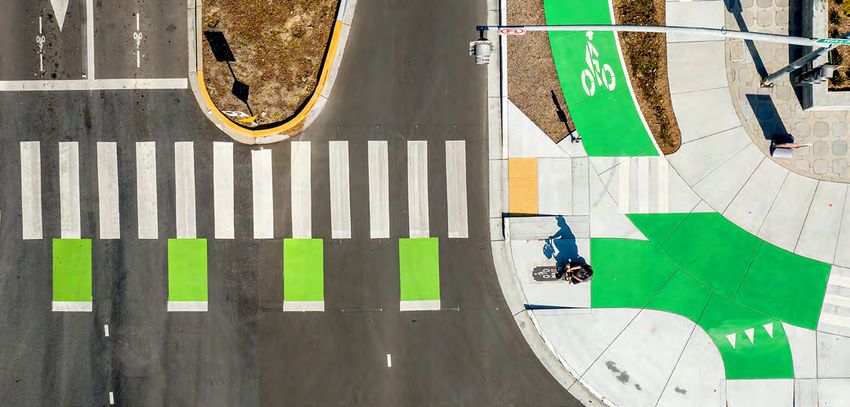
One of the most impactful long-term approaches to               priorities of those who have faced barriers to participating
congestion is road pricing. Road tolls are a way to reflect     in such decision-making — namely, communities of color
the true cost of driving and motivate drivers to consider       or those with lower incomes. Addressing this misalignment,
more sustainable options. Plan Bay Area 2050 proposes           the plan calls to support community-led transportation
implementing per-mile tolling on select congested               enhancements in Equity Priority Communities, which will
freeways where parallel transit options exist as a bold         require public agencies to dedicate funding specifically for
action to curb traffic congestion through 2050 and beyond,      these projects and build trusting, collaborative relationships
while also generating new revenues for reinvestment in          with these communities. MTC has several existing programs
sustainable alternatives to driving. This strategy, applied     that focus on facilitating grassroots planning and funding
on a limited number of freeway corridors throughout the         projects that benefit Equity Priority Communities, including
region, would charge drivers a toll based on the number         the Community-Based Transportation Planning Program,
of miles driven, the number of passengers, and the time         which funds local planning efforts in Equity Priority
of day, with lower tolls charged to carpoolers and those        Communities, and Lifeline, an MTC funding program
traveling outside of rush hour periods.                         dedicated to improving transportation options for people with
                                                                low incomes. Plan Bay Area 2050 reserves billions of dollars
To support equity goals and reduce this pricing measure’s       for this strategy, laying the groundwork for a future where
potentially regressive impact, households earning below         systemically underserved communities are empowered to
the regional median income would receive a 50% discount.        prioritize improvements to best meet their needs.
Importantly, revenue from tolling would be directly
reinvested in improving transit alternatives, such as funding   Finally, the plan includes a strategy to advance other
investments like express bus service, as well as in projects    regional programs and local priorities, enabling
like electric vehicle charging infrastructure. An estimated     uninterrupted delivery of services that Bay Area residents
$25 billion in funding for transportation projects could be     rely on every day. Regionwide, services like motorist aid
generated between 2030 and 2050, helping to fund transit        and incident management will continue to keep travelers
investments for the latter years of Plan Bay Area 2050.         safe, and real-time information will be available through
                                                                511®. A host of locally identified priorities complement
Historically and even today, decisions on which projects        these regional initiatives, providing small-scale but
get implemented are largely top-down, with proposals and        meaningful improvements, including intersection
project selection coordinated by cities, counties or transit    upgrades, local emissions reduction programs, and city-
operators. These projects may not always align with the         or county-led planning studies.

  Photo: Noah Berger

 61    D R A F T Pl an B ay A re a 2 0 5 0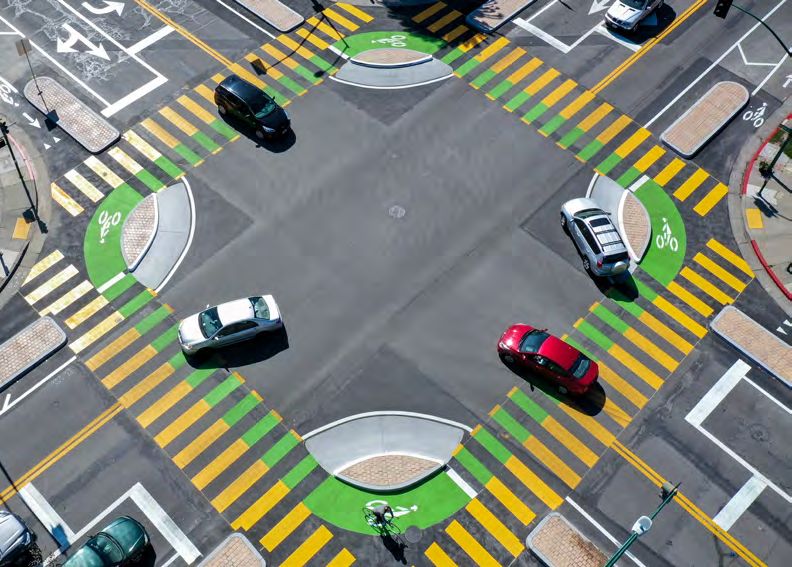
Photo: Karl Nielsen

                       MTC PARTICIPATORY BUDGETING PILOT

Shared decision-making and community power-building,          In San Francisco, participants identified safety on transit
deeper civic engagement and greater alignment between         as a key concern and funded the creation of three
community needs and funding decisions are essential to        Transit Assistant positions in their community through
realizing Plan Bay Area 2050’s equity goal. Participatory     the SFMTA Muni Transit Assistance Program. Transit
budgeting is one tool that public administrators and          Assistants ride buses and light rail trains to provide
planners can use to lift up community members’ voices         an unarmed safety presence that can de-escalate
and priorities, providing a democratic framework through      conflicts and deter vandalism. In Vallejo, participants
which community residents directly decide how to spend        identified gaps at the beginning and end of transit trips
part of a public budget.                                      as a key priority, opting to fund wayfinding signage and
                                                              improvements to sidewalks and bus shelters.
In 2018, MTC launched a pilot program in partnership
with advocacy groups and local jurisdiction officials in      The pilot’s success highlights several best practices
two Bay Area communities: San Francisco’s Bayview and         for advancing equity: defining equity as a strategic
Vallejo. Residents, community-based organizations and         priority within funding policy; clearly outlining
government officials worked together for a year to identify   program structure and process; applying diversity and
key transportation challenges and potential solutions,        inclusion metrics to program evaluation; and building
and $1 million in regional transportation funding was         collaborative relationships.
allocated to investments prioritized by the participants.

                                                                                       D R A F T Pl an B ay A re a 2 0 5 0     62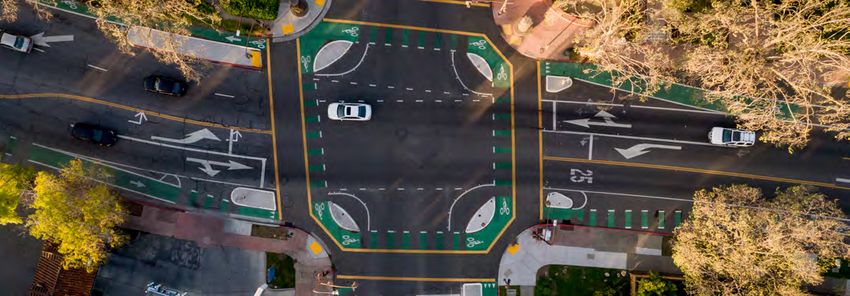
STRATEGIES Create Healthy and Safe Streets
          Safety and health are on the minds of all Bay Area residents as COVID-19’s impacts continue to resonate.
          The pandemic has revealed a renewed interest in biking and walking for commuting, health and leisure.
          As people spent more time in their own neighborhoods due to shelter-in-place orders, local leaders
          nationwide repurposed road space formerly in the exclusive domain of cars as car-free “slow streets”
          where people can walk and bike.5 Slow streets programs and new parklets have cropped up around the
          Bay Area as people seek to spend quality, socially distanced time outdoors.6

          Infrastructure and policy that support human-powered methods of travel like walking, biking,
          skateboarding or riding scooters (also known as “active transportation”) make sustainable, short trips
          possible. Many of these policy and infrastructure changes are attainable in the near term, and they
          would promote healthier, more environmentally friendly options for local trips like shopping at nearby
          businesses, as well as more convenient ways to access transit and avoid parking for longer-distance
          trips. Active transportation benefits both public health, through increased physical activity, and the
          environment, through zero-emissions travel.

          Plan Bay Area 2050 lays the groundwork for a dramatic increase in trips that take place on foot or bike, in
          recognition of the numerous co-benefits that active transportation can provide. Infrastructure and policy
          approaches are combined to make conditions safer and more comfortable for cyclists and pedestrians of
          all ages. By 2050, protected bike lanes and off-street paths would be plentiful, connecting residents with
          commercial corridors, transit stops and community places. Vehicular speeds would be reduced, improving
          safety outcomes for everyone on the road and inviting more people to bike and walk safely.

          A foundational element of Plan Bay Area 2050’s transportation network is a strategy to build a Complete
          Streets network, a planning term popularized nationally to describe streets that meet the needs of all
          users, including pedestrians and bicyclists. Plan Bay Area 2050 envisions a well-connected network with
          10,000 new miles of protected bike lanes and off-street paths, with particular emphases on connections
          to transit and investments in Equity Priority Communities. This strategy includes investments in regional
          walking and biking routes, such as the California Coastal Trail, the Great California Delta Trail, the Iron
          Horse Trail and the Bay Trail, that are critical for commuting and recreation alike. Aside from on-street
          infrastructure, a suite of complementary investments — including secure bike parking at transit stations,
          pedestrian lighting and intersection safety projects — supports a future where walking and biking are safe
          and comfortable choices for people of all ages.

            Photo courtesy City of Richmond

5   Schaper, D. (2020, August 16). The Pandemic Is Changing How People Get Around. NPR. https://www.npr.org/2020/08/16/902909092/the-
    pandemic-is-changing-how-people-get-around
6   Rudick, R. (2020, June 9). Tracking Slow Streets in the Bay Area. SF Streetsblog. https://sf.streetsblog.org/2020/06/09/tracking-slow-streets-in-the-
    bay-area/

63     D R A F T Pl an B ay A re a 2 0 5 0
Photo: Karl Nielsen
ACTIVE TRANSPORTATION PLAN
Historically, cities and counties have led planning anticipated for release in 2022, will support Plan Bay
efforts for active transportation infrastructure like bike Area 2050’s envisioned Complete Streets network,
lanes, off-street multi-use paths or pedestrian safety including the construction of 10,000 miles of new
improvements. Regional agencies like MTC and ABAG bicycle paths and lanes.
have played a complementary role through efforts such The Active Transportation Plan will also guide safety
as maintaining and expanding regional facilities like the policies enacted at the local and regional levels in
Bay Trail, adopting a regional Complete Streets program, accordance with MTC’s adopted Vision Zero policy,
and funding certain active transportation projects. which fosters coordination throughout the region to
Since 2014, in partnership with the state, the region has eliminate traffic fatalities and serious injuries by the year
begun to take an even more active role, awarding over 2030. This policy includes support for lower vehicular
$325 million to active transportation projects through speeds and traffic calming elements described in the
competitive Active Transportation Program grants. Plan Bay Area 2050 strategy to advance a regional Vision
MTC last released a regional plan for bicycle Zero policy.
infrastructure in 2009. In the following years, cities and Analysis for Horizon and Plan Bay Area 2050 found
counties completed active transportation plans of their that investing in active transportation infrastructure
own, building out hundreds of miles of bike lanes and can open up new destinations for people with low
off-street paths. Many walking and biking trips may incomes at a fraction of the price of higher-cost public
cross city or county boundaries, so a regional plan that transit infrastructure. Equity considerations will be
coordinates the infrastructure buildout needed for these front and center in the regional Active Transportation
trips can help to create safe, seamless paths for the Bay Plan, including partnerships with community-
Area’s cyclists, pedestrians and other active travelers. based organizations to identify priorities. The Active
In 2020, MTC initiated work on a regional Active Transportation Plan will also coordinate with ongoing
Transportation Plan, intended to serve as a blueprint planning efforts like Community-Based Transportation
to strategically guide active transportation policy Plans and local active transportation planning work.
and investments. The Active Transportation Plan,
D R A F T Pl an B ay A re a 2 0 5 0 64Photo: Karl Nielsen
Next, a strategy to advance a regional Vision Zero policy
complements the regional network of safe bike lanes and EXPLORING AUTOMATED SPEED
trails by supporting additional safety projects and lowering ENFORCEMENT TO ADDRESS BIAS
vehicle speeds. Vision Zero7 is an internationally adopted Black drivers across the country are up to five times
framework that seeks to eliminate all traffic fatalities and more likely as white drivers to be stopped and searched
severe injuries while increasing safe, healthy and equitable while driving,8 yet despite these racial inequities in
mobility for all. Prompting drivers to go more slowly is a traffic stops, speed enforcement remains a crucial tool
key focus area of Vision Zero, given the strong correlation in saving lives. Automating traffic enforcement using
between higher speeds and higher likelihood of serious safety cameras may be one tool to reduce opportunities
injury or fatality in the event of a collision. of bias in officer-initiated traffic stops. Enforcement
Plan Bay Area 2050 advances the Bay Area toward Vision by automated speed cameras in New York City has
Zero through a combined emphasis on lower speeds and changed driver behavior significantly enough to reduce
street design for safer travel. This includes both a policy speeding by up to 60%. The National Highway Traffic
to reduce speeds on freeways to 55 miles per hour and Safety Administration reports that fixed speed cameras
the introduction of context-specific speed limit reductions reduce injury crashes by 20% to 25%, and mobile speed
on local streets, with speeds capped at between 20 to 35 cameras reduce injury collisions by 21% to 51%.
miles per hour on local streets. Although over 100 communities across the United
Enforcement is a key equity consideration for this strategy, States have automated speed enforcement programs,
and it will require thoughtful implementation to ensure this tool is not currently authorized in California. A
that undue burdens are not placed on communities of change to state law is required before this technology
color. Billions of dollars are allocated to fund infrastructure is available to local jurisdictions. In 2017, California
investments that slow down cars without the need for in- came close to allowing automated speed enforcement
person enforcement. Design elements like speed bumps with Senate Bill 342 (Chiu), which would have enabled
and roundabouts on local roads naturally reduce speeds San Francisco and San Jose to begin pilot programs,
and improve pedestrian comfort levels. On freeways though the bill ultimately did not pass. In February
where options for design interventions are more limited, 2021, Assembly Member Chiu introduced Assembly
automated speed enforcement, while not yet permitted Bill 550, another attempt to allow automated speed
in California, presents a promising path forward for enforcement with a greater emphasis on privacy than
enforcement without bias. SB 342. MTC has joined forces with San Francisco,
Oakland, San Jose and a wide spectrum of advocacy
organizations to advocate for the option to employ
automated speed enforcement.
8 Pierson, E. et al. (2020). A large-scale analysis of racial
disparities in police stops across the United States. Nature
Human Behaviour, 4(7), 736-745. doi:10.1038/s41562-020-0858-
7 The Vision Zero Network. (© 2021). What is the Vision Zero Network? 1. https://www.nature.com/articles/s41562-020-0858-1
https://visionzeronetwork.org/about/vision-zero-network/
65 D R A F T Pl an B ay A re a 2 0 5 0STRATEGIES Build a Next-Generation Transit Network
Prior to the pandemic, the Bay Area’s transit system faced crowding on its busiest routes,
long wait times for transfers and missing links with no transit service, among other
challenges. While some major projects have been completed since the last regional long-
range plan update in 2017 — for example, Bay Area Rapid Transit (BART) extensions to
Antioch and Berryessa and bus improvements like Alameda County Transit (AC Transit)'s
Tempo bus rapid transit line — further investments will be required to meet the Bay
Area’s needs as its population grows and transit ridership returns to pre-pandemic levels.
Coordinated investments in the region’s rail network would provide an expanded and
improved foundation for transit, with more frequent and reliable feeder bus and light
rail service providing local connections. Express bus service would play a larger role in
helping people move throughout the Bay Area, supported by a contiguous network of
express lanes that allow carpoolers and buses to bypass congestion. Transit fare reforms
described earlier would reduce the cost of transit for riders with low incomes, lowering
the cost barrier and allowing all residents to benefit from these improvements.
Photo: Karl Nielsen
D R A F T Pl an B ay A re a 2 0 5 0 66Photo: Karl Nielsen
A REGIONAL APPROACH TO RECOVERY
PLANNING TRANSIT’S REBOUND FOLLOWING COVID-19
The COVID-19 pandemic brought unprecedented Another primary function of the task force was to inform
challenges to Bay Area transit operations. Almost the distribution of federal emergency funds for public
overnight, transit operators were forced to drastically transit included in the Coronavirus Aid, Relief, and
alter service as they were thrust into the spotlight of Economic Security Act of 2020. As of May 2021, MTC
public safety concerns. As transit operators grappled has allocated over $2 billion of federal emergency funds
with serious funding shortfalls, changing safety to Bay Area transit operators, enabling a baseline level
guidelines and existential questions about the future of transit service provision throughout the past year.
of travel, MTC and ABAG took action to coordinate at a Another $1.7 billion in federal funding is expected to
regional scale. support the region’s transit operations into 2021 and
In May 2020, MTC convened a task force to help the beyond. As additional funding comes in from sources like
region’s public transportation operators and decision- the American Rescue Plan and other federal recovery
makers work together during the pandemic. The Blue efforts, the task force will provide a venue for regional
Ribbon Transit Recovery Task Force is comprised of prioritization and collaboration.
transit operators, local elected officials, representatives Looking ahead, MTC, with assistance from the task force,
from the State Senate and State Assembly, members of will continue to oversee the return of transit service
the California State Transportation Agency, business and hours to their pre-pandemic levels, with an emphasis
labor groups, and transit and social justice advocates. on improving transit service to meet Bay Area residents’
Through the task force process, Bay Area transit agencies needs. As this near-term work continues between transit
developed Riding Together: Bay Area Healthy Transit operators and their partners on the task force, Plan Bay
Plan to protect the health and safety of transit riders Area 2050 provides a complementary long-term plan for
and employees. The plan also aimed to build residents’ transportation in the region. On top of restoring transit
confidence in public transit as the region emerges service to pre-pandemic levels, the transportation
from the pandemic. Many transit agencies jointly strategies infuse billions of dollars in investments into new
developed the plan to standardize their health and safety rail lines and express bus service, faster and more reliable
commitments and outline their shared expectations for local transit, an expanded network of bike lanes and
both employees and customers. paths and optimized highways and local roads to meet
the needs of Bay Area residents into 2050 and beyond.
67 D R A F T Pl an B ay A re a 2 0 5 0Photo: Noah Berger
The first step in creating a next-generation transit network To strengthen the quality of baseline service, frequency
in Plan Bay Area 2050 is to enhance the frequency, boosts on bus and light rail service throughout the Bay
reliability and capacity of existing local transit systems. Area would be implemented. This includes improvements
Bus and light rail systems provide important connections on urban systems like AC Transit, Muni and VTA, as well as
for trips around town or as start or end points to longer on suburban systems like Napa VINE, County Connection
trips around the region. Improvements that make these in Contra Costa County, and Sonoma County Transit. More
connections more convenient build toward a more frequent service will allow passengers to enjoy shorter
connected future. Frequency boosts can reduce wait times wait times, more convenient service and less crowding as
and crowding; strategic extensions can serve new jobs and ridership recovers in a post-pandemic world.
housing centers; and infrastructure upgrades can make
transit faster and more reliable for all. Beyond frequency boosts, a range of infrastructure
investments would improve speed and reliability for local
Investments in local transit, including more frequent bus and light rail passengers under Plan Bay Area 2050’s
service or “quick build” improvements like bus-only lanes local transit strategy. Several of the region’s highest-
or transit signal priority, could be implemented relatively ridership bus corridors would be transformed through
quickly to make a major impact in a short amount of bus rapid transit investments, including San Francisco’s
time. Furthermore, projects improving local transit Geary Boulevard, San Pablo Avenue in the East Bay, and
service tend to benefit transit riders with lower incomes, El Camino Real in San Mateo and Santa Clara counties. In
translating investments to equitable outcomes.9 Most Santa Clara County, segments of downtown San Jose’s
investments within this strategy are prioritized for near-term street-level light rail would be moved underground or
implementation, allowing riders with lower incomes to reap elevated to bypass traffic congestion. Throughout the Bay
the earliest benefits. Area, transit signal priority investments would help buses
coast through green lights at a low cost.
9 MTC and ABAG. (2020, January). Futures Final Report: Resilient and Equitable Strategies for the Bay Area’s Future. https://mtc.ca.gov/sites/default/
files/Horz_Futures_Report.web_.pdf
D R A F T Pl an B ay A re a 2 0 5 0 68Photo: Noah Berger
Rounding out this strategy, new local transit lines are
envisioned to support areas forecasted for substantial new
housing growth. This includes extensions of VTA light rail
to Eastridge Mall and to Cupertino along Stevens Creek
Boulevard, as well as new bus routes serving development
in the city of Alameda and Hunters Point and Candlestick
Point in San Francisco.
Plan Bay Area 2050 also envisions an expanded and
modernized regional rail network, with a set of
investments that puts the Bay Area on the path toward
a world-class rail system. The Bay Area’s rail systems —
Muni Metro, BART, Caltrain, Capitol Corridor, the Altamont
Corridor Express and Sonoma-Marin Area Rail Transit — are
the backbone of mobility in the region, carrying hundreds
of thousands of passengers each day to their destinations.
The anchor of a plan for rail in the Bay Area, looking out
over the next three decades, is Link21, a new program to
transform Northern California’s passenger rail network
with a new transbay crossing between Oakland and San
Francisco at its core. This new crossing will provide much-
needed capacity in the heart of the Bay Area and beyond.
Photo: Karl Nielsen
69 D R A F T Pl an B ay A re a 2 0 5 0Photo: Noah Berger
Various studies contributed to the conclusion that a new Bay Area but commute into the region to work. Interregional
transbay crossing is needed, including the Bay Area Core commuters, many of whom commute via car due to a lack
Capacity Transit Study, a joint effort of BART, Muni, AC of competitive transit alternatives, see improved options
Transit, Caltrain, the Water Emergency Transportation under Plan Bay Area 2050’s strategies. For those commuting
Authority (WETA), SFCTA and MTC. A 2019 Horizon into the Bay Area from the south, the plan includes
perspective paper titled Crossings also explored the investments that lay the foundation for California High-
relative merits of seven different potential transbay Speed Rail in the region. Commuters living east of the Bay
crossings, finding that a new rail crossing served by BART, Area in San Joaquin County can also expect to see a new
conventional rail, or both held substantial benefits for the rail connection through Valley Link, a commuter rail line
Bay Area when compared to a road crossing or no change that will connect the Dublin/Pleasanton BART station with
at all. destinations in eastern Alameda County, into the Central
Valley. These new interregional services are integrated
Boosting the frequencies of the Bay Area’s current into the regional transit system via schedule coordination,
rail systems can also provide better service for riders allowing for easy transfers with minimal wait times.
throughout the region, and a limited set of rail extensions
or new rail routes can fill in gaps in the network. These Ferries present another option for shoring up transbay
extensions include BART’s extension to downtown capacity in the near term at a smaller scale. Plan Bay
San Jose, the Caltrain downtown San Francisco extension, Area 2050 invests in new ferry service and in increases in
and the return of rapid transit service on the Dumbarton frequency to existing service to complement investments
rail bridge. in regional transit. Such investments include new ferry
service to Berkeley, Redwood City, Treasure Island and
Plan Bay Area 2050 also responds to the challenge of in- Mission Bay, alongside frequency boosts across the Golden
commuters, or people who live outside of the nine-county Gate and WETA systems.
D R A F T Pl an B ay A re a 2 0 5 0 70CALIFORNIA HIGH-SPEED RAIL
CONNECTING TO THE MEGAREGION — AND BEYOND
When it comes to transportation megaprojects, there of San Jose’s Diridon Station, and selective grade
is no project bigger than California High-Speed Rail, separations. Further south, grade separations,
designed to connect the Bay Area, Central Valley and electrification and modernization investments
Los Angeles in under three hours. Approved by voters throughout the Caltrain/HSR corridor extending
in 2008, construction is well underway in the Central through the Pacheco Pass would play an integral role in
Valley, with new viaducts being built to enable travel at making the statewide vision a reality.
more than 200 miles per hour through the heart of the With a funding gap of at least $15 billion to connect
Golden State. When completed, the project will allow the Bay Area and the Central Valley, and approximately
Bay Area residents, commuters and visitors to reach $45 billion more needed to complete connections to
destinations throughout California much more quickly, Southern California, it is clear that the federal and state
while avoiding congested highways and busy airports. governments must play a central role in funding and
Importantly, high-speed rail also aligns with state and delivering this megaproject. Significant and sustained
regional climate goals, providing a lower-emissions funds from Washington, D.C. and Sacramento are
alternative to driving or flying within the corridor. critical to enacting the voter-approved vision. MTC
With a total cost exceeding $80 billion, high-speed rail and ABAG are well-positioned to take on a significant
(HSR) will create new opportunities for communities role in advocating for federal infrastructure dollars, as
across the Bay Area, but none more so than the four Congress considers a major infrastructure package in
cities with HSR stations — San Francisco, Millbrae, San the months and years ahead.
Jose and Gilroy. While each community has its own Moreover, with the Bay Area poised to invest billions
unique character and context, these hubs will provide of dollars to remake this central corridor, a strong,
the opportunity for affordable, seamless connections shared regional vision is critical. MTC and ABAG
and easy access to destinations not just in the region will work closely with partners in Sacramento and
but in the megaregion and beyond. Each HSR station Washington to represent Bay Area residents’ priorities
area is identified as a Plan Bay Area 2050 Growth for rail connections throughout the region and beyond,
Geography — a focus point for future jobs and housing. including working to ensure that the next phase of
Certainly, not every Bay Area resident will be able to construction prioritizes the “Valley to Valley” segment,
live within walking or biking distance of these four HSR connecting the Central Valley trunk line to the job-rich
stations. Existing regional rail systems like Caltrain, Bay Area.
BART, VTA and Muni will provide connectivity at HSR rail
hubs — creating a supportive “rail skeleton” for a next-
generation transit network. Infrastructure projects like
Caltrain Modernization, slated for completion by 2023,
will also improve speeds and service frequencies for
Bay Area residents to more quickly connect to planned
HSR stations. In the decades ahead, Plan Bay Area
2050 identifies a suite of dual-purpose improvements
to provide better access to HSR. In the region’s core,
this includes the extension of Caltrain/HSR to San Photo: California High-Speed Rail Authority (CHSRA)
Francisco’s Salesforce Transit Center, the modernization
71 D R A F T Pl an B ay A re a 2 0 5 0Photo: Noah Berger
Plan Bay Area 2050 includes a limited selection of freeway widening projects, with a
larger focus on making better use of the existing freeway network. Express lanes have
been a resource for Bay Area drivers since 2010, providing a reserved freeway lane that
allows buses, carpoolers and fee-paying solo drivers to bypass congestion on several
corridors throughout the region. The tolls on these lanes increase as traffic increases and
decrease as traffic decreases to provide more reliable travel times. Plan Bay Area 2050
builds an integrated regional express lanes and express bus network, resulting in 600
miles of express lanes throughout the Bay Area that would enable fast and reliable express
bus service and carpool trips. Robust regional express bus service complements regional
rail and local transit, providing an improved option for regional trips without the need for
extensive infrastructural upgrades.
Planning for express lanes is closely linked with the aforementioned strategy to implement
per-mile tolling on select freeways with transit alternatives. Express lanes serve as a near-
term investment that improves travel conditions, with per-mile tolling providing a medium-
to long-term policy flexible enough to ensure that roads do not become overwhelmed with
congestion as the Bay Area’s population grows, even if driving were to become cheaper or
more attractive. On corridors where per-mile tolling is proposed under Plan Bay Area 2050,
the express lanes could convert to carpool- and bus-only lanes, ensuring that carpoolers
and bus passengers continue to see the benefits of a priority lane on freeways.
D R A F T Pl an B ay A re a 2 0 5 0 72COLUSA
MENDOCINO SUTTER
128
Cloverdale
LAKE
YOLO SMF
29
Healdsburg
113
Calistoga
101
SONOMA Windsor
St. Helena
128 505
STS Santa Rosa 128
116 NAPA Dixon
29
Yountville
Sebastopol 12
Vacaville
121
Rohnert Park 80 5
Cotati
Napa SACRAMENTO
Sonoma Fairfield
MAP 4.2
Petaluma Suisun City SOLANO
116 12
Regional Transit
29 Rio
121
American 80 12 Vista
Canyon 680
37
Investments Novato
Vallejo
Benicia
FERRY MARIN Martinez Pittsburg
101 Pinole Hercules
New Ferry Service 1 Fairfax San San 4
4
Oakley
San Anselmo Rafael Pablo 80
Ross Pleasant Hill Concord Antioch
RAIL Larkspur Clayton
Corte Madera Richmond El Cerrito
Lafayette Walnut CONTRA Brentwood SAN
4
Existing BART Service Mill Valley
Tiburon
Belvedere
Albany
24
Orinda
Creek COSTA JOAQUIN
New BART Service Berkeley 5
Sausalito Emeryville Moraga
SAN Piedmont
OAKLAND Danville
BART Frequency Boost FRANCISCO
101
680 San
Ramon
Alameda
Existing Commuter Rail Service
OAK Dublin 580
580
New Commuter Rail Service Daly City Colma Brisbane
San Leandro Pleasanton
880 Livermore 580
South San Francisco
Commuter Rail Frequency Boost 280
San Bruno SFO Union City
New BART or Commuter Rail Crossing
Pacifica
Millbrae Burlingame
San
Hayward
92 ALAMEDA
680
Mateo
Foster City
Hillsborough
Redwood 84 Fremont
EXPRESS BUS Belmont
101
City
1
San Carlos Newark 880
New Express Bus Service Half 92 East Palo Alto
Atherton
Moon Menlo Park Mountain
Bay View Milpitas
HIGH-SPEED RAIL Woodside
Portola Palo SJC
New Rail Service SAN Valley LosAltoLos Altos
Sunnyvale
Altos
MATEO
84 Hills 280
Santa SAN JOSE
GROUP RAPID TRANSIT Cupertino Clara
New Rail Service Saratoga Campbell SANTA
Monte
85 CLARA
Sereno Los Gatos
Plan Bay Area 2050 Growth Geographies 1
REGIONAL TRANSPORTATION Morgan Hill
17
Major Airport
SANTA CRUZ 101
Major Seaport 17
1
Gilroy
SCALE
152
1 152
OAKLAND > 350,000
SAN
Novato 50,000 – 350,000 BENITO
Miles Alignments are for illustrative purposes only. Improvements to
Kilometers existing express bus or ferry frequencies are not shown. New express
bus service with peak headways greater than 15 minutes is not shown. MONTEREY
For more information on the individual transportation projects
Source: TomTom North America, 2019 included in Plan Bay Area 2050, see the Transportation Project List.
73Author:DPB,
Map R5/21
A F T Pl an B ay A re a 2 0 5 0Hercules
101 Alignments are for illustrative purposes only. Improvements to
4 existing local bus frequencies are not shown. For more 4
information on the individual transportation projects included
Pinole in Plan Bay Area 2050, see the Transportation Project List.
4
San Rafael
80
San Anselmo POPULATION
San OAKLAND > 350,000 Concord
Ross Pablo
Pleasant Hill
Novato 50,000 – 350,000
Larkspur Richmond
580 Pacifica < 50,000
Corte Madera
El Cerrito Walnut
Creek
MARINMill Valley Lafayette
Albany
Tiburon
Belvedere Berkeley Orinda CONTRA
80 COSTA
Sausalito 24
580
Emeryville Moraga 680
Piedmont Danville
101 80 13
OAKLAND
SAN FRANCISCO
Alameda
580
ALAMEDA
OAK
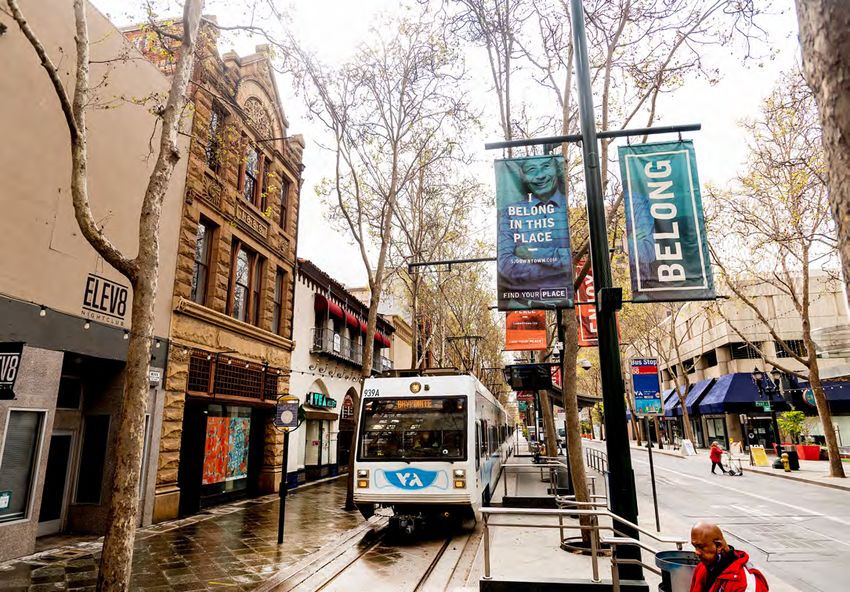
MAP 4.3 San 580
Local
Daly Brisbane
Leandro
City Colma
Transit 1
880
Investments South San Francisco
Hayward
LIGHT RAIL
Existing Light Rail Service 101 SFO
San Bruno 880
Milpitas Unio
New Light Rail Service
280 Mountain 92
Light Rail Frequency Boost Millbrae View
TO
Light Rail Grade Separation PALO ALTO San SANTA
BUS RAPID TRANSIT
CALTRAIN Mateo Sunnyvale Santa
Foster CityClara
CLARA
STATION Los Altos
Existing Bus Rapid Transit Hillsborough
New Bus Rapid Transit 280 84
101
Plan Bay Area 2050 Growth Geographies Redwood
City
REGIONAL TRANSPORTATION
Belmont
Cupertino
SAN JOSE
Newark
8
Major Airport 92 San Carlos
Major Seaport SAN 85
Rail Half
Moon MATEO Saratoga
Atherton Campbell
East Palo Alto 101
Highway & Interstate
Bay 87
Major Road Miles Miles Menlo Park
Monte
Source: TomTom North America, 2019 Kilometers Kilometers Sereno
17
Map Author: PB, 5/21
D R A F T Pl an B ay A re a 2 0 5 0 74
Woodside Palo Los Gatos Mountain
Alto ViewTRANSPORTATION STRATEGIES Funding and Implementation Together, Plan Bay Area 2050’s 12 transportation strategies move the Bay Area toward a more equitable future by ensuring that residents with low incomes can rely on the current system of roads and transit options, investing in more safe and healthy streets, and improving the region’s transit network. Through advocacy, legislation, initiatives, planning and research over the next 30 years, MTC and ABAG can work with partners to secure a $579 billion investment into our region’s future mobility, ensuring that everyone — and especially those historically marginalized and currently underserved — can get where they need to go with safety and ease. Photo: Karl Nielsen 75 D R A F T Pl an B ay A re a 2 0 5 0
Transportation Strategies — Cost : $579 Billion

                T1. Restore, operate and maintain the existing system. Commit to operate and maintain the                 $390
                Bay Area’s roads and transit infrastructure while restoring transit service hours to 2019 levels.
                                                                                                                         BILLION

                T2. Support community-led transportation enhancements in Equity Priority
                Communities. Provide direct funding to historically marginalized communities for locally
                                                                                                                            $8
                identified transportation needs.                                                                         BILLION

                T3. Enable a seamless mobility experience. Eliminate barriers to multi-operator transit
                trips by streamlining fare payment and trip planning while requiring schedule coordination
                                                                                                                            $3
                at timed transfer hubs.                                                                                  BILLION
   Maintain
and Optimize
                T4. Reform regional transit fare policy. Streamline fare payment and replace existing operator-            $10
 the Existing   specific discounted fare programs with an integrated fare structure across all transit operators.
                                                                                                                         BILLION
   System
                T5. Implement per-mile tolling on congested freeways with transit alternatives. Apply
                a per-mile charge on auto travel on select congested freeway corridors where transit                        $1
                alternatives exist, with discounts for carpoolers, low-income residents, and off-peak travel;            BILLION
                and reinvest excess revenues into transit alternatives in the corridor.
                T6. Improve interchanges and address highway bottlenecks. Rebuild interchanges and                         $11
                widen key highway bottlenecks to achieve short- to medium-term congestion relief.
                                                                                                                         BILLION

                T7. Advance other regional programs and local priorities. Fund regional programs like motorist             $18
                aid and 511 while supporting local transportation investments on arterials and local streets.
                                                                                                                         BILLION

                T8. Build a Complete Streets network. Enhance streets to promote walking, biking and
                other micro-mobility through sidewalk improvements, car-free slow streets, and 10,000                      $13
   Create       miles of bike lanes or multi-use paths.                                                                  BILLION
  Healthy
  and Safe      T9. Advance regional Vision Zero policy through street design and reduced speeds.
   Streets      Reduce speed limits to between 20 and 35 miles per hour on local streets and 55 miles                       $4
                per hour on freeways, relying on design elements on local streets and automated speed                    BILLION
                enforcement on freeways.

                T10. Enhance local transit frequency, capacity and reliability. Improve the quality and
                availability of local bus and light rail service, with new bus rapid transit lines, South Bay              $31
                light rail extensions, and frequency increases focused in lower-income communities.                      BILLION

Build a Next-   T11. Expand and modernize the regional rail network. Better connect communities while
 Generation     increasing frequencies by advancing the Link21 new transbay rail crossing, BART to Silicon                 $81
   Transit      Valley Phase 2, Valley Link, Caltrain Downtown Rail Extension and Caltrain/High-Speed Rail
  Network
                                                                                                                         BILLION
                grade separations, among other projects.
                T12. Build an integrated regional express lanes and express bus network. Complete the
                buildout of the regional express lanes network to provide uncongested freeway lanes for
                                                                                                                            $9
                new and improved express bus services, carpools and toll-paying solo drivers.                            BILLION

                                                                                            D R A F T Pl an B ay A re a 2 0 5 0   76
You can also read