Detection of the Schwarzschild precession in the orbit of the star S2 near the Galactic centre massive black hole
←
→
Page content transcription
If your browser does not render page correctly, please read the page content below
Astronomy & Astrophysics manuscript no. s2_precession_resubmitted                                                                       c ESO 2020
March 4, 2020

                                                             Letter to the Editor

  Detection of the Schwarzschild precession in the orbit of the star
           S2 near the Galactic centre massive black hole
    GRAVITY Collaboration? : R. Abuter8 , A. Amorim6, 14 , M. Bauböck1 , J.P. Berger5, 8 , H. Bonnet8 , W. Brandner3 ,
 V. Cardoso14, 16 , Y. Clénet2 , P.T. de Zeeuw12, 1 , J. Dexter15, 1 , A. Eckart4, 11 , F. Eisenhauer1 , N.M. Förster Schreiber1 ,
 P. Garcia7, 14 , F. Gao1 , E. Gendron2 , R. Genzel1, 13 , S. Gillessen1 , M. Habibi1 , X. Haubois9 , T. Henning3 , S. Hippler3 ,
    M. Horrobin4 , A. Jiménez-Rosales1 , L. Jochum9 , L. Jocou5 , A. Kaufer9 , P. Kervella2 , S. Lacour2 , V. Lapeyrère2 ,
        J.-B. Le Bouquin5 , P. Léna2 , M. Nowak18, 2 , T. Ott1 , T. Paumard2 , K. Perraut5 , G. Perrin2 , O. Pfuhl8, 1 ,
       G. Rodríguez-Coira2 , J. Shangguan1 , S. Scheithauer3 , J. Stadler1 , O. Straub1 , C. Straubmeier4 , E. Sturm1 ,
     L.J. Tacconi1 , F. Vincent2 , S. von Fellenberg1 , I. Waisberg17, 1 , F. Widmann1 , E. Wieprecht1 , E. Wiezorrek1 ,
                                                 J. Woillez8 , and S. Yazici1, 4
                                                   (Affiliations can be found after the references)

                                                            Draft version March 4, 2020

                                                                    ABSTRACT

The star S2 orbiting the compact radio source Sgr A* is a precision probe of the gravitational field around the closest massive black hole (candidate).
Over the last 2.7 decades we have monitored the star’s radial velocity and motion on the sky, mainly with the SINFONI and NACO adaptive optics
(AO) instruments on the ESO VLT, and since 2017, with the four-telescope interferometric beam combiner instrument GRAVITY. In this paper
we report the first detection of the General Relativity (GR) Schwarzschild Precession (SP) in S2’s orbit. Owing to its highly elliptical orbit
(e = 0.88), S2’s SP is mainly a kink between the pre-and post-pericentre directions of motion ≈ ±1 year around pericentre passage, relative to the
corresponding Kepler orbit. The superb 2017-2019 astrometry of GRAVITY defines the pericentre passage and outgoing direction. The incoming
direction is anchored by 118 NACO-AO measurements of S2’s position in the infrared reference frame, with an additional 75 direct measurements
of the S2-Sgr A* separation during bright states (‘flares’) of Sgr A*. Our 14-parameter model fits for the distance, central mass, the position and
motion of the reference frame of the AO astrometry relative to the mass, the six parameters of the orbit, as well as a dimensionless parameter fSP
for the SP ( fSP = 0 for Newton and 1 for GR). From data up to the end of 2019 we robustly detect the SP of S2, δφ ≈ 120 per orbital period.
From posterior fitting and MCMC Bayesian analysis with different weighting schemes and bootstrapping we find fSP = 1.10 ± 0.19. The S2 data
are fully consistent with GR. Any extended mass inside S2’s orbit cannot exceed ≈ 0.1% of the central mass. Any compact third mass inside the
central arc-second must be less than about 1000 M .
Key words. black hole physics – Galaxy: nucleus – gravitation – relativistic processes

1. Introduction                                                              presently the best evidence that the compact in-spiralling bina-
                                                                             ries are indeed merging sBHs, but see Cardoso & Pani (2019).
1.1. Testing GR and the Massive Black Hole Paradigm
                                                                                  Following the discovery of quasars (Schmidt 1963), evidence
The theory of General Relativity (GR) continues to pass all ex-              has been growing that most massive galaxies harbour a cen-
perimental tests with flying colours (Einstein 1916; Will 2014).             tral compact mass, perhaps in the form of a massive black hole
High-precision laboratory and solar system experiments, and ob-              (MBH: 106 − 1010 M , Lynden-Bell & Rees 1971; Kormendy &
servations of solar mass pulsars in binary systems (Kramer et al.            Ho 2013; McConnell & Ma 2013). Are these compact mass con-
2006; Kramer 2016) have confirmed GR in the low curvature                    centrations truly MBHs as predicted by GR? Evidence in favour
regime. Gravitational waves from several stellar mass, black hole            comes from relativistically broadened, redshifted iron Kα line
(sBH) candidate in-spirals with LIGO (Abbott et al. 2016) have               emission in nearby Seyfert galaxies (Tanaka et al. 1995; Fabian
tested the strong curvature limit.                                           et al. 2000), from stellar or gas motions very close to them
    GR predicts black holes, that is, space-time solutions with a            (e.g. Moran et al. 1999), and high resolution millimetre imag-
non-spinning or spinning central singularity cloaked by a com-               ing (Event Horizon Telescope Collaboration et al. 2019).
munication barrier, an event horizon (c.f. Schwarzschild 1916;                    The nearest MBH candidate is at the centre of the Milky Way
Kerr 1965). The LIGO measurements mentioned above provide                    (R0 ≈ 8 kpc, M• ≈ 4 × 10⁶ M , Genzel et al. 2010; Ghez et al.
  ?
                                                                             2008). It is coincident with a very compact, variable X-ray, in-
     GRAVITY is developed in a collaboration by the Max Planck               frared and radio source, Sgr A*, which in turn is surrounded by
Institute for extraterrestrial Physics, LESIA of Paris Observatory /
                                                                             a very dense cluster of orbiting young and old stars. Radio and
CNRS / Sorbonne Université / Univ. Paris Diderot and IPAG of Uni-
versité Grenoble Alpes / CNRS, the Max Planck Institute for As-              infrared observations have provided detailed information on the
tronomy, the University of Cologne, the CENTRA - Centro de As-               distribution, kinematics and physical properties of this nuclear
trofisica e Gravitação, and the European Southern Observatory.               star cluster and hot, warm and cold interstellar gas interspersed
Corresponding authors: R. Genzel (genzel@mpe.mpg.de), S. Gillessen           in it (c.f. Genzel et al. 2010; Morris et al. 2012; Falcke & Markoff
(ste@mpe.mpg.de), A. Eckart (eckart@ph1.uni-koeln.de).                       2013). Groups in Europe at the ESO NTT & VLT and in the USA
                                                                                                                         Article number, page 1 of 14
A&A proofs: manuscript no. s2_precession_resubmitted

at the Keck telescopes have carried out high-resolution imaging        superior astrometric capabilities of GRAVITY serve to set much
and spectroscopy of the nuclear star cluster over the past two         tighter constraints on the orbital geometry, mass and distance,
and a half decades. They determined increasingly precise mo-           thus decreasing the uncertainty of fRS more than three times rel-
tions for more than 104 stars, and orbits for ≈ 50 (Schödel et al.     ative to data sets constructed from single telescope, AO imaging
2002; Ghez et al. 2003, 2008; Eisenhauer et al. 2005; Gillessen        and spectroscopy.
et al. 2009b; Schödel et al. 2009; Meyer et al. 2012; Boehle et al.        In the following we report the first measurement of the next
2016; Fritz et al. 2016; Gillessen et al. 2017). These orbits, in      relativistic effect in S2’s orbit, namely the in-plane, prograde
particular the highly eccentric orbit of the mK ≈ 14 star S2           precession of its pericentre angle, the Schwarzschild precession
(or ‘S02’ in the UCLA nomenclature), have demonstrated that            (Misner et al. 1973).
the gravitational potential is dominated by a compact source of
4.25 × 10⁶ M , concentrated within S2’s pericentre distance. S2
appears to be a slowly rotating, single, main sequence B-star of       2. Observations
age ≈ 6 Myrs (Martins et al. 2008; Habibi et al. 2017; Gravity         Following on from Gravity Collaboration et al. (2018a, 2019)
Collaboration et al. 2017; Chu et al. 2018).                           we expand in this paper our analysis of the positions and K-
    The location of the radio source Sgr A* coincides with that of     band spectra of the star S2 by another year, to fall of 2019. This
the mass centroid to much better than 1 mas (Plewa et al. 2015;        yielded five additional NACO points, six SINFONI points and,
Sakai et al. 2019). Millimetre Very Long Baseline Interferometry       especially, eleven crucial GRAVITY points. We now have
(Falcke et al. 2000; Doeleman et al. 2008; Johnson et al. 2017;
Issaoun et al. 2019) shows that Sgr A* has a 1.3 mm half-light ra-      – 118 measurements with the VLT AO assisted infrared cam-
dius less than 18 µas, or 1.8 times the Schwarzschild radius (RS )        era NACO (Lenzen et al. 1998; Rousset et al. 1998) between
of a 4.25 × 10⁶ M MBH. Sgr A* shows no detectable intrinsic               2002 and 2019.7 of the position of S2 in the K or H-bands,
motion within the international celestial reference frame ICRF.           relative to the ‘Galactic Centre infrared reference system’
This supports the interpretation that the compact radio source is         (Plewa et al. 2015, rms uncertainty ≈ 400 µas). This means
coincident with the mass (Reid & Brunthaler 2004; Reid et al.             that between the 2002.33 pericentre passage until 2019.7 we
2009; Reid & Brunthaler 2020).                                            have seven to sixteen NACO positional measurements per
    The Galactic Centre currently provides the best ‘laboratory’          year. Between 1992 and 2002 we also used the speckle cam-
to test GR near MBHs and ultimately test the MBH paradigm                 era SHARP @ NTT (Hofmann et al. 1993), but the astrom-
(Alexander 2005, 2017; Genzel et al. 2010; Psaltis et al. 2016).          etry of the speckle data on a 3.5 m telescope is an order of
                                                                          magnitude worse than the AO imagery on the 8 m VLT (rms
                                                                          uncertainty ≈ 3.8 mas);
1.2. Detection of GR effects in the orbits of stars around              – 75 NACO measurements between 2003.3 and 2019.7 of the
     Sgr A*: Gravitational Redshift                                       direct S2-Sgr A* separation during bright states of Sgr A*
                                                                          (typical rms uncertainty 1.7 mas);
Following the observations of the pericentre passage of S2 in           – 54 GRAVITY measurements between 2016.7 and 2019.7 of
2002.33 (Schödel et al. 2002; Ghez et al. 2003) it became clear           the S2-Sgr A* separation (rms uncertainty ≈ 65 µas). During
that the first-order (O(β2 ), β = v/c), GR-effects of the orbit           the pericentre passage year 2018 the sampling was especially
may be in reach of precision observations. These are the grav-            dense with 25 measurements;
itational redshift (RS) PPN1RS (λ), and the Schwarzschild pre-          – 92 spectroscopic measurements of the 2.167 µm HI (Brγ)
cession PPN1SP (x, y), see Rubilar & Eckart (2001); Zucker et al.         and the 2.11 µm HeI lines between 2003.3 and 2019.45 with
(2006); Angélil et al. (2010); Angélil & Saha (2014); Grould              the AO assisted integral field spectrometer SINFONI at the
et al. (2017); Parsa et al. (2017). For this purpose a significant        VLT (Eisenhauer et al. 2003; Bonnet et al. 2003), with an
(factor 4 − 10) improvement in astrometry compared to the state           uncertainty of ≈ 12 km/s (Gravity Collaboration et al. 2019).
of the art in 2010 was needed. We achieved this goal with the             This means that we typically have three to six spectroscopic
development of GRAVITY, a cryogenic, interferometric beam                 measurements per year, and more than 20 in 2018. We also
combiner of all four UTs of the ESO VLT, along with AO sys-               added two more NACO AO slit spectroscopic measurements
tems for all four UTs, and a laser metrology system (Gravity              from 2003, and three more Keck-NIRC2 AO spectroscopic
Collaboration et al. 2017).                                               measurements between 2000 and 2002 (Do et al. 2019).
     On May 19th, 2018 (2018.38) S2 passed pericentre at
120 AU (≈ 1400 RS ) with an orbital speed of 7700 km/s (β =                The SHARP/NACO data deliver relative positions between
0.026). From monitoring the star’s radial velocity and motion          stars in the nuclear star cluster, which then are registered in the
on the sky from data taken prior to and up to two months after         radio frame of the Galactic Centre (Reid et al. 2009; Reid &
pericentre, Gravity Collaboration et al. (2018a) were able to de-      Brunthaler 2020) by multi-epoch observations of nine infrared
tect the first post-Newtonian effect of GR, the gravitational red-     stars common between the infrared and radio bands. Another im-
shift, along with the transverse Doppler effect of special relativ-    portant step is the correction of spatially variable image distor-
ity (SRT, Misner et al. 1973). Gravity Collaboration et al. (2019)     tions in the NACO imager, which are obtained from observations
improved the statistical robustness of the detection of the RS to      of an HST-calibrated globular cluster (Plewa et al. 2015). The ra-
 fRS = 1.04 ± 0.05, where the dimensionless parameter fRS is 0         dio calibrations still allow for a zero-point offset and a drift of the
for Newtonian orbits and 1 for GR-orbits. Do et al. (2019) con-        radio-reference frame centered on Sgr A* (strictly speaking on
firmed these findings from a second, independent data set mainly       the mass-centroid) with respect to the infrared reference frame,
from the Keck telescope, fRS = 0.88 ± 0.17.                            which we solve for empirically in our orbit fitting. For this pur-
     The combined PPN1RS (λ) gravitational redshift and trans-         pose we use the Plewa et al. (2015) radio-to-infrared reference
verse Doppler effect are detected as a 200 km/s residual centred       frame results as a prior (x0 = −0.2 ± 0.2 mas, y0 = 0.1 ± 0.2 mas,
on the pericentre time, relative to the fRS = 0 orbit (with the same   vx0 = 0.05±0.1 mas/yr, vy0 = 0.06±0.1 mas/yr). These reference
other parameters describing the star’s orbit and the gravitational     frame parameters (x0 , y0 , vx0 , vy0 ) are now the limiting factor in
potential). While the RS occurs solely in wavelength-space, the        the precision of the detection of S2’s SP.
Article number, page 2 of 14
GRAVITY Collaboration: R. Abuter et al.: Detection of Schwarzschild Precession
0.050
0.20 NACO & SHARP
GRAVITY 0.025
NACO flares
0.000 Fig. 1. Summary of the observational re-
RA ["]
sults of monitoring the S2-Sgr A* orbit
0.025 from 1992 to the end of 2019. Left: SHARP,
0.050 NACO (black points) and GRAVITY (blue
0.15 points) astrometric positions of the star S2,
0.075 along with the best fitting GR orbit (grey
1995 2000 2005 2010 2015 2020 2025
line). The orbit does not close due to the SP.
The mass centre is at (0,0), marked by the
0.15 cross. All NACO and SHARP points were
0.10 corrected for a zero point offset and drift in
0.10
Dec ["]
Dec ["]
RA/Dec. The red data points mark the posi-
tions of the infrared emission from Sgr A*
0.05
during bright states, where the separation of
0.00 S2 and Sgr A* can be directly inferred from
differential imaging. Right: RA- (top) and
0.05 1995 2000 2005 2010 2015 2020 2025 Dec- (middle) offset of S2 (black and blue)
and of the infrared emission from Sgr A*
SINFONI
4000 Keck (red) relative to the position of Sgr A* (as-
sumed to be identical with the mass centre).
vLSR [km/s]
2000 Grey is the best fitting GR-orbit including
0.00 the Rømer effect (finite speed of light), SRT,
0 and GR to PPN1. We assumed fRS = 1 and
fitted for fSP . Bottom right: same for the line
of sight velocity of the star.
2000
0.04 0.02 0.00 0.02 0.04 0.06 1995 2000 2005 2010 2015 2020 2025
RA ["] Time [yrs]
The situation is different for GRAVITY. Here we detect and to be very helpful. To this end, we include in the calculation of χ2
stabilize the interferometric fringes on the star IRS16C located the constraint that the flare positions are tracing the mass centre.
≈ 100 NE of Sgr A*, and observe S2 or Sgr A* within the second Confusion of S2 with nearby other sources is the final key
phase-referenced fibre (see Gravity Collaboration et al. 2017), issue (see also Gillessen et al. 2009b, 2017; Plewa & Sari 2018;
such that the positional difference between S2 and Sgr A* can Do et al. 2019). Ghez et al. (2003) and Schödel et al. (2002)
be determined to < 100 µas levels (see Appendix A.1). To ob- already had noted that the NACO/NIRC2 AO astrometry at
tain this accuracy the measurements of S2 and Sgr A* are made times was unreliable and biased over longer periods of time
within a short time interval and linked together interferometri- (0.5 − 1.5 years). These systematic position excursions turn out
cally (Appendix A.2). Between the end of 2017 and through- to be mainly caused by confusion, i.e. the positional pulling of
out 2018, S2 and Sgr A* are simultaneously detected in a sin- the apparent sky position of S2 by a passing nearby background
gle fibre-beam positioning as two unresolved sources in > 95% object. This issue is especially detrimental when the variable
of our individual integrations (5 mins each), such that the S2- Sgr A* emission source is within the diffraction limit of the tele-
Sgr A* distance is even more directly obtained in each of these scope (Ghez et al. 2003, 2008; Plewa & Sari 2018; Do et al.
measurements (Appendix A.3). The development over time of 2019), making the 2002 and 2018 AO astrometry more uncer-
the astrometric and spectroscopic measurement uncertainties are tain or even unusable. Fortunately GRAVITY removed any need
summarized in Figure A.3. For more details on the data analysis for AO imagery during the 2018 pericentre passage, so we ex-
of all three instruments we refer the reader to Gravity Collabo- cised most of the 2002 and 2018 NACO astrometry from our
ration et al. (2017, 2018a,b, 2019) and Appendix A. data set. We identified further confusion events with fainter stars
passing close to S2 on a number of occasions (e.g. 1998, 2006,
2013/2014) and removed these questionable data points.
3. Results At pericentre Rperi , S2 moves with a total space velocity of ≈
3.1. Schwarzschild precession in the S2 orbit 7700 km/s, or β = v/c = 2.56 × 10⁻² . The SP of the orbit is a first
order (β2N , N = 1) effect in the parameterized post-Newtonian
Figure 1 shows the combined single-telescope and interferomet- (PPN, c.f. Will & Nordtvedt 1972) expansion, PPN(1) ≈ β2 ≈
ric astrometry of the 1992-2019 sky-projected orbital motion of RS /Rperi ≈ 6.6 × 10⁻⁴ . We use the post-Newtonian expansion
S2 and the line-of sight velocity of the star. of Will (2008) and add a factor fSP in the equation of motion in
The almost hundred-fold improvement of statistical astro- front of the Schwarzschild related terms (see Appendix C). This
metric measurement precision in the last 27 years is one key for corresponds to (e.g. Misner et al. 1973)
detecting the SP in the S2 orbit. As discussed in Section 2, the ac-
3πRS for S2
curate definition of the reference frame for the NACO data is the ∆φper orbit = PPN1SP = fSP = fSP × 12.10 . (1)
second key. The robustness of the detection of the SP strongly a(1 − e2 )
correlates with the precision of knowing (x0 , y0 , vx0 , vy0 ), as this Here a is the semi-major axis and e the eccentricity of the orbit.
sets the angle of the orbit at the last apocentre (2010.35). Using The quantity fSP can then be used as a fitting parameter, similar
the priors from Plewa et al. (2015), we fit these four reference to our approach for the RS (Gravity Collaboration et al. 2018b,
frame parameters in our posterior fitting, but the additional con- 2019). Appendix B explains what effects the SP should have on
straints obtained from Sgr A*-S2 flare offsets in NACO turn out the measured parameters of S2’s orbit.
Article number, page 3 of 14
A&A proofs: manuscript no. s2_precession_resubmitted

                                                                  100
               40                                                  75
                                                                   50
               20
                                                                                                                   Fig. 2. Posterior analysis of all data
                                                                   25
 vLSR [km/s]

                                                     [arcmin]
                                                                                                                   by fitting for fSP simultaneously
                0                                                   0                                              with all other parameters. As in Fig-
                                                                                                                   ure B.2, the bottom panels show the
                                                                   25                                              residuals in RA (left) and Dec (right)
               20                                                                                                  between the data and the best fitting
                                                                   50
                                                                                                                   GR (thick red curve, fSP = 1.1), rel-
               40                            SINFONI               75                              NACO            ative to the same orbit for fSP = 0
                                             Keck                                                  GRAVITY         (Kepler/Newton, plus Rømer effect,
                2000   2005   2010   2015   2020 2025             100
                                                                    2000   2005   2010    2015    2020 2025        plus SRT, plus RS). Grey crosses de-
                                                                                                                   note individual NACO or SINFONI
               2.0                                                2.0                                              data, cyan filled black circles aver-
                                                                                                                   aged GRAVITY data, and grey rect-
               1.5                                                1.5                                              angles denote averages of the NACO
                                                                                                                   data. The top right panel shows the
               1.0                                                1.0
                                                                                                                   same for δϕ, and the top left for δvz.
               0.5                                                0.5                                              Blue filled black circles are averages
                                                      Dec [mas]
RA [mas]

                                                                                                                   of the SINFONI residuals, with all
               0.0                                                0.0                                              residuals shown as grey crosses. The
               0.5                                                0.5                                              best fit (red curve) has fSP = 1.1,
                                                                                                                   with a 1σ uncertainty of 0.19. In-
               1.0                                                1.0                                              cluding the flare data (Figure 1) the
                                                                                                                   overall reduced χ2r of this fit is 1.5.
               1.5                           NACO                 1.5                              NACO
                                             GRAVITY                                               GRAVITY
               2.0
                2000   2005   2010   2015   2020 2025             2.0
                                                                   2000    2005   2010    2015    2020 2025
                              Time [yrs]                                           Time [yrs]

3.2. Posterior Analysis                                                               Table E.1 lists the best fit parameters and their 1σ uncer-
                                                                                  tainties. Depending on the weighting of different data sets and
                                                                                  the choice of priors we find that the best fitting fSP parameter
The six parameters describing the Kepler orbit (a, e, i, ω, Ω, t0 ),              varies between 0.9 and 1.2, with a fiducial value of fSP = 1.1.
the distance and central mass, and the five coordinates describ-                  The formal statistical fit uncertainty of this parameter does not
ing the position on the sky and the three-dimensional velocity                    depend much on the selection of astrometric and spectroscopic
of the reference frame (relative to the AO spectroscopic/imaging                  data of S2. The value of its rms uncertainty ∆ fSP does depend
frame) all have uncertainties. In particular, distance and mass                   on the methodology of error treatment. The distribution of the
are uncertain and correlated. Following Gravity Collaboration                     NACO flare position residuals shows significant non-Gaussian
et al. (2018a, 2019) we find the best-fit value of the parame-                    outliers. There are ≈ six (of 75 data points) > 4σ outliers above
ter fSP a posteriori, including all data and fitting for the opti-                the rms of ≈ 1.7 mas. If the χ2 -distribution and the weight-
mum values of all parameters with the Levenberg-Marquardt χ2 -                    ing of these points are treated as if they had a normal distribu-
minimization algorithm (Levenberg 1944; Marquardt 1963), in-                      tion, the reduced χ2r of our overall fits is driven up to ≈ 1.65,
cluding prior constraints. It is essential to realize that the inferred           for a total χ2 of 995. In that case ∆ fSP = 0.204. These out-
measurement uncertainties are affected and partially dominated                    liers can be down-weighted by replacing the penalty function
by systematic effects, especially when combining the evidence                     p(r) = r2 in the calculation of χ2 = Σp((data − model)/error)
from three or more, very different measurement techniques.                        with p(r, s) = r2 · s2 /(r2 + s2 ), s = 10. This introduces a soft
                                                                                  cut-off around 10σ in how much a data point can maximally
    Figures 2 and 3 show the fit results when fitting simulta-                    contribute to the χ2 . With this scheme, χ2r of the overall fit drops
neously the data and the flare positions. As priors we used the                   to 1.50, and ∆ fSP = 0.194.
Plewa et al. (2015) reference frame results (see Section 2). All
data prior to the 2018.3 pericentre passage are fit by fSP ≈ 0                         We also fitted the data by solving simultaneously for fSP and
(Kepler/Newton, plus Rømer effect, plus SRT, plus RS). The                        fRS , without fixing the RS term to 1. In that case we find fSP =
residuals in this period are consistent with 0 (bottom panels                     0.99 ± 0.24 and fRS = 0.965 ± 0.042 (with the outlier damper
of Figure 2). The GRAVITY data between 2017 and 2019.7                            on), again fully consistent with GR.
clearly show that the post-pericentre orbit exhibits a sudden kink,
mainly in RA. The data are compatible with a pure in-plane pre-                        An alternative approach is to put the reference frame con-
cession. This is shown in the upper right panels of Figures 2                     straints obtained from the flare positions into a combined prior
and 3, where we have computed the residuals in the projected an-                  with the one from Plewa et al. (2015). In that case the prior
gle of the SP-fitted orbit on the sky δϕ(t), relative to the fSP = 0              for the location of Sgr A* in the NACO infrared frame is
orbit. This is exactly as expected from a fSP ≈ 1 GR orbit (Fig-                  x0 = −0.42 ± 0.15 mas, y0 = 0.30 ± 0.15 mas, vx0 = −0.02 ±
ure B.2). The more subtle swings in δRA, δDec, δvz and δϕ pre-                    0.05 mas/yr, vy0 = 0.015 ± 0.05 mas/yr. If we use this prior to
dicted by GR (Figure B.2) are detected as well (see Appendix B                    fit only the S2 data, we obtain fSP = 0.92 ± 0.22 and χ2r =
for a more detailed discussion).                                                  0.88 (χ2 = 398).
Article number, page 4 of 14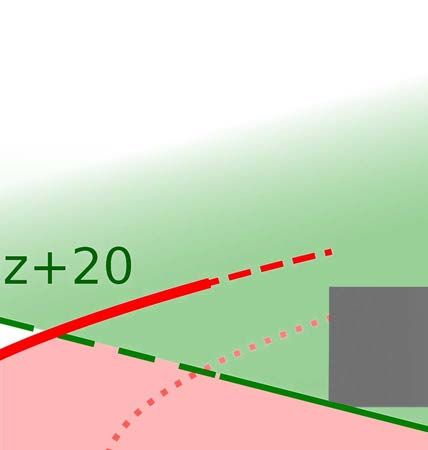
GRAVITY Collaboration: R. Abuter et al.: Detection of Schwarzschild Precession

               30                                                    50
                                             SINFONI                                                 GRAVITY
               20                                                    40
                                                                     30
               10
 vLSR [km/s]

                                                          [arcmin]
                                                                     20                                               Fig. 3. As Figure 2, but now zoom-
                0                                                                                                     ing into the critical 2018 pericen-
                                                                     10                                               tre residuals (best-fit fSP = 1.1 mi-
               10                                                                                                     nus fSP = 0, with all other pa-
                                                                      0
                                                                                                                      rameters fixed). In the bottom two,
               20                                                    10                                               and the top right panels blue filled,
                                                                                                                      open black circles (with 1σ uncer-
               30
                2016   2017     2018       2019    2020              20
                                                                      2016   2017       2018      2019      2020      tainties) are averages of GRAVITY
                                                                                                                      data. The grey bar on the left de-
                                                                                                                      notes the constraints obtained from
               0.2                           GRAVITY                 0.2                             GRAVITY          NACO imagery of S2 and Sgr A*
               0.1                                                   0.1                                              flares on the location of the apocen-
               0.0                                     Dec [mas]     0.0                                              tre value (2010.35). Averages (and
RA [mas]

                                                                                                                      1σ uncertainties) of the radial ve-
               0.1                                                   0.1                                              locity residuals from SINFONI are
               0.2                                                   0.2                                              open black, blue filled circles (top
                                                                                                                      left). The residuals of the best fitting
               0.3                                                   0.3                                               fSP = 1.1 minus fSP = 0 curves are
               0.4                                                   0.4                                              in red.
               0.5                                                   0.5
                2016   2017     2018       2019    2020               2016   2017       2018      2019      2020
                              Time [yrs]                                             Time [yrs]

    Fitting the orbit with fSP = 0 fixed yields χ2 = 932.3, com-                        Finally, we also included the data from Do et al. (2019) (ex-
pared to 906.4 with fSP = 1 fixed. The corresponding difference                     cepting the 2018 astrometry) using the scheme in Gillessen et al.
in Bayesian information criterion (Claesekens & Hjort 2008)                         (2009a) allowing for an additional offset in position and veloc-
∆BIC = 25.9 yields very strong evidence that the GR model                           ity for the Keck reference system. The 18-parameter fit yields a
describes the data better than the best-fitting Kepler (with SRT,                   consistent result, but no further improvement.
RS, and Rømer delay included) orbit.
    Gravity Collaboration et al. (2018b) showed that the near-IR
emission of Sgr A* during bright flares exhibits clock-wise loop                    4. Conclusions
motions of excursions 50−100 µas. The typical flare duration and                    We have presented the first direct detection of the in-plane
the orbital time scale are ≈ 1 hour. A stationary offset between                    Schwarzschild precession around Sgr A* in the GC. Our results
the infrared emission and the mass centroid of that size would                      are fully consistent with GR. We detect the precession of S2 ro-
induce a change of up to ±0.2 in fSP , which is comparable to the                   bustly at the 5 to 6σ level in posterior fitting and MCMC analy-
overall uncertainty in the SP parameter. During a typical time                      sis. Our result is independent of the fit methodology, data selec-
of several hours making up a GRAVITY data point in this work                        tion, weighting and error assignments of individual data points.
these fluctuations should average out to less than 10 µas such that                 The significance of our result depends mostly on how accurately
the additional error on fSP is well below the statistical error.                    we can constrain (x0 , y0 , vx0 , vy0 ). The success rests crucially on
    Next we carried out a Markov-Chain Monte Carlo analysis.                        the superior GRAVITY astrometry during and past pericentre
Using 200, 000 realizations we find that the distribution of fSP                    passage on the one hand, and on 75 measurements of the Sgr A*-
is well described by a Gaussian centred on fSP = 1.11 ± 0.21                        S2 separation for the NACO AO data between 2003 and 2019 on
(Figure E.1, and see Appendix E for more details). The largest                      the other. The flare data allow us to independently constrain the
relative uncertainty in the determination of the Schwarzschild                      zero point of the NACO reference frame.
term originates in the degeneracy of fSP with the pericentre time                        Additional masses in the GC would lead to Newtonian per-
(see Appendix B) and with the zero point x0 of the long-term                        turbations of the S2 orbit. An extended mass component (for ex-
reference frame (mass vs. NACO imaging coordinates). This is                        ample composed of stars or remnants, but also of other particles)
not surprising, given that the precession is largest in the EW di-                  would result in a retrograde precession. The presence of a sec-
rection.                                                                            ond, massive object would lead to short excursions in the smooth
    Further we compared our first order post-Newtonian code                         orbit figure. Our data place tight constraints on both, which we
with fully relativistic GR orbits using the GYOTO ray-tracing                       detail in Appendix D.
code1 (Vincent et al. 2011; Grould et al. 2017). As expected, the                        We expect only modest further improvement of the signifi-
deviations are small. The largest differences over the full data                    cance of our result as our monitoring continues and S2 moves
range are ∆RA = 62 µas, ∆Dec = 41 µas and ∆vz = 11.4 km/s,                          away from pericentre, since our result already now is limited by
occurring for a short time around pericentre. Also, the Bayesian                    the precision with which we have measured the pre-pericentre
comparison between the best-fitting full-GR and Kepler (with                        orbit with AO data.
SRT, RS, and Rømer delay included) orbits strongly prefers the
GR model.
1
      Freely available at http://gyoto.obspm.fr

                                                                                                                              Article number, page 5 of 14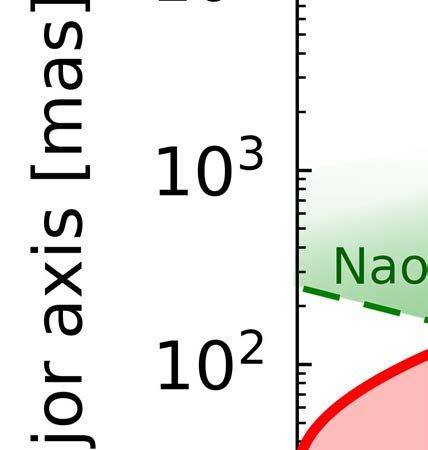
A&A proofs: manuscript no. s2_precession_resubmitted

Acknowledgements. We are very grateful to our funding agencies (MPG, ERC,            Meyer, L., Ghez, A., Schödel, R., et al. 2012, Science, 338, 84
CNRS [PNCG, PNGRAM], DFG, BMBF, Paris Observatory [CS, PhyFOG],                      Misner, C. W., Thorne, K. S., & Wheeler, J. A. 1973, Gravitation (W.H. Freeman,
Observatoire des Sciences de l’Univers de Grenoble, and the Fundação para               Princeton Univers. Press)
a Ciência e Tecnologia), to ESO and the ESO/Paranal staff, and to the many           Moran, J. M., Greenhill, L. J., & Herrnstein, J. R. 1999, Journal of Astrophysics
scientific and technical staff members in our institutions, who helped to make          and Astronomy, 20, 165
                                                                                     Morris, M. R., Meyer, L., & Ghez, A. M. 2012, Research in Astronomy and
NACO, SINFONI, and GRAVITY a reality. S.G. acknowledges the support from
                                                                                        Astrophysics, 12, 995
ERC starting grant No. 306311. F.E. and O.P. acknowledge the support from            Mouawad, N., Eckart, A., Pfalzner, S., et al. 2005, Astronomische Nachrichten,
ERC synergy grant No. 610058. A.A., P.G. and, V.G. were supported by Fun-               326, 83
dação para a Ciência e a Tecnologia, with grants reference UIDB/00099/2020           Naoz, S., Will, C. M., Ramirez-Ruiz, E., et al. 2020, ApJ, 888, L8
and SFRH/BSAB/142940/2018.                                                           Navarro, J. F., Frenk, C. S., & White, S. D. M. 1996, ApJ, 462, 563
                                                                                     Parsa, M., Eckart, A., Shahzamanian, B., et al. 2017, ApJ, 845, 22
                                                                                     Paumard, T., Genzel, R., Martins, F., et al. 2006, ApJ, 643, 1011
                                                                                     Perrin, G. & Woillez, J. 2019, A&A, 625, A48
                                                                                     Plewa, P. M., Gillessen, S., Eisenhauer, F., et al. 2015, MNRAS, 453, 3234
References                                                                           Plewa, P. M. & Sari, R. 2018, MNRAS, 476, 4372
                                                                                     Plummer, H. C. 1911, MNRAS, 71, 460
Abbott, B. P., Abbott, R., Abbott, T. D., et al. 2016, Physical Review Letters,      Psaltis, D. 2004, in American Institute of Physics Conference Series, Vol. 714,
   116, 061102                                                                          X-ray Timing 2003: Rossi and Beyond, ed. P. Kaaret, F. K. Lamb, & J. H.
Alexander, T. 2005, Physics Reports, 419, 65                                            Swank, 29–35
                                                                                     Psaltis, D., Wex, N., & Kramer, M. 2016, ApJ, 818, 121
Alexander, T. 2017, ARA&A, 55, 17                                                    Reid, M. J. & Brunthaler, A. 2004, ApJ, 616, 872
Angélil, R. & Saha, P. 2014, MNRAS, 444, 3780                                        Reid, M. J. & Brunthaler, A. 2020, arXiv e-prints, arXiv:2001.04386
Angélil, R., Saha, P., & Merritt, D. 2010, ApJ, 720, 1303                            Reid, M. J., Menten, K. M., Zheng, X. W., Brunthaler, A., & Xu, Y. 2009, ApJ,
Bartko, H., Martins, F., Fritz, T. K., et al. 2009, ApJ, 697, 1741                      705, 1548
Baumgardt, H., Amaro-Seoane, P., & Schödel, R. 2018, A&A, 609, A28                   Rousset, G., Lacombe, F., Puget, P., et al. 1998, Proc. SPIE Vol., 3353, 508
Boehle, A., Ghez, A. M., Schödel, R., et al. 2016, ApJ, 830, 17                      Rubilar, G. F. & Eckart, A. 2001, A&A, 374, 95
                                                                                     Sakai, S., Lu, J. R., Ghez, A., et al. 2019, ApJ, 873, 65
Bonnet, H., Ströbele, S., Biancat-Marchet, F., et al. 2003, Proc. SPIE Vol., 4839,   Schmidt, M. 1963, Nature, 197, 1040
   329                                                                               Schödel, R., Gallego-Cano, E., Dong, H., et al. 2018, A&A, 609, A27
Cardoso, V. & Pani, P. 2019, Living Reviews in Relativity, 22, 4                     Schödel, R., Merritt, D., & Eckart, A. 2009, A&A, 502, 91
Chu, D. S., Do, T., Hees, A., et al. 2018, ApJ, 854, 12                              Schödel, R., Ott, T., Genzel, R., et al. 2002, Nature, 419, 694
Claesekens, G. & Hjort, N. L. 2008, Model Selection and Model Averaging              Schwarzschild, K. 1916, Sitzungsberichte der Königlich Preußischen Akademie
   (Cambridge University Press)                                                         der Wissenschaften (Berlin), 189
                                                                                     Tanaka, Y., Nandra, K., Fabian, A. C., et al. 1995, Nature, 375, 659
Do, T., Hees, A., Ghez, A., et al. 2019, Science, 365, 664                           Vincent, F. H., Paumard, T., Gourgoulhon, E., & Perrin, G. 2011, Classical and
Doeleman, S. S., Weintroub, J., Rogers, A. E. E., et al. 2008, Nature, 455, 78          Quantum Gravity, 28, 225011
Einstein, A. 1916, Annalen der Physik, 354, 769                                      Will, C. M. 2008, ApJ, 674, L25
Eisenhauer, F., Abuter, R., Bickert, K., et al. 2003, in Proc. SPIE, Vol. 4841,      Will, C. M. 2014, Living Reviews in Relativity, 17, 4
   Instrument Design and Performance for Optical/Infrared Ground-based Tele-         Will, C. M. & Nordtvedt, Kenneth, J. 1972, ApJ, 177, 757
                                                                                     Yelda, S., Ghez, A. M., Lu, J. R., et al. 2014, ApJ, 783, 131
   scopes, ed. M. Iye & A. F. M. Moorwood, 1548–1561                                 Yu, Q. & Tremaine, S. 2003, ApJ, 599, 1129
Eisenhauer, F., Genzel, R., Alexander, T., et al. 2005, ApJ, 628, 246                Zhang, F. & Iorio, L. 2017, ApJ, 834, 198
Event Horizon Telescope Collaboration, Akiyama, K., Alberdi, A., et al. 2019,        Zucker, S., Alexander, T., Gillessen, S., Eisenhauer, F., & Genzel, R. 2006, ApJ
   ApJ, 875, L1                                                                         Letters, 639, 21
Fabian, A. C., Iwasawa, K., Reynolds, C. S., & Young, A. J. 2000, PASP, 112,
   1145
                                                                                      1
Falcke, H. & Markoff, S. B. 2013, Classical and Quantum Gravity, 30, 244003               Max Planck Institute for extraterrestrial Physics, Giessenbach-
Falcke, H., Melia, F., & Agol, E. 2000, ApJ, 528, L13                                     straße 1, 85748 Garching, Germany
Fritz, T. K., Chatzopoulos, S., Gerhard, O., et al. 2016, ApJ, 821, 44                2
                                                                                          LESIA, Observatoire de Paris, Université PSL, CNRS, Sorbonne
Genzel, R., Eisenhauer, F., & Gillessen, S. 2010, Rev. Mod. Phys., 82, 3121
                                                                                          Université, Université de Paris, 5 place Jules Janssen, 92195
Ghez, A., Duchêne, G., Matthews, K., et al. 2003, ApJ Letters, 586, 127
Ghez, A., Salim, S., Weinberg, N. N., et al. 2008, ApJ, 689, 1044                         Meudon, France
                                                                                      3
Gillessen, S., Eisenhauer, F., Fritz, T. K., et al. 2009a, ApJ, 707, L114                 Max Planck Institute for Astronomy, Königstuhl 17, 69117 Heidel-
Gillessen, S., Eisenhauer, F., Trippe, S., et al. 2009b, ApJ, 692, 1075                   berg, Germany
                                                                                      4
Gillessen, S., Plewa, P. M., Eisenhauer, F., et al. 2017, ApJ, 837, 30                    1st Institute of Physics, University of Cologne, Zülpicher Straße 77,
Gondolo, P. & Silk, J. 1999, Phys. Rev. Lett., 83, 1719                                   50937 Cologne, Germany
Gravity Collaboration, Abuter, R., Accardo, M., et al. 2017, A&A, 602, A94            5
                                                                                          Univ. Grenoble Alpes, CNRS, IPAG, 38000 Grenoble, France
Gravity Collaboration, Abuter, R., Amorim, A., et al. 2018a, A&A, 615, L15            6
Gravity Collaboration, Abuter, R., Amorim, A., et al. 2019, A&A, 625, L10
                                                                                          Universidade de Lisboa - Faculdade de Ciências, Campo Grande,
Gravity Collaboration, Abuter, R., Amorim, A., et al. 2018b, A&A, 618, L10                1749-016 Lisboa, Portugal
                                                                                      7
Grould, M., Vincent, F. H., Paumard, T., & Perrin, G. 2017, A&A, 608, A60                 Faculdade de Engenharia, Universidade do Porto, rua Dr. Roberto
Gualandris, A., Gillessen, S., & Merritt, D. 2010, MNRAS, 409, 1146                       Frias, 4200-465 Porto, Portugal
Gualandris, A. & Merritt, D. 2009, ApJ, 705, 361                                      8
                                                                                          European Southern Observatory, Karl-Schwarzschild-Straße 2,
Habibi, M., Gillessen, S., Martins, F., et al. 2017, ApJ, 847, 120                        85748 Garching, Germany
Hansen, B. M. S. & Milosavljević, M. 2003, ApJ, 593, L77                             9
                                                                                          European Southern Observatory, Casilla 19001, Santiago 19, Chile
Hees, A., Do, T., Ghez, A. M., et al. 2017, Physical Review Letters, 118, 211101     10
Hofmann, R., Eckart, A., Genzel, R., & Drapatz, S. 1993, Ap&SS, 205, 1
                                                                                          Observatoire de Genève, Université de Genève, 51 Ch. des Mail-
Issaoun, S., Johnson, M. D., Blackburn, L., et al. 2019, ApJ, 871, 30                     lettes, 1290 Versoix, Switzerland
                                                                                     11
Johnson, M. D., Bouman, K. L., Blackburn, L., et al. 2017, ApJ, 850, 172                  Max Planck Institute for Radio Astronomy, Auf dem Hügel 69,
Kerr, R. P. 1965, in Quasi-Stellar Sources and Gravitational Collapse, ed.                53121 Bonn, Germany
   I. Robinson, A. Schild, & E. L. Schucking, 99                                     12
                                                                                          Sterrewacht Leiden, Leiden University, Postbus 9513, 2300 RA Lei-
Kormendy, J. & Ho, L. C. 2013, ARA&A, 51, 511                                             den, The Netherlands
Kramer, M. 2016, International Journal of Modern Physics D, 25, 1630029              13
                                                                                          Departments of Physics and Astronomy, Le Conte Hall, University
Kramer, M., Stairs, I. H., Manchester, R. N., et al. 2006, Science, 314, 97
Lacroix, T. 2018, A&A, 619, A46
                                                                                          of California, Berkeley, CA 94720, USA
                                                                                     14
Lenzen, R., Hofmann, R., Bizenberger, P., & Tusche, A. 1998, Proc. SPIE Vol.,             CENTRA - Centro de Astrofísica e Gravitação, IST, Universidade
   3354, 606                                                                              de Lisboa, 1049-001 Lisboa, Portugal
                                                                                     15
Levenberg, K. 1944, Quart. Appl. Math, 2, 164                                             Department of Astrophysical & Planetary Sciences, JILA, Duane
Lynden-Bell, D. & Rees, M. J. 1971, MNRAS, 152, 461                                       Physics Bldg., 2000 Colorado Ave, University of Colorado, Boulder,
Marquardt, D. W. 1963, J. Soc. Indust. Appl. Math„ 11, 431                                CO 80309, USA
Martins, F., Gillessen, S., Eisenhauer, F., et al. 2008, ApJ Letters, 672, 119       16
                                                                                          CERN, 1 Espl. des Particules, Genève 23, CH-1211, Switzerland
McConnell, N. J. & Ma, C.-P. 2013, ApJ, 764, 184                                     17
Merritt, D., Alexander, T., Mikkola, S., & Will, C. M. 2010, Phys. Rev. D, 81,
                                                                                          Department of Particle Physics & Astrophysics, Weizmann Institute
   062002                                                                                 of Science, Rehovot 76100, Israel
                                                                                     18
Merritt, D., Gualandris, A., & Mikkola, S. 2009, ApJ, 693, L35                            Institute of Astronomy, Madingley Road, Cambridge CB3 0HA, UK

Article number, page 6 of 14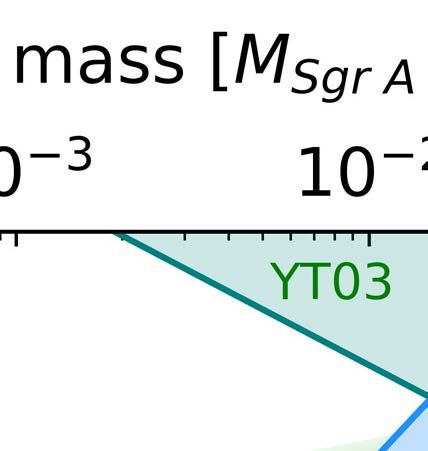
GRAVITY Collaboration: R. Abuter et al.: Detection of Schwarzschild Precession

Appendix A: Experimental Techniques                                                                    1.0

Appendix A.1: GRAVITY Data Analysis                                                                    0.8

                                                                                                       0.6
Our result crucially depends on the use of GRAVITY, the VLTI

                                                                                                 |V|
beam combiner, which due to its extremely high angular resolu-                                         0.4
tion of ≈ 3 mas yields very accurate astrometry with errors well
                                                                                                       0.2
below 100 µas (Gravity Collaboration et al. 2017, and Figure A.3
next page). Depending on the separation between S2 and Sgr A*                                          0.0 7
                                                                                                       1 × 10   2 × 10⁷   3 × 10⁷   4 × 10⁷   5 × 10⁷   6 × 10⁷   7 × 10⁷
there are two fundamentally different ways to retrieve the sepa-                                                             baseline length [Mλ]
ration vector between S2 and Sgr A*.
                                                                                    Fig. A.2. Example of a binary fit from July 8, 2017, 03:27:51. The ob-
                    -10
                                                                                    served visibility modulus shows strong modulation, the signature of an
                                                                                    interferometrically resolved binary. The lines show the model for the six
                                                                                    baselines, which includes the separation vector. The formal uncertainty
                    -20
                                                                                    in this example fit is 8 µas per coordinate.
            ϕ [°]

                    -30
                                                                                    and appear as an interferometric binary. In such a case, the am-
                    -40                                                             plitudes of the complex visibilities as well as the closure phases
                                                                                    carry the signature, which is a beating pattern in each baseline
                    -50                                                             along the spectral axis. We fit a binary model to these data, for
                          -0.20    -0.15         -0.10       -0.05
                                                                                    which the complex visibilities are:
                                           u [1/mas]

                                                                                                         IE + fk fl IC
                                                                                                               p
                    1.0                                                             Ck,l = p                                          .          (A.2)
                                                                                             IA + fk IB + fBG ID IA + fl IB + fBG ID
                                                                                                                 p
                    0.8

                    0.6
                                                                                    In this expression we use the abbreviations
             |V|

                    0.4                                                             IA   =    I(αSgr , 0) ,
                                                                                    IB   =    I(αS2 , 0) ,
                    0.2
                                                                                    IC   =    I(αS2 , OPDS2 ) ,
                    0.0
                          -0.20   -0.15       -0.10      -0.05       0.00           ID   =    I(αBG , 0) ,
                                           u [1/mas]
                                                                                    IE   =    I(αSgr , OPDSgr ) ,
Fig. A.1. Example of a unary fit for a 5 min exposure on Sgr A* from
April 22, 2019, 06:39:55. Top: Phase Φ as a function of projected base-             where
line vector u for the s-polarization channel. Per baseline, eight spec-                                Z
tral channels were included here. The black line is a unary model,                  I(α, OPD) =               P(λ) λ−1−α
                                                                                                                    2.2 e
                                                                                                                         −2πi OPD/λ
                                                                                                                                    dλ .                                    (A.3)
which yields the offset from the interferometer pointing position to                                     ∆λ
∆RA = 322 ± 9 µas and ∆Dec = 301 ± 8 µas (formal fit errors). Bottom:
The visibility modulus for the same data is constant and close to unity,            The α are the spectral slopes of Sgr A*, S2 and background, re-
consistent with the choice of fitting a single point source.                        spectively, and λ2.2 is the wavelength λ divided by the reference
                                                                                    wavelength λ0 = 2.2 µm. The optical path differences for X = S2
                                                                                    and X = Sgr A* are
    Dual Beam Method. For separations larger than the single-
telescope beam size (FWHM ≈ 60 mas), one needs to point the                         OPDX = sX · Bk,l .                                                                      (A.4)
GRAVITY science channel fibre once to Sgr A* and once to
S2, such that the respective target is the dominant source in the                   The function P(λ) is the spectral band pass, for which we use
field. The phases of the complex visibilities of each pointing then                 a top hat function with a width corresponding to the measured
yield an accurate distance to the fringe-tracking star, IRS16C in                   spectral resolution. The fk , fl are the flux ratios of S2 to Sgr A*
our case. By interferometrically calibrating the Sgr A* data with                   for telescope k, l; fBG is the flux ratio of unresolved background
S2, the position of IRS16C drops out, and one gets a data set in                    to Sgr A* flux. The model yields for all baselines and spectral
which the six phases Φi directly measure the desired separation                     channels a complex visibility, of which we fit the amplitudes and
vector s = (∆RA, ∆Dec) between S2 and Sgr A* via the basic                          closure phases to the data. We used this analysis also in our pre-
interferometer formula for a unary model                                            vious work (Gravity Collaboration et al. 2018a,b) and also here
                                                                                    for the 2018 data and for the 2017 data. In Figure A.2 we show
Φi, j = 2π s · Bi /λ j ,                                                    (A.1)   an example how the binary model describes the visibility ampli-
                                                                                    tudes for one exposure.
where Bi denotes the i-th of the six baselines. Since our data
are spectrally resolved into 14 channels λ j across the K-band
                                                                                    Appendix A.2: Details of the Unary Model Fits
(2.0 µm to 2.4 µm), the unknown s with two parameters is well
constrained by a fit to the phases. This method applies mostly                      The aim is to measure the separation vector between S2 and
to the 2019 data, and partly to the 2017 data. In Figure A.1 we                     Sgr A*. GRAVITY measures the separation between science
show an example for such a unary fit for one Sgr A* exposure.                       object and fringe-tracking star (IRS16C in our case). The de-
    Single Beam Method. For separations below the single-                           sired separation is obtained by measuring both S2 and Sgr A*
telescope beam size both sources are observed simultaneously                        with respect to IRS16C, and subtracting the two measurements.
                                                                                                                                               Article number, page 7 of 14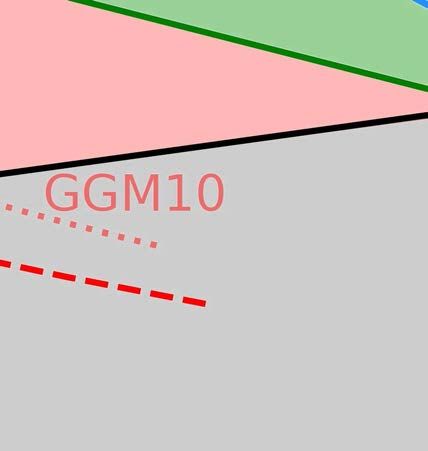
A&A proofs: manuscript no. s2_precession_resubmitted

                                                                                                           Fig. A.3. Astrometric (left) and
                                                                                                           spectroscopic (right) 1σ statistical
                                                                                                           measurement uncertainties of S2
                                                                                                           over time. The left panel shows
                                                                                                           the almost hundred-fold improve-
                                                                                                           ment in astrometric precision in RA
                                                                                                           and Dec, from the early period of
                                                                                                           speckle imagery with SHARP on the
                                                                                                           3.5 m NTT (until 2001), then the
                                                                                                           adaptive optics imagery with NACO
                                                                                                           on the 8 m VLT (>2002), and then,
                                                                                                           since 2016.7, the interferometric as-
                                                                                                           trometry of GRAVITY combining
                                                                                                           all four 8 m telescopes of the VLT.
                                                                                                           The grey vertical lines are the two
                                                                                                           pericentre passages (2002.33 and
                                                                                                           2018.38) covered by our data set.

This corresponds to interferometrically calibrating the phases of     FOV but increases with off-axis distance and thus is of particular
Sgr A* with those of S2.                                              importance for the 2017 data where S2 and Sgr A* are detected
     By construction, the phases of the calibrator S2 frame are       simultaneously in a single fibre-beam positioning at a separation
identical to 0, and ideally the phases for all other S2 frames are    comparable to the fibre FOV.
0, too. In reality, this is not the case. At the time of observing,       We parameterize the effect of a static aberration with an am-
the separation vector r between fringe-tracking star IRS16C and       plitude Aoff and a phase Φoff on a plain wavefront in complex
S2 needs to be provided to GRAVITY for tracking the fringes           notation as
with the differential delay lines. At that point, r is not known to
the interferometric precision, but only from the AO-data based        Ψk = E0 Aoff
                                                                               k exp(iωt + i s · x k + i Φk ) ,
                                                                                                          off
                                                                                                                                            (A.5)
orbital motion of IRS16C (Gillessen et al. 2017). Hence, for a
subsequent S2 file, when the projected baselines have changed         where k labels the telescope and x k denotes its position, E0 is
by some value ∆B due to Earth rotation, the error in pointing         the amplitude of the unperturbed electric field and s the source’s
∆r leads to an additional phase ∆Φ = ∆B · ∆r. By observing            position on the sky. The scaling in amplitude Aoff          k and the phase
S2 a few times per night, one obtains a set of constraints for ∆r,    shift Φoff
                                                                              k   are functions  of the source     position     with respect to the
which allows fitting for ∆r over the course of the night.             field centre and differ for each telescope.
     Therefore we can correct our data post-facto for this offset         The GRAVITY pipeline determines the normalized interfer-
∆r, and obtain phases for Sgr A* which directly relate to S2.         ometric visibility from the correlated flux of two telescopes di-
Since S2 is several interferometric beams away from Sgr A*, the       vided by their respective individual fluxes. The field-dependent
phases are still wrapped, which is inconvenient for fitting. The      aberrations enter the Van Cittert-Zernicke theorem as
solution is to subtract the separation vector r as provided at the
                                                                                                        λ σ·bkl +iΦk (σ)−iΦl (σ) dσ
                                                                              R                        2πi         off       off

time of observing, and only fit (using the ∆r-corrected phases)                  I(σ)Aoff      off
                                                                                        k (σ)Al (σ)e
                                                                      Vkl = qR                                                          ,    (A.6)
the difference to that separation.                                                              2        R                    2
                                                                                   I(σ) Aoff (σ)    dσ  ×     I(σ)     Aoff
                                                                                                                            (σ)     dσ
     The choice, which of the S2 frames we use as calibrator,                              k                            l
depends on the night and on the data quality of the individual
                                                                      where I(σ) is the source intensity distribution and bkl the pro-
files. Ideally, we seek S2 frames of good quality close in time
                                                                      jection of the baseline vector onto the plane perpendicular to
to those Sgr A* frames, in which Sgr A* was bright. Typically,
                                                                      the line of sight. The expression for a binary system follows
the Sgr A* frames during which the source clearly is detectable
                                                                      from this equation and generalizes equation A.2. The integrals
(flares of at least moderate brightness with mK < 16) lead to a
                                                                      in equation A.3 read then as
well-determined and stable S2-Sgr A* vector.
                                                                                Z
                                                                                               −2πi OPD/λ+i Φoff (s,λ)
                                                                      I(α, s) =     P(λ) λ−1−α
                                                                                          2.2 e                        dλ ,      (A.7)
Appendix A.3: Details of the Binary Model Fits                                     ∆λ

We used the binary fitting method in our previous publications        and the flux ratios fk , fl in equation A.2 are multiplied with the
(Gravity Collaboration et al. 2018a,b, 2019). The quantities used     ratio of Aoff for the two sources.
are the visibility amplitudes and the closure phases, both of             Hence, the refined binary fitting requires maps of the ampli-
which measure the internal source structure. We omit the visi-        tude and phase distortion as additional input. We obtained those
bility phases here, since they mostly contain information about       from dedicated calibration runs, using the GRAVITY calibra-
the location of the phase centre and only to a lesser degree about    tion unit, which simulates the light of an unresolved source. The
the source internal structure. One of the parameters describing       offset between this source and the fibre can be controlled, and
the source structure is the desired binary separation.                we scanned the FOV in order to measure the relative changes in
     Here, we also correct for static aberrations during the binary   phase and amplitude across (see Figure A.4 for an example).
fitting, refining our earlier procedure as a result of an improved        In contrast to an astronomical observation, our calibration
understanding of the instrumental systematics. The aberrations        data are not affected by the smoothing effects of the AO resid-
are induced in the fibre coupling unit of GRAVITY and distort         uals. We account for the atmospheric smoothing by applying a
the incoming wavefronts depending on the source’s position in         Gaussian kernel to the phase maps. The typical tip/tilt jitter for
the field of view (FOV). The effect is zero at the centre of the      observations of the GC has an RMS per-axis of ≈ 15 mas (Perrin
Article number, page 8 of 14
GRAVITY Collaboration: R. Abuter et al.: Detection of Schwarzschild Precession
additional systematic error for the astrometry that we assessed by
using different smoothing kernels, which result in a FWHM of
the amplitude map between 88 and 96 mas.
The effect of the static aberration does not average out,
since the orientation of the field inside GRAVITY is always
the same for our observations. Also the projected baselines are
not drawn from full tracks in the uv-plane, but we rather have
a typical observing geometry. We expect thus a bias. Indeed,
in comparison to binary fits neglecting static aberrations, we
87.7mas 87.7mas find that the position of S2 is offset systematically throughout
2017 by approximately 0.44 × (t − 2018) − 0.10 mas in RA and
−0.86 × (t − 2018) + 0.28 mas in Dec. As expected, the offset
decreases as S2 moves closer to Sgr A*.
Finally, we note that our result for fSP does not depend in a
significant way on this correction.
2017-04-01
2017-08-01 Appendix B: Theoretical expectations for the
precession of S2
2018-04-01 The 12.10 precession angle predicted by GR corresponds to a
spatial shift between the GR and the Kepler orbit of 0.78 mas
53.7mas 53.7mas at apocentre, mostly in RA because of the current orientation
of the orbit. To detect this shift with 5σ significance requires a
positional measurement precision of 100 µas or less. We have
more than 100 NACO measurements of the orbit, each with
160 80 0 80 160 a statistical precision of 400 µas. If we did not have system-
phase aberration [degrees] atics (offset and drift of the infrared to mass/radio references
frames) it should thus (have) be(en) possible to detect the SP
Fig. A.4. Two-dimensional phase maps used for correcting the effects with NACO or the Keck NIRC imager alone. While S2’s mo-
of static aberrations in the binary fitting. The top row compares simula-
tions of a perfect Airy pattern (left) to a static astigmatism with 180 nm
tion on the sky could be detected with NACO over periods of
RMS over the full pupil. The white circle in the top right panel shows months, the GRAVITY observations detect the star’s motion
the extent of the measured phase maps. One example for such a map is over 0.5 − 2 days.
shown below, before (left) and after (right) applying a Gaussian kernel The precession angle projected on the sky depends on the
accounting for atmospheric smoothing. The black line in the lower right geometric angles of the orbit and thus, on time. In the plane of
panel indicates the trace where S2 was located as predicted by the orbit. the orbit the precession advances the angle δφ by 12.10 per or-
bital period of 16.046 yrs. The precession projected on the sky
δϕ varies from −170 to −8.40 through each half SP period of
PSP = 28, 710 yr (Figure B.1).
δφ (sky) per 16 year orbit [arcmin]
y
sk
-8
on
SP
δφ
-10
d
te
ec
oj
pr
-12
intrinsic δϕSP per orbit
-14
53.7mas 53.7mas
-16
-18
5000 10 000 15 000 20 000
year
0 20 40 60 80 100
amplitude modulation [%] Fig. B.1. Advance of sky-projected apocentre angle δϕ, per orbital pe-
riod, as a function of year.
Fig. A.5. Comparison of the theoretical amplitude map smoothed with
atmospheric AO residuals (left) and the measured map smoothed with Figure B.2 illustrates the effects the SP should have on the
a Gaussian Kernel to match the on-sky measured width (right). The measured parameters of S2’s orbit. Because of the strong de-
FWHM for the left panel is 87 mas, and for the right one 88 mas. pendence of δφ on radius, much of the 12.10 precession occurs
within ±1 year of pericentre. In RA/Dec space the precession is
seen as a ‘kink’ in the time change of the post-pericentre vs. pre-
& Woillez 2019), and higher order aberrations also contribute. pericentre residuals. Very near pericentre passage, the precession
We determined the amount of atmospheric smoothing by com- acts to first order as a time shift between the precessing and the
paring the amplitude maps with the actual on-sky profiles, and equivalent fSP = 0 orbit (see also figure E.2 top left panel). As a
verified in a simulation that the effects of a static astigmatism result in the residuals δRA, δDec, δvz, and δϕ between the data
plus atmospheric broadening matches the observed widths (Fig- and the fSP = 0 short term excursions of order a few times β2
ure A.5). The uncertainty in the atmospheric smoothing yields an appear in all these observables.
Article number, page 9 of 14
A&A proofs: manuscript no. s2_precession_resubmitted
residuals ϕsky (arcmin)
residuals vz (km/s)
20 20 50
δvtot (km/s)
apo-centre
10 10 30
apo-centre
0 0 10
-10 -10
-10
-20 -20
2010 2015 2020 2025 2010 2015 2020 2025
5000
4000
apo-centre
300
ϕsky (degrees)
3000
vz (km/s)
2000 200
1000 2018.28
apo-centre
0 100
2018.75
-1000 fSP=1
fSP=1
-2000 0
2017 2018 2019 2020 2010 2015 2020 2025
1.0 1.0
residuals Dec (mas)
residuals RA (mas)
apo-centre
0.5 0.5
0 0
-0.5 -0.5
fSP=1 - fSP=0
-1.0 -1.0
1990 2000 2010 2020 2030 1990 2000 2010 2020 2030
time
Fig. B.2. Theoretical expectations for the impact of the Schwarzschild precession on the orbit of the star S2. Here we took the best-fit parameters
of the S2 orbit, and computed two model orbits, one for fSP = 0 (Kepler/Newton, plus Rømer effect, plus SRT, plus RS), and one for fSP = 1
(equation C.1). The grey (2018.38) and blue (2002.34) vertical lines are the pericentre times. We have arbitrarily set the precession angle of the
SP orbit to 0 during apocentre 2010.35. The top panels denote the residuals of δvz (left) and δϕ (right) between the fSP = 1 and fSP = 0 orbits.
The bottom panels show the same for δRA (left) and δDec (right). The middle panels give vz (left) and ϕ (right) as a function of time. Here, ϕ
is the position angle of the star on the sky, ϕ = arctan(RA/Dec), running from 359◦ when the star is straight north, or north-west of centre, to
180◦ when it is straight south, to > 0◦ when it is just north-north east of centre. The most fundamental aspect of the precession is seen in the top
right panel as a change in δϕ by ≈ 140 between two apocentres. Because of the strong radius dependence of the precession, in a highly elliptical
orbit the precession is very fast around pericentre (2018.38), so that within ≈ 1 year of pericentre ≈ 75% of the precession has occurred. To first
order the precession leads to a change in time when the star is found at a given angle ϕ on the sky, relative to the non-precessing orbit. Since the
functional form of ϕ(t) is close to a step function, the differencing δϕ(t) = ϕSP=1 (t) − ϕSP=0 (t) is close to a differentiation dϕ/dt, which thus results
in a sharp δ-function in the residuals δϕ(t) near pericentre. In velocity space a similar effect occurs in the residuals as well, although vz(t) is not as
symmetric in t relative to tperi . Finally in δRA and δDec (bottom panels), the effect of the precession results in a ‘kink’ in the orbit coordinate time
slope. Because of the variations in the foreshortening of the RA and Dec coordinates of the apocentre values of the δRA, δDec and δϕ the SP = 1
versus SP = 0 curves vary over time (Figure B.1). The projected precession on the sky between the apocentres 2010.35 and 2026.5 is ≈ 140 .
Appendix C: Parameterization of the Schwarzschild The net effect of the precession amounts to
precession
πRS
∆φper orbit = 3 fSP , (C.3)
We use the post-Newtonian limit for the equation of motion pre- a(1 − e2 )
sented in Will (2008), equation (1) therein. We parameterize the
effect of the Schwarzschild metric (i.e. the prograde precession) for our parameterization, and to
by introducing an ad-hoc factor fSP in front of the terms aris- πRS
ing from the Schwarzschild metric. The terms due to spin J and ∆φper orbit = (2 + 2γ − β) , (C.4)
quadrupole moment Q2 are set to 0. This results in a(1 − e2 )
r in the PPN formulation of GR (Will 2014). Yet it is imprecise
GM GM GM
to identify the factor 3 fSP with (2 + 2γ − β). Our parameter
a = − 3 r + fSP 2 2 4 − v2 + 4ṙv + O[J] + O[Q2 ] .
r cr r r fSP characterizes how relativistic the model is, as is probably
(C.1) easiest seen by the fact that its effect corresponds to changing
the value of the speed of light in the equations, with the limit
In the (first order) parameterized post-Newtonian (PPN) expan- c → ∞ for fSP → 0.
sion of GR, the second term becomes In the PPN formulation of GR, all orbits with β = 2(1 + γ)
have zero net precession per revolution, and all orbits with β =
GM GM 2 r
2(γ + β) − γv + 2(1 + γ)ṙv . (C.2) 2γ − 1 have the same amount of pericentre advance as GR.
c2 r2 r r
Due to the large eccentricity of the S2 orbit, the precession
In GR, βGR = γGR = 1. Two PPN parameters (β, γ) are needed shows up as an almost instantaneous change of the orbit orien-
to describe the equation of motion, and for no choice of β and tation ω in its plane when the star passes pericentre. Hence, our
γ can one recover the Newtonian solution. Hence using the PPN result essentially compares the orbit orientations post- and pre-
formalism is less well suited for our experiment than using fSP . pericentre 2018. In this limit, we can indeed state that we have
Article number, page 10 of 14You can also read