Surface Diffuse Solar Radiation Determined by Reanalysis and Satellite over East Asia: Evaluation and Comparison - MDPI
←
→
Page content transcription
If your browser does not render page correctly, please read the page content below
remote sensing
Article
Surface Diffuse Solar Radiation Determined by
Reanalysis and Satellite over East Asia: Evaluation
and Comparison
Hou Jiang 1,2 , Yaping Yang 1,3, *, Hongzhi Wang 4 , Yongqing Bai 1,2            and Yan Bai 1,3
 1    State Key Laboratory of Resources and Environmental Information System, Institute of Geographic Sciences
      and Natural Resources Research, Chinese Academy of Sciences, Beijing 100101, China;
      jiangh.18b@igsnrr.ac.cn (H.J.); baiy@lreis.ac.cn (Y.B.)
 2    College of Resources and Environment, University of Chinese Academy of Sciences, Beijing 100049, China
 3    Jiangsu Center for Collaborative Innovation in Geographical Information Resource Development and
      Application, Nanjing 210023, China; baiy@igsnrr.ac.cn
 4    College of Environment and Planning, Henan University, Kaifeng 475004, China; wanghz@lreis.ac.cn
 *    Correspondence: yangyp@igsnrr.ac.cn; Tel.: +86-10-6488-9452

 Received: 6 April 2020; Accepted: 27 April 2020; Published: 28 April 2020

 Abstract: Recently, surface diffuse solar radiation (Rdif ) has been attracting a growing interest in
 view of its function in improving plant productivity, thus promoting global carbon uptake, and its
 impacts on solar energy utilization. To date, very few radiation products provide estimates of Rdif ,
 and systematic validation and evaluation are even more scare. In this study, Rdif estimates from
 Reanalysis Fifth Generation (ERA5) of European Center for Medium-Range Weather Forecasts and
 satellite-based retrieval (called JiEA) are evaluated over East Asia using ground measurements at
 39 stations from World Radiation Data Center (WRDC) and China Meteorological Administration
 (CMA). The results show that JiEA agrees well with measurements, while ERA5 underestimates Rdif
 significantly. Both datasets perform better at monthly mean scale than at daily mean and hourly
 scale. The mean bias error and root-mean-square error of daily mean estimates are −1.21 W/m2
 and 20.06 W/m2 for JiEA and −17.18 W/m2 and 32.42 W/m2 for ERA5, respectively. Regardless
 of over- or underestimation, correlations of estimated time series of ERA5 and JiEA show high
 similarity. JiEA reveals a slight decreasing trend at regional scale, but ERA5 shows no significant
 trend, and neither of them reproduces temporal variability of ground measurements. Data accuracy
 of ERA5 is more robust than JiEA in time but less in space. Latitudinal dependency is noted for ERA5
 while not for JiEA. In addition, spatial distributions of Rdif from ERA5 and JiEA show pronounced
 discrepancy. Neglect of adjacency effects caused by horizontal photon transport is the main cause for
 Rdif underestimation of ERA5. Spatial analysis calls for improvements to the representation of clouds,
 aerosols and water vapor for reproducing fine spatial distribution and seasonal variations of Rdif .

 Keywords: surface diffuse solar radiation; temporal trend; spatial pattern; atmospheric factor

1. Introduction
     Surface solar radiation (Rs ) drives the global energy, water and carbon cycles of by affecting
sensible and latent heat fluxes, longwave emission, water vapor and circulations in the atmosphere and
the ocean [1–3]. Determining the variations of Rs is essential for understanding global climate changes,
particularly the rate of global warming and its effects on glacial melt and sea level rise [4,5]. Rs data
with different spatiotemporal resolutions are urgently required in diverse application fields, such as
global numerical weather prediction, agricultural meteorology, climate monitoring and solar electricity.

Remote Sens. 2020, 12, 1387; doi:10.3390/rs12091387                          www.mdpi.com/journal/remotesensing
Remote Sens. 2020, 12, 1387                                                                          2 of 19

Moreover, the accuracy of Rs data greatly influences simulations of runoff, evapotranspiration,
gross primary productivity, growth and yield of crops [6–9].
       In addition to Rs , surface diffuse solar radiation (Rdif ) takes on greater importance in monitoring
and modeling ecosystem carbon uptake [10]. Rdif tends to increase plant productivity, as it enhances
light use efficiency of plants by penetrating more radiation into deeper canopies, thus improving
photosynthesis in shaded leaves [11–13]. It was reported that changes of Rdif affect the global land
carbon sink [11], according to a high-quality Rdif dataset for quantifying its effects on carbon dynamics
of terrestrial ecosystems. The fraction of Rdif is also a necessary input to agricultural models, such as
the Soil Water Atmosphere Plant (SWAP), Forest Biomass, Assimilation, Allocation, and Respiration
(FöBAAR) and Yale Interactive Terrestrial Biosphere (YIB), for early assessment of crop yield [14,15] or
radiation-use efficiency of forests [16]. Besides, the spatially continuous high-resolution hourly ratio of
Rs and Rdif is required for a comprehensive assessment of the potential of rooftop solar photovoltaics
and policy-making regarding the renewable energy sector [17].
       Currently, Rs products are available from four common sources, namely direct measurements of
surface radiation networks [3], simulations based on radiation transfer models [18,19], estimates from
reanalysis systems [18,20,21] and retrievals from satellite observations [10,22–25]. Direct surface
measurements are regarded as a reliable reference for data validation from simulations, reanalysis
and satellite retrievals [26–29]. However, Rdif is very rare among these products, for example,
Rs measurements are attainable at 119 stations in China while only 17 of them measure Rdif [26,30];
the Global Land Surface Satellite (GLASS) provides global 5-km resolution, 3-h interval Rs but
lacks an Rdif map [25]. Nonetheless, many algorithms have tried to determine the fraction of
Rdif , [10,31,32]. Greuell et al. [31] retrieved global, direct and diffuse irradiance (3 km, 15 min)
from Spinning Enhanced Visible and Infrared Imager (SEVIRI) observations through a physics-based
and empirically adjusted algorithm. Ryu et al. [10] produced incident shortwave radiation (SW),
photosynthetically active radiation (PAR) and diffuse PAR datasets (5 km, 4 day) by combining an
atmospheric radiative transfer model with an artificial neural network (ANN) based on Moderate
Resolution Imaging Spectroradiometer (MODIS) atmosphere and land products. To date, mature
kilometer-scale hourly radiation datasets (including Rdif ) with global and multiyear coverage are still
rare [26,33]. Most products are generated over specific regions like Europe, North America and China.
To the best of our knowledge, only two products provide multiyear hourly Rdif over East Asia, i.e.,
Reanalysis Fifth Generation (ERA5) provided by the European Center for Medium-Range Weather
Forecasts (ECMWF) and satellite-based products produced by Jiang et al. [22] (hereafter called JiEA for
short).
       However, these radiation products generally contain large uncertainties. The reported
root-mean-square error (RMSE) of instantaneous Rs retrievals under all-sky conditions range from
60 to 140 W/m2 (~15%–30%) depending on local cloud climatology [33]. In addition, multisource
products usually show inconsistent temporal trends and spatial distributions [29,34], which could
hamper their applicability for assessing global brightening or dimming and local climate responses
to radiation changes [5,35]. Therefore, it is necessary and important to compare different products
and understand their discrepancies. Zhang et al. [29] compared four satellite products of Rs using
comprehensive ground measurements at stations around the world and found that satellite estimates
capture the seasonal variations of Rs well and have acceptable data accuracy at the monthly time scale,
with an overestimation of approximately 10 W/m2 . Zhang et al. [36] evaluated two Rs estimates of
global reanalyses using homogenized surface measurements in China and pointed out the pronounced
overestimation of the reanalyses. The significant spatiotemporal difference of data accuracy mainly
results from atmospheric factors, including cloud coverage, aerosol optical depth and water vapor
content. There are large numbers of references that concentrate on the data accuracy of Rs , but to date
very few studies have been devoted to the evaluation of Rdif .
       The purpose of this study is to evaluate and compare Rdif estimates from ERA5 and JiEA using
surface in situ measurements and to investigate the spatial pattern and seasonal variations of Rdif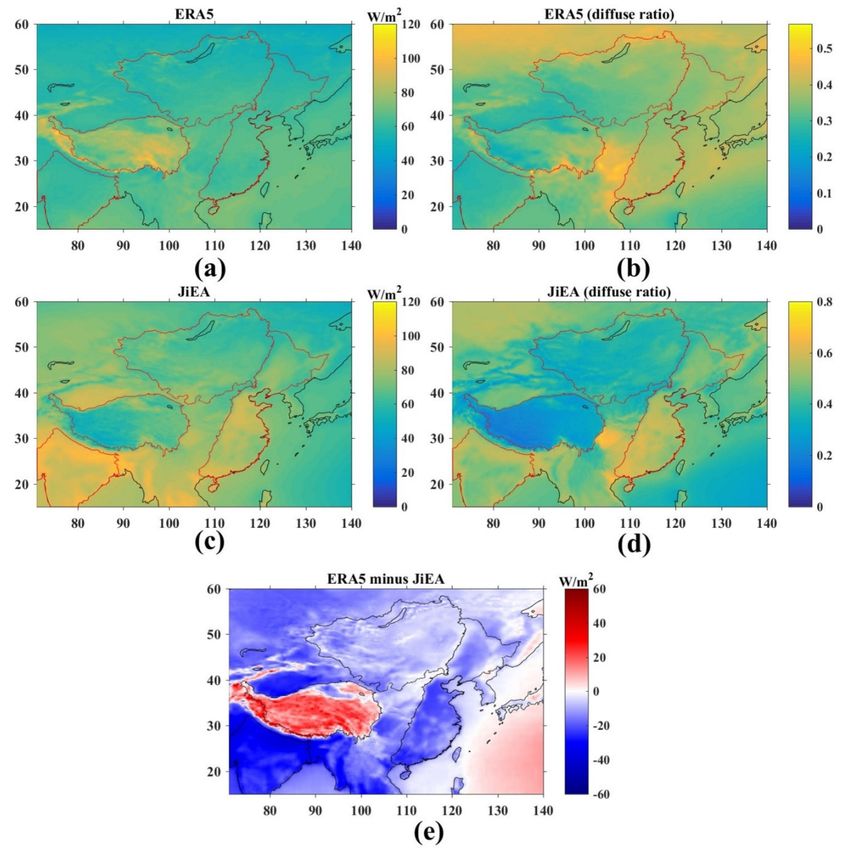
Remote Sens. 2020, 12, 1387                                                                            3 of 19

over East Asia. The reliability of different data is discussed at both the site level and the regional
scale in combination with the spatial distribution of atmospheric factors that mostly relate to the
retrievals of solar radiation. This study provides a reference for rational use of these data and opens
new perspectives for improving Rdif estimation.
      This paper is organized as follows. The ground measurements and diffuse radiation products
used are briefly described in Section 2. Section 3 explains various validation metrics and the method
for comparative analysis. Section 4 presents the results of site-level validation and analysis of
spatiotemporal deviations at different time scales, followed by a discussion on the reliability of these
data, especially concerning their spatial pattern, in Section 5. A conclusion is finally given in Section 6.

2. Data

2.1. Ground Measurements
     The ground measurements used to evaluate Rdif estimates are obtained from two data centers: the
World Meteorological Organization’s (WMO) World Radiation Data Center (WRDC) (22 stations) and
that of the China Meteorological Administration (CMA) (17 stations). Figure 1 shows the geographical
distribution of the selected 39 stations from WRDC and CMA, with detailed information provided in
Table S1.
     The WRDC is one of the recognized World Data Centers sponsored by the WMO, which centrally
collects and archives radiometric data from the world to ensure the availability of these data for research
by the international scientific community. Daily and monthly totals of surface energy components
such as global radiation (i.e., Rs ), diffuse radiation (i.e., Rdif ) and radiation balance are available from
the official website (http://wrdc.mgo.rssi.ru/) after a simple registration process. Daily totals of global
and diffuse radiation are determined where ground measurements for all time intervals of the daytime
are available, along with an auxiliary procedure to avoid undue losses due to the gaps in the data for
sunrise and sunset hours. Monthly totals are the sum of the entire daily totals of the month. If less
than ten days with missing records exist, a monthly mean of the available daily records is calculated,
then a monthly total is calculated by multiplying the monthly mean by the number of days in the
calendar month. A monthly value is not provided if missing records within the month exceed ten days.
A subset of 22 WRDC stations (red circles in Figure 1), which provide at least one-year monthly series
of diffuse radiation within the period from 2007 to 2014, was selected for this study.
     The CMA Meteorological Information Center have released daily and monthly meteorological data
at 122 routine weather stations. Radiation-related elements include net radiation, downward shortwave
radiation (i.e., Rs ), reflected shortwave radiation and diffuse radiation (i.e., Rdif ). Rdif measurements
are conducted at 17 stations (blue triangles in Figure 1). The procedure to calculate daily and monthly
totals is the same as that adopted by WRDC. Additional quality control measures before release
include a spatial and temporal consistency check and manual inspection and correction. Furthermore,
hourly measurements of these stations are attainable from National Meteorological Science Data
Center (http://data.cma.cn/) on reasonable request. Herein, hourly measurements in 2007 and 2008
and daily/monthly measurements from 2007 to 2014 of diffuse radiation at these 17 CMA stations are
available for evaluation.
     Rs and Rdif at stations are widely measured through thermoelectric pyranometer, which has a
spectral response of 0.3–3.0 µm, a thermal effect of less than 5% and an annual stability of about 5%.
Pyranometers are exposed to the sun to measure Rs . For measuring Rdif , pyranometric sensors are
shaded by an additional component (e.g., shadow-ball or rotating shadow band) to prevent direct solar
radiation from reaching the sensor. The shading mechanism hides the minimum of sky outside the
small solid angle of the sensor to receive the maximum Rdif from the whole sky dome.
     Previous studies point out that systematic errors are very common in radiation measurements
due to equipment failure and operational problems [30] and that it is necessary to examine measured
values carefully before subsequent utilization [28,29,37]. In this study, we first applied the physical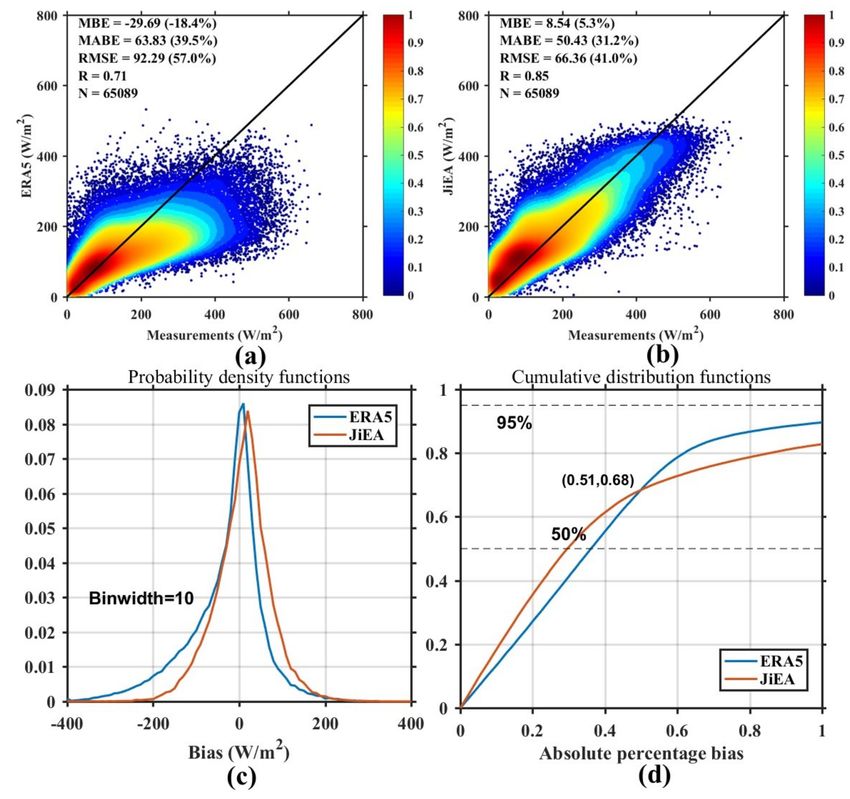
Remote Sens. 2020, 12, 1387                                                                                  4 of 19

threshold test [38] and then the method based on reconstructed data [29] to the measurements of Rs
associated with the selected records of Rdif for further quality control. If the measured value of Rs
failed to pass the quality check, the corresponding Rdif was eliminated. In addition, Rdif should not be
larger than Rs . The numbers of valid records from each station at hourly, daily and monthly scales are
listed in Table S1.

      Figure 1. Locations of used radiation stations and zone boundary for statistical analysis. Hourly, daily
      and monthly measurements of diffuse radiation are available for 17 stations (blue triangles) from
      China Meteorological Administration (CMA). Daily and monthly measurements for other stations
      (red circles) are obtained from World Radiation Data Center (WRDC). Detailed information of all
      stations can be found in Table S1. Four polygons define the boundary of Deccan Plateau, Tibetan Plateau,
      Mongolian Plateau and Eastern China for regional analysis in this study.

2.2. Diffuse Radiation Products
     Two datasets that provide estimates of Rdif over East Asia are evaluated and compared in our
study, i.e., the latest global climate reanalysis provided by ECMWF [21] and satellite-based products
produced by Jiang et al. [22].
     ECMWF Reanalysis Fifth Generation (EAR5) is the fifth-generation ECMWF atmospheric reanalysis
of the global climate to replace the old ERA-Interim. It is produced using a 4D-Var assimilation
system of ECMWF’s Integrated Forecast System (IFS), namely IFS Cycle 41r2, which guarantees
significant increase in forecast accuracy and computational efficiency. The advanced system is also
combined with vast amounts of historical observations to generate globally consistent time series of
multiple climate variables. ERA5 provides hourly estimates of many atmospheric, land-surface and
sea-state parameters together with their uncertainties at reduced spatial and temporal resolutions.
The parameters used in this study involve “surface solar radiation downwards” and “total sky
direct solar radiation at surface”, which represent the amount of shortwave radiation (surface direct
and diffuse solar radiation) and the amount of direct radiation reaching the surface of the Earth,
respectively. Estimates of Rdif can be derived by subtracting total sky direct solar radiation from
surface solar radiation downwards. To date, these hourly data are available in the Climate Data Store
(https://climate.copernicus.eu/climate-reanalysis) on regular latitude–longitude grids at 0.25◦ × 0.25◦
resolution from 1979 to present.
     Satellite-based diffuse radiation products (hereafter, called JiEA for short) are from the work of
Jiang et al. [22], where a deep learning algorithm was developed to retrieve Rs from Multifunctional
Transport Satellites (MTSAT) data. They concentrate on overcoming the negative impact of spatial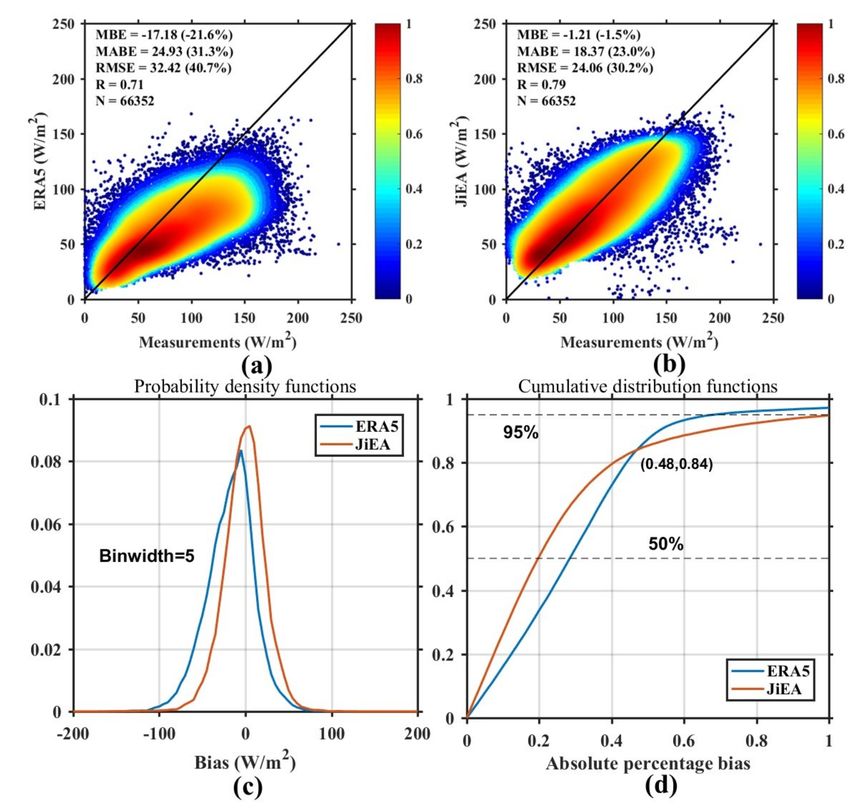
Remote Sens. 2020, 12, 1387                                                                         5 of 19

adjacency effects on Rdif estimation through convolutional neural networks (CNNs). Spatial adjacency
effects refer to the phenomena that some photons out of the field of view are reflected by the
surface then scattered by the atmosphere, thus finally entering into the field of view to change the
amount of solar radiation within the field of view. CNN is used to handle this effect by gaining
knowledge of the spatial distribution of clouds/aerosols from satellite image blocks. This algorithm
is originally designed for estimates of Rs and further extended through a transfer learning approach
for estimates of Rdif . Currently, a dataset from 2007 to 2018 is freely available from Pangaea at
https://doi.pangaea.de/10.1594/PANGAEA.904136 [39]. This dataset provides gridded estimates of Rs
and Rdif at 0.05◦ × 0.05◦ resolution within 71◦ –141◦ E and 15◦ –60◦ N, mainly covering East Asia. In view
of the difference of spatial coverage from ERA5, East Asia in this study is referred to as the maximum
overlapped extent of the two datasets.

3. Methods

3.1. Validation Metrics
      Ground measurements are regarded as the reference for evaluation of Rdif from different datasets.
To quantify the accuracy of Rdif estimates, a set of metrics including Pearson correlation coefficient
(R), (relative) mean bias error (MBE, rMBE), (relative) mean absolute bias error (MABE, rMABE),
(relative) root-mean-square error (RMSE, rRMSE), bias and absolute percentage bias (APE) are used.
These metrics are defined as follows:
                                           Pn
                                             i=1 ŷi − ŷ ( yi − y)
                                 R= q                2 q P                                         (1)
                                       Pn                   n            2
                                         i=1 iŷ − ŷ           (
                                                             i=1 iy − y )

                                      1 Xn
                                 MBE =        ( ŷi − yi ), rMBE = MBE/y                               (2)
                                      n   i=1

                                      1 Xn
                               MABE =          ŷi − yi , rMABE = MABE/y                               (3)
                                      n   i=1
                                     r
                                       1 Xn
                              RMES =           ( ŷi − yi )2 , rRMSE = RMSE/y                          (4)
                                       n   i=1

                                         bias = ŷi − yi , i = 1, 2, . . . , n                         (5)
                                                   ŷi − yi
                                       APE =                , i = 1, 2, . . . , n                      (6)
                                                       yi
where n is the number of data samples, y means ground-measured Rdif values whose mean value is y
and ŷi represents corresponding estimated values whose mean value is ŷ. R measures the strength
and direction of a linear relationship between ŷi and yi . R ranges from −1 to 1, and a closer value to
1 indicates a strong positive linear relationship between estimated and measured Rdif . MBE is the
mean difference between compared variables, representing the systematic error of Rdif products to
under- or overestimate. MABE is the mean of absolute differences between ŷi and yi and gives the
average magnitude of under- or overestimation of Rdif compared to ground measurements. RMSE
represents the standard deviation of the differences between ŷi and yi . Compared to MABE, RMSE is
more sensitive to outliers. To eliminate the scale-dependency (i.e., influence from numbers of samples)
of these metrics, their relative values are also available through dividing the original values by the
mean of the reference measurements. For temporal and spatial evaluation and comparison of Rdif ,
these metrics were calculated according to different grouping strategies, i.e., 12 months, 8 years, and
39 stations.
     In addition, we demonstrated the probability density functions (PDFs) of bias and cumulative
distribution functions (CDFs) of APE for comparison of data accuracy within different tolerance ranges
of deviations. The bias indicates the under- or overestimation of each estimated Rdif value. PDF is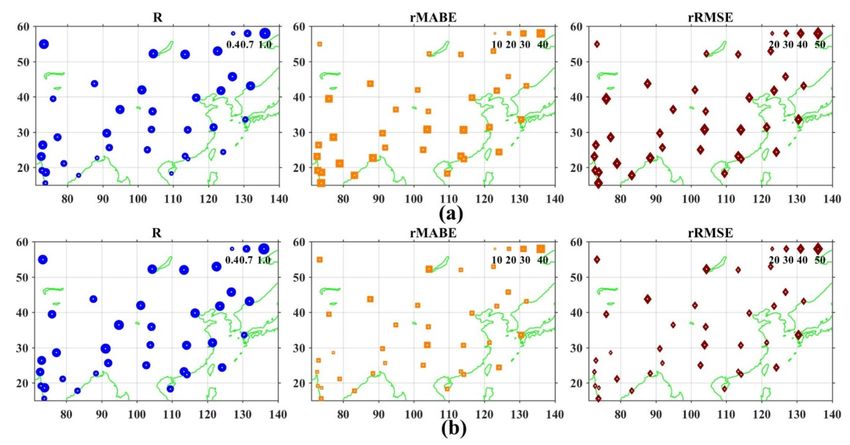
Remote Sens. 2020, 12, 1387                                                                         6 of 19

a statistical expression that defines the probability distribution of a random variable. When PDF is
graphically portrayed, the total area of an interval (expressed as bin width during statistical process)
under the curve equals the probability of the random variable occurring. Herein, PDF determines
the likelihood of calculated bias falling into a specific range. APE expresses the deviation of each
estimate in percentage, and the associated CDF gives the proportion of APE with values less than a
certain threshold.

3.2. Time Series Decomposition
     Time series decomposition is a common way to identify the change of different components
of interest [35,40], and it involves separating a time series into several distinct components.
Three components are typically of interest, i.e., the trend, seasonal periodicity and stochastic irregular
anomalies. The additive functional form has been widely used to observe the bias and errors of
Rs [41,42]. It assumes that a monthly Rdif time series, R(t), can be decomposed into the low-frequency
                                                                        ¯
climatological contributions, consisting of the long-term trends R(t), the climatological seasonal cycles
~                                           0
R(t) and high-frequency deviations R (t) :

                                                    ¯       ~       0
                                            R(t) = R(t) + R(t) + R (t)                                 (7)

                                                                ¯
where t defines the length of Rdif time series. The trends R(t) describe the gradual variations and can
be estimated by using moving averages or parametric regression models [3,43]. The seasonal cycles
~
R(t) capture level shifts that repeat systematically within the same period between successive years.
                 0
The anomalies R (t) exhibit autocorrelation and cycles of unpredictable duration. For identifiability
       ¯      ~               0
from R(t), R(t) and R (t) are assumed to fluctuate around zero.
     Since the periodicity of Rdif data is monthly, a 13-term moving window is used for estimating
the long-term trend by setting weight 1/24 for the first and last terms and weight 1/12 for the interior
                  ¯
terms. Then R(t) is removed from the original series to obtain the detrended time series. Assuming a
                                                                                ~
stable seasonal component that has constant amplitude across the series, R(t) can be determined by
averaging detrended time series for each month over the whole period, i.e., by averaging all of the
                                                                                              0
January values, then all of the February values and so on for the remaining months. Finally, R (t) is
                                  ¯     ~                                           ~
determined by removing R(t) and R(t) from the original time series. If only R(t) is removed, the rest
                                        0
is called a deseasonalized time series Rd (t) :

                                                ¯       0                   ~
                                      R’d (t) = R(t) + R (t) = R(t) − R(t)                             (8)

     In this study, the similarity of two time series from different datasets was measured by the
                                                                           0
Pearson correlation coefficient (Equation (1)) of their corresponding Rd (t). The significance at the
95% confidence level was obtained through an F-test on the linear regression model of the two time
series. In particular, we considered the increasing/decreasing trend of different components over
time. We fit a linear regression model between the components and associated time index, and the
slope coefficient was regarded as the indicator of increasing/decreasing trend versus time. In addition,
the 95% confidence bounds of the slope coefficient were given by the F-test on the regression model.

4. Results

4.1. Evaluation Against Ground Measurements
     The hourly Rdif estimates of ERA5 and JiEA are compared with the quality-controlled ground
measurements from 17 CMA stations. It is stressed that such comparisons are conducted at their
original spatial resolutions. ERA5 has an overall correlation coefficient R of 0.71, a negative bias of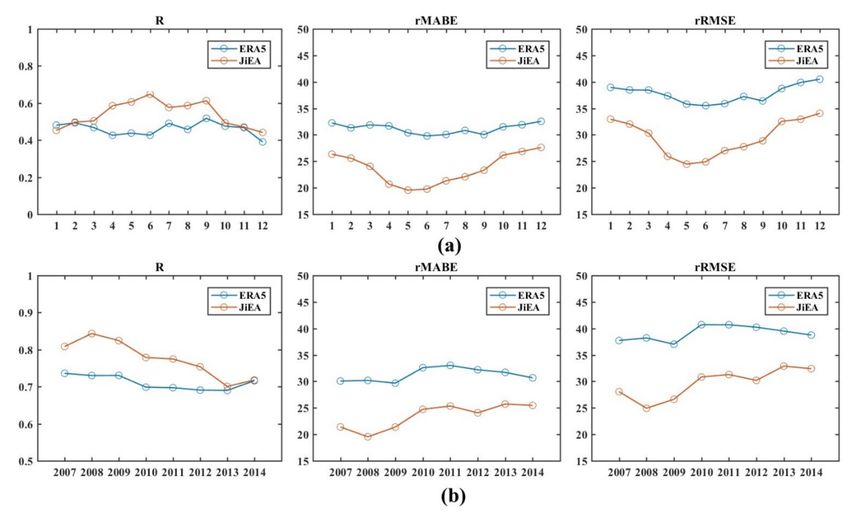
Remote Sens. 2020, 12, 1387                                                                                       7 of 19

29.69 W/m2 , an MABE of 63.83 W/m2 and an RMSE of 92.29 W/m2 , whereas these values are 0.85,
8.54 W/m2 , 50.43 W/m2 , and 66.36 W/m2 for JiEA. It is apparent that Rdif estimates of JiEA correlate
better than ERA5 with in situ measurements at the selected stations. Evidence comes from their
density scatterplots; Figure 2a shows that more points are concentrated on the lower side of 1:1 line,
while in Figure 2b almost all data pairs are symmetrically distributed around the 1:1 line. This is also
the reason why ERA5 exhibits a relatively serious underestimation of Rdif , with an rMBE of 18.4%.
For low-radiation estimation, ERA5 performs better than JiEA, as high-density (red) scatters are on both
sides of l:1 line in Figure 2a, while they are obviously inclined to the upper side in Figure 2b. The PDF
of JiEA resembles the Gaussian distribution with a mean slightly larger than zero, coinciding with the
observed overestimation and the density scatterplots. Although the peak of ERA50 s PDF nears zero, the
curve is significantly asymmetric, revealing a high probability of underestimation. The performance
of JiEA is superior to ERA5 when setting the tolerance of absolute percentage bias lower than 0.51,
while few estimates of ERA5 would exceed one (Figure 2d). At hourly scale, the time systems of Rdif
estimates and ground measurements deserve attention [44]. For example, measurements at some
stations might be recorded according to the local time and then converted to universal time (usually
the time system of satellite acquisition and climate reanalysis) when stored into a standard database.
There is consequently a change of original values due to a resampling of data series in time; in any
case, returning to the original values is impossible due to the asystematic shift of a fraction of an hour
before and after conversion. That change would have negative impacts on evaluation results at hourly
scale. It is pointed out that this impact does not hold if we deal with daily, monthly or yearly averages
or sums of solar radiation data.

      Figure 2. Evaluation results of hourly Rdif estimates. (a) Density scatterplots between ERA5 estimates
      and CMA measurements. (b) Scatterplots for estimates of JiEA. At the upper left corner shows the
      values of validation metrics with their relative values in the brackets. Black lines represent the 1:1 lines.
      (c) probability distribution functions (PDFs) of bias for ERA5 (blue line) and JiEA (orange line); (d) The
      related cumulative distribution functions (CDFs) of absolute percentage bias.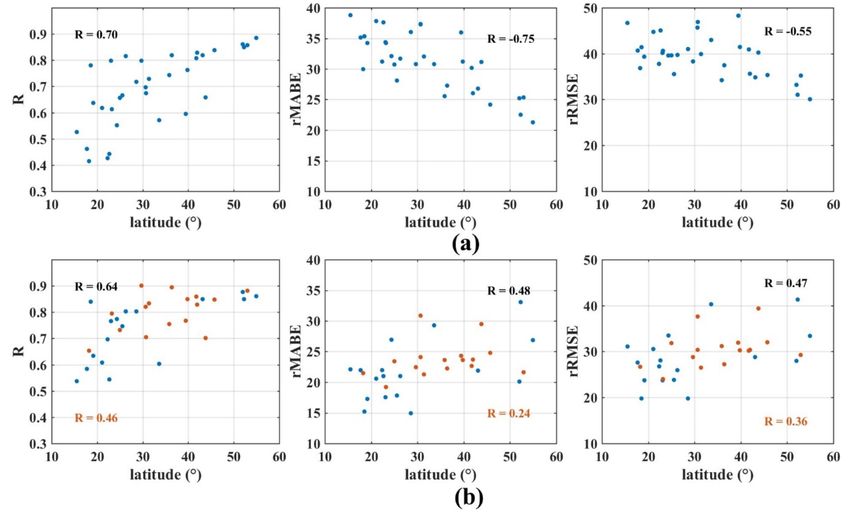
Remote Sens. 2020, 12, 1387                                                                             8 of 19

      Daily mean Rdif estimates are evaluated using measurements at all 39 stations from WRDC and
CMA. As indicated by various metrics, the overall accuracy of JiEA exceeds that of ERA5. Similar
differences to hourly-scale evaluation are observed between ERA5 and JiEA from Figure 3a–d. The PDF
of JiEA is symmetrically distributed with a zero mean, while that of ERA5 indicates a high probability
of a negative bias. The proportion of JiEA samples whose accuracy is higher than ERA5 reaches up
to 84% (Figure 3d). However, some apparently questionable estimates exist for the results of JiEA
(e.g., scatters at the lower right corner of Figure 3b). Failure of these estimates might result from
the difference between ground and satellite measurements, in that ground measurements represent
an average state over the sample time interval whereas only instantaneous state is manifested by
satellite images [45]. For instance, when coming across fast-moving clouds, a satellite sensor may scan
a cloudy sky, but ground stations are covered by cloud shadows only within a momentary period (less
than sample time interval). In this case, ground measurements would be greater than satellite-based
estimates. The same evaluation is conducted in four typical regions, i.e., Eastern China, Mongolian
Plateau, Tibetan Plateau and Deccan Plateau, whose boundaries are defined in Figure 1. Data accuracy
of JiEA is always better than ERA5 except for the Mongolian Plateau (Figure S1). Both ERA5 and JiEA
achieve more accurate estimates of Rdif over the Mongolian Plateau and Tibetan Plateau than over
other regions. Particularly, ERA5 seriously underestimates Rdif over the Deccan Plateau and shows
a large difference compared to JiEA. This is probably due to their inappropriate representation or
modeling of aerosols, clouds and their interactions with solar radiation in the atmosphere [2,46,47]
for Eastern China and India where rapid economic development and high-speed urbanization have
caused heavy pollution [27,48]. Besides, frequent cloudy and rainy weather in India and South China
also leads to the difficulty in estimating Rdif [49,50].

      Figure 3. Evaluation results of daily mean Rdif estimates. (a–d) Analogous to Figure 2 but at daily
      mean scale using measurements from WRDC and CMA.
Remote Sens. 2020, 12, 1387 9 of 19
The differences in data accuracy between JiEA and ERA5 are more obvious at monthly mean
scale (Figure S2). JiEA almost achieves zero deviation on average (a negative MBE of 0.92 W/m2
and zero-centered PDF). ERA5 underestimates most parts of the selected samples, and the largest
underestimation is greater than 50 W/m2 . The accuracy of 94% of samples exceeds ERA5 with
absolute percentage bias lower than 0.39. We also depict the PDF and CDF of JiEA after upscaling the
original monthly data to 0.25◦ grids (dotted black lines in Figure S2c,d) and observe no significant
change comparing to the original ones, suggesting that the above comparisons are hardly affected
by the different spatial resolutions of the two datasets. As pointed out by previous studies [51–53],
the evaluation results are likely affected by the spatial representativeness of ground measurements.
The comparison of Figures S2b and S3 indicates that ground Rdif measurements at the selected stations
are more representative for 0.05◦ × 0.05◦ spatial grids than 0.25◦ × 0.25◦ . In this regard, the deviations
in comparison to ground measurements are not completely attributed to the performance of models or
algorithms [33,44,54].
The monthly maximum (minimum) of Rdif appears in June/July (December) and approximates to
110 (47), 90 (36) and 107 (44) W/m2 for measurements, ERA5 and JiEA, respectively. It is clear that
results from JiEA are closer to the measured values than those of ERA5. At the selected 39 stations,
the measured yearly Rdif is 79.78 W/m2 on average, and the ratio of Rdif to Rs (173.97 W/m2 ) equals
45.86%. The estimates of JiEA (Rdif : 78.41 W/m2 , Rs : 171.95 W/m2 , Rdif ratio: 45.60%) are basically
consistent with the measurements; on the contrary, ERA5 seems to underestimate Rdif as well as its
fraction (Rdif : 63.26 W/m2 , Rs : 190.10 W/m2 , Rdif ratio: 33.28%). For the whole East Asia region, JiEA
provides a mean Rdif of 71.89 W/m2 , accounting for 41.84% of Rs (171.81 W/m2 ), while ERA50 s estimate
of Rdif (63.40 W/m2 ) only accounts for 34.78% of Rs (182.28 W/m2 ).
4.2. Temporal Difference of Data Accuracy
The temporal stability of data accuracy is critical for detection of the long-term trend of time
series products [55,56]. One of the advantages of reanalysis products is their potential to provide
geographically and physically consistent estimates of regional climate changes [57–59]. We illustrate
the average seasonal (Figure 4a) and interannual (Figure 4b) variations of different metrics to examine
the temporal consistency. Considering that the absolute amount of Rdif varies greatly among months
and years, relative errors (rMABE and rRMSE) are discussed. Although the overall accuracy of ERA5
is inferior to JiEA, ERA5 shows a good robustness in time. The change of R is less than 0.1 and those
of rMABE and rRMSE are less than 5% for ERA5, while the maximum disparity is doubled for JiEA.
Snow/ice cover is the factor most likely to be responsible for the worse accuracy of satellite-based
estimates in winter. The similarity of spectral and physical properties of cloud and surface snow covers
hampers the identification of clouds and retrievals of cloud optical depths over snow/ice surface [60,61],
subsequently resulting in a lower accuracy in satellite estimation of solar radiation [18,24,46]. Due to
the lack of a physical basis, machine learning based methods always suffer from their dependence on
the representativeness of training samples, and consequently their generalizability is limited [33,62,63].
As shown in Figure 4b, although a perfect performance is achieved in 2008, when the training set for
the deep network behind JiEA is constructed, data accuracy of other years becomes much worse, with
a maximum disparity of 8% with respect to rRMSE. On the contrary, the accuracy of ERA5 is relatively
stable over time.Remote Sens. 2020, 12, 1387 10 of 19
Figure 4. Temporal variation of R, rMABE and rRMSE: (a) results among different months; (b) results
among different years. We illustrate the mean value of all stations at daily mean scale.
To examine whether the two datasets can capture the changing trend and seasonal cycles of
Rdif , we pick out 24 stations that provide relatively complete monthly measurements for time series
analysis. Very few missing values are substituted by the average of existing records of the same month.
The results of time series decomposition are presented in Figure S4. ERA5 and JiEA reflect roughly
similar trends that are consistent with the measured ones at most stations. However, there are issues
with significantly different and even contradictory trends, such as for Ulan-Bator, Harbin, Lhasa and
Urumqi. We speculate that this may be due to the combined effects of local pollution and climate change.
For example, the increase of particles and aerosols in the atmospheric layer near the surface caused
by air pollution actually leads to greater measured Rdif at stations, but reanalysis and satellite-based
estimates do not respond to such pollution because of information loss. With respect to time series
anomalies, ERA5 tends to level off, while JiEA and measurements exhibit stronger fluctuations.
Specifically, the observed increasing/decreasing trends from estimates are identical with measurements
at 14 and 12 stations for ERA5 and JiEA, respectively, but none of them passes the significance test at
the 95% confidence level. This confirms the conclusion that neither satellite retrievals nor reanalysis
can accurately reproduce the decadal variability and trend revealed by combining homogenized
measurements and sunshine-duration-derived Rs [29,64]. The discrepant trends between estimates
and measurements during the validation period might be attributed to inappropriate responses of
models to undulated aerosols over these regions [28]. In view of aerosol’s dominant contribution to
the decadal trends in Rs [65], an inclusion of aerosol variability in the reanalysis and satellite retrieval
is necessary for an accurate detection of changes of Rdif , which result from the scattered solar radiation
on particles in the atmosphere (aerosols).
At regional levels, the trends of ERA5 remain highly constant for all regions except the Deccan
Plateau, while JiEA shows slightly decreasing trends with slopes versus times ranging from 0.03
to 0.09 W m−2 yr−1 (Figure S5). The results of JiEA are in line with the reported insignificant trend
(slope = −0.03, p > 0.1) of Rs over China between 2001 and 2016 [10]. Regardless of the large difference
with the measured series, the deseasonalized time series of ERA5 and JiEA correlate for most parts of
East Asia (Figure S5f). The phenomenon of estimates being weakly correlated with measurementsRemote Sens. 2020, 12, 1387 11 of 19
reflects the difficulty in reproducing temporal variations at fine spatial resolutions and implies that the
constructed variations of Rdif from gridded products are reasonable at coarse scales.
4.3. Spatial Distribution of Biases
The data accuracy shows notable spatial differentiation at the selected stations (Figure 5). For ERA5
data, latitude holds a positive correlation with R and a negative correlation with rMABE and rRMSE
(Figure 6a), with correlation coefficients of 0.70, −0.75 and −0.55, respectively. This latitudinal
dependency is prevalent among radiation datasets, such as GEWEX-SRB [66], ISCCP-FD [29] and
UMD-SRB [20]. Serious underestimation occurs at stations on the Deccan Plateau, followed by the
Eastern China (Figure S6a), which might be attributed to the inappropriate aerosol representations [29].
Local air pollution has caused high aerosol concentrations in these regions [30,67], but representation of
aerosol absorption under a cloud layer is not included in current algorithms [20,29]. Although dimming
of Rs is observed in Eastern China, absorption and scattering of solar radiation by aerosols and clouds
increase the fraction of diffuse radiation [30,68].
With respect to JiEA data, the latitudinal dependency is not as pronounced as for ERA5 (Figures 5
and 6). R shows a positive correlation with latitude (correlation coefficient equals 0.64), along with
similar spatial distribution to ERA5. However, rMABE and rRMSE are positively correlated with
latitude. The linear relationship is greatly weakened when only considering CMA stations (brown
dots in Figure 6a). Moreover, the spatial difference of rMBE is almost negligible in China (Figure S6b).
These results support that this deep learning based method results in high robustness in space [22].
As pointed out by previous studies [22–24], the ability of machine learning methods depends on the
representativeness of training samples; therefore, some large deviations appear at stations outside
China, such as Irkutsk, Omsk, Fukuoka and Ishigakijima. It is surprising that JiEA provides satisfying
Rdif estimates at stations in India; this might be due to the similarity in atmospheric scattering
mechanisms with South China.
Figure 5. Spatial mapping of R, rMABE and rRMSE: (a) results for ERA5; (b) results for estimates of
JiEA. Values are calculated from valid records of each station at daily means.Remote Sens. 2020, 12, 1387 12 of 19
Figure 6. Latitudinal dependency of data accuracy: (a) results for ERA5; (b) results for estimates of
JiEA. Spatial distribution corresponds to Figure 5. The correlation coefficients (R) indicate a linear
relationship. For (b), brown dots represent the selected CMA stations.
5. Discussion
The data accuracy of ERA5 and JiEA is evaluated using ground measurements, and the results
show that both datasets provide acceptable estimates of Rdif at the selected stations. For research
on global climate change, homogeneous data with global coverage including focal hotspot regions
like the Arctic, the Antarctic, the Tibet Plateau and others are always required [69]. In the field of
solar energy applications, finer spatial resolution and wider ranges of temporal resolution are usually
emphasized [17,62]. The WMO Observing System Capability Analysis and Review Tool (OSCAR)
collects user-defined quantitative requirements with respect to the spatial resolution, timescale,
coverage and quality for downward short-wave irradiance at the Earth’s surface (Table S2). Although
it is reported that the overall accuracy of Rs has entered the gate of intermediate level requirements
(Break. in Table S2) [22,26,33,62], Rdif estimates from ERA5 and JiEA can only meet the minimum
requirement (Thres. in Table S2) at monthly mean scale according to above evaluation results.
Last but not least, we concentrate on the spatial distribution of Rdif over East Asia. We show
the annual average from 2007 to 2014 of Rdif estimates and its fraction (relative to Rs ) from ERA5
and JiEA at 0.25◦ grids (Figure 7). It is apparent that the two datasets illustrate significantly different
spatial patterns, with the largest differences on the Tibetan Plateau, Deccan Plateau and Taklimakan
Desert (Figure 7e). Both the amount and ratio of JiEA are in line with the application level products
of SolarGIS [70] over all of East Asia (Figure S7a,b). In contrast, the Rdif distribution of ERA5 is in
agreement with the diffuse photosynthetically active radiation (PAR) from Breathing Earth System
Simulator (BESS) [10], except at low latitudes (Figure S7c). In the absence of densely distributed in
situ measurements, it is difficult to judge which pattern is reliable. However, subjective judgements
can be made according to common sense in combination with the spatial mappings of atmospheric
factors mostly related to the estimate of Rdif (Figure 8). Previous studies show that cloud parameters
(cloud coverage and optical thickness) and aerosols are two of the most important factors for Rs
estimation [2,71–74]. The amount of water vapor plays a vital role in radiation scattering and leads
to altitudinal disparity [75–77]. Herein, we take MODIS-derived parameters as references, including
cloud fraction (CF), cloud optical thickness (COT), aerosol optical depth (AOD) and water vapor.Remote Sens. 2020, 12, 1387 13 of 19
Figure 7. Spatial distribution of Rdif over East Asia: (a,b) annual average (2007–2014) and its fraction
in relation to Rs estimated by ERA5 datasets; (c,d) analogous to (a,b) after upscaling estimates of JiEA
to 0.25◦ ; (e) the difference between ERA5 and JiEA (ERA5 minus JiEA).
Both BESS and SolarGIS confirm that ERA5 seriously underestimates Rdif at low latitudes.
The large amount of Rdif is the combined result of high-density downward radiation and strong
scattering effects of water vapor. An additional contribution comes from aerosols for the southern
Himalayas and from clouds (high CF and middle COT) for South China. The amount of Rdif from
JiEA is approximately equal to that from SolarGIS, but their diffuse ratios are discrepant, implying
an underestimation of Rs by JiEA. In Sichuan Basin and the middle and lower reaches of the Yangtze
River, COT and water vapor account for a large amount of Rdif . In North China, AOD occupies the
dominant role in affecting the estimate of Rdif . Due to the low Rs caused by high CF, the ratio of
Rdif to Rs can reach around 0.7 in these regions (Figure 7d). As indicated by site-level evaluation
(Beijing, Chengdu, Wuhan and Shanghai in Figure S4), the underestimation of ERA5 seems certain.
Another area of concern is the Taklimakan Desert, where both CF and COT are low but aerosols and
atmospheric water vapor are high. Therefore, we believe that the high amount (~90 W/m2 ) and middle
ratio (~0.5) of Rdif is possible. In addition, the regional average is very close to the measured values at
Kashi station (Figure S4). Based on the above analysis, we are confident in the reliability of JiEA and
believe that underestimation indeed occurs for ERA5 in related regions. Global simulations of surfaceRemote Sens. 2020, 12, 1387 14 of 19
solar radiation like ERA5 use a one-dimensional atmospheric radiative transfer model for computation
efficiency. As a result, radiation retrievals are unable to tackle the adjacency effects caused by photons
which are reflected by the surface out of the field of view and then scattered into the field of view by
the atmosphere [78]. That effect directly results in the increase of Rdif . Neglect of adjacency effects
can account for up to 5% underestimation in incident shortwave radiation on the land surface [10].
In particular, multiple reflections and scattering events off the sides of clouds lead to stronger adjacency
effects and consequently to worse underestimation [33,54]. JiEA relies on a CNN-based module to
capture the spatial pattern of clouds to deal with adjacency effects [22] and avoids underestimation of
Rdif radiation to some degree.
Figure 8. Spatial distribution of atmospheric parameters most relevant to Rdif estimation: (a) cloud
fraction; (b) cloud optical thickness; (c) aerosol optical depth; (d) atmospheric water vapor. We show
the averages of monthly results in 2010 of MODIS derived parameters (https://neo.sci.gsfc.nasa.gov/).
On the Tibetan Plateau, ERA5 provides the highest estimates of Rdif , significantly greater than those
of JiEA. An exception appears in the Tarim Basin. Regardless of overestimation or underestimation, the
inner spatial distribution of Rdif estimated by ERA5 and JiEA is highly similar (Figure S5f) and agrees
well with relevant atmospheric factors (Figure 8). Measurements at Golmud station that is located in
the Tarim Basin support the results of JiEA, while the high similarity between observed time series at
Lhasa station and ERA50 s estimates confirms the potential underestimation of JiEA on the Tibetan
Plateau (Figure S4c). One cause of JiEA’s underestimation might be the excessive constraint that
assumes an idealized state without diffuse radiation at the top of Mt. Everest [22]. The underestimation
might also result from misidentification between ice clouds and liquid water clouds, whose radiative
effects are significantly different [79,80]. The high probability of ice clouds on the Tibetan Plateau [80]
tends to cause more Rdif than equivalent liquid water clouds. Previous studies demonstrate that cloud
parameters (liquid/ice cloud types are inclusive) are critical in determining Rs [46,81]. This reminds us
that we cannot accurately retrieve surface radiation from passive satellite signals alone, and even the
best model needs to integrate atmospheric parameters. Therefore, integration of radiation transfer
models and deep learning might be the next research focus.Remote Sens. 2020, 12, 1387 15 of 19
Surface conditions may also influence the estimate of surface radiation. The most frequently
mentioned one relates to snow/ice cover, which is often mistaken for clouds. In particular, retrievals
of cloud optical depths over such surfaces are accompanied by large uncertainties [61]. It is even
more challenging over short-lived snow or ice [33,60]. The high-level Rdif of ERA5 on the Tibetan
Plateau and the Pamir Plateau is likely affected by snow/ice because observed seasonal variations
of Rdif (Figure S8) are not consistent with variations of atmospheric factors (Figure S9) but show
high similarity to snow/ice cover (Figure S10). Except for this specific issue, both datasets conform
to common sense on how atmospheric factors influence Rdif in seasonal cycles, proving their strong
ability to capture seasonal variation of Rdif at regional scale (Figure S5f).
6. Conclusions
Although Rs estimates are widely available from many radiation products, only ERA5 reanalysis
and satellite-based JiEA provide estimates of Rdif over East Asia. Comprehensive evaluation and
comparison are of great importance for rational use of these data and in-depth understanding of
temporal trends and spatial differences of Rdif . In this study, estimates of Rdif at the surface are
evaluated by comparing to quality-controlled measurements from WRDC and CMA and are mutually
compared with respect to temporal variations and spatial distributions by referring to the spatial
pattern of related atmospheric factors.
Hourly Rdif estimates of JiEA agree well with CMA measurements with an R of 0.85, MBE of
8.54 W/m2 , MABE of 50.43 W/m2 , and RMSE of 66.36 W/m2 , while ERA5 performs a little worse
with an R of 0.71, negative MBE of 29.69 W/m2 , MABE of 63.83 W/m2 and RMSE of 92.29 W/m2 .
The performance of ERA5 is better than JiEA for low-radiation estimates. The overall accuracy of
JiEA also exceeds ERA5 at daily means, with 84% of winning samples. Some problematic estimates
occur for JiEA, likely due to the failure to handle extreme cases. Their performances are different in
different regions. Particularly, ERA5 seriously underestimates Rdif on the Deccan Plateau. At monthly
means, the RMSE of Rdif estimates decreases to 12.92 and 21.13 W/m2 for JiEA and ERA5, respectively.
These comparisons are hardly affected by their different spatial resolution, but the evaluation results
are dependent on the spatial representativeness of ground measurement.
Data accuracy of ERA5 shows strong temporal consistency and latitudinal dependency. On the
contrary, the accuracy of JiEA fluctuates in time and is robust in space. Therefore, we would like
to recommend using ERA5 reanalysis data for trend detection and satellite-based JiEA for regional
comparisons. Deseasonalized monthly time series of ERA5 and JiEA are highly correlated with each
other but differ from the ground-observed series, indicating that gridded products are unable to
reproduce temporal variability at site level. At the regional scale, we observe a slight decreasing trend
of Rdif from JiEA and no trend from ERA5 within the validation period. Both time series analysis
at stations and seasonal variations of spatial distribution show that ERA5 and JiEA are capable of
capturing the seasonal cycle of Rdif effectively, although deviations still exist.
Notable differences of spatial distribution of Rdif from the two datasets appear on the Tibetan
Plateau, where the underestimation of JiEA might be due to the misidentification between ice clouds
and liquid water clouds, while the overestimation of ERA5 seems related to surface snow/ice cover.
References to the spatial distribution of atmospheric factors support Rdif estimates of JiEA and confirm
the general underestimation of ERA5 over East Asia. Neglect of adjacency effects caused by photon
transport is regarded as the main cause for ERA50 s underestimation. Our analysis calls for the
integration of physical models and new technologies (e.g., deep learning) to obtain accurate estimates
of Rdif .
Supplementary Materials: The following are available online at http://www.mdpi.com/2072-4292/12/9/1387/s1,
Figure S1: Evaluation results of Rdif in different regions at daily mean scale. Figure S2: Evaluation results of
monthly mean Rdif estimates. Figure S3: The effects of spatial resolution on evaluation results. Figure S4: Results of
time series decomposition. Figure S5: Results of time series decomposition in different regions. Figure S6. Spatial
distribution of rMBE. Figure S7. Spatial distribution of reference data. Figure S8. Seasonal spatial distribution of
two datasets. Figure S9. Seasonal spatial distribution of atmospheric parameters most relating to Rdif estimation.Remote Sens. 2020, 12, 1387 16 of 19
Figure S10. Seasonal snow/ice cover. Table S1. Basic information of surface radiation stations involved in this
study. Table S2. Requirements defined for downward short-wave irradiance at Earth surface.
Author Contributions: Conceptualization, H.J. and Y.Y.; methodology, H.J.; software, H.W.; validation, H.W.,
Y.B. (Yongqing Bai) and Y.B. (Yan Bai); formal analysis, H.J.; investigation, H.W.; resources, Y.Y.; data curation,
Y.B. (Yan Bai); writing—original draft preparation, H.J.; writing—review and editing, H.J.; visualization,
Y.B. (Yongqing Bai); supervision, Y.B. (Yongqing Bai); project administration, H.W.; funding acquisition, Y.Y.
All authors have read and agreed to the published version of the manuscript.
Funding: This research was funded by Strategic Priority Research Program (A) of the Chinese Academy of
Sciences (XDA19020304), Multidisciplinary Joint Expedition for China–Mongolia–Russia Economic Corridor
(2017FY101300), Branch Center Project of Geography, Resources and Ecology of Knowledge Center for
Chinese Engineering Sciences and Technology (CKCEST-2019-1-4), National Earth System Science Data Sharing
Infrastructure (2005DKA32300).
Acknowledgments: We would like to thank all people fighting with COVID-19, the Copernicus Climate
Change Service for the online available ECMWF ERA5 datasets, and NASA Earth Observations for the public
atmospheric parameters.
Conflicts of Interest: The authors declare no conflict of interest. The founding sponsors had no role in the design
of the study; in the collection, analyses, or interpretation of data; in the writing of the manuscript, and in the
decision to publish the results.
References
1. Wang, K.; Dickinson, R.; Wild, M.; Liang, S. Evidence for decadal variation in global terrestrial
evapotranspiration between 1982 and 2002: 1. Model development. J. Geophys. Res. 2010, 115, D20112.
2. Wild, M.; Folini, D.; Schär, C.; Loeb, N.; Dutton, E.; König-Langlo, G. The global energy balance from a
surface perspective. Clim. Dyn. 2012, 40, 3107–3134.
3. Wild, M.; Ohmura, A.; Schär, C.; Müller, G.; Folini, D.; Schwarz, M.; Hakuba, M.Z.; Sanchez-Lorenzo, A.
The global energy balance archive (GEBA) version 2017: A database for worldwide measured surface energy
fluxes. Earth Syst. Sci. Data 2017, 9, 601–613.
4. Yang, W.; Guo, X.; Yao, T.; Yang, K.; Zhao, L.; Shenghai, L.; Zhu, M. Summertime surface energy budget and
ablation modeling in the ablation zone of a martime tibetan glacier. J. Geophys. Res. 2011, 116, D14116.
5. Wild, M.; Ohmura, A.; Makowski, K. Impact of global dimming and brightening on global warming. Geophys.
Res. Lett. 2007, 34, L04702.
6. Jia, B.; Xie, Z.; Dai, A.; Shi, C.; Chen, F. Evaluation of satellite and reanalysis products of downward surface
solar radiation over east asia: Spatial and seasonal variations. J. Geophys. Res. (Atmos.) 2013, 118, 3431–3446.
7. Mokhtari, A.; Noory, H.; Vazifedoust, M. Improving crop yield estimation by assimilating LAI and inputting
satellite-based surface incoming solar radiation into SWAP model. Agric. For. Meteorol. 2018, 250, 159–170.
8. Rap, A.; Scott, C.E.; Reddington, C.; Mercado, L.; Ellis, R.; Garraway, S.; Evans, M.; Beerling, D.J.;
Mackenzie, A.; Hewitt, C.N.; et al. Enhanced global primary production by biogenic aerosol via diffuse
radiation fertilization. Nat. Geosci. 2018, 11, 640–644.
9. Zhang, M.; Yu, G.-R.; Zhuang, J.; Gentry, R.; Fu, Y.-L.; Sun, X.; Zhang, L.-M.; Wen, X.; Wang, Q.-F.; Han, S.-J.;
et al. Effects of cloudiness change on net ecosystem exchange, light use efficiency, and water use efficiency in
typical ecosystems of China. Agric. For. Meteorol. 2011, 151, 803–816.
10. Ryu, Y.; Jiang, C.; Kobayashi, H.; Detto, M. Modis-derived global land products of shortwave radiation and
diffuse and total photosynthetically active radiation at 5 km resolution from 2000. Remote Sens. Environ.
2017, 204, 812–825.
11. Mercado, L.; Bellouin, N.; Sitch, S.; Boucher, O.; Huntingford, C.; Wild, M.; Cox, P. Impact of changes in
diffuse radiation on the global land carbon sink. Nature 2009, 458, 1014–1017. [PubMed]
12. Alton, P.; North, P.R.J.; Los, S. The impact of diffuse sunlight on canopy light-use efficiency, gross
photosynthetic product and net ecosystem exchange in three forest biomes. Glob. Chang. Biol. 2007,
13, 776–787.
13. Kanniah, K.; Beringer, J.; North, P.R.J.; Hutley, L. Control of atmospheric particles on diffuse radiation and
terrestrial plant productivity: A review. Prog. Phys. Geogr. 2012, 36, 210–238.
14. Choudhury, B. A sensitivity analysis of the radiation use efficiency for gross photosynthesis and net carbon
accumulation by wheat. Agric. For. Meteorol. 2000, 101, 217–234.Remote Sens. 2020, 12, 1387 17 of 19
15. Holzman, M.E.; Carmona, F.; Rivas, R.; Niclòs, R. Early assessment of crop yield from remotely sensed water
stress and solar radiation data. ISPRS J. Photogramm. Remote Sens. 2018, 145, 297–308.
16. Lee, M.; Hollinger, D.; Keenan, T.; Ouimette, A.; Ollinger, S.; Richardson, A. Model-based analysis of the
impact of diffuse radiation on CO2 exchange in a temperate deciduous forest. Agric. For. Meteorol. 2017, 249,
377–389.
17. Bódis, K.; Kougias, I.; Jäger-Waldau, A.; Taylor, N.; Szabó, S. A high-resolution geospatial assessment of the
rooftop solar photovoltaic potential in the european union. Renew. Sustain. Energy Rev. 2019, 114, 109309.
18. Qin, J.; Tang, W.; Yang, K.; Lu, N.; Niu, X.; Liang, S. An efficient physically based parameterization to derive
surface solar irradiance based on satellite atmospheric products. J. Geophys. Res. Atmos. 2015, 120, 4975–4988.
19. Kobayashi, H.; Iwabuchi, H. A coupled 1-D atmosphere and 3-D canopy radiative transfer model for
canopy reflectance, light environment, and photosynthesis simulation in a heterogeneous landscape.
Remote Sens. Environ. 2008, 112, 173–185.
20. Xia, X.; Wang, P.; Chen, H.; Liang, F. Analyis of downwelling surface solar radiation in China from national
centers for environmental prediction reanalysis, satellite estimates, and surface observations. J. Geophys. Res.
2006, 111, D09103.
21. Copernicus Climate Change Service (C3S). ERA5: Fifth generation of ECMWF atmospheric reanalyses of the
global climate. Climate Data Store (CDS) 2017. Available online: https://cds.climate.copernicus.eu/cdsapp#!/
home (accessed on 27 April 2020).
22. Jiang, H.; Lu, N.; Qin, J.; Tang, W.; Yao, L. A deep learning algorithm to estimate hourly global solar radiation
from geostationary satellite data. Renew. Sustain. Energy Rev. 2019, 114, 109327.
23. Linares-Rodriguez, A.; Ruiz-Arias, J.; Pozo-Vazquez, D.; Tovar-Pescador, J. An artificial neural network
ensemble model for estimating global solar radiation from meteosat satellite images. Energy 2013, 61, 636–645.
24. Lu, N.; Qin, J.; Yang, K.; Sun, J. A simple and efficient algorithm to estimate daily global solar radiation from
geostationary satellite data. Energy 2011, 36, 3179–3188.
25. Zhang, X.; Liang, S.; Zhou, G.; Wu, H.; Zhao, X. Generating global land surface satellite incident shortwave
radiation and photosynthetically active radiation products from multiple satellite data. Remote Sens. Environ.
2014, 152, 318–332.
26. Jiang, H.; Yang, Y.; Bai, Y.; Wang, H. Evaluation of the total, direct, and diffuse solar radiations from the ERA5
reanalysis data in China. IEEE Geosci. Remote Sens. Lett. 2020, 17, 47–51.
27. Soni, V.; Pandithurai, G.; Pai, D. Evaluation of long-term changes of solar radiation in india. Int. J. Climatol.
2012, 32, 540–551.
28. Wang, Y.; Trentmann, J.; Yuan, W.; Wild, M. Validation of CM SAF CLARA-A2 and SARAH-E surface solar
radiation datasets over China. Remote Sens. 2018, 10, 1977.
29. Zhang, X.; Liang, S.; Wild, M.; Jiang, B. Analysis of surface incident shortwave radiation from four satellite
products. Remote Sens. Environ. 2015, 165, 186–202.
30. Yang, S.; Wang, X.; Wild, M. Homogenization and trend analysis of the 1958-2016 in-situ surface solar
radiation records in China. J. Clim. 2018, 31, 4529–4541.
31. Greuell, W.; Meirink, J.F.; Wang, P. Retrieval and validation of global, direct, and diffuse irradiance derived
from SEVIRI satellite observations. J. Geophys. Res. (Atmos.) 2013, 118, 2340–2361.
32. Ridley, B.; Boland, J.; Lauret, P. Modeling of diffuse solar fraction with multiple predictors. Renew. Energy
2010, 35, 478–483.
33. Huang, G.; Li, Z.; Li, X.; Liang, S.; Yang, K.; Wang, D.; Zhang, Y. Estimating surface solar irradiance from
satellites: Past, present, and future perspectives. Remote Sens. Environ. 2019, 233, 111371.
34. Wild, M. Global dimming and brightening: A review. J. Geophys. Res. 2009, 114, D00D16.
35. Sanchez-Lorenzo, A.; Enriquez-Alonso, A.; Wild, M.; Trentmann, J.; Vicente-Serrano, S.M.;
Sanchez-Romero, A.; Posselt, R.; Hakuba, M.Z. Trends in downward surface solar radiation from satellites
and ground observations over europe during 1983–2010. Remote Sens. Environ. 2017, 189, 108–117.
36. Zhang, X.; Lu, N.; Jiang, H.; Yao, L. Evaluation of reanalysis surface incident solar radiation data in China.
Sci. Rep. 2020, 10, 3494.
37. Shi, G.-Y.; Hayasaka, T.; Ohmura, A.; Chen, Z.-H.; Wang, B.; Zhao, J.-Q.; Che, H.; Xu, L. Data quality
assessment and the long-term trend of ground solar radiation in China. J. Appl. Meteorol. Climatol. 2007, 47,
13319–13337.You can also read