Review article: Earth's ice imbalance - The Cryosphere
←
→
Page content transcription
If your browser does not render page correctly, please read the page content below
The Cryosphere, 15, 233–246, 2021
https://doi.org/10.5194/tc-15-233-2021
© Author(s) 2021. This work is distributed under
the Creative Commons Attribution 4.0 License.

Review article: Earth’s ice imbalance
Thomas Slater1 , Isobel R. Lawrence1 , Inès N. Otosaka1 , Andrew Shepherd1 , Noel Gourmelen2 , Livia Jakob3 ,
Paul Tepes2 , Lin Gilbert4 , and Peter Nienow2
1 Centrefor Polar Observation and Modelling, School of Earth and Environment, University of Leeds, Leeds, LS2 9JT, UK
2 School of GeoSciences, University of Edinburgh, Edinburgh, EH8 9XP, UK
3 EarthWave Ltd, Edinburgh, EH9 3HJ, UK
4 Mullard Space Science Laboratory, Department of Space and Climate Physics,

University College London, London, WC1E 6BT, UK

Correspondence: Thomas Slater (t.slater1@leeds.ac.uk)

Received: 12 August 2020 – Discussion started: 14 August 2020
Revised: 18 November 2020 – Accepted: 18 November 2020 – Published: 25 January 2021

Abstract. We combine satellite observations and numerical        Zemp et al., 2019a), oceanic conditions (Rahmstorf et al.,
models to show that Earth lost 28 trillion tonnes of ice be-     2015), atmospheric circulation (Francis and Vavrus, 2012;
tween 1994 and 2017. Arctic sea ice (7.6 trillion tonnes),       Vellinga and Wood, 2002) and freshwater resources (Huss
Antarctic ice shelves (6.5 trillion tonnes), mountain glaciers   and Hock, 2018; Immerzeel et al., 2020). Earth’s cryosphere
(6.1 trillion tonnes), the Greenland ice sheet (3.8 trillion     is created as meteoric ice in Antarctica, Greenland and in
tonnes), the Antarctic ice sheet (2.5 trillion tonnes), and      mountain glaciers and as frozen seawater in the Arctic and
Southern Ocean sea ice (0.9 trillion tonnes) have all de-        Southern oceans (Fig. 1). The polar ice sheets store more
creased in mass. Just over half (58 %) of the ice loss was       than 99 % (30 million km3 ) of Earth’s freshwater ice on land
from the Northern Hemisphere, and the remainder (42 %)           (Fretwell et al., 2013; Morlighem et al., 2017), and even
was from the Southern Hemisphere. The rate of ice loss           modest losses raise the global sea level (The IMBIE Team,
has risen by 57 % since the 1990s – from 0.8 to 1.2 tril-        2018, 2020), increase coastal flooding (Vitousek et al., 2017)
lion tonnes per year – owing to increased losses from moun-      and disturb oceanic currents (Golledge et al., 2019). To date,
tain glaciers, Antarctica, Greenland and from Antarctic ice      these losses have tracked the upper range of climate warm-
shelves. During the same period, the loss of grounded ice        ing scenarios forecast by the Intergovernmental Panel on Cli-
from the Antarctic and Greenland ice sheets and mountain         mate Change, which predict an ice sheet sea level contribu-
glaciers raised the global sea level by 34.6 ± 3.1 mm. The       tion of up to 42 cm by 2100 (Slater et al., 2020). Ice sheet
majority of all ice losses were driven by atmospheric melting    mass balance is the net balance between mass losses associ-
(68 % from Arctic sea ice, mountain glaciers ice shelf calv-     ated with ice flow, melting at the ice–ocean interface, sub-
ing and ice sheet surface mass balance), with the remaining      glacial melt and the surface mass balance (the net difference
losses (32 % from ice sheet discharge and ice shelf thinning)    between precipitation, sublimation, evaporation, wind ero-
being driven by oceanic melting. Altogether, these elements      sion and meltwater runoff). Ice shelves are a major source
of the cryosphere have taken up 3.2 % of the global energy       of ocean fresh water (Jacobs et al., 1992); impart resistive
imbalance.                                                       forces on grounded ice upstream (buttressing), which would
                                                                 speed up in its absence (Weertman, 1974); and have been
                                                                 a persistent element of the climate system throughout the
                                                                 Holocene period (Domack et al., 2005). There are over 300
1   Introduction                                                 documented ice shelves (the vast majority of Earth’s inven-
                                                                 tory) around Antarctica (SCAR, 2020; Shepherd et al., 2018),
Fluctuations in Earth’s ice cover have been driven by changes    containing an estimated 380 thousand km3 of ice (Fretwell et
in the planetary radiative forcing (Vaughan et al., 2013),       al., 2013), and fluctuations in their volume occur as a result
affecting global sea level (The IMBIE Team, 2018, 2020;

Published by Copernicus Publications on behalf of the European Geosciences Union.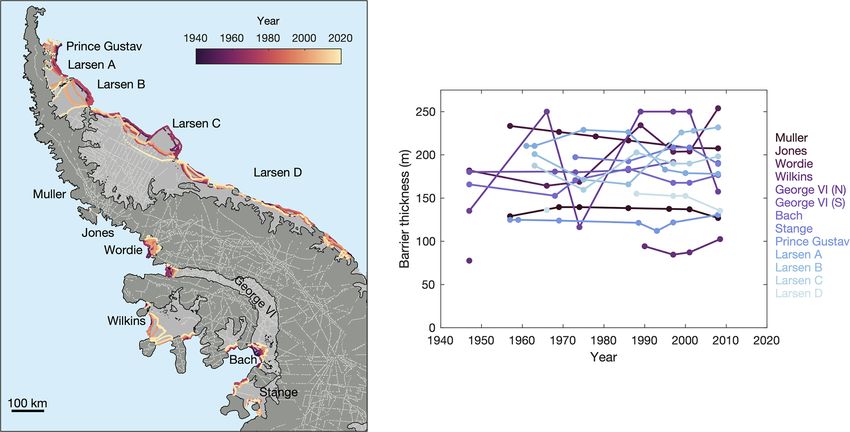
234 T. Slater et al.: Review article: Earth’s ice imbalance
of changes in their extent (Cook and Vaughan, 2010) and 2 Mountain glaciers
thickness (Adusumilli et al., 2020a). Although ice shelves
are much smaller and sparsely distributed across the Arctic, We combined eight estimates of mass change from an ex-
ice shelves fringing the northern coast of Ellesmere Island trapolation of local glaciological and geodetic measurements
in Canada (Mortimer et al., 2012) and the Russian Arctic is- (Zemp et al., 2019a, 2020), satellite gravimetry (Wouters
lands (Willis et al., 2015) have collapsed in recent decades. et al., 2019), satellite swath altimetry (Foresta et al., 2016;
Mountain glacier ice moderates global sea level and regional Jakob et al., 2020; Tepes et al., 2021), satellite differential
hydrology (Huss and Hock, 2018), impacting local commu- synthetic aperture radar interferometry (DInSAR) (Braun et
nities who rely on it as a source of fresh water (Immerzeel al., 2019), and satellite optical stereo images (Dussaillant
et al., 2020). There are over 215 thousand glaciers world- et al., 2019b; Shean et al., 2020) to produce a reconciled
wide (RGI Consortium, 2017) containing 160 thousand km3 estimate of global glacier mass changes between 1962 and
of ice (Farinotti et al., 2019), and their retreat has accounted 2019 and over 19 glacier regions defined in the Randolph
for 21 % of global sea level rise between 1993 and 2017 Glacier Inventory (RGI Consortium, 2017) (Fig. 2). Satellite
(WCRP Global Sea Level Budget Group, 2018). Typically gravimetry directly measures glacier mass change from fluc-
15 to 25 million km2 of the global ocean surface is covered tuations in Earth’s gravitational field at monthly intervals and
in sea ice at any one time of year, though its thickness and ex- as a result does not require knowledge of the density of the
tent vary seasonally and due to long-term changes in Earth’s material lost or gained (Wouters et al., 2019). However, satel-
climate (Maksym, 2019). Sea ice plays a key role in the fresh- lite gravimetry provides measurements at a spatial resolution
water and energy budgets of the polar regions, impacts the on the order of hundreds of kilometres, which limits the inter-
marine ecosystem (Stroeve and Notz, 2018), and regulates pretation of the spatial distribution of ice loss within individ-
the absorption of solar radiation in summer (Pistone et al., ual glaciers. Satellite swath altimetry, DInSAR and optical
2014). Furthermore, sea ice loss could influence oceanic and stereo imagery all measure surface elevation change, which
atmospheric circulation and affect weather patterns in the is converted to mass by assuming a fixed density of ice with
mid-latitudes (Maksym, 2019; Vihma, 2014). an associated uncertainty of 60 kg m−3 (Huss, 2013). The in-
Although sparse in situ records of glacier mass balance cluded satellite swath altimetry estimates follow the method
date back to the 1890s (Zemp et al., 2015), substantial of Foresta et al. (2016), which uses the swath interferometric
records of change for other components of the cryosphere mode of CryoSat-2 to provide a dense grid of repeated ele-
did not begin until the advent of satellite observations in vation measurements (Foresta et al., 2016). CryoSat-2 swath
the 1970s. Ice shelf extent has been recorded episodically in altimetry provides up to 2 orders of magnitude more data
satellite imagery since the 1940s (Cook and Vaughan, 2010); than conventional altimetry processing, as well as homo-
sea ice extent has been monitored by satellites since the late geneous spatial coverage necessary to derive mass changes
1970s (Cavalieri et al., 1999); and ice sheet, ice shelf, sea over relatively small glaciers with highly variable topography
ice and glacier thickness changes have been recorded sys- (Gourmelen et al., 2018; Jakob et al., 2020). The included
tematically in satellite altimetry since the 1990s (Gardner DInSAR estimate measures surface elevation changes by dif-
et al., 2013; Laxon et al., 2013; Shepherd et al., 2010; The ferencing digital elevation models (DEMs) generated from
IMBIE Team, 2018, 2020). Here, we combine satellite ob- the SRTM and TanDEM-X synthetic aperture radar missions
servations of changing ice sheet, ice shelf, glacier, and Arc- (Braun et al., 2019). It is important to note that, for both satel-
tic sea ice mass, with in situ and model-based estimates of lite radar altimetry and DInSAR, the radar signal can pene-
glacier and Southern Ocean sea ice mass, to quantify trends trate beyond the glacier surface into snow and firn (Braun et
in Earth’s meteoric and oceanic ice. We do not include ele- al., 2019; Jakob et al., 2020); the impact of radar penetra-
ments of the cryosphere that are not ice (i.e. snow on land tion on elevation measurements is difficult to quantify as it
and permafrost) or where knowledge of their global extent depends on spatio-temporal variations in snow and firn char-
and change is limited (river and lake ice). However, these el- acteristics and is an area of ongoing research. We also in-
ements of the cryosphere have also experienced considerable clude estimates of glacier mass balance derived from satel-
change over recent decades: for example, it is estimated that lite optical stereo imagery, which generates time series of
the quantity of snow on land has decreased by 49 ± 49 Gt per high-resolution DEMs from ASTER, WorldView-1/2/3 and
decade in the Northern Hemisphere since 1980 (Pulliainen GeoEye-1 satellite imagery (Dussaillant et al., 2019b; Shean
et al., 2020), that permafrost (perennially frozen ground) has et al., 2020). In glacier regions where these estimates are
warmed globally by 0.29 ± 0.12 ◦ C during the past decade available (High Mountain Asia, Southern Andes), they offer
(Biskaborn et al., 2019), and that the duration of river and almost complete coverage of glaciated areas at high (metre-
lake ice cover has shortened by 12 d per century in the North- scale) resolution which can resolve changes within individ-
ern Hemisphere over the last 200 years (Magnuson et al., ual glaciers. However, optical imagery is weather-dependent,
2000). and cloud cover can limit coverage in glacier regions. For
each region we aggregated annual mass change rates deter-
mined from the techniques available: each region includes
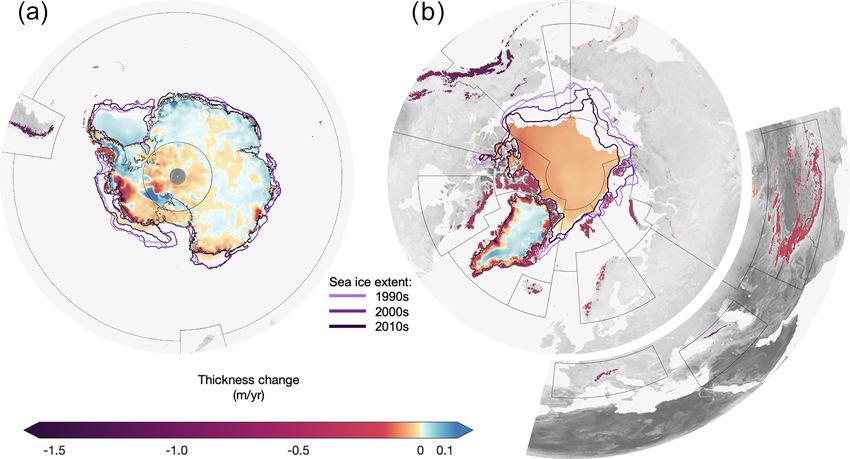
The Cryosphere, 15, 233–246, 2021 https://doi.org/10.5194/tc-15-233-2021T. Slater et al.: Review article: Earth’s ice imbalance 235 Figure 1. Average rate of ice thickness change in the (a) Southern Hemisphere and (b) Northern Hemisphere. Changes in Antarctic (1992– 2017) and Greenland ice sheet (1992–2018) thickness were estimated using repeat satellite altimetry following the methods of Shepherd et al. (2019). Sea ice thickness trends between 1990 and 2019 are determined from numerical sea ice and ocean modelling (Zhang and Rothrock, 2003), as well as the average minimum of sea ice extent in February (Antarctic) and September (Arctic) (purple lines) for each decade during the same period. Glacier thickness change between 1992 and 2018 for glacier regions defined in the Randolph Glacier Inventory (RGI Consortium, 2017) (black boundaries) are from mass change estimates (Braun et al., 2019; Foresta et al., 2016; Jakob et al., 2020; Tepes et al., 2021; Wouters et al., 2019; Zemp et al., 2019b) which have been converted to a thickness change assuming an ice density of 850 kg m−3 . The black circle at the south pole indicates the southern limit of the orbit of ERS and ENVISAT satellite altimeters, which were in operation between 1992 and 2010. The area between 81.5 and 88◦ S has been covered by CryoSat-2, which launched in 2010. between 2 and 4 estimates except for glaciers peripheral lost −9975 ± 1667 Gt of ice between 1962 and 2019, raising to Antarctica and Greenland, where only estimates derived the global mean sea level by 27.7 ± 4.6 mm during this pe- from the extrapolation of in situ and geodetic data are avail- riod. Glaciers peripheral to Greenland and in Alaska and the able. For studies in which time-varying mass change rates Southern Andes have experienced the largest losses (Fig. 2) are not available, we assume the mass change rate to be lin- – 5694 ± 635 Gt between 1962 and 2019 – and account for ear over the period considered and scale the uncertainty by more than half (57 %) of the global glacier mass loss over this the square root of the number of years. We computed the period. Globally, the rate of glacier mass loss has increased cumulative mass change as the integral of the aggregated from −120 ± 70 Gt yr−1 in the 1970s to −327 ± 65 Gt yr−1 mass change rates and accumulated the associated uncer- between 2010 and 2019, peaking at −506 ± 192 Gt yr−1 in tainty over time as the root sum square of the annual er- 2018. Glacier mass loss is linked to increasing air tempera- rors. We summed the regional estimates to derive the global tures; approximately 70 % of the global glacier mass loss has glacier mass change and the overall uncertainty as the root been attributed to anthropogenic forcing, and the remainder mean square of the regional errors. is due to natural climate variability (Marzeion et al., 2014). We assessed the consistency of the in situ and satel- lite gravimetry, altimetry and stereo imagery estimates be- tween 2010 and 2015 in seven regions (Arctic Canada 3 Ice sheets North and South, Russian Arctic, Iceland, Svalbard and Jan Mayen, High Mountain Asia and Southern Andes) where Ice sheets lose mass when ice discharge and melting at the measurements from all techniques overlap (Fig. 2). We surface and ice–ocean interface combined exceed snowfall. record the largest difference (26 Gt yr−1 ) and standard de- We use estimates of ice sheet mass balance and their uncer- viation (14 Gt yr−1 ) between mass balance estimates in Arc- tainty derived from an ensemble of satellite altimetry, satel- tic Canada North – the largest region included in our inter- lite gravimetry and input–output datasets which span the pe- comparison. The standard deviations of the mass change es- riod 1992–2018. For the Antarctic (24 datasets) (The IMBIE timates are 9, 8, 6, 5, 2 and 2 Gt yr−1 for the Southern Andes, Team, 2018) and Greenland (26 datasets) (The IMBIE Team, Russian Arctic, High Mountain Asia, Arctic Canada South, 2020) ice sheets, independently derived estimates of mass Iceland, and Svalbard and Jan Mayen regions, respectively. change from the three satellite geodetic techniques were Based on our reconciled estimate, glaciers have collectively combined into a single estimate of ice sheet mass balance. https://doi.org/10.5194/tc-15-233-2021 The Cryosphere, 15, 233–246, 2021
236                                                                             T. Slater et al.: Review article: Earth’s ice imbalance

Figure 2. (a) Cumulative mass change for glacier regions (Gt) between 1962 and 2019. Outlines of the glacier regions (RGI 6.0) are marked
by black lines and glacierized areas are indicated in orange: ACN, Arctic Canada North (area 105 110 km2 ); ACS, Arctic Canada South
(40 888 km2 ); ALA, Alaska (86 725 km2 ); ANT, Antarctic and subantarctic (132 867 km2 ); CAU, Caucasus and Middle East (1307 km2 );
CEU, Central Europe (2092 km2 ); GRL, Greenland (89 717 km2 ); HMA, High Mountain Asia (97 606 km2 ); ISL, Iceland (11 059 km2 );
NZL, New Zealand (1161 km2 ); RUA, Russian Arctic (51 591 km2 ); SAN, Southern Andes (29 429 km2 ); SCA, Scandinavia (2949 km2 );
SJM, Svalbard and Jan Mayen (33 958 km2 ); TRP, low latitudes (2341 km2 ); WNA, Western Canada and USA (14 524 km2 ). (b) Glacier
rate of mass change (Gt yr−1 ) in regions where estimates from different techniques are available, including satellite altimetry (Foresta et al.,
2016; Jakob et al., 2020; Tepes et al., 2021), extrapolation of in situ glaciological and geodetic data (Zemp et al., 2019b, 2020), satellite
gravimetry (Wouters et al., 2019), satellite InSAR (Braun et al., 2019), and satellite stereo imagery (Dussaillant et al., 2019b; Shean et al.,
2020) over the period 2010–2015. The reconciled estimate (calculated as the average of the estimates available in a given region and year) is
shown in grey.

The Cryosphere, 15, 233–246, 2021                                                                 https://doi.org/10.5194/tc-15-233-2021
T. Slater et al.: Review article: Earth’s ice imbalance                                                                       237

Estimates of ice sheet mass balance derived from these meth-      (Adusumilli et al., 2020a). We restrict this calculation to ice
ods at the continental scale are similar and can be collated      shelves at the Antarctic Peninsula, where a record of progres-
to reduce uncertainty (The IMBIE Team, 2018, 2020): satel-        sive retreat has been well established (Fig. 3). Although area
lite altimetry directly measures changes in ice sheet height      changes have been mapped since the late 1940s, compre-
(Otosaka et al., 2019; Sandberg Sørensen et al., 2018) con-       hensive estimates of their thickness only began in the early
verted into mass by assigning a specific density to the volume    1990s. To estimate the thickness of icebergs calved prior
change (Shepherd et al., 2019) or by explicitly accounting        to this period, we combined in situ, airborne and satellite-
for snowfall fluctuations through firn modelling (Sørensen        derived measurements of ice thickness recorded prior to
et al., 2011). Satellite gravimetry measures temporal varia-      when the ice shelf calving took place (Fig. 3). Uncertain-
tions in Earth’s gravity field using spherical harmonic so-       ties in volume change associated with ice shelf retreat were
lutions (Velicogna et al., 2020) or through local mass con-       computed as the product of errors in ice thickness, deter-
centration analysis (Luthcke et al., 2006). The input–output      mined from the variance of the thickness data, and extent,
method removes ice discharge into the oceans (output), es-        determined from the precision of the satellite imagery (Cook
timated from satellite observations of ice velocity and es-       and Vaughan, 2010). We then used satellite altimetry to de-
timates of ice thickness, from the net snow accumulation          termine the volume changes of Antarctic ice shelves ow-
(input) (Mouginot et al., 2019; Rignot et al., 2019) deter-       ing to changes in their thickness and their associated un-
mined from regional climate modelling (Noël et al., 2018;         certainty. For this calculation, we use time series of ice
van Wessem et al., 2018).                                         thickness change and their estimated uncertainty derived by
   These satellite surveys (e.g. Fig. 1) show the Antarctic       Adusumilli et al. (2020a) from ERS-1, ERS-2, Envisat and
ice sheet lost 2603 ± 563 Gt of ice between 1992 and 2017,        CryoSat-2 satellite radar altimetry between 1994 and 2020,
and the Greenland ice sheet lost 3902 ± 342 Gt of ice be-         following the method of Paolo et al. (2015). Adusumilli et
tween 1992 and 2018. Since 2012, the rate of ice loss from        al. (2020a) applied the following processing steps: (i) ice
Antarctica has tripled when compared to the previous two          shelf surface elevation was computed by adjusting the al-
decades, owing to widespread glacier speed-up (Mouginot et        timeter range measurements for changes in ocean surface
al., 2014) and thinning (Shepherd et al., 2019) in the Amund-     height, including contributions due to the geoid, mean dy-
sen and Bellingshausen Sea sectors in response to the circu-      namic topography, ocean tide, ocean load tide, atmospheric
lation of warm water under the region’s ice shelves (Jacobs       pressure, and sea level rise; (ii) time series of ice shelf ele-
et al., 2011). Ice shelf collapse (Cook and Vaughan, 2010)        vation change were produced by grouping the elevation mea-
(Fig. 3) and thinning at the Antarctic Peninsula has triggered    surements within regularly spaced 10 km grid cells, applying
speed-up of glaciers upstream (Hogg et al., 2017) as a conse-     a space–time polynomial fit to data from each mission; (iii)
quence of reduced ice shelf buttressing. Unlike in Antarctica,    time series of ice shelf thickness change were calculated by
where almost all of the ice loss is associated with ice dynami-   adjusting the elevation change for fluctuations in firn air con-
cal imbalance, just over half of Greenland’s mass loss during     tent and using a hydrostatic buoyancy relationship, assuming
this period arose due to increases in meltwater runoff (En-       values of 917 and 1028 kg m−3 for the densities of ice and
derlin et al., 2014) enhanced by atmospheric circulation dur-     ocean water, respectively; and (iv) time series of ice shelf
ing several warm summers (Bevis et al., 2019). The remain-        volume change were computed from the thickness changes
ing ice loss was due to increased glacier discharge, primar-      and using the minimum (fixed) area for each ice shelf. Full
ily at Jakobshavn Isbræ (Holland et al., 2008) and at outlet      details of the methods used in this calculation can be found
glaciers in the southeast (Howat et al., 2008) and northwest      in Paolo et al. (2015). The total change in ice shelf volume is
(Moon et al., 2012). Both ice dynamic and surface processes       computed as the sum of changes due to thinning and retreat,
in Greenland have led to widespread thinning at the ice sheet     and the uncertainty is estimated as the root sum square of the
margins and within individual glacier catchments (McMil-          respective uncertainties.
lan et al., 2016) (Fig. 1). Altogether, ice losses from Antarc-      Antarctic ice shelves have lost 8667 ± 1240 Gt of their
tica and Greenland have caused global sea levels to rise by       mass between 1994 and 2020, 54 % of which has been due to
17.8 ± 1.8 mm between 1992 and 2017 (The IMBIE Team,              reductions in their extent and the remainder due to changes
2018, 2020).                                                      in their thickness. Although episodic iceberg calving is part
                                                                  of the natural cycle of ice mass transport through the con-
                                                                  tinent, there has been a 39 717 km2 loss of ice shelf area
4   Antarctic ice shelves                                         at the Antarctic Peninsula (e.g. Cook and Vaughan, 2010),
                                                                  where air temperatures have risen several times faster than
To compute trends in the volume of Antarctic ice shelves as-      the global trend (Vaughan et al., 2003). Warmer air leads
sociated with changes in their extent, we combined satellite-     to increased surface melting, which can promote iceberg
based records of their thickness (Fretwell et al., 2013) and      calving through hydraulic fracture of crevasses (Scambos
area change (Cook and Vaughan, 2010) over time, adjusted          et al., 2013). At the same time, ocean-driven melting has
for changes in thickness where they have been recorded            caused some ice shelves to thin at their base, particularly in

https://doi.org/10.5194/tc-15-233-2021                                                    The Cryosphere, 15, 233–246, 2021
238 T. Slater et al.: Review article: Earth’s ice imbalance
Figure 3. Change in Antarctic ice shelf barrier position (left) and thickness (right) over time. Barrier positions are derived from episodic
satellite imagery (Cook and Vaughan, 2010), and barrier thicknesses are derived from airborne ice penetrating radar (light grey lines) and
satellite radar altimetry (Fretwell et al., 2013). Iceberg calving is calculated as the difference in area between successive barrier positions.
the Amundsen and Bellingshausen seas (Paolo et al., 2015; timates back to mass using this same density, as opposed
Shepherd et al., 2010) where warm circumpolar deep water is to one that varies according to season or ice type. We di-
present (Jacobs et al., 1996) but also at the Antarctic Penin- vided CryoSat-2 monthly volume estimates into regions of
sula (Shepherd et al., 2003). Ice shelf thinning can promote multi-year and first-year ice and multiplied by densities of
instability by weakening their lateral margins (Vieli et al., 882 and 916.7 kg m−3 , respectively, to convert to mass (Till-
2007). Both processes – calving front retreat and basal melt- ing et al., 2018). The presence of melt ponds on the Arctic
ing – have triggered speed-up of inland ice (Rignot et al., sea ice surface from May to September makes it difficult to
2004; Scambos et al., 2004; Shepherd et al., 2004) due to discriminate between radar returns from leads and sea ice
the associated reduction in buttressing (Joughin et al., 2012), floes, preventing the retrieval of summer sea ice thickness
leading to global sea level rise (The IMBIE Team, 2018) and volume from radar altimetry (Tilling et al., 2018). As a
even though ice shelves themselves are not a direct source result, we computed the winter-mean (October to April) mass
of ocean mass. The ice shelf losses combined amount to 3 % trend across the Arctic for both CryoSat-2 and PIOMAS
of their present volume, while those in the Amundsen and estimates to maintain consistency: the difference between
Bellingshausen seas are now 10 % to 18 % thinner (Paolo winter (October–April) and annual (January–December) PI-
et al., 2015) and those at the Antarctic Peninsula are 18 % OMAS mass trends during 1980–2011 is 19 Gt yr−1 (6 %)
smaller in extent (Cook and Vaughan, 2010). smaller when compared to the magnitude of the overall
12-month trend (−324 Gt yr−1 ). Since the annual trend is
slightly larger, we consider our winter-average mass trend to
5 Sea ice be a conservative estimate of the actual Arctic sea ice mass
loss. In the absence of an available satellite-derived Antarc-
We estimated trends in the mass of Arctic sea ice using a
tic sea ice volume product, we used the Global Ice-Ocean
combination of sea-ice–ocean modelling and satellite mea-
Modeling and Assimilation System (GIOMAS) (Zhang and
surements of thickness change: between 1980 and 2011 we
Rothrock, 2003), the global equivalent to PIOMAS, to esti-
used the Pan-Arctic Ice-Ocean Modelling and Assimilation
mate the trend. We gridded GIOMAS sea ice thickness data
System (PIOMAS), a coupled sea-ice–ocean model forced
onto 0.2 ◦ ×0.5 ◦ grids, multiplied by cell area to retrieve total
with atmospheric reanalyses (Zhang and Rothrock, 2003);
volume and used a density of 917 kg m−3 to convert to mass
from 2011, we used CryoSat-2 satellite radar altimetry mea-
(as in PIOMAS, this is the density used to attribute a volume
surements of sea ice volume (Tilling et al., 2018). We con-
to the simulated sea ice growth in GIOMAS (Jinlun Zhang,
verted PIOMAS volume estimates to mass assuming a fixed
personal communication, 2020)). Antarctic sea ice trends
density of 917 kg m−3 : this is the density used in the PI-
were computed as annual averages between January and De-
OMAS model to attribute a volume to the simulated sea ice
cember. The uncertainties in PIOMAS volume for October
growth (Axel Schweiger, personal communication, 2020);
and March are 1350 and 2250 km3 , respectively, estimated
therefore, it is appropriate to convert PIOMAS volume es-
The Cryosphere, 15, 233–246, 2021 https://doi.org/10.5194/tc-15-233-2021T. Slater et al.: Review article: Earth’s ice imbalance 239
in Schweiger et al. (2011) using a range of methods, includ-
ing comparison to in situ data and model sensitivity analyses.
We take the average of these (1800 km3 ) as the uncertainty
for all months, and, in the absence of a formal error budget,
we assign the same uncertainty to monthly GIOMAS esti-
mates. We convert this monthly volume error of 1800 km3 to
a mass error using the fixed PIOMAS/GIOMAS density of
917 kg m−3 . We estimated the uncertainty on monthly Arc-
tic sea ice volume and mass from CryoSat-2 as a percentage
uncertainty, which varies from 14.5 % volume in October to
13 % volume in April (Tilling et al., 2018). The uncertainty
Figure 4. Global ice mass change between 1994 and 2017 par-
on the winter-average (Arctic) and annual-average (Antarc-
titioned into the different floating (blues) and grounded (purples)
tic) mass was propagated from the monthly uncertainties. Fi- components. Shaded bars indicate the cumulative mass change and
nally, we estimated the uncertainty associated with a rate of estimated uncertainty for each individual ice component (blues, pur-
mass change over a given time period by dividing the total ples) and their sum (black). The equivalent sea level contribution
error by the number of years. due to the loss of grounded ice from Antarctica, Greenland and
Between the winters of 1980 (October 1979 to April 1980) mountain glaciers is shown in the y axis on the right-hand side.
and 2019 (October 2018 to April 2019), Arctic sea ice mass
reduced by 230 ± 27 Gt yr−1 , predominantly due to a decline
in the lateral extent of the ice cover (Fig. 1), which accounts square of the individual uncertainty estimates. Between 1994
for 93 % of the variance in volume over the entire PIOMAS and 2017, the Earth lost 27.5 ± 2.1 Tt of ice (Fig. 4) – at an
record. The entire summer ice pack has thinned, which is average rate of 1.2 ± 0.1 Tt per year (Table 1). Ice losses
largely attributable to the loss of the oldest and thickest ice, have been larger in the Northern Hemisphere, primarily ow-
and sea ice cover has receded in the Beaufort, Chukchi and ing to declining Arctic sea ice (−7559 ± 1021 Gt) followed
East Siberian seas (Stroeve and Notz, 2018). Arctic sea ice by glacier retreat (−5148 ± 564 Gt) and Greenland ice sheet
loss has been attributed to atmospheric warming driven by melt (−3821 ± 323 Gt). Ice in the Southern Hemisphere
anthropogenic CO2 emissions (Meredith et al., 2019; Stroeve from the ice shelves (−6543 ± 1221 Gt), the Antarctic ice
and Notz, 2018), which has been enhanced in the Arctic sheet (−2545 ± 554 Gt), glaciers (−965 ± 729 Gt), and sea
when compared to the mid-latitudes likely due to sea ice loss ice in the Southern Ocean (−924 ± 674 Gt) has been lost at a
itself (Dai et al., 2019; Screen and Simmonds, 2010). Be- total rate of −477 ± 146 Gt yr−1 , which is 34 % slower than
tween 1980 and 2019, GIOMAS volume estimates, which in the Northern Hemisphere (−719 ± 207 Gt yr−1 ). Earth’s
incorporate observations of sea ice extent, show an increase ice can be categorized into its floating and on-land compo-
in Antarctic sea ice of +43 ± 17 Gt yr−1 . No consensus has nents; grounded ice loss from ice sheets and glaciers raises
been reached on whether trends in Antarctic sea ice cover the global sea level (The IMBIE Team, 2018, 2020; Zemp
are anthropogenically driven, for example via the depletion et al., 2019a) and influences oceanic circulation through
of the ozone layer (Ferreira et al., 2015), or the result of freshwater input (Rahmstorf et al., 2015), and glacier re-
natural climate variability (Meehl et al., 2016; Zhang et al., treat impacts local communities who rely on glaciers as a
2019). Given the vastness of the continent it surrounds, re- freshwater resource (Immerzeel et al., 2020). Grounded ice
gional analyses of Southern Ocean sea ice are essential to losses have raised the global mean sea level by 24.9 ± 1.8
understand the processes driving it. The overall trend is a and 9.7 ± 2.5 mm in the Northern Hemisphere and South-
combination of sea ice thickening in the Weddell Sea and ern Hemisphere respectively, totalling 34.6 ± 3.1 mm over
thinning in the Amundsen Sea (Fig. 1), accompanied by in- the 24-year period. Although the loss of floating sea ice and
creases and reductions of the extent in each region, respec- ice shelves does not contribute to global sea level rise, sea ice
tively (Parkinson, 2019). In general, global climate models decline increases habitat loss (Rode et al., 2014), coastal ero-
predict a shrinking southern ice cap in response to climate sion (Overeem et al., 2011), and ocean circulation (Armitage
change; projections from the latest coupled climate models et al., 2020) and may affect mid-latitude weather and climate
suggest that Antarctic sea ice will decline during the 21st (Blackport et al., 2019; Overland et al., 2016).
century (Roach et al., 2020). There is now widespread evidence that climate change has
caused reductions in Earth’s ice. On average, the planetary
surface temperature has risen by 0.85 ◦ C since 1880, and this
6 Earth’s ice imbalance signal has been amplified in the polar regions (Hartmann et
al., 2013). Although this warming has led to higher snowfall
To determine the global ice imbalance, we summed the mass in winter, it has also driven larger increases in summertime
change of each ice component computed at annual inter- surface melting (Huss and Hock, 2018). The global oceans
vals and estimated the combined uncertainty as the root sum have warmed too (Hartmann et al., 2013), with significant
https://doi.org/10.5194/tc-15-233-2021 The Cryosphere, 15, 233–246, 2021240 T. Slater et al.: Review article: Earth’s ice imbalance
Table 1. Average mass change rates (Gt yr−1 ) of the different global ice components, total floating ice, total grounded ice and global total
per decade and over the common period 1994–2017.
1980s 1990s* 2000s 2010s** 1994–2017
Arctic sea ice −156 ± 88 −298 ± 88 −360 ± 88 −94 ± 119 −329 ± 44
Antarctic sea ice +196 ± 67 −27 ± 67 +71 ± 67 −83 ± 75 −40 ± 29
Ice shelf calving −140 ± 15 −125 ± 25 −176 ± 57 −250 ± 68 −155 ± 36
Ice shelf thinning – −19 ± 52 −233 ± 57 −53 ± 71 −129 ± 39
Total floating ice − −469 ± 125 −698 ± 137 −480 ± 172 −653 ± 75
Antarctic – −55 ± 38 −78 ± 37 −206 ± 47 −111 ± 24
Greenland – −34 ± 24 −166 ± 21 −247 ± 23 −166 ± 14
Glaciers −62 ± 66 −206 ± 63 −252 ± 60 −327 ± 65 −266 ± 41
Total grounded ice − −296 ± 77 −495 ± 74 −779 ± 83 −543 ± 49
Total – −764 ± 147 −1193 ± 156 −1259 ± 191 −1196 ± 90
* 1990s: the decade is not entirely surveyed but starts from 1994 for ice shelf thinning, from 1993 for Antarctica and from 1992
for Greenland.
* 2010s: the decade is not entirely surveyed but covers up to 2016 for the Antarctic ice sheet; up to 2017 for Greenland; and up to
2019 for sea ice, glaciers and ice shelf calving.
impacts on tidewater glaciers (Hogg et al., 2017; Holland
et al., 2008), on floating ice shelves (Shepherd et al., 2010)
and on the ice streams which have relied on their buttressing E = M(L + cp 1T ), (1)
(Rignot et al., 2004). Atmospheric warming – anthropogenic
where M is the mass of ice, 1T is the rise in tem-
or otherwise – is responsible for the recent and long-term
perature required (we assume an initial ice temperature
reductions in mountain glacier ice (Marzeion et al., 2014),
of −20 ± 10 ◦ C), L is the latent heat of fusion for wa-
and ocean-driven melting of outlet glaciers has caused the
ter (333 J g−1 ) and cp is the specific heat capacity of wa-
vast majority of the observed ice losses from Antarctica (The
ter (2108 J kg−1 ◦ C−1 ). Although the initial temperature is
IMBIE Team, 2018). Elsewhere, the picture is more com-
poorly constrained, the fractional energy required for warm-
plicated. In Greenland, for example, roughly half of all ice
ing is a small (0.7 % ◦ C−1 ) percentage of the total energy
losses are associated with trends in surface mass balance,
imbalance. Altogether, the ice sheet, glacier, ice shelf and
and the remainder is due to accelerated ice flow triggered by
sea ice loss amounts to an 8.9 ± 0.9 × 10²¹ J sink of energy,
ocean melting at glacier termini (The IMBIE Team, 2020).
or 3.2 ± 0.3 % of the global imbalance over the same period
Although the retreat and collapse of ice shelves at the Antarc-
(von Schuckmann et al., 2020).
tic Peninsula has occurred in tandem with a rapid regional
atmospheric warming (Vaughan et al., 2003), warm circum-
polar deep water has melted the base of ice shelves in the 7 Conclusions
Amundsen and Bellingshausen seas (Jacobs et al., 2011), and
this now amounts to over half of their net loss. While the Even though Earth’s cryosphere has absorbed only a small
progressive retreat of Arctic sea ice has been driven by radia- fraction of the global energy imbalance, it has lost a stag-
tive forcing, this has been mediated in part by the increasing gering 28 trillion tonnes of ice between 1994 and 2017. The
presence of open water (Perovich and Richter-Menge, 2009), loss of grounded ice during this period has caused sea lev-
and broader changes in oceanic conditions are expected to els to rise by 34.6 ± 3.1 mm, and the loss of floating ice has
play an increasingly important role (Carmack et al., 2016). caused reductions in the planetary albedo (Thackeray and
Finally, although the extent of Southern Ocean sea ice has Hall, 2019), reductions in the buttressing of grounded ice
shown little overall change, there have been considerable re- (Rignot et al., 2004), ocean freshening (Jacobs et al., 1996)
gional variations owing to changes in both atmospheric and and ocean cooling (Bintanja et al., 2013). Our assessment is
oceanic forcing (Hobbs et al., 2016). Attributing Arctic sea based primarily on observations; we use satellite measure-
ice decline and ice shelf calving to increased radiative forc- ments to determine Antarctic and Greenland ice sheet mass
ing, approximately 68 % of the recent global ice imbalance balance and to determine changes in the mass of Antarc-
is due to atmospheric warming, and the remainder is due to tic ice shelves associated with retreat and thinning, we use
ocean-driven melting. We determine the energy required to a combination of satellite observations and in situ measure-
melt the total ice loss as ments to determine changes in the mass of mountain glaciers,
and we use a combination of numerical models and satel-
The Cryosphere, 15, 233–246, 2021 https://doi.org/10.5194/tc-15-233-2021T. Slater et al.: Review article: Earth’s ice imbalance 241
lite observations to determine changes in the mass of sea Acknowledgements. We thank Axel Schweiger and Jinlun Zhang
ice. There is generally good agreement in mass trends de- for their help with PIOMAS/GIOMAS data and Susheel Adusumilli
rived from observations and models, where both are avail- for providing ice shelf thickness change data. We thank the editor,
able. Only our estimate of Southern Ocean sea ice mass im- Xavier Fettweis, and two anonymous reviewers for their comments,
balance depends on modelling alone (Zhang and Rothrock, which greatly improved the manuscript.
2003), though satellite observations of changes in its extent
(Parkinson, 2019) and in situ observations of changes in its
Financial support. This research has been supported by the Natural
thickness (Worby et al., 2008) suggest that little change has
Environment Research Council (grant no. cpom300001).
occurred in Antarctic sea ice cover. The overall rate of ice
loss has increased by 57 % over the past 24 years compared
to the 1990s, and in situ measurements of changes in glacier Review statement. This paper was edited by Xavier Fettweis and
mass (Zemp et al., 2019a) and satellite records of ice shelf reviewed by two anonymous referees.
extent (Cook and Vaughan, 2010) which predate the com-
plete survey confirm this trend. Although a small fraction of
mountain glacier losses are associated with retreat since the
little ice age (Marzeion et al., 2014), there can be little doubt
References
that the vast majority of Earth’s ice loss is a direct conse-
quence of climate warming. Adusumilli, S., Fricker, H. A., Medley, B., Padman, L., and
Siegfried, M. B.: Interannual variations in meltwater input to the
Southern Ocean from Antarctic ice shelves, Nature Geosci., 13,
Data availability. Mountain glacier mass change data from 616–620, https://doi.org/10.1038/s41561-020-0616-z, 2020a.
glaciological and geodetic observations are freely available at Adusumilli, S., Fricker, H. A., Medley, B. C., Padman, L.,
https://doi.org/10.5281/zenodo.1492141 (Zemp et al., 2019b). Ele- and Siegfried, M. R.: Data from: Interannual variations in
vation change fields from DInSAR are available via the World Data meltwater input to the Southern Ocean from Antarctic ice
Center (https://doi.org/10.1594/PANGAEA.893612, Braun et al., shelves [Data set], UC San Diego Library Digital Collections,
2018). Glacier digital elevation models and elevation change maps https://doi.org/10.6075/J04Q7SHT, 2020b.
derived from satellite optical stereo imagery are available at https: Armitage, T. W. K., Manucharyan, G. E., Petty, A. A., Kwok, R.,
//nsidc.org/data/highmountainasia (last access: November 2020, and Thompson, A. F.: Enhanced eddy activity in the Beaufort
Shean et al., 2020) and https://doi.org/10.1594/PANGAEA.903618 Gyre in response to sea ice loss, Nature Commun., 11, 761,
(Dussaillant et al., 2019a), respectively. Mass change data for the https://doi.org/10.1038/s41467-020-14449-z, 2020.
Antarctic and Greenland ice sheets are provided by the ice sheet Bevis, M., Harig, C., Khan, S. A., Brown, A., Simons, F.
mass balance intercomparison exercise (IMBIE) and are available J., Willis, M., Fettweis, X., Broeke, M. R. van den, Mad-
at http://imbie.org/data-downloads/ (last access: April 2020), The sen, F. B., Kendrick, E., Caccamise, D. J., Dam, T. van,
IMBIE Team, 2018, 2020). Changes in ice shelf extent can be down- Knudsen, P., and Nylen, T.: Accelerating changes in ice
loaded from the Scientific Committee on Antarctic Research digital mass within Greenland, and the ice sheet’s sensitivity to
database (https://www.add.scar.org/, SCAR, 2020). Changes in ice atmospheric forcing, P. Natl. Acad. Sci., 116, 1934–1939,
shelf thickness from Adusumilli et al. (2020a) are freely available at https://doi.org/10.1073/pnas.1806562116, 2019.
https://doi.org/10.6075/J04Q7SHT (Adusumilli et al., 2020b). PI- Bintanja, R., van Oldenborgh, G. J., Drijfhout, S. S., Wouters, B.,
OMAS/GIOMAS data are freely available from the University of and Katsman, C. A.: Important role for ocean warming and in-
Washington Polar Science Data Center (http://psc.apl.uw.edu/data/, creased ice-shelf melt in Antarctic sea-ice expansion, Nature
last access: August 2020, Zhang and Rothrock, 2003). Geosci., 6, 376–379, https://doi.org/10.1038/ngeo1767, 2013.
Biskaborn, B. K., Smith, S. L., Noetzli, J., Matthes, H., Vieira, G.,
Streletskiy, D. A., Schoeneich, P., Romanovsky, V. E., Lewkow-
Author contributions. TS, IRL, INO and AS designed the study, icz, A. G., Abramov, A., Allard, M., Boike, J., Cable, W. L.,
performed the data analysis and wrote the manuscript. NG, LJ, Christiansen, H. H., Delaloye, R., Diekmann, B., Drozdov, D.,
PT and PN prepared mountain glacier mass change estimates from Etzelmüller, B., Grosse, G., Guglielmin, M., Ingeman-Nielsen,
CryoSat-2 satellite radar altimetry. LG prepared the ice sheet thick- T., Isaksen, K., Ishikawa, M., Johansson, M., Johannsson, H.,
ness change datasets from multi-mission satellite radar altimetry Joo, A., Kaverin, D., Kholodov, A., Konstantinov, P., Kröger, T.,
used in Fig. 1. Lambiel, C., Lanckman, J.-P., Luo, D., Malkova, G., Meiklejohn,
I., Moskalenko, N., Oliva, M., Phillips, M., Ramos, M., Sannel,
A. B. K., Sergeev, D., Seybold, C., Skryabin, P., Vasiliev, A.,
Competing interests. The authors declare that they have no conflict Wu, Q., Yoshikawa, K., Zheleznyak, M., and Lantuit, H.: Per-
of interest. mafrost is warming at a global scale, Nature Commun., 10, 264,
https://doi.org/10.1038/s41467-018-08240-4, 2019.
Blackport, R., Screen, J. A., van der Wiel, K., and Bintanja,
R.: Minimal influence of reduced Arctic sea ice on coincident
cold winters in mid-latitudes, Nat. Clim. Change, 9, 697–704,
https://doi.org/10.1038/s41558-019-0551-4, 2019.
https://doi.org/10.5194/tc-15-233-2021 The Cryosphere, 15, 233–246, 2021242 T. Slater et al.: Review article: Earth’s ice imbalance Braun, M. H., Malz, P., Sommer, C., Farías-Barahona, D., Francis, J. A. and Vavrus, S. J.: Evidence linking Arctic amplifica- Sauter, T., Casassa, G., Soruco, A., Skvarca, P., and See- tion to extreme weather in mid-latitudes, Geophys. Res. Lett., 39, haus, T.: Annual glacier elevation change rate raster dataset, L06801, https://doi.org/10.1029/2012GL051000, 2012. South American Andes 2000 and 2011–2015, PANGAEA, Fretwell, P., Pritchard, H. D., Vaughan, D. G., Bamber, J. L., Bar- https://doi.org/10.1594/PANGAEA.893612, 2018. rand, N. E., Bell, R., Bianchi, C., Bingham, R. G., Blanken- Braun, M. H., Malz, P., Sommer, C., Farías-Barahona, D., Sauter, ship, D. D., Casassa, G., Catania, G., Callens, D., Conway, H., T., Casassa, G., Soruco, A., Skvarca, P., and Seehaus, T. C.: Con- Cook, A. J., Corr, H. F. J., Damaske, D., Damm, V., Ferracci- straining glacier elevation and mass changes in South America, oli, F., Forsberg, R., Fujita, S., Gim, Y., Gogineni, P., Griggs, Nat. Clim. Change, 9, 130–136, https://doi.org/10.1038/s41558- J. A., Hindmarsh, R. C. A., Holmlund, P., Holt, J. W., Jacobel, 018-0375-7, 2019. R. W., Jenkins, A., Jokat, W., Jordan, T., King, E. C., Kohler, Carmack, E. C., Yamamoto-Kawai, M., Haine, T. W. N., Bacon, J., Krabill, W., Riger-Kusk, M., Langley, K. A., Leitchenkov, S., Bluhm, B. A., Lique, C., Melling, H., Polyakov, I. V., Stra- G., Leuschen, C., Luyendyk, B. P., Matsuoka, K., Mouginot, neo, F., Timmermans, M.-L., and Williams, W. J.: Freshwater J., Nitsche, F. O., Nogi, Y., Nost, O. A., Popov, S. V., Rignot, and its role in the Arctic Marine System: Sources, disposition, E., Rippin, D. M., Rivera, A., Roberts, J., Ross, N., Siegert, storage, export, and physical and biogeochemical consequences M. J., Smith, A. M., Steinhage, D., Studinger, M., Sun, B., in the Arctic and global oceans, J. Geophys. Res.-Biogeosc., 121, Tinto, B. K., Welch, B. C., Wilson, D., Young, D. A., Xiangbin, 675–717, https://doi.org/10.1002/2015JG003140, 2016. C., and Zirizzotti, A.: Bedmap2: improved ice bed, surface and Cavalieri, D. J., Parkinson, C. L., Gloersen, P., Comiso, J. thickness datasets for Antarctica, The Cryosphere, 7, 375–393, C., and Zwally, H. J.: Deriving long-term time series of https://doi.org/10.5194/tc-7-375-2013, 2013. sea ice cover from satellite passive-microwave multisen- Gardner, A. S., Moholdt, G., Cogley, J. G., Wouters, B., Arendt, sor data sets, J. Geophys. Res.-Oceans, 104, 15803–15814, A. A., Wahr, J., Berthier, E., Hock, R., Pfeffer, W. T., Kaser, https://doi.org/10.1029/1999JC900081, 1999. G., Ligtenberg, S. R. M., Bolch, T., Sharp, M. J., Hagen, J. O., Cook, A. J. and Vaughan, D. G.: Overview of areal changes of the van den Broeke, M. R., and Paul, F.: A Reconciled Estimate of ice shelves on the Antarctic Peninsula over the past 50 years, Glacier Contributions to Sea Level Rise: 2003 to 2009, Science, The Cryosphere, 4, 77–98, https://doi.org/10.5194/tc-4-77-2010, 340, 852–857, https://doi.org/10.1126/science.1234532, 2013. 2010. Golledge, N. R., Keller, E. D., Gomez, N., Naughten, K. A., Dai, A., Luo, D., Song, M., and Liu, J.: Arctic amplification is Bernales, J., Trusel, L. D., and Edwards, T. L.: Global envi- caused by sea-ice loss under increasing CO2 , Nature Commun., ronmental consequences of twenty-first-century ice-sheet melt, 10, 121, https://doi.org/10.1038/s41467-018-07954-9, 2019. Nature, 566, 65–72, https://doi.org/10.1038/s41586-019-0889-9, Domack, E., Duran, D., Leventer, A., Ishman, S., Doane, S., 2019. McCallum, S., Amblas, D., Ring, J., Gilbert, R., and Pren- Gourmelen, N., Escorihuela, M. J., Shepherd, A., Foresta, L., Muir, tice, M.: Stability of the Larsen B ice shelf on the Antarctic A., Garcia-Mondéjar, A., Roca, M., Baker, S. G., and Drinkwater, Peninsula during the Holocene epoch, Nature, 436, 681–685, M. R.: CryoSat-2 swath interferometric altimetry for mapping ice https://doi.org/10.1038/nature03908, 2005. elevation and elevation change, Adv. Space Res., 62, 1226–1242, Dussaillant, I., Berthier, E., Brun, F., Masiokas, M., Hugonnet, R., https://doi.org/10.1016/j.asr.2017.11.014, 2018. Favier, V., Rabatel, A., Pitte, P., and Ruiz, L.: South American Hartmann, D. L., Klein Tank, A. M. G., Rusticucci, M., Alexan- Andes elevation changes from 2000 to 2018, links to GeoTIFFs, der, L. V., Brönnimann, S., Charabi, Y., Dentener, F. J., Dlugo- PANGAEA, https://doi.org/10.1594/PANGAEA.903618, 2019a. kencky, E. J., Easterling, D. R., Kaplan, A., Soden, B. J., Thorne, Dussaillant, I., Berthier, E., Brun, F., Masiokas, M., Hugonnet, R., P. W., Wild, M., and Zhai, P. M.: Observations: Atmosphere and Favier, V., Rabatel, A., Pitte, P., and Ruiz, L.: Two decades of Surface, in Climate Change 2013: The Physical Science Basis. glacier mass loss along the Andes, Nature Geosci., 12, 802–808, Contribution of Working Group I to the Fifth Assessment Re- https://doi.org/10.1038/s41561-019-0432-5, 2019b. port of the Intergovernmental Panel on Climate Change, edited Enderlin, E. M., Howat, I. M., Jeong, S., Noh, M.-J., van Angelen, by: Stocker, T. F., Qin, D., Plattner, G.-K., Tignor, M., Allen, S. J. H., and van den Broeke, M. R.: An improved mass budget K., Boschung, J., Nauels, A., Xia, Y., Bex, V., and Midgley, P. for the Greenland ice sheet, Geophys. Res. Lett., 41, 866–872, M., 159–254, Cambridge University Press, Cambridge, United https://doi.org/10.1002/2013GL059010, 2014. Kingdom and New York, NY, USA, 2013. Farinotti, D., Huss, M., Fürst, J. J., Landmann, J., Machguth, H., Hobbs, W. R., Massom, R., Stammerjohn, S., Reid, P., Williams, G., Maussion, F., and Pandit, A.: A consensus estimate for the ice and Meier, W.: A review of recent changes in Southern Ocean sea thickness distribution of all glaciers on Earth, Nature Geosci., ice, their drivers and forcings, Global Planet. Change, 143, 228– 12, 168–173, https://doi.org/10.1038/s41561-019-0300-3, 2019. 250, https://doi.org/10.1016/j.gloplacha.2016.06.008, 2016. Ferreira, D., Marshall, J., Bitz, C. M., Solomon, S., and Plumb, Hogg, A. E., Shepherd, A., Cornford, S. L., Briggs, K. H., Gourme- A.: Antarctic Ocean and Sea Ice Response to Ozone Deple- len, N., Graham, J. A., Joughin, I., Mouginot, J., Nagler, T., tion: A Two-Time-Scale Problem, J. Climate, 28, 1206–1226, Payne, A. J., Rignot, E., and Wuite, J.: Increased ice flow in West- https://doi.org/10.1175/JCLI-D-14-00313.1, 2015. ern Palmer Land linked to ocean melting, Geophys. Res. Lett., Foresta, L., Gourmelen, N., Pálsson, F., Nienow, P., Björns- 44, 4159–4167, https://doi.org/10.1002/2016GL072110, 2017. son, H., and Shepherd, A.: Surface elevation change and Holland, D. M., Thomas, R. H., de Young, B., Ribergaard, M. mass balance of Icelandic ice caps derived from swath mode H., and Lyberth, B.: Acceleration of Jakobshavn Isbræ triggered CryoSat-2 altimetry, Geophys. Res. Lett., 43, 12138–12145, by warm subsurface ocean waters, Nature Geosci., 1, 659–664, https://doi.org/10.1002/2016GL071485, 2016. https://doi.org/10.1038/ngeo316, 2008. The Cryosphere, 15, 233–246, 2021 https://doi.org/10.5194/tc-15-233-2021
T. Slater et al.: Review article: Earth’s ice imbalance                                                                                 243

Howat, I. M., Joughin, I., Fahnestock, M., Smith, B. E.,                 Maksym, T.: Arctic and Antarctic Sea Ice Change: Contrasts, Com-
   and Scambos, T. A.: Synchronous retreat and acceleration                monalities, and Causes, Annu. Rev. Mar. Sci., 11, 187–213,
   of southeast Greenland outlet glaciers 2000–06: ice dy-                 https://doi.org/10.1146/annurev-marine-010816-060610, 2019.
   namics and coupling to climate, J. Glaciol., 54, 646–660,             Marzeion, B., Cogley, J. G., Richter, K., and Parkes,
   https://doi.org/10.3189/002214308786570908, 2008.                       D.: Attribution of global glacier mass loss to anthro-
Huss, M.: Density assumptions for converting geodetic glacier              pogenic and natural causes, Science, 345, 919–921,
   volume change to mass change, The Cryosphere, 7, 877–887,               https://doi.org/10.1126/science.1254702, 2014.
   https://doi.org/10.5194/tc-7-877-2013, 2013.                          McMillan, M., Leeson, A., Shepherd, A., Briggs, K., Armitage,
Huss, M. and Hock, R.: Global-scale hydrological response to               T. W. K., Hogg, A., Munneke, P. K., Broeke, M. van den,
   future glacier mass loss, Nat. Clim. Change, 8, 135–140,                Noël, B., Berg, W. J. van de, Ligtenberg, S., Horwath, M.,
   https://doi.org/10.1038/s41558-017-0049-x, 2018.                        Groh, A., Muir, A., and Gilbert, L.: A high-resolution record of
Immerzeel, W. W., Lutz, A. F., Andrade, M., Bahl, A., Biemans,             Greenland mass balance, Geophys. Res. Lett., 43, 7002–7010,
   H., Bolch, T., Hyde, S., Brumby, S., Davies, B. J., Elmore, A.          https://doi.org/10.1002/2016GL069666, 2016.
   C., Emmer, A., Feng, M., Fernández, A., Haritashya, U., Kargel,       Meehl, G. A., Arblaster, J. M., Bitz, C. M., Chung, C. T. Y., and
   J. S., Koppes, M., Kraaijenbrink, P. D. A., Kulkarni, A. V.,            Teng, H.: Antarctic sea-ice expansion between 2000 and 2014
   Mayewski, P. A., Nepal, S., Pacheco, P., Painter, T. H., Pellic-        driven by tropical Pacific decadal climate variability, Nature
   ciotti, F., Rajaram, H., Rupper, S., Sinisalo, A., Shrestha, A. B.,     Geosci., 9, 590–595, https://doi.org/10.1038/ngeo2751, 2016.
   Viviroli, D., Wada, Y., Xiao, C., Yao, T., and Baillie, J. E. M.:     Meredith, M., Sommerkorn, M., Cassotta, S., Derksen, C., Ekaykin,
   Importance and vulnerability of the world’s water towers, Na-           A., Hollowed, A., Kofinas, G., Mackintosh, A., Melbourne-
   ture, 577, 364–369, https://doi.org/10.1038/s41586-019-1822-y,          Thomas, J., Muelbert, M. M. C., Ottersen, H., Pritchard, H., and
   2020.                                                                   Schuur, E. A. G.: Polar Regions, in IPCC Special Report on the
Jakob, L., Gourmelen, N., Ewart, M., and Plummer, S.: Ice loss             Ocean and Cryosphere in a Changing Climate, in press, 2019.
   in High Mountain Asia and the Gulf of Alaska observed                 Moon, T., Joughin, I., Smith, B., and Howat, I.: 21st-Century Evo-
   by CryoSat-2 swath altimetry between 2010 and 2019, The                 lution of Greenland Outlet Glacier Velocities, Science, 336, 576–
   Cryosphere Discuss., https://doi.org/10.5194/tc-2020-176, in re-        578, https://doi.org/10.1126/science.1219985, 2012.
   view, 2020.                                                           Morlighem, M., Williams, C. N., Rignot, E., An, L., Arndt, J. E.,
Jacobs, S. S., Helmer, H. H., Doake, C. S. M., Jenk-                       Bamber, J. L., Catania, G., Chauché, N., Dowdeswell, J. A.,
   ins, A., and Frolich, R. M.: Melting of ice shelves and                 Dorschel, B., Fenty, I., Hogan, K., Howat, I., Hubbard, A., Jakob-
   the mass balance of Antarctica, J. Glaciol., 38, 375–387,               sson, M., Jordan, T. M., Kjeldsen, K. K., Millan, R., Mayer, L.,
   https://doi.org/10.3189/S0022143000002252, 1992.                        Mouginot, J., Noël, B. P. Y., O’Cofaigh, C., Palmer, S., Rys-
Jacobs, S. S., Hellmer, H. H., and Jenkins, A.: Antarctic Ice Sheet        gaard, S., Seroussi, H., Siegert, M. J., Slabon, P., Straneo, F.,
   melting in the southeast Pacific, Geophys. Res. Lett., 23, 957–         van den Broeke, M. R., Weinrebe, W., Wood, M., and Zinglersen,
   960, https://doi.org/10.1029/96GL00723, 1996.                           K. B.: BedMachine v3: Complete Bed Topography and Ocean
Jacobs, S. S., Jenkins, A., Giulivi, C. F., and Dutrieux,                  Bathymetry Mapping of Greenland From Multibeam Echo
   P.: Stronger ocean circulation and increased melting under              Sounding Combined With Mass Conservation, Geophys. Res.
   Pine Island Glacier ice shelf, Nature Geosci., 4, 519–523,              Lett., 44, 11051–11061, https://doi.org/10.1002/2017GL074954,
   https://doi.org/10.1038/ngeo1188, 2011.                                 2017.
Joughin, I., Alley, R. B., and Holland, D. M.: Ice-Sheet                 Mortimer, C. A., Copland, L., and Mueller, D. R.: Volume and
   Response to Oceanic Forcing, Science, 338, 1172–1176,                   area changes of the Milne Ice Shelf, Ellesmere Island, Nunavut,
   https://doi.org/10.1126/science.1226481, 2012.                          Canada, since 1950, J. Geophys. Res.-Ea. Surf., 117, F04011,
Laxon, S. W., Giles, K. A., Ridout, A. L., Wingham, D. J.,                 https://doi.org/10.1029/2011JF002074, 2012.
   Willatt, R., Cullen, R., Kwok, R., Schweiger, A., Zhang,              Mouginot, J., Rignot, E., and Scheuchl, B.: Sustained increase in
   J., Haas, C., Hendricks, S., Krishfield, R., Kurtz, N., Far-            ice discharge from the Amundsen Sea Embayment, West Antarc-
   rell, S., and Davidson, M.: CryoSat-2 estimates of Arctic sea           tica, from 1973 to 2013, Geophys. Res. Lett., 41, 1576–1584,
   ice thickness and volume, Geophys. Res. Lett., 40, 732–737,             https://doi.org/10.1002/2013GL059069, 2014.
   https://doi.org/10.1002/grl.50193, 2013.                              Mouginot, J., Rignot, E., Bjørk, A. A., Broeke, M. van den, Mil-
Luthcke, S. B., Zwally, H. J., Abdalati, W., Rowlands, D. D., Ray,         lan, R., Morlighem, M., Noël, B., Scheuchl, B., and Wood,
   R. D., Nerem, R. S., Lemoine, F. G., McCarthy, J. J., and Chinn,        M.: Forty-six years of Greenland Ice Sheet mass balance
   D. S.: Recent Greenland Ice Mass Loss by Drainage System                from 1972 to 2018, P. Natl. Acad. Sci., 116, 9239–9244,
   from Satellite Gravity Observations, Science, 314, 1286–1289,           https://doi.org/10.1073/pnas.1904242116, 2019.
   https://doi.org/10.1126/science.1130776, 2006.                        Noël, B., van de Berg, W. J., van Wessem, J. M., van Meij-
Magnuson, J. J., Robertson, D. M., Benson, B. J., Wynne, R. H.,            gaard, E., van As, D., Lenaerts, J. T. M., Lhermitte, S., Kuipers
   Livingstone, D. M., Arai, T., Assel, R. A., Barry, R. G., Card,         Munneke, P., Smeets, C. J. P. P., van Ulft, L. H., van de Wal,
   V., Kuusisto, E., Granin, N. G., Prowse, T. D., Stewart, K. M.,         R. S. W., and van den Broeke, M. R.: Modelling the climate
   and Vuglinski, V. S.: Historical Trends in Lake and River Ice           and surface mass balance of polar ice sheets using RACMO2 –
   Cover in the Northern Hemisphere, Science, 289, 1743–1746,              Part 1: Greenland (1958–2016), The Cryosphere, 12, 811–831,
   https://doi.org/10.1126/science.289.5485.1743, 2000.                    https://doi.org/10.5194/tc-12-811-2018, 2018.
                                                                         Otosaka, I., Shepherd, A., and McMillan, M.: Ice Sheet El-
                                                                           evation Change in West Antarctica From Ka-Band Satel-

https://doi.org/10.5194/tc-15-233-2021                                                             The Cryosphere, 15, 233–246, 2021
You can also read