Physical Environment Hydrology, Weather and Climate, Climatology - Isle of Man Government
←
→
Page content transcription
If your browser does not render page correctly, please read the page content below
Manx Marine Environmental Assessment
           Physical Environment
          Hydrology, Weather and
           Climate, Climatology

                                     Peel in a storm. Photo: Peter McEvoy, 2012.

MMEA Chapter 2.1

October 2013

Lead authors:
Dr Kevin Kennington - Government Laboratory. Department of Environment, Food and
Agriculture.
Dr Alan Hisscott - MeteoVannin
MMEA Chapter 2.1 – Physical Environment

           Manx Marine Environmental Assessment

Version: November 2013

© Isle of Man Government, all rights reserved

This document was produced as part of the Isle of Man Marine Plan Project, a cross Government
Department project funded and facilitated by the Department of Infrastructure, Department of
Economic Development and Department of Environment, Food and Agriculture.

This document is downloadable from the Department of Infrastructure website at:
http://www.gov.im/transport/planning/msp/mmea.xml.

For information about the Isle of Man Marine Plan please see:
http://www.gov.im/categories/planning-and-building-control/marine-planning/

Contact:
Manx Marine Environmental Assessment.
Isle of Man Marine Plan
Planning & Building Control Division
Department of Infrastructure
Murray House, Mount Havelock
Douglas, IM1 2SF

Email: MMEA@gov.im

Suggested Citations:

Chapter
Kennington, K. and Hisscott, A. 2013. Hydrology, Weather and Climate, Climatology. In Hanley et al.,
(eds.), Manx Marine Environmental Assessment. Isle of Man Marine Plan. Isle of Man Government,
pp. 45

MMEA
Hanley, L.J., Gell, F.G., Kennington, K., Stone, E., Rowan, E., McEvoy, P., Brew, M., Milne, K.,
Charter, L., Gallagher, M., Hemsley, K., Duncan, P.F. (eds.) 2013. Manx Marine Environmental
Assessment. Isle of Man Marine Plan. Isle of Man Government.

Manx Marine Environmental Assessment – October 2013                                                    2
MMEA Chapter 2.1 – Physical Environment

Disclaimer:
The Isle of Man Government has facilitated the compilation of this document, to provide baseline
information towards the Isle of Man Marine Plan Project. Information has been provided by various
Government Officers, marine experts, local organisations and industry, often in a voluntary capacity
or outside their usual work remit. Advice should always be sought from relevant contacts where
queries arise.

The editors have taken every care to ensure the accuracy of the information contained but accept
that errors, omissions or changes may be present which may be identified in future. The editors
accept no responsibility for the accuracy or currency of information provided on external sites.

All MMEA chapters may be amended and improved upon in light of new information or comments
received. As such, all chapters should be considered as working documents.
Any initial guidelines or recommendations within the document are provided to help facilitate future
discussions between stakeholders, Government Departments, future developers and the general
public, and should be read only in the context of the document as a whole. This document does not
provide legal or policy advice but rather a statement of known information about Manx territorial
waters.

The mapping detail contained in this document is subject to the limitations of scale and depiction of
any feature, does not denote or infer right of way and no claim is made for the definitive nature of
any feature shown on the mapping. New marine datasets created for the project have not been
subject to formal verification.

Copyright:
Unless stated otherwise, all mapping, overlay data and intellectual property in this publication are
subject to the following copyright:
Charts: © Crown Copyright, Department of Infrastructure, Isle of Man. 2012.
United Kingdom Hydrographic Office admiralty charts: © SeaZone Solutions Ltd. Licence no. 2005,
[GDDI/10 & 012011.006]. © British Crown Copyright, 2005.
NOT TO BE USED FOR NAVIGATION
Reproduction of the maps in any form is prohibited without prior permission from the publishers.

Manx Marine Environmental Assessment – October 2013                                                     3
MMEA Chapter 2.1 – Physical Environment

Physical Environment
Introduction
This section of the MMEA covers elements of the physical marine environment including
physical hydrology, tides & currents, sediment types, weather and climate. Information is
given with direct relevance to the Isle of Man where information exists, beyond this
information is drawn from the broader Irish Sea and placed in a Manx context.

Hydrology

Bathymetry & Surface Sediments
Water depth around the Isle of Man is deepest in waters to the west and southwest of the
Island. Here waters can reach over 100m depth. To the east of the Island water depth does
not exceed 50m (figure 1). The deeper waters to the west and southwest are associated
with a deep trough that bisects the western Irish Sea and has a significant impact on
circulation and hydrology (see later).

Figure 1 Draft map - Bathymetry of the Manx Territorial Sea.

Manx Marine Environmental Assessment – October 2013                                             4
MMEA Chapter 2.1 – Physical Environment

The Irish Sea can be split into two constituent regions. Deeper waters are located to the
west of the Isle of Man where a deep (>80m) trough runs north-south. To the east of the
Island water depths tend to be shallower (
MMEA Chapter 2.1 – Physical Environment

Figure 2. Distribution of different types of substrate in the Manx territorial sea as
determined through image analysis and sediment particle size analysis derived from data
that was collected during visual habitat surveys conducted within the 12 nautical mile
territorial limit of the Isle of Man in 2008. Mixed sand: predominately sandy with notable
shell or stone on the surface. Mixed gravel: predominately stone and/or shell gravel.
Mixed stone: higher prevalence of pebbles, cobbles, and/or boulders. Rock:
predominately bedrock and/or boulders. Mixed maerl: maerl with mixed sediments
and/or shell. (From White 2010).

The use of sonar ground discrimination systems has become an increasingly useful tool in
determining sediment types and mapping seafloor structures. The recently designated
Ramsey Marine Nature Reserve was mapped by DEFA in a 2011 survey using Hypack
mapping software. Surveys of this nature are dependent upon accurate calibration of the
mapping software and results obtained via the Bangor survey in 2008 were used to calibrate
the instrumentation for the Ramsey Bay survey. Results of part of the survey conducted off
the north of the Island are given in figure 3. This survey represents the highest resolution
survey of the area so far conducted. Future surveys will hopefully be conducted around the
Island to give a more complete, higher resolution overview of the sediment types in all Manx
territorial waters.

Manx Marine Environmental Assessment – October 2013                                             6
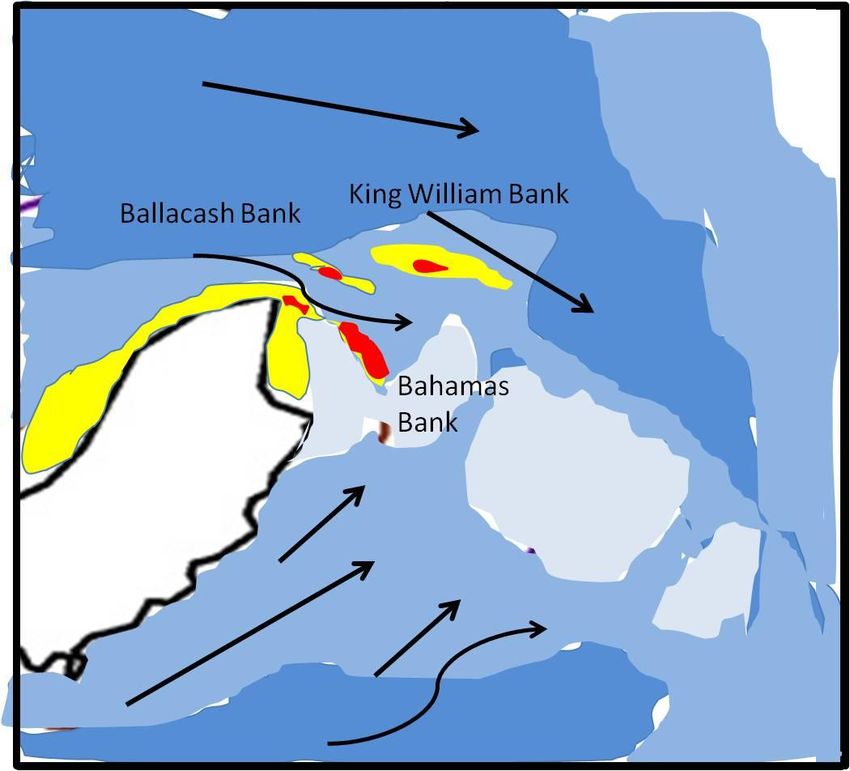
MMEA Chapter 2.1 – Physical Environment

Figure 3. GDS Survey off the north of the Point of Ayre. Red areas represent Modiolus
reefs identified by video survey and potential Modiolus reefs identified by Hypack. Blue
zone = scoured zone where mobile sediments have been winnowed leaving exposed
bedrock. Yellow zone = cobbled area. Green and brown areas are coarse to medium
coarse sands.

Around the north of the Isle of Man are to be found a series of sand banks known as
‘Banner banks’. Active Banner banks such as those found in this region can accumulate sand
from more than 30m water depth to the active wave base (although it is uncommon for
such banks to dry completely). The low banks extending for up to 40km towards the
southeast from the north of the Isle of Man are associated with the Bahama Bank on the
eastern side of the Point of Ayre. Away from the northern tip of the Island the King William
Bank is thought to be partly decoupled from the eddy-induced flow that sustains the Banner
banks in the region. The net movement of sand-waves has been shown to run from west to
east across the King William Bank (figure 4). Holmes & Tappen (1995) have suggested that
the Banner banks on the east side of the Isle of Man, in the long-term, are leaking sand
towards the open shelf and as such should be regarded as temporary sinks for sand
captured around the north of the Island.

Manx Marine Environmental Assessment – October 2013                                             7
MMEA Chapter 2.1 – Physical Environment

                      Water Depth           Key
                        >30m                 Direction of Sand Movement
                        20-30m
                        10-20m
                        5-10m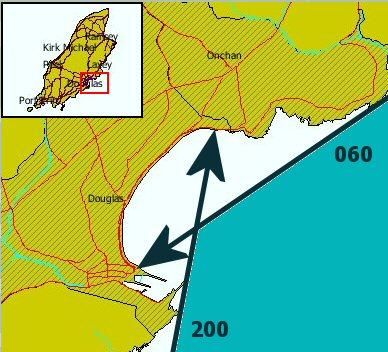
MMEA Chapter 2.1 – Physical Environment

Tides & Currents
The Irish Sea experiences semi-diurnal tides which differ greatly in range. The highest tides
are to be found along the Lancastrian and Cumbrian coasts where mean spring tides can
reach 8m. Lowest tidal ranges are to be found in the North Channel and along the Irish
coast south of Arklow where tidal heights tend to be less than 2m.
Manx Coastal Waters have a relatively large tidal range, increasing from the west coast to
the northeast (see table 1).

Table 1. Tidal range data supplied by the Proudman Oceanographic Laboratory (in metres
ACD).

   Coastal        Mean HW          Mean HW        Mean LW         Mean LW         Max Tidal
  Location         Springs          Neaps          Neaps          Springs          Range

     Peel            5.20             4.30            1.50           0.40            5.77

   Port Erin         5.29             4.17            1.62           0.50            6.06

 Port St Mary        5.90             4.80            1.60           0.50            6.46

   Douglas           6.83             5.40            2.22           0.78            7.74

   Ramsey            7.40             5.90            2.30           0.90            7.89

The large tidal ranges in parts of the Irish Sea are capable of generating strong tidal
currents especially in the North and St George’s Channels where current speeds can reach
1m s-1 during spring tides. Strong currents also exist around headlands (e.g. Point of Ayre)
of the region and in confined channels such as between the Calf of Man and the Isle of Man,
where current speeds can exceed 4ms-1. To the west and southwest of the Isle of Man and
between the Island and Morecambe Bay, current speeds are significantly lower and
generally do not exceed 0.25ms-1, these low current speeds are the result of the meeting of
two wave pulses from the north and south of the Irish Sea which causes a standing wave
effect (Howarth 1995).

The residual currents in the Irish Sea are complex with surface and bottom currents often
flowing in different directions. Additionally, the effect winds can have on residual flow is
significant (see later). The net long-term flow within the Irish Sea is from south to north.
Estimates of flow rates suggest that an average flow rate would be in the region of 2-
8km/day on an annual basis. This gives a residence time of around one year for waters to
pass through the Irish Sea. Resident times are higher in the eastern Irish Sea and in
Liverpool Bay in particular where eddy systems can interrupt flow, waters entrained here
can take longer than a year to exit the Irish Sea. On the western side of the North Channel
is a southward flowing counter current which can reach as far south as Dublin (see figure
5). In the deeper waters found to the west between the Isle of Man and Ireland is to be
found a seasonal (summer) gyre system which generates a cyclonic (anti-clockwise) flow.

Manx Marine Environmental Assessment – October 2013                                             9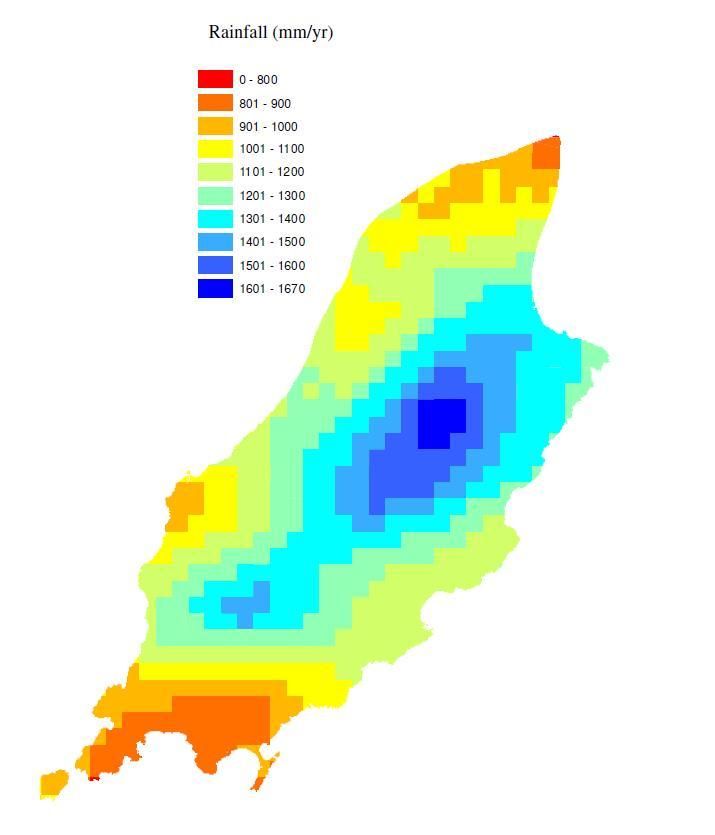
MMEA Chapter 2.1 – Physical Environment

Figure 5. Residual current patterns in surface (left) and bottom (right) waters of the
Irish Sea (after ISSG, 1990).

No definitive study of the tides and currents around the Isle of Man have yet been made
although publications by Brown (1951) and Simpson et al. (2006) give a good general
overview of tidal streams around the Island (see figure 6).

Figure 6: General tidal flow around the Isle of Man, from Brown (1951). More detailed
tidal current data is available from http://www.gov.im/categories/travel,-traffic-and-
motoring/harbours/tides-and-flapgates/

Manx Marine Environmental Assessment – October 2013                                             10
MMEA Chapter 2.1 – Physical Environment

Sea Temperatures

Temperature controls the rate of fundamental biochemical processes in organisms, and
consequently changes in environmental temperature can influence population, species and
community level processes. In the marine environment, temperature can alter the number
and diversity of adult species in a region by changing larval development time. Fluctuations
in sea temperature are critically important in governing the species ranges of organisms in
the marine realm. The vast majority of animals in the marine realm have planktonic larval
stages. Generally, cold water temperatures inhibit larval development and can therefore
increase larval distributions as the larvae are able to travel further. Warmer temperatures
speed up larval development and can therefore reduce larval dispersal times as organisms
mature more quickly.

The pattern of sea surface temperature in the North Irish Sea varies by season (figure 7)
and there is significant inter-annual variations (figure 7). In winter, the shallower water and
drainage of surface water from several large rivers means that surface temperatures east of
the Isle of Man are cooler than the deeper water to the west. During winter (October –
April) the region west of the Isle of Man is vertically mixed and residual circulation is largely
dominated by wind forcing with a net long-term circulation weakly northward at 1-2cms-1. A
deep trough, (>100m) extends along the length of the region and here tidal currents are
exceptionally weak (
MMEA Chapter 2.1 – Physical Environment

Sea Surface Temperature Seasonality in Port Erin Bay.
Daily sea surface temperature (SST) readings have been recorded from Port Erin Bay since
January 1904. Between 1904 and 2006 recordings were undertaken manually via the use of
a calibrated meteorological office thermometer, since this time SST have been recorded via
automated data loggers.
    Sea Temperature / C

                                                                                    Mean
                                                                                    Max
                                                                                    Min

.
Figure 7. Mean monthly sea surface temperature recorded at Port Erin .

Temperatures recorded at Port Erin Bay exhibit a strong seasonality reflecting changes in
atmospheric temperature with a phase lag of a few weeks. Figure 7 shows the average
monthly temperatures recorded at Port Erin. It can be seen that coldest SST occur during
February with minimum temperatures of approximately 5-6°C being recorded. Highest SST
occurs during August with maximum temperatures of between 15-16°C recorded.

The Port Erin Bay Sea Surface Temperature Time Series
Mean winter (Dec-Feb) and summer (June-Aug) SST readings are plotted in Figure 8. As can
be seen there is a great deal of inter-annual variation in the time-series, however since the
beginning of the 20th century an overall significant increase of approximately 0.7°C has
occurred. This temperature increase is not uniform across the time series. The early 20th
century was characterised by a cool period with five of ten of the coolest years occurring
between 1914-1923. A relatively stable period occurred between the mid-1920s and the
mid-1990s. Elevated SST is most conspicuous in records since the mid-1990s with eight of
ten of the warmest years recorded since 1995.

Manx Marine Environmental Assessment – October 2013                                             12
MMEA Chapter 2.1 – Physical Environment
15
14
13
Temperature (Degrees Celsius)
12
11
10
9
8
7
6
1900 1920 1940 1960 1980 2000 2020
Year
Figure 8. Port Erin Bay Sea Surface Temperature time-series 1904-2011. Averaged
summer (June, July, August) and winter (December, January, February) temperatures.
Green line represents annual mean temperature.
Impacts of Increasing Sea Temperature
There is increasing evidence that increasing ocean temperatures are causing a pole-ward
migration of warmer water species of plankton, fish, benthic and intertidal organisms. This is
likely to impact upon commercially sensitive fish stocks such as cod, monkfish and haddock
whose distributions have shifted northwards to cooler waters over recent decades. Other
fish species of commercial importance may well arrive in waters around the Isle of Man in
future decades as the ranges of warmer water species move steadily northwards.
Increasing sea temperatures may also lead to increases in noxious phytoplankton blooms,
examples can be found throughout U.S. and European coasts where long term data are
available, that show correlations between shifts in harmful algal bloom species and the
timing of their outbreaks and increases in mean water temperature (Gilbert et al. 2005).
The recent increase in SST recorded around the IOM mirror the increase in global
atmospheric temperature. CO2 is an important greenhouse gas and has been linked with
increasing global atmospheric temperatures. Increased concentrations of dissolved CO2 in
seawater are leading to increased acidification of oceanic waters. This problem is anticipated
to increase as concentrations of atmospheric CO2 rises in the future. Acidification of marine
waters may have severe consequences for certain organisms such as shellfish and many
planktonic organisms which build shells from calcium carbonate.
For further information please also refer to MMEA Chapter 2.2 (Climate Change in Manx
Waters) and MMEA Chapter 4.1 (Fisheries).
Manx Marine Environmental Assessment – October 2013 13MMEA Chapter 2.1 – Physical Environment Salinity Salinity of the sea refers to the water’s ‘saltiness’. Traditionally salinity has been expressed as parts per thousand (per mille) which approximates to the number of grams of salt per kilogram of solution. Since the late 1970s salinity was redefined in the Practical Salinity Scale (PSS) which is the conductivity ratio of a seawater sample to a standard KCl solution. As PSS is a ratio, it has no units. The open Atlantic has a salinity of approximately 35.5 (PSS). Oceanic waters entering the Irish Sea from the Atlantic are modified by freshwater inputs from land. These freshwater discharges affect not only salinity but also add nutrient salts and particulate matter which can also increase turbidity. As a result of variations in the quantities of freshwater entering the Irish Sea from riverine discharge, the Irish Sea exhibits a strong salinity gradient. Highest salinities in the Irish Sea are recorded in the south (St George’s Channel) and decrease northwards reflecting the net northerly flow of Atlantic water whose salinity is gradually reduced by freshwater inputs from land. Lowest salinities are to be found in the northeast of the region between the Solway Firth and Liverpool Bay. Salinity is routinely monitored at several sites around the island and was monitored in Port Erin Bay as part of the long-term monitoring programme between 1965 and 2006. Seasonality of salinity in Port Erin Bay Seasonal variations in salinity are small in most areas of the Irish Sea and that is certainly true of recordings made at Port Erin. Salinity recordings from Port Erin Bay are shown in Figures 9 and 10 below. Figure 9 shows the annual seasonality patterns averaged from the entire dataset. It can be seen that highest overall salinities (~35) are recorded during the winter months between November and March. However, highest mean salinities tend to be found during the summer months (figure 9, lower graph) between April and August possibly reflecting reduced rainfall during these months. It should be noted however that these salinity variations are slight and cover a range of only 0.15 practical salinity units. Manx Marine Environmental Assessment – October 2013 14
MMEA Chapter 2.1 – Physical Environment

                             35.2

                             34.8

                             34.4
                   Salnity

                               34

                             33.6

                             33.2

                                     1   2   3   4   5   6   7         8   9   10   11   12
                                                         Month
                             34.28

                             34.24

                              34.2
                  Salinity

                             34.16

                             34.12

                             34.08

                                     1   2   3   4   5   6       7     8   9   10   11   12
                                                         Month
Figure 9. Seasonality of salinity in Port Erin Bay (averaged data 1965-2007). Top graph
shows maximum (red), minimum (blue) and mean (green) monthly salinity. Lower graph
shows mean monthly salinity.

Manx Marine Environmental Assessment – October 2013                                                            15
MMEA Chapter 2.1 – Physical Environment
The Port Erin Bay Salinity Time Series
34.8
34.4
Salinity
34
33.6
1960 1970 1980 1990 2000 2010
Year
Figure 10. Time series of winter (blue), summer (red) and mean annual (green) salinity
recordings from Port Erin Bay 1965-2007. Winter data are defined as all recordings for
Dec-Feb (inclusive), summer data is all data recorded between June-August (inclusive).
Annual mean salinity across the 46 year time-series shows a great deal of inter-annual
variation with no long term trend identifiable. A strong correlation does exist between the
mean annual, winter and summer salinity measurements at this location (figure 10).
Shammon et al. (2004) noted the differentials of annual means with reference to the 1966-
2003 grand mean. These authors noted that there was a noteworthy period of low salinity
around the early 1980s and a period of higher salinities around the 1990s. More recent data
shows that salinity values have again fallen since 2000.
The decadal scale perturbations observed in the salinity time-series reflect the variations in
atmospheric pressure anomalies observed in the open Atlantic. These anomalies are known
as the North Atlantic Oscillation (NAO). An index of the variations in atmospheric
pressure systems between the Azores and Iceland has been developed and is known as the
NAO index (NAOI). It can be seen from figure 11 that a strong negative correlation exists
between the Port Erin salinity time-series and the NAOI. When the index is positive this
reflects dominance of the Azorean pressure systems in the open Atlantic resulting in
stronger prevailing (south-westerly) winds and higher precipitation over north-western
Europe (and consequently the Irish Sea). This increased rainfall results in greater riverine
discharge, and subsequently lowering salinity values in the Irish Sea.
Manx Marine Environmental Assessment – October 2013 16MMEA Chapter 2.1 – Physical Environment
34.8
34.6
Annual Mean Salinity
34.4
34.2
34
33.8
-6 -5 -4 -3 -2 -1 0 1 2 3 4 5 6
NAO Index
Figure 11. Comparison of mean annual salinity recordings at Port Erin Bay (1966-2006)
and the North Atlantic Oscillation Index.
Localised Variation In Salinity Around the Isle of Man
As part of the routine water quality sampling programme undertaken by the Isle of Man
government, salinity is measured at various localities around the Isle of Man. Stations to the
South and West of the island have higher overall salinities than those to the north and east
(see table 2). This reflects the influence of freshwater discharge from the Solway Firth,
Morecambe Bay and Liverpool Bay in the eastern Irish Sea. The western Irish Sea also has
far fewer large rivers and a greater volume of receiving water than the east.
Table 2. Salinity measurements taken at four locations around the island during 2007.
The Cypris and Target stations are located to the west of the Island whilst Ramsey and
Laxey stations are located to the east of the Island.
Date Cypris Targets Ramsey Laxey
25 Jan 2007 33.902 33.302 30.436 31.710
21 Mar 2007 33.717 33.833 31.908 34.108
16 Apr 2007 34.011 33.793 33.041 33.223
03 May 2007 33.870 33.938 33.737 33.706
21 May 2007 34.054 33.921 33.864 33.907
02 July 2007 34.085 34.106 33.529 33.764
18 July 2007 33.928 34.018 33.688 33.847
21 Sept 2007 33.938 33.962 33.701 33.909
24 Oct 2007 34.054 33.854 33.862 33.956
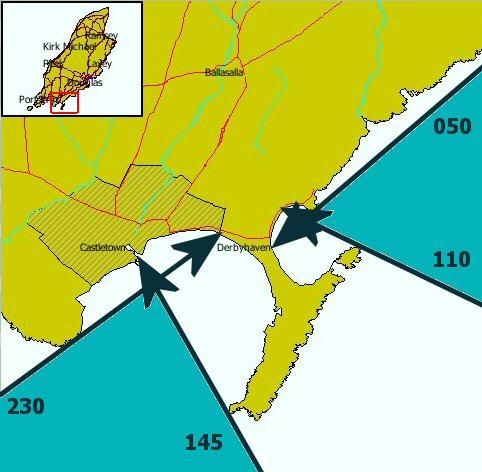
Manx Marine Environmental Assessment – October 2013 17MMEA Chapter 2.1 – Physical Environment Waves Wind blowing over a smooth water surface initially causes small ripples to develop. If the wind continues to blow these ripples build upon each other into larger ripples which grow into waves, and the waves move forward as air pushes on the upwind slopes of the water surfaces. Waves are described by wavelength (the horizontal distance between two crests, or between two troughs), amplitude (the vertical distance between the bottom of a trough and the top of a crest) and period (the time between adjacent crests passing the same point in space). The size of waves depends on wind speed, wind duration and fetch (the distance along the water over which the wind is blowing). Fully developed seas are the largest waves that are possible given a particular wind speed, duration, and fetch (one of these variables will be the limiting factor). Wind waves normally move in the direction that the wind blows them, although refraction can occur around headlands and islands. Swell waves are longer wavelength, longer period, waves which are generated by remote storms and can travel large distances away from their area of generation (see figures 12 & 13). Figure 12. Diagram showing how available fetch can limit wave generation (examples are shown for a 30kt mean wind speed in blue and for a 45kt mean wind speed in red). Manx Marine Environmental Assessment – October 2013 18
MMEA Chapter 2.1 – Physical Environment

Exposure directions for wind
waves affecting bays around
the Isle of Man

Figure 13. Exposure of bays around the Isle of Man to wind directions.

Manx Marine Environmental Assessment – October 2013                                             19
MMEA Chapter 2.1 – Physical Environment

Sea Level Monitoring
The network of weather stations and tide gauges around the Isle of Man is operated by the
Harbours Division, Meteorological Office and Works Division Electronics Section of the Isle of
Man Department of Infrastructure (figures 14 & 15). However, the tide gauge at Port Erin is
part of the UK network, owned and maintained by the UK National Oceanographic Centre
(formerly the Proudman Oceanographic Laboratory of the University of Liverpool), although
the 'bubbler' system is linked to the weather station which is also sited at the RNLI
boathouse at Port Erin. The DoI stations are all based on Campbell-Scientific data-loggers
with wind, temperature and rainfall sensors by various manufacturers. Apart from Port Erin,
the tide gauges employ submerged Druck pressure sensors mounted in stilling-tubes. The
gauges are all calibrated to the 'Douglas02' GPS datum, surveyed by the Design Services
Division of the DoT (see section below about datums). The value for gravitational
acceleration at the location of the Douglas tide gauge was provided by the British Geological
Survey and the Port Erin Marine Laboratory provided a long record of sea temperature and
salinity measurements. Water temperature is also measured in-situ at each of the gauges.
These factors enable conversion of the pressure sensor measurements to corresponding sea
water levels.

Figure 14. Location of coastal weather stations and tide gauges around the Isle of Man
(Laxey not currently installed).

Manx Marine Environmental Assessment – October 2013                                              20
MMEA Chapter 2.1 – Physical Environment

Douglas                                       Latitude: 54o 08' 50" N
                                              Longitude: 04o 28' 21" W
                                              Tide Gauge Datum: 0.00 m. (re-Douglas02)
                                              (Mid-tide sensor level)
                                              Admiralty Chart Datum: -3.77 m. (re-Douglas02)

Ramsey                                        Latitude: 54o 19' 07" N
                                              Longitude: 04o 22' 19" W
                                              Tide Gauge Datum: 0.00 m. (re-Douglas02)
                                              (Mid-tide sensor level)
                                              Admiralty Chart Datum: -3.94 m. (re-Douglas02)

Peel                                          Latitude: 54o 13' 35" N
                                              Longitude: 04o 41' 43" W
                                              Tide Gauge Datum: 0.00 m. (re-Douglas02)
                                              (Mid-tide sensor level)
                                              Admiralty Chart Datum: -3.03 m. (re-Douglas02)

Manx Marine Environmental Assessment – October 2013                                             21
MMEA Chapter 2.1 – Physical Environment
Latitude: 54o 05' 06" N
Port Erin
Longitude: 04o 46' 01" W
Tide Gauge Datum: +6.32 m. (re-Douglas02)
Mid-tide pressure outlet: +0.01m (re-Douglas02)
Admiralty Chart Datum: -3.03 m. (re-Douglas02)
Port St Mary Latitude: 54o 04' 15" N
Longitude: 04o 43' 58" W
Tide Gauge Datum: 0.00 m. (re-Douglas02)
(Mid-tide sensor level)
Admiralty Chart Datum: -3.32 m. (re-Douglas02)
Castletown Latitude: 54o 04' 22" N
Longitude: 04o 38' 53" W
Tide Gauge Datum: 0.00 m. (re-Douglas02)
(Mid-tide sensor level)
Admiralty Chart Datum: -3.87 m. (re-Douglas02)
Figure 15. Location of tide gauges around the Isle of Man.
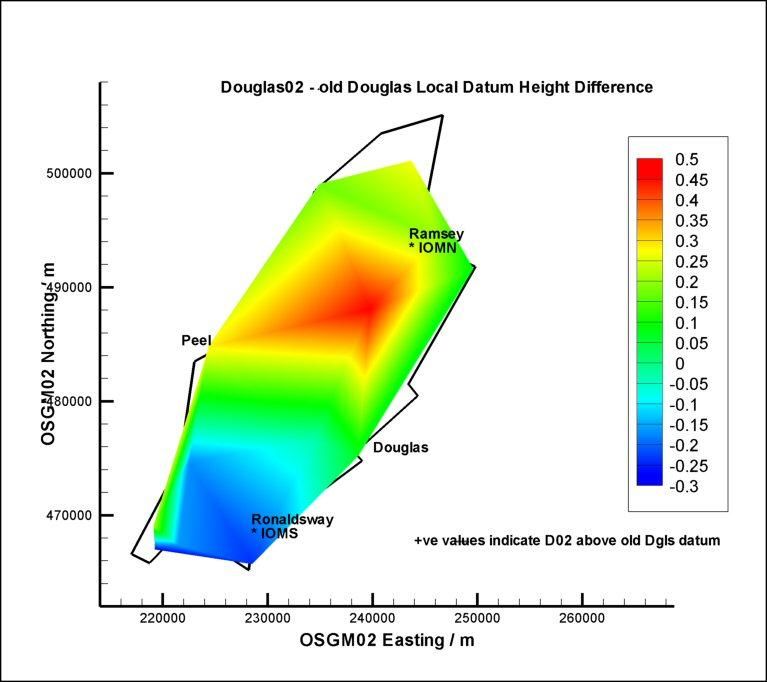
Manx Marine Environmental Assessment – October 2013 22MMEA Chapter 2.1 – Physical Environment Datum Considerations All of the tide gauges around the Island are primarily referenced to the GPS datum known as ‘Douglas02’. Local adjustments to Admiralty Chart Datum (ACD) can be made as required. Absolute vertical land movements and Ocean Tide Loading effects are small around the Isle of Man. For navigation purposes, sea water levels are traditionally measured to ‘Admiralty Chart Datum’ (ACD). However for flood defence purposes it is necessary to relate water levels to a land-based vertical datum. ACD is normally defined by the lowest astronomical tide level (LAT) expected in the area shown on the largest scale plan of a port or coastal region. Since the astronomical tidal range varies considerably around the Isle of Man and there are seven large scale maps, there exist seven ACDs, each with a different relationship to the Island’s land datum. Historically, most land datums are related to mean sea level (MSL). Prior to 2002, the Island’s survey datum was a physical benchmark cut into a pier at Douglas and levelled to mean sea level by a short period of measurements. This level was transferred geometrically around the Island. Fortunately, for most of the ports, a relationship can be traced between ACD and the original Douglas vertical datum, as transferred to the port. In 2002 a new vertical datum based on GPS measurement was adopted for the Island, known as Douglas02 (D02). Coordinates measured by GPS are primarily referenced to an earth-centred ellipsoid (WGS84). However, in order to maintain a relationship with traditional datums, the Ordinance Survey (OS) modelled a ‘best-fit’ surface to MSL around the British Isles using a very large number of gravity measurements. This surface can be related to WGS84 by a numerical transformation known as the OS Geoid Model 2002 (OSGM02). D02 is also defined by OSGM02, so the D02 GPS datum represents a ‘best-fit’ to MSL in this region. Since there is one ‘active GPS station’ on the Island, located at the Airport, D02 can be determined to an accuracy of a few cm across the whole Island. All of the tide gauges now installed around the Island measure water levels relative to the D02 datum. The principle of employing ‘mid-tide sensors’ located at the datum level is described in the UNESCO tide gauge manual (IOC, 2002). High resolution contour maps (at 0.1m intervals) for ‘areas at risk’ of coastal flooding have also been produced based on D02 levels. Figure 16 shows the relationship between the original Douglas vertical datum, as transferred around the Island, and the D02 GPS vertical datum. Manx Marine Environmental Assessment – October 2013 23
MMEA Chapter 2.1 – Physical Environment
Figure 16. Relationship between original Douglas vertical datum and D02.
Table 3. References to original survey datums, researched by Captain Ken Horsley and
Phil Manning of DoI.
The Original Benchmarks used to relate Admiralty Chart Datum (ACD) to the old IoM
Local Ordnance Datum, OD(L) Douglas, which is a benchmark on Peveril Steps.
Douglas: ACD is 1.96 metres below the Douglas Benchmark.
Ramsey: ACD is 9.87 metres below an Ordnance Survey Benchmark in Waterloo Road, which
is 6.13 metres above OD(L).
Peel: ACD is 8.02 metres below the Admiralty Benchmark on the Breakwater. The Benchmark
is 5.27 metres above OD(L).
Port Erin: ACD is 2.81 metres below OD(L). The 5.7m mark at the top of the Tidestaff is
actually 5.76m above ACD. A survey carried out by HMS Fox in 1972 mentions a "cut in a
block on the left side of the entrance to the jetty 100m W of Raglan Pier at 9.66m above
ACD.
Port St Mary: ACD is 8.67 metres below the Admiralty Benchmark on Alfred Pier. The
Benchmark is approximately 5.19 metres above OD(L).
No reference could be traced for Castletown or Laxey.
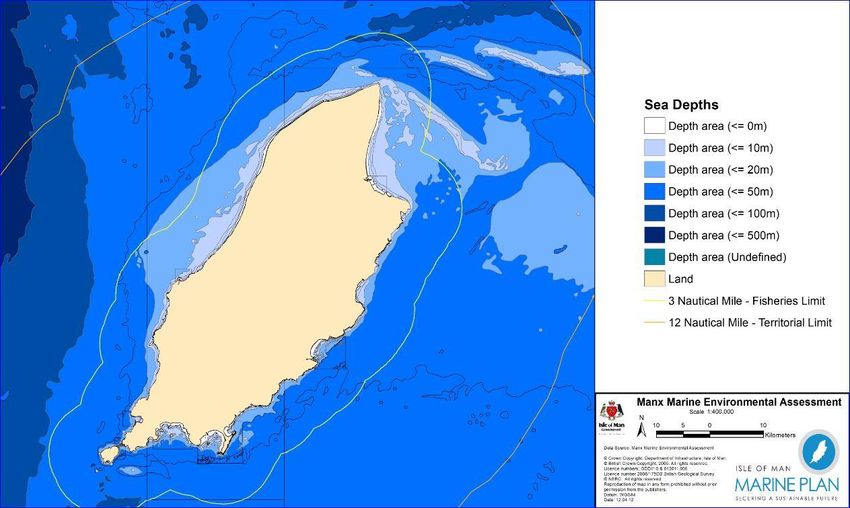
Manx Marine Environmental Assessment – October 2013 24MMEA Chapter 2.1 – Physical Environment Gravitational Surveys A calibration algorithm for the Island’s tide gauges was developed using a value of absolute gravity for the Douglas gauge provided by the British Geological Survey (BGS) and local measurements of salinity from the Port Erin Marine Laboratory. Earlier gravitational surveys of Manx Coastal Waters were also employed by the Ordnance Survey (OS) in relating the Douglas02 GPS datum to the British Isles Geoid Model (OSGM02). Coastal Erosion While much of the Island’s coast consists of cliffs and rocky outcrops which are subject to very slow erosion on a geological timescale, the sandy cliffs from north of Peel, around Point of Ayre, to Ramsey are subject to much more rapid erosion processes. Also, until recently, the beach near Gansey was subject to erosion but this appears to have been controlled by civil engineering works. Reports on erosion around the west and north coasts of the Island have been produced by Jolliffe (1981) and Posford Duvivier (2000). An estimate of current erosion rates was produced by the latter and is reproduced in figure 17. Figure 17. Plan showing average rates of coastal erosion (from Posford Duvivier, 2000). Manx Marine Environmental Assessment – October 2013 25
MMEA Chapter 2.1 – Physical Environment

Weather and Climate
Due to the influence of the surrounding Irish Sea, the Island's climate is temperate and
lacking in extremes.
Winters are generally mild and wet, and snowfall and frost are infrequent. Even when snow
does occur, it rarely lies on the ground for more than a day or two. February is normally the
coldest month, with an average daily temperature of 4.9 C (41 F), but it is often relatively
dry.
The prevailing wind direction for most of the Island is from the Southwest, although the
rugged topography means that local effects of shelter and exposure are very variable.
In summer, April, May and June are the driest months whilst May, June and July are the
sunniest. July and August are the warmest months, with an average daily maximum
temperature around 17.6 C (63 F). The highest temperature recorded at the Island's
weather centre at Ronaldsway is 28.9 C or 84 F. Thunderstorms are rare.
Although geographically small, there is climatic variation around the Island. Sea fog affects
the south and east coasts at times, especially in spring, but is less frequent on the west
coast. Rainfall and the frequency of hill fog both increase with altitude. The highest point of
the Island (Snaefell) receives some two and a quarter times more rainfall than the northern
plain and the lowland in the south. At Ronaldsway, on the southeast coast, the annual
average is 863 mm (34 inches).

Table 4: Climatological information for Ronaldsway Airport. Precipitation includes rain,
hail and snow. (Please note that averaging periods may be different when comparing
various locations.)
    Month                     Mean Temperature 0C            Total Precipitation (mm)   Mean Wind Speed
                                                                                             (mph)
                   Daily Minimum            Daily Maximum

     Jan                3.4                         7.7               86.0                   17.9

     Feb                2.9                         7.4               60.0                   17.4

     Mar                3.8                         8.7               65.6                   15.8

     Apr                4.9                     10.7                  55.7                   13.3

     May                7.2                     13.7                  50.3                   12.2

     Jun                9.8                     16.1                  54.8                   11.3

     Jul               11.7                     17.7                  56.3                   10.8

     Aug               11.9                     17.7                  67.7                   11.4

     Sep               10.7                     16.0                  80.3                   13.2

     Oct                8.8                     13.4                  96.5                   15.4

     Nov                5.9                     10.5                  97.5                   16.7

     Dec                4.4                         8.7               93.8                   17.7

Manx Marine Environmental Assessment – October 2013                                                       26
MMEA Chapter 2.1 – Physical Environment
Weather stations
Although a Met Office existed at Ronaldsway during World War II, data from that time is not
available. Records have been maintained since the civil aerodrome was established in
1946/7. Meteorological instruments used at Ronaldsway are subject to regular calibration by
the UK Met Office to ensure accuracy and consistency of the data recorded.
Instruments used at Douglas climatological station are also regularly inspected by the UK
Met Office. Calibrated instruments were also employed at Point of Ayre lighthouse from
1935 to 1999 when 3-hourly observations were completed by the lighthouse keepers, and
for a shorter period at the summit of Snaefell, where readings were recorded by CAA
engineers.
In recent years a network of more than thirty automatic weather stations has been
developed by the Department of Infrastructure, with collaboration from the Water and
Sewerage Authority (figure 18).
Figure 18: Location of weather stations around the Isle of Man.
Manx Marine Environmental Assessment – October 2013 27MMEA Chapter 2.1 – Physical Environment
Ronaldsway Meteorological Office
Ronaldsway Meteorological Office is the National Meteorological Service (NMS) for the Isle of
Man. A continuous weather record has been maintained since 1946. Climate records for
several other sites around the Island are also kept. A full weather forecasting service is
provided for the Island, including aviation and marine forecasts and warnings of severe
weather.
Regular weather observations are made to standards formulated by the World
Meteorological Organisation (WMO) and International Civil Aviation Authority (ICAO), which
are both agencies of the United Nations. There exists a formal agreement with the UK Met
Office and the Jersey Meteorological Department and contacts have been established with
many other NMSs around the world, mainly through the Conference of Commonwealth
Meteorologists and the Royal Meteorological Society.
The office operates 24 hours a day, 7 days a week, with a full forecasting and observing
watch and provides a range of services to the local community, many Government
Departments, transport and utility services, agriculture and fishing, the local media and
many sports and leisure organisations as well as to aviation. Warnings of severe or specific
weather events are also provided to many customers and to the Manx public in general.
A Forecaster is on duty 24 hours each day, with one observer/support staff member on duty
during the busier part of the day.
A selection of meteorological services provided is listed below:
Hourly observations provided every hour throughout the year in SYNOP code,
disseminated globally as part of the WMO World Weather Watch programme.
Routine and Special weather reports provided to Air Traffic Control throughout
Airport opening hours and disseminated globally in METAR code.
Aerodrome weather forecasts produced and disseminated in TAF and TREND code.
Measurements of climate data recorded for periods 0900-2100 and 2100-0900 UT
daily, in accord with WMO standards.
Warnings of adverse or severe weather provided to the Airport, DoI divisions,
emergency services and many other recipients.
Forecasts provided ‘live’ on Manx Radio around 0600, 0700, 0800, 0900, 1700 and
2300 daily, supplemented by summary forecasts read out by news and programme
presenters.
Recorded telephone forecasts for the Island and North Irish Sea and a direct line to
the duty forecaster via Manx Telecom Premium services.
Shipping forecasts for the North Irish Sea and the Isle of Man section of the BBC
Inshore Waters forecast.
FloodWatch service providing warnings of rainfall and coastal flooding.
Forecasts on web sites for WMO, IoM Government and local media.
Manx Marine Environmental Assessment – October 2013 28MMEA Chapter 2.1 – Physical Environment Climatology Wind Figure 19 shows a wind frequency diagram for Ronaldsway Airport. The diagram, commonly known as a ‘wind rose’, is compiled from observations of hourly mean wind speed and direction for the period 1966 to 2007. The wind speed data is divided into the intervals shown in the colour key then plotted, with the length of each ‘spoke’ section proportional to observation frequency, in the corresponding direction segment. The diagram indicates that the prevailing winds come from a SW’ly direction. The wind sensors at Ronaldsway are mounted at the international standard of 10 metres above ground level (considered sufficient elevation above the friction and turbulence created by proximity to the ground surface). Average wind speed measured around 10 metres above ground generally increases with altitude, hence the frequency of strong winds and gales is much higher at Snaefell than at Ronaldsway or Point of Ayre. The wind at Ronaldsway reaches gale force (a mean speed greater than 34 knots sustained for more than 10 minutes) on an average of 17 days per year (almost half occurring during December and January). The rugged topography of the Island also has significant effects on local winds in certain directions. Temperature in the atmosphere normally decreases with altitude. However, sometimes warmer air can overlay cooler air near the surface (known as a ‘temperature inversion’). When such an ‘inversion’ occurs close to the hilltops, the wind can be accelerated down the lee (downwind) slopes, sometimes generating ‘rotors’ and turbulence close to the coast on the lee side of the Island. In certain conditions and locations, the wind close to the coast can have sufficient downward component to ‘flatten’ and occasionally ‘dismast’ yachts (as has occurred in Ramsey Bay in SSW’ly airstreams and south of Niarbyl in E’ly winds). Wind speeds also generally increase with altitude above the ground or sea surface. The AEA Report (2010) indicates that the Isle of Man has offshore wind speeds of between 7ms-1 and 10ms-1 at 100m above ground level. Manx Marine Environmental Assessment – October 2013 29
MMEA Chapter 2.1 – Physical Environment

                              Figure 19: Wind frequency diagram for Ronaldsway.

Temperature
Temperatures around the Island are generally moderated by the surrounding Irish Sea.
Summer daytime temperatures and winter night time temperatures are less extreme than
can be experienced on the larger islands to east and west. The highest temperature
recorded at the Island's weather centre at Ronaldsway is 28.9 C (84 F) and mean monthly
maximum and minimum temperatures are shown in Table 4.
At Ronaldsway, air temperature and humidity is recorded hourly, as well and maximum and
minimum temperatures during the periods 0900-2100UT and 2100-0900UT each day.
Minimum ground temperatures each night are also recorded over grass and concrete
surfaces, as well as sub-surface temperatures at depths of 30cm and 100cm at 0900UT each
morning.
Figure 20 shows the annual mean air temperature recorded at Douglas since 1878.
Temperatures generally decrease with altitude around the Island.
               Temp / deg C

                                                  Year
        Figure 20: Annual mean air temperature recorded at Douglas since 1878 .

Manx Marine Environmental Assessment – October 2013                                                   30
MMEA Chapter 2.1 – Physical Environment
Precipitation
Rainfall has been measured twice daily (0900-2100 and 2100-0900 UT) at Ronaldsway since
1947 and records for Douglas date back to 1870 (since 1909 at the Cemetery site). There
have been many rain gauges operated for shorter periods at various sites around the Island
and data from all of the reliable records has been combined to produce the average annual
rainfall map in figure 21. As can be seen from the figure 21, rainfall generally increases with
altitude, with the highest ground receiving more than twice the rainfall than the north and
south coast al plains. Days with snow or hail falling, and lying snow, are also recorded at
Ronaldsway. Average monthly precipitation for Ronaldsway is shown in Table 4.
Figure 21. Annual average rainfall across the Isle of Man.
Manx Marine Environmental Assessment – October 2013 31MMEA Chapter 2.1 – Physical Environment
Solar Radiation
Sunshine hours have been measured daily at Ronaldsway since 1949 using a Campbell-
Stokes recorder. Similar recorders have been used for shorter periods at Point of Ayre
lighthouse and at Douglas Borough Cemetery. A Kipp and Zonen solar radiation sensor was
installed at Ronaldsway in 2006.
Since the Island often generates cloud by uplift of moist airstreams traversing the Irish Sea,
cloud cover and hill fog generally increase inland, with a consequent reduction in sunshine
hours and solar radiation reaching the ground. The data provided was obtained at
Ronaldsway, a coastal location, and it is likely that values will be a little higher further
offshore.
Table 5. Sunshine hours and solar radiation data recorded at Ronaldsway.
Global Radiant
Month Mean Sunshine Global SW Radiation Exposure
Hours KW/m2 KWh/(m2*month)
Jan 50.4 65.0 18.1
Feb 69.6 132.0 36.7
Mar 107.6 287.0 79.7
Apr 169.1 477.0 132.5
May 224.7 620.0 172.2
Jun 205.1 638.0 177.2
Jul 193.8 605.0 168.1
Aug 186.2 435.0 120.8
Sep 136.0 330.0 91.7
Oct 101.1 187.0 51.9
Nov 62.9 84.0 23.3
Dec 40.9 52.0 14.4
Annual 1547.4 3912.0 1086.7
Manx Marine Environmental Assessment – October 2013 32MMEA Chapter 2.1 – Physical Environment Visibility Visibility around the Isle of Man is generally very good, especially in cold airstreams arriving from between west, through north, to northeast. In such conditions, the surrounding coasts and mountains of Ireland, Scotland, England and Wales are often clearly visible. Visibility in wind directions from between east and southeast usually bring moderate visibility (5 to 10km or sometimes less) due to suspended smoke and dust particles from industrial and urban sources collected by airstreams traversing England and northern Europe. Airstreams arriving from directions between south and southwest can bring variable visibility: generally good but often reduced by precipitation. Visibility can also be reduced at times due to suspension of sea spray droplets in the air during severe or prolonged storms. Sometimes, warm moist air moving over the cooler waters of the Irish Sea can suffer condensation in the near-surface layers, producing mist or fog with poor or very poor visibility. The seasonal sea surface temperature distribution (see section below) has an effect on the local climate, with sea and coastal fog more prevalent around the south and east of the Island in spring and early summer, but around the west and north in summer and early autumn. Sea and coastal fog can affect the safety and operation of marine and air transport, with effects on the Island’s economy through supply disruption and delays for business and tourist travellers. A recent publication (Hisscott, 2006) investigated trends in seasonal occasions of fog at Ronaldsway. Since much of the fog which affects the Island forms or advects over the adjacent sea, the available data for fog affecting the Island has been compared with air and sea temperatures. The air temperature over the Island generally exceeds the temperature of the surrounding sea for almost half of the year but the sea naturally maintains a higher temperature than the atmosphere through the colder part of each year. Different trends in fog climatology have been found depending on season. Records of days with fog at Ronaldsway have been compared with air and sea temperature data for the period from 1947 to 2004. The data has been divided into the two six-month periods for which the air-sea temperature difference is either generally positive or negative. With high ground reaching over 600m AMSL at the highest point (Snaefell), the Island’s rugged terrain means that on clear nights with little pressure gradient and light winds there is usually katabatic flow (cold air flowing down towards the coast) so the formation of radiation fog is rare. Hill fog is fairly common and can sometimes become extensive. However, fog affecting low-lying and coastal areas (such as Ronaldsway Airport on the southeast coast) usually develops in warm sectors or frontal zones. Consequently, advection and the sign and magnitude of the air-sea temperature difference are physically important to the process of fog formation. Manx Marine Environmental Assessment – October 2013 33
MMEA Chapter 2.1 – Physical Environment

The number of days with fog observed at Ronaldsway since 1947 is closely correlated with
the difference in air temperature measured there and the sea temperature measured at Port
Erin (figures 8 & 20). The air and sea temperatures have been generally increasing since the
mid-1980s much in line with global average temperatures. On a seasonal basis, both the air-
sea temperature difference and the occurrence of fog have been increasing in summer since
the mid-1970s. Conversely, the sea-air temperature difference and number of days with fog
in winter have decreased during the period, especially during the earlier part of the record.

                                   35

                                   30
         Number of Days with Fog

                                   25

                                   20

                                   15

                                   10

                                    5

                                    0
                                        1950   1960   1970      1980     1990       2000
                                                             Year

Figure 22. Number of days with fog at Ronaldsway. Summer (red) and winter (blue).

Mean daily data from the Meteorological Office at Ronaldsway for 2011 has been compiled
from hourly records and summarised as the average visibility per month (figure 23) showing
an average visibility of 23km across the year (for reference the 12 nautical mile/22km
territorial limit is included). Summer months have the highest average visibility, with a peak
in December/January.

Manx Marine Environmental Assessment – October 2013                                                           34
MMEA Chapter 2.1 – Physical Environment
Average visibility (km)
Month (2011)
monthly average
vis
Figure 23: Average monthly visibility data compiled from hourly visibility data
(Ronaldsway Met Office).
Average daily data shows that there were 185 days (51%) in 2011 where visibility extended
as far as the territorial limit, 101 days (28%) where visibility was up to 30km, 22 days (6%)
of 40km visibility and only 3 days (0.8%) of 50km visibility.
outside Manx
waters
inside Manx
water
visibility (km)
Territorial limit
no of days
Figure 24: 365 days of visibility data for 2011 showing number of days where certain
distances were visible.
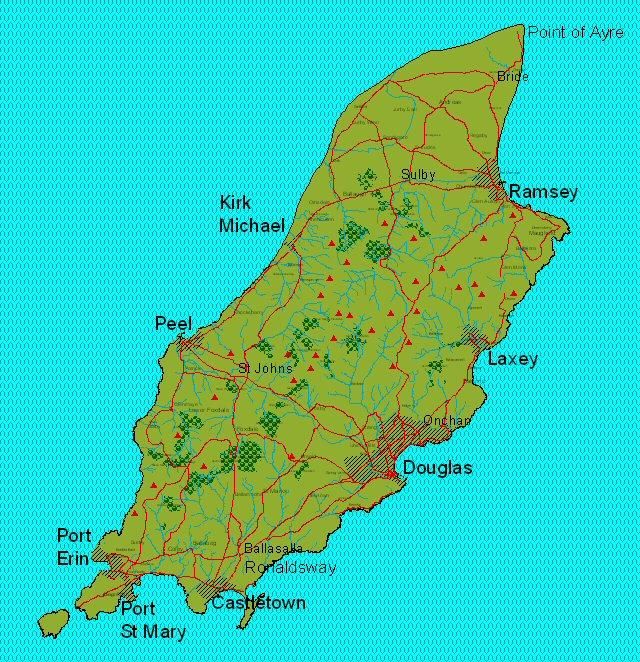
Manx Marine Environmental Assessment – October 2013 35MMEA Chapter 2.1 – Physical Environment Storm Surges Sea water level around the Island’s coast is influenced by both tides and weather conditions. Whereas the tides are predictable for quite long periods ahead, the effect of weather is only predictable for a few days or sometimes hours ahead. At any time, both the tidal and weather components contribute to the sea water level at any place. The times and heights of high and low water around the Island are largely determined by the relative motions of the Earth, Moon, and Sun. Basically, as the Earth rotates about it’s axis each day, the gravitational attraction of the Moon causes elevation in sea level (actually two ‘bulges' in sea level, one beneath the Moon and one on the opposite side of the Earth, so that, as the Earth rotates in 24 hours, most places see two tidal cycles per day). However, since the Moon also rotates around the Earth in the course of a (lunar) month, the time between successive high waters at any place is usually a little more than 12 hours. The gravitational attraction of the Sun causes a similar (but lesser) effect which can add to or subtract from the effect of the Moon. When the gravitational forces of the Moon and Sun are aligned to act on the Earth’s oceans (at times of ‘new Moon’ and ‘full Moon’), we see large amplitude ‘spring tides’ but when those forces are perpendicular (and acting at crossed purposes) we see smaller amplitude ‘neap tides’. The relative motion of the Earth, Moon and Sun can be predicted for many years ahead. So, ‘astronomical’ tidal predictions can be produced for several years ahead (as published in ‘tide tables’). However, such predictions ignore the effects of the weather on the oceans; the calculations assume ‘average’ atmospheric pressure (1013mb or 29.92 inches of mercury) over the whole Earth surface and that there is no wind. The effect of areas of high pressure in the atmosphere is to depress sea level and, conversely, areas of low pressure cause elevation of sea level. Also, strong winds can generate currents in the seas and oceans and cause variations in water level. The combined effects of low air pressure and strong wind is known as ‘storm surge’. So, for coastal waters around the Isle of Man, weather conditions over the British Isles, Northwest Europe and the eastern North Atlantic can affect the actual tidal levels reached on any particular day. In strong wind conditions, ‘storm surges’ can add to (or subtract from) the predicted ‘astronomical’ tidal level (sometimes the 'weather' effect can be more than a metre). Our coastal defences are normally adequate for protection from the highest ‘astronomical’ tide levels but if a storm surge occurs on top of a large spring tide, parts of the Island can be susceptible to coastal flooding. In locations exposed to strong onshore winds, waves and swell can exacerbate coastal flooding problems. The highest astronomical tides occur around the equinoxes (21st March and 22nd September each year). Strong winds and storms occur more frequently in the winter months. So tidal flooding is more likely to occur October to April but there is also a risk in August and September. Manx Marine Environmental Assessment – October 2013 36
MMEA Chapter 2.1 – Physical Environment

Storm surge on 1st February 2002
On 1st February 2002 a deep low pressure system west of Ireland brought strong SW’ly
winds and caused a storm surge in the Irish Sea. The graph (figure 23(a)) shows how the
weather-induced effect (red line) added to the 'astronomical' tidal component (blue line) to
produce a total sea water level (green line) which reached more than a metre above the
astronomical tidal prediction for high water around most of the Island’s coast. Serious
flooding occurred in many towns and there was significant damage to some coastal
defences.
The grey 'flood level' line on the graph indicates the height of the lowest part of the
quayside around Douglas Harbour, or the level at which water begins to flood over the
harbour edge. Most of the Island's sea defences are built to levels above normal
astronomical tides but, as the graph shows, the combination of a storm surge and a spring
tide caused flooding around many parts of the coast. The map of Douglas Harbour (25(b))
shows the extent of flooding on 1st February 2002 (darker blue areas). It should be noted
however, that HW on that day was not the largest that we get and neither was the surge
(the wind could have been stronger and/or the pressure lower).
Horsburgh et al. (2011) investigated whether differences in timing of the weather system
with respect to the tide could have changed the severity of the event. They found that the
event did represent close to a worst case. If the weather system had been advanced by 2
hours then a further 6cm of sea level would have been observed. Also, the astronomical tide
was not the highest which might be expected.

Manx Marine Environmental Assessment – October 2013                                             37
MMEA Chapter 2.1 – Physical Environment
Sea Level in Douglas 1st Feb 2002
Water Level / m ACD
Tide
Surge
Time UTC
Figure 25: (a, top) Diagram of sea water levels at Douglas on 1st February 2002. (b,
bottom) ‘Area at risk’ map for Douglas corresponding to the water level reached on that
day.
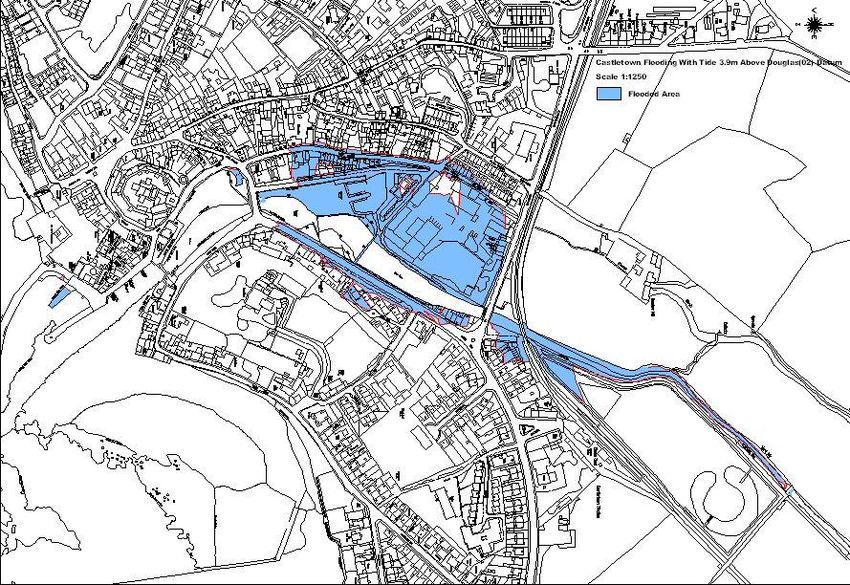
Manx Marine Environmental Assessment – October 2013 38MMEA Chapter 2.1 – Physical Environment Development of ‘FloodWatch’ warning system Following the 2002 event, a Joint Working Group was established by the Department of Transport (now Infrastructure) which led to the development of a flood warning system for the Island (http://www.gov.im/transport/floodwatch/), for both tidal and rainfall flooding events. The tidal flood warning component of this service (provided by Ronaldsway Met Office) uses data from the CS3 numerical surge model developed by the Proudman Oceanographic Laboratory and operated by the UK Met Office as part of the operational suite of weather forecast numerical models. Such surge level predictions are combined with ‘astronomical ‘ tidal predictions and Forecasters’ local knowledge to predict a likely flood water level. High resolution ‘area at risk’ maps have been produced (by Department of Infrastructure surveyors) for all parts of the Island know to be susceptible to flooding. The predicted water level can be correlated with the appropriate maps to enable DoI Operations and emergency services managers to optimise their use of resources to deal with each event. Figure 26(a) shows an example of CS3 surge model output and figure 26(b) shows as ‘area at risk’ map for Castletown corresponding to the water level reached on 1st February 2002. Figure 26 (a): Example of CS3 surge model data for Manx Coastal waters. Figure 26 (b). ‘Area at risk’ map for Castletown corresponding to sea water level 3.9 metres above D02. Manx Marine Environmental Assessment – October 2013 39
MMEA Chapter 2.1 – Physical Environment

River Flow Monitoring
As part of development of a flood strategy for the Island, upland rain gauges and river flow
monitoring stations have been developed. The Water and sewerage Authority have also
used LIDAR mapping for the main river valleys and developed flow models for the main
rivers. These models are able to provide estimates of the mean and peak river discharges at
the river mouths.

Tsunami flood risk
The event on 26th December 2004 which brought devastation to coastal areas of south Asia
raised public awareness around the world to the dangers of tsunami. Tsunami is the
Japanese word for a chain of fast moving waves caused by sudden trauma in the ocean,
such as underwater earthquakes, landslides or volcanic eruptions. Tsunamis are most
common around the Pacific where more than half the world's volcanoes are found. The US
National Weather Service Pacific Tsunami Warning Center (PTWC) is responsible for
providing warnings to international authorities.
Although it is highly unlikely that a similar event might affect the British Isles, the UK
Department for Environment, Food and Rural Affairs (DEFRA) commissioned a report on
tsunami risk, "The threat posed by tsunami to the UK". This research was a collaboration
between the British Geological Survey, the Proudman Oceanographic Laboratory, the Met
Office and H R Wallingford.
Despite the very small probability of occurrence, it is likely that a Tsunami Warning Service
will be developed for the UK and, when available, information relevant to the Isle of Man will
be incorporated into the FloodWatch warning system.
For the Isle of Man, in the extremely unlikely possibility that a tsunami might reach our
shores, it would probably not affect areas any more widespread than a significant storm
surge. However, a tsunami event would be different in that it would not be related to
meteorological conditions and might occur at any time of the year.

Manx Marine Environmental Assessment – October 2013                                              40
You can also read