On the isolation of OC and EC and the optimal strategy of radiocarbon-based source apportionment of carbonaceous aerosols
←
→
Page content transcription
If your browser does not render page correctly, please read the page content below
Atmos. Chem. Phys., 12, 10841–10856, 2012
www.atmos-chem-phys.net/12/10841/2012/                                                                     Atmospheric
doi:10.5194/acp-12-10841-2012                                                                                Chemistry
© Author(s) 2012. CC Attribution 3.0 License.                                                              and Physics

On the isolation of OC and EC and the optimal strategy of
radiocarbon-based source apportionment of carbonaceous aerosols
Y. L. Zhang1,2,3 , N. Perron2,* , V. G. Ciobanu2 , P. Zotter2 , M. C. Minguillón2,4 , L. Wacker5 , A. S. H. Prévôt2 ,
U. Baltensperger2 , and S. Szidat1,3
1 Department    of Chemistry and Biochemistry, University of Bern, Freiestrasse 3, 3012 Bern, Switzerland
2 Paul  Scherrer Institute (PSI), Villigen, Switzerland, 5232 Villigen, Switzerland
3 Oeschger Centre for Climate Change Research, University of Bern, 3012 Bern, Switzerland
4 Institute of Environmental Assessment and Water Research (IDAEA), CSIC, 08034 Barcelona, Spain
5 Laboratory of Ion Beam Physics, ETH Hönggerberg, 8093 Zürich, Switzerland
* now at: Devision of Nuclear Physics, Lund University, 22100 Lund, Sweden

Correspondence to: S. Szidat (szidat@iac.unibe.ch)

Received: 27 June 2012 – Published in Atmos. Chem. Phys. Discuss.: 18 July 2012
Revised: 12 October 2012 – Accepted: 12 November 2012 – Published: 16 November 2012

Abstract. Radiocarbon (14 C) measurements of elemental              charring. The Swiss 4S protocol involves the following con-
carbon (EC) and organic carbon (OC) separately (as op-              secutive four steps (S1, S2, S3 and S4): (1) S1 in pure oxy-
posed to only total carbon, TC) allow an unambiguous quan-          gen (O2 ) at 375 ◦ C for separation of OC for untreated filters
tification of their non-fossil and fossil sources and repre-        and water-insoluble organic carbon (WINSOC) for water-
sent an improvement in carbonaceous aerosol source appor-           extracted filters; (2) S2 in O2 at 475 ◦ C followed by (3) S3
tionment. Isolation of OC and EC for accurate 14 C deter-           in helium (He) at 650 ◦ C, aiming at complete OC removal
mination requires complete removal of interfering fractions         before EC isolation and leading to better consistency with
with maximum recovery. The optimal strategy for 14 C-based          thermal-optical protocols like EUSAAR 2, compared to pure
source apportionment of carbonaceous aerosols should fol-           oxygen methods; and (4) S4 in O2 at 760 ◦ C for recovery of
low an approach to subdivide TC into different carbonaceous         the remaining EC.
aerosol fractions for individual 14 C analyses, as these frac-         WINSOC was found to have a significantly higher fossil
tions may differ in their origins. To evaluate the extent of pos-   contribution than the water-soluble OC (WSOC). Moreover,
itive and negative artefacts during OC and EC separation, we        the experimental results demonstrate the lower refractivity
performed sample preparation with a commercial Thermo-              of wood-burning EC compared to fossil EC and the diffi-
Optical OC/EC Analyser (TOA) by monitoring the optical              culty of clearly isolating EC without premature evolution.
properties of the sample during the thermal treatments. Ex-         Hence, simplified techniques of EC isolation for 14 C analy-
tensive attention has been devoted to the set-up of TOA con-        sis are prone to a substantial bias and generally tend towards
ditions, in particular, heating program and choice of carrier       an overestimation of fossil sources. To obtain the compre-
gas. Based on different types of carbonaceous aerosols sam-         hensive picture of the sources of carbonaceous aerosols, the
ples, an optimised TOA protocol (Swiss 4S) with four steps          Swiss 4S protocol is not only implemented to measure OC
is developed to minimise the charring of OC, the premature          and EC fractions, but also WINSOC as well as a continuum
combustion of EC and thus artefacts of 14 C-based source ap-        of refractory OC and non-refractory EC for 14 C source ap-
portionment of EC. For the isolation of EC for 14 C analy-          portionment. In addition, WSOC can be determined by sub-
sis, the water-extraction treatment on the filter prior to any      traction of the water-soluble fraction of TC from untreated
thermal treatment is an essential prerequisite for subsequent       TC. Last, we recommend that 14 C results of EC should in
radiocarbon measurements; otherwise the non-fossil contri-          general be reported together with the EC recovery.
bution may be overestimated due to the positive bias from

Published by Copernicus Publications on behalf of the European Geosciences Union.
10842                             Y. L. Zhang et al.: Isolation of OC and EC for radiocarbon-based source apportionment

1   Introduction                                                    oxidise the remaining material, assumed to contain the entire
                                                                    EC fraction. Differentiation between OC and EC relies on
Carbonaceous aerosols are of worldwide concern due to their         the prerequisite that these components can be distinguished
effects on climate and air quality (Highwood and Kinners-           by their volatilization and oxidation properties. However, OC
ley, 2006; Mauderly and Chow, 2008). The total carbon (TC)          can partially be converted into EC through a pyrolysis (Ca-
content of this highly variable mixture, made of extremely          dle et al., 1980) during the inert step, which induces a pos-
different and mainly unidentified compounds (Turpin et al.,         itive artefact in the determination of EC in the second step.
2000) is usually divided into two sub-fractions: weakly re-         Because of this process, known as charring, OC may be un-
fractory and light polycyclic or polyacidic hydrocarbons (or-       derestimated and EC may be overestimated. The correction
ganic carbon, OC) and strongly refractory and highly poly-          of charring in TOA method is applied by continuously mon-
merized carbon (elemental carbon, EC), which is also des-           itoring the transmittance or reflectance of the sample filter
ignated as black carbon (BC) (Castro et al., 1999; Pöschl,         during analysis (Birch and Cary, 1996; Chow et al., 2001).
2005). Particulate EC derives from incomplete combustion            The OC-EC split is generally defined as the point where the
of fossil fuels and biomass, whereas OC originates from ei-         transmittance or reflectance level returns to its initial level
ther primary emissions or secondary organic carbon (SOC)            after a transient reduction of the laser response due to OC
formation (Pöschl, 2005). Since OC and EC play decisive but        charring. The remaining carbon after the split point during
different roles in the global climate and on human health, as-      the oxidative mode is regarded as EC.
sessing their respective source strengths is needed for a bet-         Huang et al. (2006) developed a method to measure
ter understanding of their influences as well as for efficient      13 C/12 C ratios of individual carbon fractions of airborne par-

abatement strategies. Such a source apportionment can be            ticular matter from filter samples using a TOA OC/EC anal-
performed by measuring the radiocarbon (14 C) content of OC         yser coupled with an isotopic ratio mass spectrometer (GC-
and EC separately, which provides direct and additional in-         IRMS). However, such TOA methods have not yet been ap-
formation about their contemporary and fossil sources (Cur-         plied to isolate EC and OC for 14 C analysis. The largest chal-
rie, 2000; Szidat, 2009; Szidat et al., 2009).                      lenge is to define a split point between OC and EC for indi-
   Since both fractions differ in their origins and processes,      vidual isolation of both fractions. The split point between OC
they often show very different 14 C signatures (Szidat et al.,      and EC in conventional TOA protocols (such as EUSAAR 2,
2004b, 2006, 2007; Szidat, 2009). Therefore, the 14 C-based         NIOSH and IMPROVE) cannot be directly used for separa-
source apportionment method requires a clear and physical           tion of the desired carbon fractions for 14 C measurement, be-
separation between OC and EC; however, this is not trivial.         cause it does not provide a chemical boundary between OC
Indeed, the distinction between OC and EC is based on a con-        and EC. Indeed, the split between charred OC and EC relies
ceptual and operational definition and does not correspond in       notably on the assumptions that both materials present the
reality to a clear boundary. On the one hand, OC compounds          same mass absorption efficiency or that charred OC evolves
become more chemically refractory and optically absorbing           completely before EC oxidation starts, both of which have
with increasing molecular weight. On the other hand, EC             been reported not to be the case for most samples (Yang and
also presents a continuum (Elmquist et al., 2006), the least        Yu, 2002; Bond and Bergstrom, 2006). Therefore, the car-
refractory part of which may show a chemical and physical           bonaceous material evolved after the split point with conven-
behaviour similar to high-molecular-weight OC compounds.            tional TOA protocols, albeit quantified as EC, may contain a
Consequently, thermal separation of OC and EC may suffer            mix of EC and charred OC and is therefore inappropriate for
from untimely EC removal (Andreae and Gelencsér, 2006),            14 C analysis of EC. Consequently, a main difficulty consists

described as the negative EC artefact. These losses are par-        in achieving complete OC removal before EC isolation.
ticularly enhanced for wood-burning-impacted samples be-               In an effort to reduce both above-mentioned artefacts, es-
cause of the presence of inorganic combustion catalysts (No-        pecially charring, Cachier et al. (1989) replaced the evapo-
vakov and Corrigan, 1995) and of the lower refractivity of          ration step by the combustion of OC in pure oxygen (O2 ).
the wood-burning EC compared to fossil EC (Elmquist et al.,         This two-step combustion method was further optimised
2006).                                                              for OC and EC quantification by Lavanchy et al. (1999)
   The classification of OC and EC is widely acknowledged,          and then adapted to a Two-step Heating system for the
but their boundary is still not clear and highly operational-       EC/OC Determination Of Radiocarbon in the Environment
dependent (Schmid et al., 2001; Pöschl, 2005). Among               (THEODORE, Szidat et al., 2004a), which was then adopted
the commonly accepted OC/EC determination methods, the              by many other laboratories (e.g. Zhang et al., 2010; Calzo-
thermal-optical analysis (TOA) method is one of the most            lai et al., 2011). A technique with chemo-thermal oxidation
well-known techniques (Schmid et al., 2001; Chow et al.,            at 375 ◦ C in air (CTO-375) is also commonly applied to de-
2004; Phuah et al., 2009; Cavalli et al., 2010). It typically be-   termine EC or BC (Gustafsson et al., 2001) and isolate EC
gins with a heating step in an inert (i.e. helium) atmosphere,      from aerosols for subsequent off-line radiocarbon analysis
aiming at evaporating OC exclusively. An oxidative gas (e.g.        (Zencak et al., 2007). Compared to methods based on OC re-
2 % oxygen in helium) is then introduced in a second step to        moval in an inert atmosphere, both the two-step combustion

Atmos. Chem. Phys., 12, 10841–10856, 2012                                           www.atmos-chem-phys.net/12/10841/2012/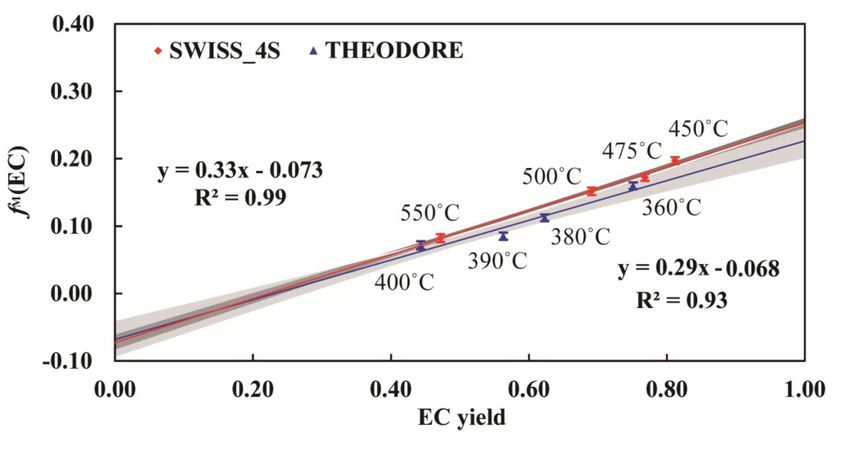
Figures
Y. L. Zhang et al.: Isolation of OC and EC for radiocarbon-based source apportionment                                          10843

method and the CTO-375 method are less prone to charring
and inadvertent inclusion of any other non-pyrogenic carbon.
It should be noted that the pre-treatment step of the water ex-
traction is introduced in the THEODORE method to reduce
charring further. However, both methods may also remove
substantial amounts of non-refractory EC (non-rEC) during
the thermal treatment, so that the isolated EC much likely
reflects only the most refractory EC (rEC) and cannot fully
represent the total EC (tEC) spectrum.
   Therefore, these thermal methods do not enable the full
                                                                    Fig. 1. Set-up of coupling the OC/EC analyser (Sunset) to the cryo-
quantification of the positive and negative EC artefacts dueFig. 1. genic traps.
to charring and premature EC removal. As wood-burning EC
was reported to be the least refractory EC fraction (Elmquist
et al., 2006), parts of it may have been oxidized during the        original filter at 650 ◦ C during 12 min in the THEODORE
OC step, leading to an underestimation of this EC fraction.         system and recovering the CO2 as described above. For OC
This could be especially crucial in areas where a lot of EC         samples, the combustion temperature is set to 340 ◦ C for
is due to biomass burning, as in the Alpine valleys, where          10 min. For EC isolation, water-extracted filters are heated
residential heating is important (Szidat et al., 2007; Lanz et      for four hours in air at a certain temperature (e.g. 375 ◦ C)
al., 2010).                                                         to remove the remaining OC. The remaining material on
   In this study, we present an optimised procedure for the         the filters is regarded as EC and combusted totally in the
isolation of OC and EC for 14 C analysis, based on thermo-          THEODORE system at 650 ◦ C.
optical OC/EC analysis. We qualitatively define EC and OC
as the sub-fractions of TC that do and do not absorb light          2.2 Setup of thermo-optical methods with the OC/EC
at the wavelength of thermal-optical OC/EC analysers (e.g.                 analyser
660 nm), respectively, following the general assumptions of
conventional TOA protocols which are a prerequisite for their       In this work, the combustion unit of the THEODORE sys-
optical correction (Birch and Cary, 1996; Chow et al., 2001;        tem has been replaced by a thermo-optical OC/EC anal-
Cavalli et al., 2010). In particular, we show how different         yser (Model4L, Sunset Laboratory Inc, USA), which is es-
conditions of temperatures and carrier gases influence the          pecially equipped with a non-dispersive infrared (NDIR) de-
separation of OC and EC and the 14 C content of the removed         tector. The filter transmittance is monitored by a 660-nm
carbon fractions. Furthermore, an optimised TOA protocol is         tuned-diode laser and the CO2 resulting from the sample
developed to isolate the carbon fractions of interest (i.e. OC      analysis quantified by an NDIR cell placed upstream the in-
and EC) for 14 C analysis with minimised biases from char-          strument outlet. This outlet is connected with a four-way
ring and premature EC lost. Finally, we discuss the optimum         valve to the CO2 cryogenic traps of the THEODORE sys-
strategy of 14 C-based source apportionment of carbonaceous         tem so as to recover the exhaust CO2 selectively correspond-
aerosols, especially for EC samples.                                ing to the desired fractions (Fig. 1). Additionally, a volt-
                                                                    age control valve and a gas flow sensor are installed for
                                                                    O2 flow controlling. Three different ultrahigh-purity carrier
2 Methods                                                           gases including helium (He) (> 99.999 %, followed by a
                                                                    moisture/hydrocarbon/O2 purification trap), He/O2 gas (2 %
2.1 The previous two-step combustion method                         O2 in He) and O2 gas (99.9995 %) as well as an internal stan-
                                                                    dard gas (5 % methane in He) are controlled by the gas flow
The THEODORE (Two-step Heating system for the EC/OC                 program of the instrument. The gas flow rate through the
Determination Of Radiocarbon in the Environment) system             OC/EC analyser is adjusted and stabilised at 60 mL min−1 .
(Szidat et al., 2004a) is a set-up that was previously used         No back pressure is observed at this flow when switching
for the combustion and the recovery of carbonaceous frac-           valves.
tions for 14 C-based source apportionment. It consists of a
quartz combustion tube where a filter punch is inserted and         2.3 Water extraction
combusted under a stream of pure O2 . After removal of wa-
ter, the resulting CO2 is trapped cryogenically, determined         For EC separation, water-extraction treatment of the filter is
manometrically and sealed in glass ampoules for subsequent          performed before the thermal treatment, in order to minimise
14 C off-line analysis.                                             charring (see Sect. 3.1). Therefore, a method was developed
   The procedure to collect TC/OC/EC for 14 C analysis was          to obtain minimal EC removal in water with high homogene-
described elsewhere (Szidat et al., 2004b, 2006, 2009). In          ity on the filter, which is necessary due to the narrowness
brief, TC samples are prepared by combusting a punch of the         (∼ 1 mm diameter) of the laser beam (J. Dixon, personal

www.atmos-chem-phys.net/12/10841/2012/                                              Atmos. Chem. Phys., 12, 10841–10856, 2012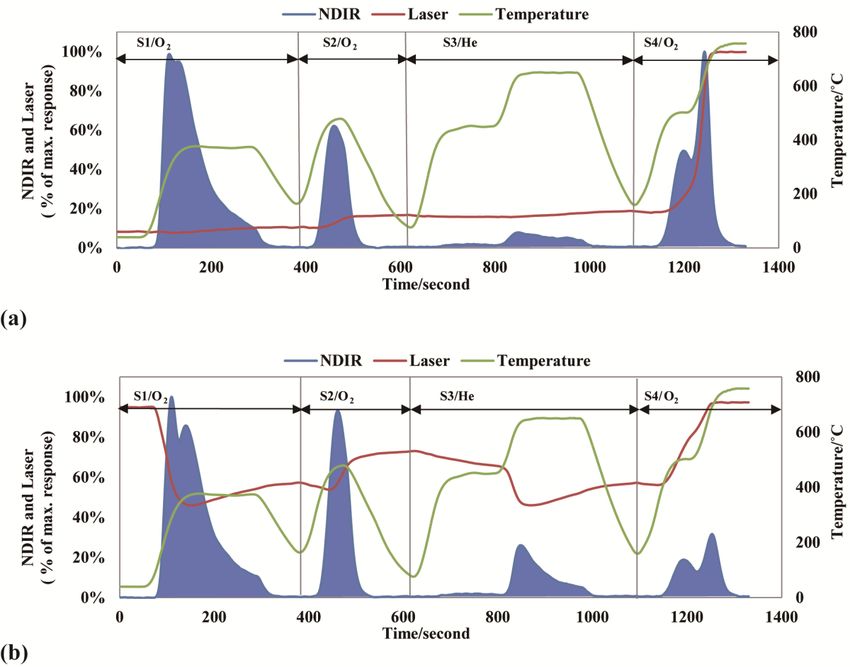
10844                             Y. L. Zhang et al.: Isolation of OC and EC for radiocarbon-based source apportionment

communication, 2010). Under a laminar flow box, 23-mm-
diameter discs are punched out of the filters, sandwiched
between two sealing rings and placed with the laden side
upwards on a 25-mm-diameter plastic filter holder (Sarto-
rius GmbH, Germany) and topped by a plastic syringe body.
20 mL ultrapure water with low TOC impurity is then passed
through the filter without a pump. The filter punch is then del-
icately removed and placed for several hours in the desicca-
tor for drying. Finally, a 1.5 cm2 rectangle is punched out of
the water-extracted filter, wrapped in aluminium foil, packed
into a sealed plastic bag and stored in the freezer (−18 ◦ C)
until OC/EC analysis.
   The initial attenuation of the water-extracted filters varied
up to 3 % compared to that of the untreated filters, indicating
that there is very little loss of EC during the water extrac-
tion procedure. Pre-acidification is omitted, because carbon-
ate carbon (CC) is negligible in the samples of this study.
However, samples may be fumigated with hydrochloric Fig. 2. acid     Fig. 2. Separation scheme of the different carbon fractions for 14 C
prior to analysis (Cachier et al., 1989) for the removal of their    measurement. CO2 is recovered during the desired peak in the in-
CC content for coarse-particle samples, particularly if they         dividual step (e.g. S1, S2, S3 and/or S4) with the present protocol
are impacted by soil dust. However, this procedure is not rec-       (Swiss 4S). Step TC means that CO2 is recovered from all steps
ommended when using a TOA analyser, since the presence               without separation.
of chlorides progressively makes the laser’s quartz optical
window opaque. In order to study the charring behaviour of
                                                                     signal (I ), using the Beer-Lambert law:
water-soluble OC (WSOC), the solution obtained from wa-
ter extraction is evaporated to dryness with a gentle N2 flow                            It
                                                                     ATNt = −100 ln                                                  (1)
and then reconstituted with 200 µL of water. Various amounts                           It (b)
(e.g. 20 µL) of the water extracts are then spiked to prebaked
                                                                     where It and It (b) represent the laser signal during analy-
quartz filters, and then the air-dried filters are analysed by the
                                                                     sis at the time t and the blank signal for the same filter, re-
TOA methods.
                                                                     spectively. The temperature dependence of It (b) is assessed
                                                                     at the end of each run when the filter cools down after to-
2.4   TOA protocol for OC/EC separation                              tal combustion of its carbonaceous content and applied to
                                                                     the whole thermal programme. Thus, It (b) accounts for the
By using the OC/EC analyser, we aim at developing a four-            temperature-induced change in filter transmission and for
step (S1, S2, S3 and S4) thermal-optical protocol (Swiss 4S)         the potential presence of light-absorbing compounds such as
to separate different carbon fractions from water-extracted          Fe2 O3 remaining on the filter after combustion.
and untreated samples for 14 C measurement. The param-                  Assuming a linear relationship between ATN and the filter
eters of this protocol will be discussed and presented in            EC load, the optical yield of EC during analysis is defined by
Sect. 3.2. Figure 2 sketches the separation scheme for differ-       the ratio ATNt /ATN0 , where ATN0 is the initial ATN, which
ent carbonaceous particle fractions. Specifically, OC is sep-        is related to the total amount of EC on the filter, and ATNt is
arated from EC during S1 applied to untreated aerosols fil-          the attenuation at the time t, when S4 (the EC step) begins:
ters, with a recovery of ∼ 80 % for subsequent 14 C analy-
                                                                                  ATNt
sis. When analysing water-extracted aerosols filters, water-         EC yield =                                                      (2)
insoluble OC (WINSOC), a mixture of refractory WINSOC                             ATN0
and non-rEC as well as rEC are separated individually during         For the THEODORE method, offline optical measurement
S1, S2 + S3 and S4, respectively. Water-soluble OC (WSOC)            by the white-light aethalometer was used to determine the
is deduced from subtraction of TC and water-insoluble TC             EC yield (Eq. 2).
(WINSTC) based on mass and isotope-mass balancing.                      Since a portion of OC is charred to an absorbing EC-like
                                                                     material instead being directly oxidized to CO2 , the instru-
2.5   Quantification of EC yields and charred OC                     ment relies on the change in transmission of a laser through
                                                                     the filter to account for charred OC. Formation of charred OC
Similar to Gundel et al. (1984), the attenuation at the time t       related to EC (f ATNchar ) is indicated as
(ATNt , a unitless parameter) due to the light-absorbing parti-                    ATNmax −ATNi
cles on the filter is calculated from the laser transmission raw     f ATNchar =                                                     (3)
                                                                                      ATNi

Atmos. Chem. Phys., 12, 10841–10856, 2012                                             www.atmos-chem-phys.net/12/10841/2012/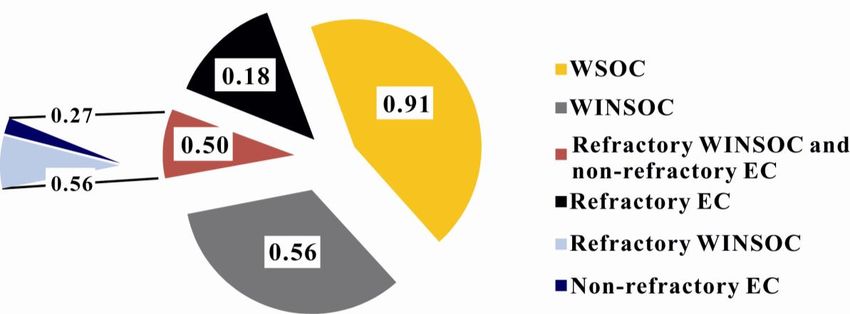
Y. L. Zhang et al.: Isolation of OC and EC for radiocarbon-based source apportionment                                                 10845

Table 1. Information on the filters analysed in this study.

                               Location           Site type   Filter code   Sampling period              Size-cut
                                                              GOT1          11–14 February 2005          PM10
                               Göteborg∗         Urban       GOT2          25 February–4 March 2005     PM10
                                                              GOT3          13–20 June 2006              PM2.5
                               Råö∗             Rural       RAO           18–25 February 2005          PM2.5
                                                              ZUR1          19 December 2007             PM10
                               Zurich             Urban       ZUR2          20 December 2007             PM10
                                                              ZUR3          5 February 2009              PM10
                               Chiasso            Urban       CHI           9 January 2008               PM10
                               Solothurn          Urban       SOL           5 February 2009              PM10
                               Moleno             Rural       MOL           10 January 2009              PM10
                               Bern               Urban       BER           14 January 2009              PM10
                               Magadino           Rural       MAG           14 January 2009              PM10
                               Sissach            Suburban    SIS           5 February 2009              PM10
                             ∗ Szidat et al. (2009)

where ATNmax and ATNi represent the maximum attenua-                         where fNF (ref) is a reference value representing fM of non-
tion and the initial attenuation within a given thermal step,                fossil sources during the sampling periods, which can be fur-
respectively.                                                                ther separated into biogenic (bio) and biomass-burning (bb)
                                                                             sources given that other non-fossil sources (e.g. cooking and
2.6   14 C   analysis                                                        biofuel combustion) are negligible. Hence, fNF (ref) is de-
                                                                             fined as:
For the recovered fractions, evolving CO2 is trapped cryo-
genically, quantified manometrically in a calibrated volume                  fNF (ref) =pbio ×fbio (ref) + (1−pbio ) × fbb (ref)          (5)
of the THEODORE system, and sealed in ampoules for 14 C
measurement (Szidat et al., 2004a). Good agreement is found                  where pbio refers to the percent of the biogenic sources to the
between the Sunset carbon amounts and the THEODORE                           total non-fossil sources; fbb (ref) can be retrieved from a tree-
pressure measurements (data are not shown here). 14 C anal-                  growth model according to Mohn et al. (2008), and fbio (ref)
ysis of CO2 is performed off-line with the accelerator mass                  from the long-term time series of 14 CO2 measurements in
spectrometer MICADAS (Synal et al., 2007) using a gas ion                    atmosphere at the Schauinsland station (Levin et al., 2010).
source (Ruff et al., 2007; Wacker et al., 2012), which allows                In the case of source apportionment of OC, pbio can be sim-
direct CO2 injection after dilution with He (Ruff et al., 2010).             ply estimated as a constant value (e.g. 50 %) given that the
In this study, all 14 C measurements are expressed as fractions              variations of fNF (ref) produced by different pbio values are
of modern (fM ). This term is defined by the fraction of the                 relatively small, especially if compared to the measurement
measured 14 C/12 C ratio related to the 14 C/12 C ratio of the               and method uncertainties (Minguillón et al., 2011). And in
reference year 1950, which in turn is defined as 0.95-times                  the case of EC, pbio is zero as biomass burning is the only
the value of the contemporary standard for 14 C dating, SRM                  source of non-fossil EC.
4990B (Stuiver and Polach, 1977). All reported results are
corrected for δ 13 C fractionation and for 14 C decay for the                2.7   Filter samples
time period between 1950 and the year of measurement.
   It is important to keep in mind that the present reported fM              The atmospheric samples used in this study were collected by
is higher than the fraction of non-fossil (fNF ), because fM                 high-volume samplers on prebaked quartz-fibre filters during
of atmospheric CO2 increased greatly due to atomic bomb                      various field campaigns, which are compiled in Table 1. After
tests in the 1950s and 1960s (Szidat et al., 2006; Levin et al.,             sampling, all filters were wrapped in aluminium foils, packed
2010). The reported fM can be converted to the fraction of                   in air-tight polyethylene bags and stored at −18 ◦ C for later
non-fossil (fNF ) by the following equation:                                 off-line analyses.

          fM
fNF =                                                                (4)
        fNF (ref)

www.atmos-chem-phys.net/12/10841/2012/                                                        Atmos. Chem. Phys., 12, 10841–10856, 2012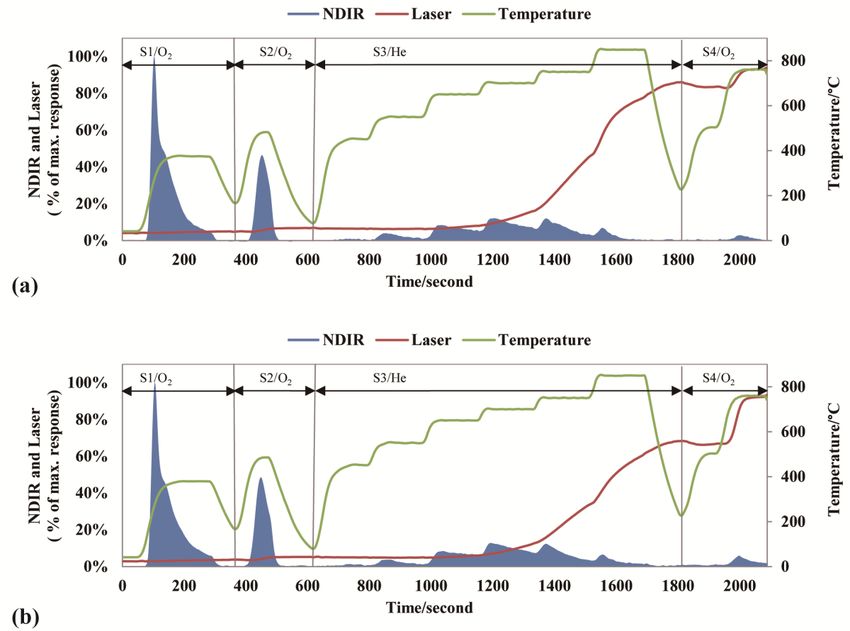
10846                                Y. L. Zhang et al.: Isolation of OC and EC for radiocarbon-based source apportionment

Table 2. Parameters (carrier gas, temperature set point and duration) of the Swiss 4S protocol compared to the EUSAAR 2, modified NIOSH
and IMPROVE protocols.

                                  This study                 EUSAAR 2                  Modified NIOSH            IMPROVE
                                  Swiss 4S
                        Step      Gas, T (◦ C), t (s)        Gas, T (◦ C), t (s)       Gas, T (◦ C), t (s)       Gas, T (◦ C), t (s)
                                  O2 , 180, 50               He, 200, 120              He, 310, 60               He, 120, 150–580d
                        S1
                                  O2 , 375, 150              He, 300, 150              He, 475, 60               He, 250, 150–580
                        S2        O2 , 475a , 120            –                         –                         –
                                  He, 450, 180               He, 450, 180              He, 615, 60               He, 450, 150–580
                        S3
                                  He, 650b , 180             He, 650, 180              He, 840, 90               He, 550, 150–580
                                  O2 , 500, 120              He/O2 c , 500, 120        He/O2 c , 550, 35         O2 , 550, 150–580
                                  O2 , 760, 150              He/O2 , 550, 120          He/O2 , 850, 105          O2 , 700, 150–580
                        S4                                   He/O2 , 700, 70                                     O2 , 800, 150–580
                                                             He/O2 , 850, 80
                      a The temperatures in S2 in the Swiss 4S protocol are tested from 425–650 ◦ C for optimisation.
                      b The temperatures in S3 in the Swiss 4S protocol are tested from 550–850 ◦ C for optimisation.
                      c 2 % oxygen in helium.
                      d The residence time at each temperature in the IMPROVE protocol depends on when the detector signal returns to the
                      baseline to achieve well-defined carbon fractions.

3     Implementation of the thermo-optical OC/EC
      separation

3.1    Relevance of the charring-removing treatment

Charred OC may not be removed totally before the split point
in conventional TOA methods (e.g. IMPROVE and NIOSH)
(Yu et al., 2002). As a consequence, the formation of EC-
like material due to OC charring can lead to a large bias on
the fM value of the EC fraction (fM (EC)), since the mod-
ern fractions of EC and OC can differ significantly (Szidat
et al., 2004b, 2009). Therefore, charring should be reduced
to a minimum for an optimised EC isolation for 14 C anal-
ysis. The suppression of charring is especially achieved by
water-extraction treatment on the one hand and oxidativeFig. 3.
treatment (i.e. combustion in pure O2 ) of the filters on the    Fig. 3. Fraction of charred OC related to total EC (f ATNchar ) during
                                                                 analysis using different methods for five typical samples.
other hand. The water-extraction treatment prior to the EC
collection substantially reduces charring due to the removal
of WSOC as well as of some inorganic catalytic compounds
(Novakov and Corrigan, 1995; Mayol-Bracero et al., 2002;         ter attenuation increases by 52–121 % during the He steps
Yu et al., 2002; Andreae and Gelencsér, 2006; Piazzalunga et    of the NIOSH method, which indicates substantial formation
al., 2011). Furthermore, Cachier et al. (1989) and Lavanchy      of charred OC. Charring is substantially reduced if analysing
et al. (1999) observed that charring is substantially smaller if the same filters with the Swiss 4S that uses an oxidative at-
pure oxygen is used for the OC step instead of helium.           mosphere (pure O2 ) before the EC step instead of an inert
    With on-line monitoring of the optical properties of the     atmosphere (i.e. NIOSH) to remove OC. Charring is fur-
filter during analysis, the relevance of using pure oxygen       ther reduced if analysis is carried out on water-extracted fil-
and water-extracted filters to avoid charring was assessed       ters. For all studied samples including winter/summer and
(Fig. 3). Five different sample filters were analysed with       rural/urban samples, a charring-induced change of the ATN
the OC/EC analyser using three different methods (Table 2):      is reduced to < 7 % of total EC if OC removal is performed
(1) a modified NIOSH protocol applied to untreated filters;      under pure O2 on water-extracted filters. Furthermore, OC
(2) the Swiss 4S protocol applied to untreated filters; (3) the  isolation in He gas appears inappropriate for 14 C analysis of
Swiss 4S protocol applied to water-extracted filters. The fil-   EC, because charring induces an excess of artificial EC. As

Atmos. Chem. Phys., 12, 10841–10856, 2012                                                                 www.atmos-chem-phys.net/12/10841/2012/

                                                                                                                                                   37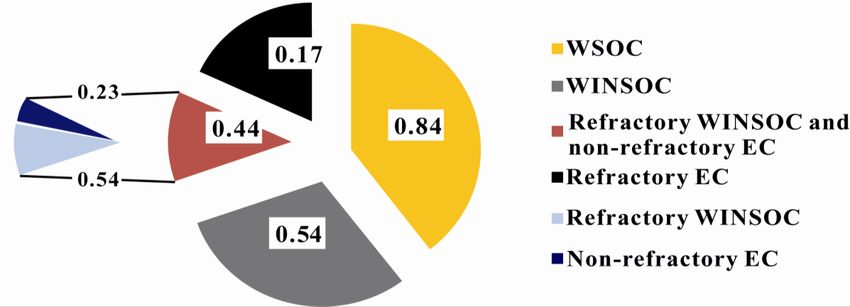
Y. L. Zhang et al.: Isolation of OC and EC for radiocarbon-based source apportionment                                         10847

               Fig. 4.
Fig. 4. Thermograms of a water-extracted aerosol sample (SOL) (a) and its water extract after dropped on a blank filter (b), using the
Swiss 4S protocol (S2: 475 ◦ C, S3: 650 ◦ C).

a consequence, the conventional TOA procedures based on               site to isolate EC for 14 C measurement. Although it is not
OC removal in He (i.e. EUSAAR 2, IMPROVE and NIOSH)                   guaranteed that the fractions interfering with EC, including
cannot be adapted directly to OC and EC separation for 14 C           charred carbon fractions and refractory OC, are negligible for
analysis, because it is not clear whether the artificial EC is        all water-extracted samples, they are reduced to acceptable
totally removed before the split point or remains partially on        levels with the Swiss 4S protocol. In conclusion, the optimal
the filter and afterwards evolves together with EC.                   method to isolate EC from TC for 14 C measurement should
    The importance of the water-extraction treatment is also          be based on removing OC in pure oxygen on water-extracted
underlined by the comparison of the thermograms of a typi-            filters before thermal treatments.
cal aerosol filter and of its WSOC fraction loaded on a blank
filter (Fig. 4; for details of the protocol see Sect. 3.2.1). Char-   3.2     The Swiss 4S protocol
ring is negligible if analysing the water-extracted aerosols
(Fig. 4a), most likely due to the fact that WSOC is suscep-           3.2.1    Operational conditions
tible to charring (Yu et al., 2002). The carbon released in
                                                                      The TOA protocol Swiss 4S used in this study employs pure
the S4 can consequently be regarded as native EC unaffected
                                                                      O2 (except in S3) as carrier gas and sets the durations of
by charring and with approximately 75 % EC yield. If the
                                                                      each temperature step in order to obtain well-resolved carbon
water-soluble portion of OC is subjected to the same ther-
                                                                      peaks with baseline separations (Table 2). The transmittance
mal analysis, substantial charring occurs during steps S1–S3
                                                                      signal is used for optical monitoring. The operational condi-
(Fig. 4b) and EC that should not be present is found, indi-
                                                                      tions were optimised to satisfy the following goals: (1) com-
cating that part of the charred OC cannot be removed be-
                                                                      plete decomposition of OC prior to EC collection, (2) neg-
fore S4, and thus is misclassified as EC. Yu et al. (2002) al-
                                                                      ligible charring formation and (3) minimum premature EC
ready demonstrated that charring generated from WSOC is                                                             38
                                                                      evolution.
indistinguishable from the original aerosol EC and thus that
                                                                         The peak temperature in S1 is set to 375 ◦ C to allow
a fraction of WSOC and EC evolve at the same time. The
                                                                      OC removal with least premature EC losses. Although small
results confirm the water-extraction treatment is a prerequi-
                                                                      amounts of refractory organic substances may still not be

www.atmos-chem-phys.net/12/10841/2012/                                               Atmos. Chem. Phys., 12, 10841–10856, 2012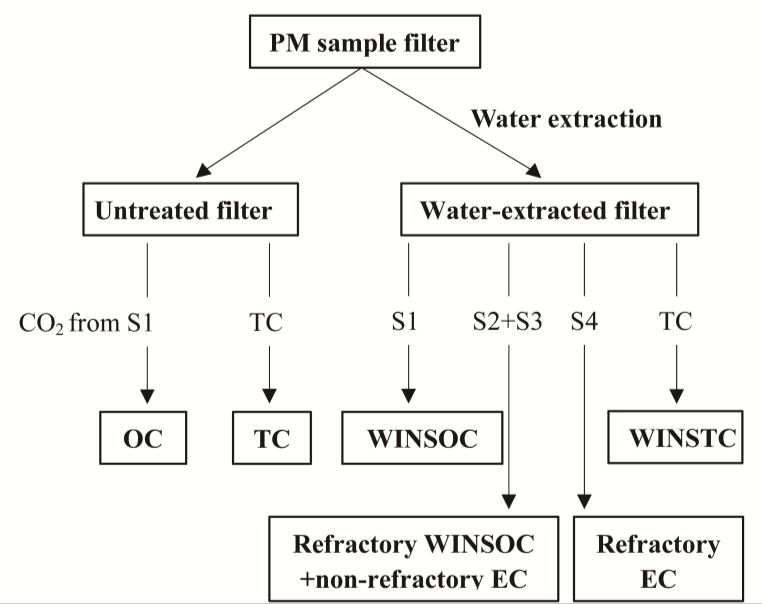
10848 Y. L. Zhang et al.: Isolation of OC and EC for radiocarbon-based source apportionment
decomposed at this temperature, 375 ◦ C is a good compro-
mise between the needs of high OC yields and avoiding EC
pre-combustion. ∼ 80 % of WINSOC is decomposed in this
step. However, the attenuation decrease suggests 1–7 % EC
removal during S1, which accounts for up to 3 % uncertainty
of fM of WINSOC. S2 and S3 are introduced in order to re-
move remaining refractory OC completely, with minimum
EC losses. OC often includes high-molecular-weight com-
pounds (e.g. humic-like substances, HULIS) with a thermal
behaviour quite similar to the least refractory EC (Fermo et
al., 2006). Iwatsuki et al. (1998) reported that it is necessary
to reach a threshold temperature of 485 ◦ C under pure oxy-
gen for complete removal of these substances. In our exper-
iment, the peak temperature in S2 is set to a value between
425 ◦ C and 600 ◦ C (see Sect. 3.2.2) to remove most of the OC
remaining after S1 with minimum EC losses, thus preventing
OC from charring in the following steps. The duration is set
to 120 s to allow different chosen temperatures (from 425 ◦ C
to 600 ◦ C) to stay close to the set value for about 20 s. S3
continues with OC removal in He and monitors the evolution
of any residual OC before switching to the last step (S4). The
thermal parameters in S3 are similar to the last two He steps
in the conventional TOA protocols (i.e. EUSAAR 2, see Ta-
ble 2). For a limited number of samples, different peak S3
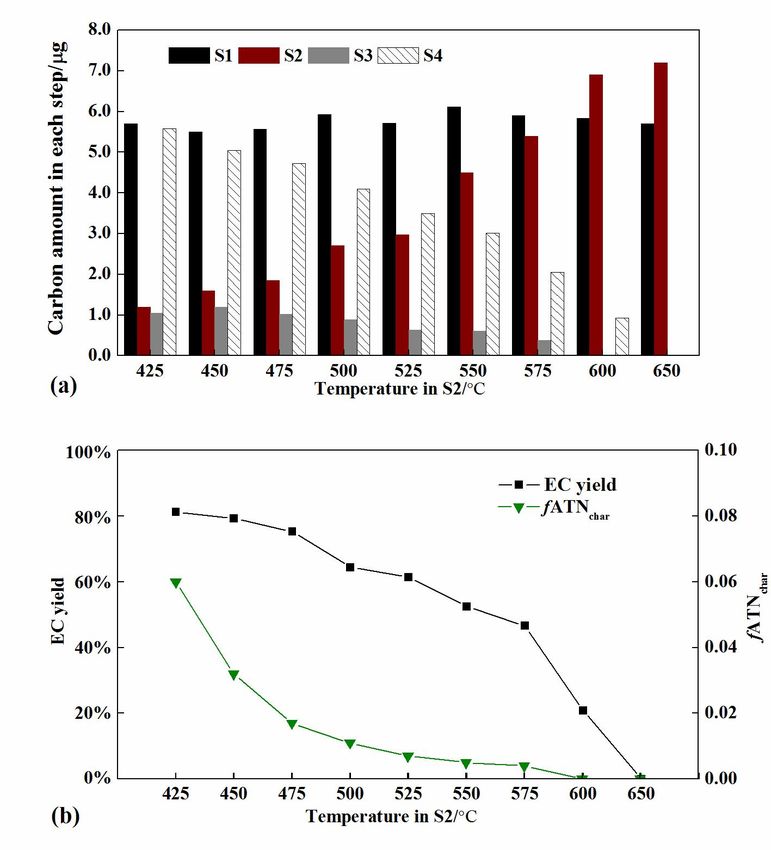
temperatures were also investigated (see Sect. 3.2.3). Fig. Last,
5. Fig. 5. Carbon amounts released in each step (a) and f ATNchar and
◦ EC yield in S4 (b), as evaluated from analysing a typical water-
S4 is set to 760 C for 150 s, so as to remove all the remain-
extracted aerosol sample (ZUR1) by the Swiss 4S protocol with
ing carbon on the filter. In the following expressions, fM (OC) different S2 temperatures.
and fM (EC) represent the fraction of modern of the isolated
OC (i.e. S1) and EC (i.e. S4), respectively.
measurements of EC in terms of uncertainties and detection
limits.
3.2.2 Influence of the S2 temperature on OC/EC
Therefore, the extent of the bias of 14 C measurement of EC
separation
(1fM (EC)) can be estimated as the sum of two contributions:
S2 was optimised to remove OC as completely as possible
prior to EC collection together with maximum EC recovery 1 (fM (EC)) = 1 (fM (EC))1 +1 (fM (EC))2 (6)
in S4. For this, the water-extracted filters were analysed with
where 1fM (EC)1 refers to the bias only due to OC char-
the peak S2 temperature varying from 425 ◦ C to 600 ◦ C with
ring and pre-combustion of EC, which are considered as
a fixed peak S3 temperature of 650 ◦ C. Figure 5 illustrates
the most important factors influencing EC measurement, and
the carbon fractions released in each step as a function of
1fM (EC)2 refers to the bias from the positive artefact due to
peak temperatures in S2. During these analyses, the carbon
the residual OC included in EC step.
amounts measured in S1 was found to be reproducible, sug- 39
Due to the aforementioned artefacts, 1fM (EC)1 is depen-
gesting a high reproducibility of the water-extraction treat-
dent on the EC yield and on the percentage of charred car-
ment and the stability of the instrument. At a higher tem-
bon (f ATNchar ) as well as on the fM of the charred carbon
perature, more refractory OC and non-rEC are lost before
(fM (char)) and of the isolated EC in S4 (fM (EC)). As a re-
S4, while charring during the analysis is reduced from 6 %
sult, all above factors should be taken into account to calcu-
to ∼ 0 %. Thus, with a higher S2 temperature there is less
late 1fM (EC)1 , as in the below Eq. (7):
probability for residues of refractory and charred OC in the
final fraction which minimises the bias from the positive arte- 1 (fM (EC))1 =
fact (i.e. remaining OC) on the fM of the EC recovered in fM (char) ×f ATNchar +fM (EC) ×(EC yield)
S4. However, the EC yield decreases substantially with in- −1 (7)
f ATNchar + (EC yield) ×fM (EC)
creasing S2 temperature, which also distorts fM (EC), as this
enhances the bias from the negative artefact (i.e. losses of 1fM (EC)1 can be reduced to less than ∼ 5 % if the peak
wood-burning EC). Moreover, the higher S2 temperature the S2 temperature is higher than 450 ◦ C, assuming that the 14 C
lower the EC yield, which directly influences radiocarbon content of charred carbon is three times as much as that in
Atmos. Chem. Phys., 12, 10841–10856, 2012 www.atmos-chem-phys.net/12/10841/2012/Y. L. Zhang et al.: Isolation of OC and EC for radiocarbon-based source apportionment 10849
Fig. 6. Thermograms
Fig. 6. from the analysis of two water-extracted winter samples CHI (a), and MOL (b). The protocol used for analysis was
modified according to the Swiss 4S protocol (see in Table 2) with a fixed peak S2 temperature of 475 ◦ C, but with different steps in S3 (He
mode): 450 ◦ C, 550 ◦ C, 650 ◦ C, 700 ◦ C, 750 ◦ C and 850 ◦ C, each of 180 s.
EC (e.g. fM (charred OC) = 0.6, fM (EC) = 0.2), which is rea- not completely evolve or pyrolyse at low inert-mode temper-
sonable as indicated below in Sect. 3.4. Consequently, as atures (Novakov and Corrigan, 1995), while the combustion
the most satisfying compromise between complete evolu- of some EC can be catalytically enhanced by the presence
tion of OC and a minimum EC pre-combustion before EC of mineral oxides at high inert-mode temperatures (Fung,
collection, 475 ◦ C is chosen as the peak S2 temperature in 1990). In order to minimise 1fM (EC)2 (Eq. 6), we exam-
the Swiss 4S protocol. With this S2 temperature, both char- ined the effect of the peak He temperature (i.e. S3) on the
ring and pre-combustion of EC are kept at acceptable levels. carbon amounts and the 14 C content of isolated EC in S4
However, this temperature can be increased up to 525 ◦ C in (fM (EC)). The protocol used for analysis was modified ac-
order to guarantee complete OC removal before S4, which cording to the Swiss 4S protocol (see Table 2) with a fixed
may become necessary for a few filters with high OC load- peak S2 temperature of 475 ◦ C, but with different intermedi-
ing. By analysis of such samples, we observed that EC yields ate steps in S3 (He mode): 450 ◦ C, 550 ◦ C, 650 ◦ C, 700 ◦ C,
> 90 % after S2 and/or f ATNchar > 10 % during the analy- 750 ◦ C and 850 ◦ C, each of 180 s. Figure 6a and b show
sis, increasing the risk of remaining OC in the EC step (i.e. two typical thermograms obtained by analysing two rural
S4). This risk can be much reduced by increasing the peak winter samples (MOL and CHI, see Table 1) with consid-
S2 temperature from 475 ◦ C to maximum 525 ◦ C. erable contributions from wood burning (Szidat et al., 2007).
The transmission signal remains quite stable from 450 ◦ C to
3.2.3 Influence of the S3 temperature on OC/EC 550 ◦ C in S3 and begins increasing slightly when the temper-
separation ature reaches 650 ◦ C. This shows that carbon evolving below
550 ◦ C is exclusively OC, without any untimely removal of
EC. The carbon evolved between 550 ◦ C to 650 ◦ C in S3 can
S3 is carried out in helium to remove OC completely before
be either pure EC or a combination of EC and remaining OC.
isolation and collection of EC during S4. Previous studies
Then, after temperature exceeds 700 ◦ C, the transmission
40 sig-
have demonstrated that the OC/EC split can be strongly in-
nals increases rapidly, indicating substantial premature EC
fluenced by the peak temperature step in He mode (Conny et
removal. This phenomenon is not only found for these two
al., 2003). Some certain types of OC such as wood smoke do
www.atmos-chem-phys.net/12/10841/2012/ Atmos. Chem. Phys., 12, 10841–10856, 201210850 Y. L. Zhang et al.: Isolation of OC and EC for radiocarbon-based source apportionment
samples, but also in many other winter samples with large
wood-burning contributions (data not shown here). The EC
evolving in He during high temperature steps can be either
native EC or charred carbon, or a combination of them (Sub-
ramanian et al., 2006). However, as the charring is negligible
in our method, the transmittance increasing in S3 can only
be explained by premature EC losses. Indeed, EC may be
catalytically removed by mineral oxides under inert gas con-
ditions even at lower high temperature (Fung, 1990; Wang et
al., 2010). In the Swiss 4S protocol, more metal oxides may
form upon heating in the presence of pure oxygen in S1 and
S2, which may enhance the premature EC losses in S3.
The EC optical yield at 650 ◦ C is about 45 % and 20 %
higher than at 850 ◦ C and 700 ◦ C, respectively. As a result,
lowering the peak S3 temperature below 850◦ C can improve
the EC recovery substantially by avoiding premature EC
losses, and thus 14 C results obtained from collected EC in
S4 could represent the entire EC better. However, the lower
Fig. 7.
the peak S3 temperature, the higher the possibilities that OC Fig. 7. Influence of S3 temperatures in the Swiss 4S protocol on
might not totally be removed before S4, so the complete OC EC yields and fraction of modern of recovered EC in S4 (f M (EC))
from the analysis of the water-extracted winter samples SOL (a),
removal at a low peak S3 temperature needs to be confirmed.
MOL (b) and CHI (c) and f M (EC) as a function of different EC
To evaluate a possible bias due to different peak S3 tempera-
yields (d).
tures, samples were analysed by the Swiss 4S protocol with
a fixed maximum S2 temperature of 475 ◦ C, but with dif-
ferent peak S3 (He mode) temperatures of 550 ◦ C, 650 ◦ C tainty (< 5 %) in fM (EC). Therefore, 650 ◦ C is selected as
and 700 ◦ C. Additionally, 14 C measurements of the CO2 col- the peak temperature in S3, the same as the maximum He
lected during S4 are also carried out for the samples SOL, temperature in the EUSAAR 2 protocol, which assures that
MOL and CHI. As illustrated in Fig. 7, fM (EC) and EC the bias of fM (EC) due to the positive artefact (i.e. the resid-
yields decrease by ∼ 15 % and ∼ 10 % respectively, when ual OC slipping into the EC step) is minimised (less than
the peak S3 temperature increases from 550 ◦ C to 650 ◦ C. 5 %) with a maximum EC yield. However, this temperature
This result implies that a fraction of OC may evolve even may be decreased down to 550 ◦ C for filters, which show
after S3 with too low a peak S3 temperature (i.e. 550 ◦ C) substantial EC losses in S3, e.g. due to premature EC evo-
and is erroneously collected together with native EC in S4, lution caused by catalytic oxidation in the presence of min-
which leads to a positive bias of fM (EC). Recently, Cavalli et eral dust (Fung, 1990; Wang et al., 2010). For such sam-
al. (2010) also observed that OC can evolve into He/O2 step ples, we suggest that EC yields should not be lower than
with a peak He temperature of 550 ◦ C such as IMPROVE, ∼ 60 %, which may be avoided by decreasing the S3 tem-
thus potentially overestimating EC. However, when the peak perature from 650 ◦ C to minimum 550 ◦ C. In general, the EC
S3 temperature is increased from 650 ◦ C to 700 ◦ C, fM (EC) recovery amounts to maximum 70–90 % in this work, so that
does not decrease significantly, while an obvious (∼ 25 %) the source apportionment of the entire EC is still not quanti-
EC yield decrease occurs, corresponding to ∼ 5 % uncer- tative if only EC in S4 is considered. 41
tainty on the attribution of EC to non-fossil sources. Sup-
posing that the fM (EC) measured at a peak S3 temperature 3.2.4 Comparison of TC, OC and EC concentrations
of 700 ◦ C represents the “true” fM (EC) value, the bias of from Swiss 4S with EUSAAR 2
fM (EC) (1fM (EC)2 ) (Eq. 6, in Sect. 3.2.2) at a peak S3 tem-
perature of 550 ◦ C and 650 ◦ C imply ∼ 25 % and ∼ 5 % con- A few particulate matter samples were also analysed by the
taminations to EC, respectively, resulting from OC remaining protocol EUSAAR 2 to perform a first comparison with the
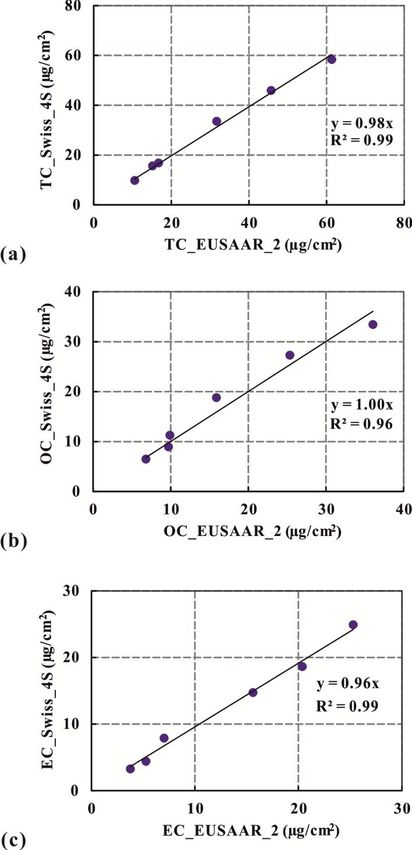
after S3. However, the higher 14 C values of EC obtained with present protocol Swiss 4S results on TC, OC and EC concen-
a lower peak S3 temperature (i.e. 550 ◦ C and 650 ◦ C) could trations. All filters were water-extracted before their OC/EC
also stem from a better recovery of the biomass-burning EC. determinations. The EC amounts measured by the Swiss 4S
In these circumstances, ∼ 25 % and ∼ 5 % may be the upper protocol was corrected to 100 % EC yield, and OC was de-
limits for OC contamination in native EC at peak S3 tempera- termined by subtraction of the corrected EC from TC. In
tures of 550 ◦ C and 650 ◦ C, respectively. The results demon- general, Fig. 8a, b and c show a very good agreement be-
strate that the carbon evolving between 650 ◦ C and 700 ◦ C tween both protocols for all fractions, which suggests that
during S3 is almost exclusively native EC with a maximum the Swiss 4S protocol provide reliable concentrations of OC
5 % OC contamination, corresponding to an accepted uncer- and EC. Piazzalunga et al. (2011) also demonstrated that the
Atmos. Chem. Phys., 12, 10841–10856, 2012 www.atmos-chem-phys.net/12/10841/2012/Y. L. Zhang et al.: Isolation of OC and EC for radiocarbon-based source apportionment 10851
ference of the corresponding fM (OC). Concerning EC, the
premature losses of EC during the OC removal before col-
lecting CO2 increase with increasing peak S2 temperatures
in the Swiss 4S protocol and the oven temperatures used in
the previous THEODORE method (Fig. 9). For both meth-
ods, the decrease in fM (EC) is linearly associated with the
decreasing EC yields. This confirms that non-fossil EC is
less refractory than fossil EC, suggesting that the recovered
EC cannot fully represent the total EC. Figure 9 also reveals
that both methods underestimate the wood-burning contribu-
tion, unless the complete EC fraction is taken into account
for source apportionment and that the bias increases with de-
creasing EC recoveries. For this sample (GOT2), a range of
∼ 35 % to ∼ 90 % EC yield leads to a difference of ∼ 0.15
for fM (EC). fM of the total EC is estimated by linear extrap-
olation to 100 % EC yields as 0.22 ± 0.01 and 0.19 ± 0.02
(1σ uncertainties) for the Swiss 4S and the THEODORE
methods, respectively. It is speculated that the different fossil
and non-fossil contributions in EC may result in a continuum
from thermally refractory near-elemental EC to thermally re-
active or non-refractory EC.
However, fM (EC) has not been found to decrease signif-
icantly with decreasing EC yields when the different peak
S3 (He mode) temperature increases from 650 ◦ C to 700 ◦ C
(Fig. 7). This most likely arises from the more rigorous OC
removing treatments in an oxidative atmosphere (i.e. S2 in
Swiss 4S and oven in THEODORE method) compared to an
inert atmosphere (i.e. S3 in Swiss 4S), which may enhance
the different behaviour of wood-burning EC compared to fos-
sil EC and favour its untimely removal.
3.4 The optimal strategy of radiocarbon-based source
apportionment of carbonaceous aerosols
.
3.4.1 Considerations of total EC
Fig. 8. Fig. 8. Comparisons between the Swiss 4S and EUSAAR2 proto-
cols for the analysis of TC (a), OC (b) and EC (c) for the water- According to the separation scheme shown in Fig. 2, different
extracted aerosol samples.
carbon fractions of two aerosol samples (GOT2 and GOT3)
were isolated for 14 C determination using the Swiss 4S pro-
tocol. As illustrated in Fig. 10, 14 C measurements of the indi-
removal of water-soluble compounds from the filter is effec- vidual different carbon fractions (i.e. OC, EC, WINSOC and
tive in reducing the differences between different protocols. WSOC) may provide more comprehensive and refined infor-
A more rigorous comparison on a larger number of samples mation for source apportionment of carbonaceous aerosols.
is currently in progress at our laboratory. 42
The distinction between WSOC and WINSOC shows a sig-
nificantly higher fossil contribution for the water-insoluble
3.3 Comparison of 14 C results using the Swiss 4S fraction. WSOC is nearly on the contemporary level, sug-
protocol and the THEODORE method gesting that secondary organic aerosol (SOA) is mainly
formed from biogenic VOCs in the studied area, as WSOC
A comparison of the Swiss 4S protocol and the THEODORE aerosol is thought to be a good proxy for SOA (Weber et
method was performed for a few selected filters from the al., 2007; Jimenez et al., 2009). Consequently, OC should be
Göteborg 2005/2006 campaign (Szidat et al., 2009). For both separated into WSOC and WINSOC fractions to better un-
methods, OC and EC were recovered on original and water- derstand its sources.
extracted filters, respectively. The OC concentrations show Moreover, the experiments above demonstrate the lower
differences between both methods within < 15 % without refractivity of wood-burning EC compared to fossil EC
any trend (Table 3). Nevertheless, there is no significant dif- and the difficulty of clearly isolating EC without premature
www.atmos-chem-phys.net/12/10841/2012/ Atmos. Chem. Phys., 12, 10841–10856, 201210852 Y. L. Zhang et al.: Isolation of OC and EC for radiocarbon-based source apportionment
Table 3. Comparisons of the carbon masses (m(OC)) and fraction of modern of OC (fM (OC)) obtained with the present thermal-optical
method (Swiss 4S) and thermal method (THEODORE).
Sample Swiss 4S THEODORE
m(OC) µg cm−2 fM (OC) m(OC) µg cm−2 fM (OC)
GOT1 13.7 ± 0.4 0.74 ± 0.02 15.7 ± 0.4 0.74 ± 0.02
GOT2 61.6 ± 1.3 0.64 ± 0.01 54.8 ± 1.5 0.67 ± 0.02
GOT3 19.4 ± 0.4 0.72 ± 0.01 19.6 ± 0.5 0.73 ± 0.01
Table 4. EC yield and fraction of modern (fM ) of the refractory EC
(rEC), non-refractory EC (non-rEC) and total EC (tEC).
Sample fM (rEC)a fM (non-rEC)b fM (tEC)b EC yield
rEC/tEC
GOT2 0.17 ± 0.01 0.23 ± 0.07 0.18 ± 0.04 0.80 ± 0.06
GOT3 0.18 ± 0.01 0.27 ± 0.08 0.19 ± 0.04 0.76 ± 0.06
SOL 0.33 ± 0.01 0.42 ± 0.06 0.35 ± 0.06 0.74 ± 0.05
ZUR3 0.28 ± 0.01 0.58 ± 0.06 0.35 ± 0.06 0.77 ± 0.05
MAG 0.38 ± 0.01 0.56 ± 0.07 0.42 ± 0.04 0.80 ± 0.05
BER 0.22 ± 0.01 0.35 ± 0.06 0.24 ± 0.04 0.85 ± 0.04
SIS 0.30 ± 0.01 0.36 ± 0.06 0.31 ± 0.06 0.82 ± 0.05
a rEC: refractory EC as the isolated EC during S4 in the Swiss 4S protocol Fig.
Fig.9. 9. f
M (EC) in S4 as a function of EC yield obtained by analysing
b non-rEC: non-refractory EC as the EC fractions in S2 and S3 in the Swiss 4S protocol
c tEC: total EC = rEC + non-rEC
the sample GOT2 with the Swiss 4S protocol and the previously
used THEODORE method with different peak S2 temperatures and
the oven temperatures, respectively. Shading indicates the confiden-
tial interval of the linear extrapolation within 1σ .
evolution of EC. For an optimal 14 C-based source apportion-
ment of carbonaceous aerosols, and particularly of EC, the
whole amount of EC has to be taken into account to quan- to the corresponding 100 % EC yield (Fig. 9). Although
tify its fossil vs. non-fossil contributions. Indeed, total EC the deviations of the 14 C determinations of rEC and tEC
(tEC) consists not only of rEC recovered in S4, but also of are not statistically significant for the individual samples,
non-rEC evolved in S2 and S3. Therefore, not only the char- Figs. 9, 10 and Table 4 suggest a general trend towards an
acteristic of the rEC in S4, but also that of non-rEC evolv- underestimation of EC from wood and/or biomass burning
ing during S2 and S3 should be investigated. As shown in for both methods. As shown above, this trend strongly
Figs. 2 and 10, the most refractory WINSOC and non-rEC, depends on the EC recovery and, moreover, probably on the
which are volatilized simultaneously due to their overlap- sample types. Therefore, refractory WINSOC and non-rEC
ping thermal properties, can also be recovered for 14 C anal- (S2 and S3), as well as OC (S1) and rEC (S4), should also
ysis. To estimate the 14 C content of non-rEC from this mix- be isolated with the Swiss 4S protocol for subsequent 14 C
ture, we determined OC and EC filter concentrations using measurements, at least for a few selected samples from a
the EUSAAR 2 protocol and assumed that the refractory dedicated campaign, in order to get a comprehensive picture
WINSOC has the same 14 C value (within 5 % uncertainty) of the fossil and contemporary sources of carbonaceous
as the WINSOC from S1. aerosols (see Fig. 10). As for the solely thermal methods (i.e. 43
Following this isotope-mass balance, fM (non-rEC) the THEODORE method), the fM value of total EC may be
amounts to 0.23 ± 0.07 and 0.27 ± 0.08 for the GOT2 and derived from measurements of fM (EC) for different oven
GOT3 samples, respectively. This is ∼ 30 % higher than the temperatures and the extrapolation to 100 % EC yield for
fM (rEC) measured from S4 (0.17 ± 0.01 and 0.18 ± 0.01, selected samples similar to Fig. 9 (see Fig. S1). Moreover,
respectively). Correspondingly, fM (tEC) amounts to we recommend that 14 C results of EC should in general be
0.18 ± 0.04 and 0.19 ± 0.04, respectively for these two reported together with the EC recovery, because the recov-
samples, which is ∼ 6 % higher than the corresponding ered EC may not fully represent the total EC. This procedure
fM (rEC). Similar results are also found for the other samples also avoids possible discrepancies between temperatures as
shown in Table 4. Moreover, for the GOT2 sample analysed displayed by the oven from actual temperatures on the filter.
with the Swiss 4S protocol and the THEODORE method, In the Supplement (Figs. S1, S2, Table S1 and Sect. S1), we
the fM (tEC) values from the isotope-mass balance are compile EC yields of fM (EC) determinations from earlier
consistent, within uncertainties, with the extrapolations studies (Szidat et al., 2004b, 2006, 2007, 2009; Sandradewi
Atmos. Chem. Phys., 12, 10841–10856, 2012 www.atmos-chem-phys.net/12/10841/2012/Y. L. Zhang et al.: Isolation of OC and EC for radiocarbon-based source apportionment 10853
imise OC charring, untimely removal of EC and the potential
positive artefacts leading to co-evolution of EC with resid-
ual OC, the Swiss 4S protocol has been developed by opti-
mising thermal-optical conditions, in particular the heating
program and the choice of the carrier gas. This optimised
Swiss 4S protocol involves the following consecutive four
steps: (1) S1 in O2 at 375 ◦ C for isolation of OC (untreated
filters) or WINSOC (water-extracted filters) without prema-
(a)
ture EC evolution; (2) S2 in O2 at 475 ◦ C followed by (3) S3
in He at 650 ◦ C, the same as the peak temperature in the EU-
SAAR 2 protocol; and (4) S4 in O2 at 760 ◦ C for recovering
the remaining EC. For few special samples, these parameters
may need to be optimised: the S2 peak temperature may be
increased up to 525 ◦ C for filters with high OC loading in or-
der to make sure that OC is removed completely before S4;
the S3 peak temperature may be decreased down to 550 ◦ C
(b) for samples with an extraordinary mineral-dust contribution
Fig. 10. in order to prevent too large EC losses before S4. It is note-
Fig. 10. Composition of different carbonaceous particle fractions worthy that the water-extraction treatment prior to any ther-
(pies) and f M values (numbers) in Göteborg for winter (GOT2) (a) mal treatment is an essential prerequisite for EC isolation and
and summer (GOT3) (b). its subsequent radiocarbon analysis, as this substantially re-
duces charring by removal of water-soluble organic and inor-
ganic compounds. Otherwise the non-fossil contribution due
et al., 2008a, b; Aiken et al., 2009; Hodzic et al., 2010; to the positive bias from charring could be potentially over-
Minguillón et al., 2011; Perron et al., 2010) with estimations estimated. A good agreement on OC and EC concentrations
of fM values of total EC (fM (tEC)) by extrapolation to has been found between the Swiss 4S and the EUSAAR 2
100 % EC yield. Overall, fossil EC could be overestimated protocols applied to some water-extracted samples.
by 5–70 % with an average of 30 ± 15 % (Table S1) if only The 14 C analysis of isolated OC from S1 and EC from
rEC was taken into account to quantify relative fossil and S4 using the Swiss 4S protocol concerns ∼ 80 % of total
non-fossil contributions of EC. OC and total EC, which already gives a good indication
44 of the OC and EC sources. However, the full information
3.4.2 Mass closure for OC
about all the emissions cannot be based on 14 C analysis of
For 14 C measurement of OC, untreated filters were analysed OC and EC only. On the one hand, OC should be separated
with the Swiss 4S protocol and the CO2 evolving from S1 into WSOC and WINSOC fractions to better understand its
(accounting for 75 ∼ 85 % of total OC) was recovered. The sources, because the water-insoluble fraction has a signifi-
unrecovered OC can correspond to charred OC formed dur- cantly higher fossil contribution. On the other hand, due to
ing S1 and to refractory OC which cannot be released un- the lower refractivity of biomass-burning EC compared to
der S1 temperature (375 ◦ C). Using the isotope-mass bal- fossil EC, the former fraction partially co-evolve with refrac-
ance (total OC = WSOC + non-refractory WINSOC + re- tory OC during thermal treatment. Therefore, 14 C analysis of
fractory WINSOC), the fM values of total OC are calcu- EC in S4 alone may underestimate the wood-burning contri-
lated to be 0.86 ± 0.02 and 0.74 ± 0.02 for samples MOL and bution, and thus a simplified technique of complete EC iso-
GOT3, respectively. These values are consistent with the val- lation for 14 C analysis is not optimal. Consequently, the best
ues measured from OC isolated in S1, i.e. 0.88 ± 0.01 and strategy for radiocarbon-based source apportionment of car-
0.72 ± 0.01, respectively. This suggests that charring and un- bonaceous aerosols involves a subdivision of TC into carbon
evolved refractory OC during S1 do not alter the 14 C signa- fractions of different chemical and physical properties. To
tures of the total OC significantly. However, this should be better perform 14 C-based source apportionment of carbona-
evaluated carefully for each sample, particularly if the load- ceous aerosols, the Swiss 4S protocol is implemented to de-
ing of OC is too low or the amount of charred OC is too high. termine the 14 C content not only in OC and rEC fractions
but also WINSOC as well as a continuum of refractory OC
and non-rEC. In addition, WSOC can be determined by sub-
4 Conclusions traction of the water-soluble fraction of TC from untreated
TC. For the solely thermal methods (i.e. the THEODORE
A detailed study has been performed to establish a new method), the fM value of total EC can be derived from mea-
thermal-optical protocol to isolate the carbon fractions of surements of fM (EC) for different oven temperatures dura-
interest (i.e. OC and EC) for 14 C measurement. To min- tions and the extrapolation to 100 % EC yield for selected
www.atmos-chem-phys.net/12/10841/2012/ Atmos. Chem. Phys., 12, 10841–10856, 2012You can also read