Estimating the frequency of coincidental spatial associations between Clovis artifacts and proboscidean remains in North America
←
→
Page content transcription
If your browser does not render page correctly, please read the page content below
Quaternary Research (2021), 1–11
        doi:10.1017/qua.2021.1

        Research Article

        Estimating the frequency of coincidental spatial associations
        between Clovis artifacts and proboscidean remains in North
        America
        Madeline E. Mackiea*                  and Randall Haasb*
        a
         Department of Anthropology, University of Wyoming, 1000 East University Avenue, Laramie, Wyoming 82071, USA and bDepartment of Anthropology, University of
        California, Davis, One Shields Avenue, Davis, California 95616, USA

        Abstract
        The extent to which Clovis peoples hunted proboscideans is debated. Convention requires that for a proboscidean butchery site to be
        accepted, contemporaneous artifacts must be spatially associated with faunal remains, and there must be evidence of use of the remains.
        Fourteen sites in North America currently meet those criteria; at least 31 do not. While these are reasonable requirements for avoiding
        false positives, such an approach risks identifying false negatives—rejecting spatial associations that are systemic associations. Given the
        known distributions of Clovis and proboscidean sites, how likely is it that artifacts are coincidentally associated with proboscidean remains?
        Conversely, how many spatial associations could be unrecognized butchery sites? To answer these questions, we simulated chance
        associations by plotting empirically informed densities and sizes of archaeological and proboscidean sites on simulated landscapes in
        which people and animals are (a) uniformly distributed and (b) tethered to water sources. The simulated frequencies of coincidental
        associations were compared to the observed frequency of co-occurrences. Our results suggest that of the 31 indeterminate empirical
        associations, at least 17 and as many as 26 are likely systemic associations, more than doubling previous estimates and revealing a greater
        role of humans in Pleistocene proboscidean exploitation than previously recognized.
        Keywords: Pleistocene, North America, Proboscidean, Clovis
        (Received 3 December 2019; accepted 12 January 2021)

        INTRODUCTION                                                                               time span and taphonomic biases (Surovell and Waguespack,
                                                                                                   2008; Surovell and Grund, 2012; Wolfe and Broughton, 2020).
        The archaeological record shows that Clovis groups at least occa-
                                                                                                       A recent reevaluation of the record of human hunting of extinct
        sionally killed or scavenged now-extinct Pleistocene megafauna.
                                                                                                   megafauna only accepted a butchery site if “evidence for the asso-
        These species play an important role in the traditional interpretation
                                                                                                   ciation between artifacts and extinct mammal remains supported
        of Clovis foragers as highly mobile big game specialists (Kelly and
                                                                                                   not just the contemporaneity of the two, but was also sufficient
        Todd, 1988). However, the discovery of new sites and new interpre-
                                                                                                   to document that people were involved in the demise of the ani-
        tations of old evidence have questioned this original interpretation
                                                                                                   mal” (Grayson and Meltzer, 2015, p. 177). In other words, spatial
        and ignited debate. The frequency of megafauna hunting by
                                                                                                   association of archaeology with megafaunal remains is not enough
        Clovis has implications for multiple aspects of Pleistocene life,
                                                                                                   to conclude cultural utilization. Using these criteria, only 15 of
        including subsistence (e.g., Waguespack and Surovell, 2003;
                                                                                                   more than 75 proposed sites are widely accepted as megafaunal
        Cannon and Meltzer, 2004), the human role in megafaunal extinc-
                                                                                                   butchery sites (Grayson and Meltzer, 2002, 2015).
        tions (Martin, 1967), division of labor (Waguespack, 2005), and
                                                                                                       Proboscideans (Mammuthus, Mammut, and Cuvieronius) are
        human motivations for large game hunting, whether economic or
                                                                                                   particularly important in the Pleistocene megafauna hunting
        social (Byers and Ugan, 2005; Lupo and Schmitt, 2016). One fre-
                                                                                                   record, as these genera are found at 14 of the 15 widely accepted
        quent challenge to the Clovis subsistence specialist and overkill
                                                                                                   sites (Grayson and Meltzer, 2015). In the absence of lithic arti-
        hypothesis is the low frequency of sites with strong evidence for
                                                                                                   facts, bone breakage or disarticulation are used as indicators of
        megafauna butchery (e.g., Haynes and Stanford, 1984; Meltzer,
                                                                                                   cultural association in some of the proposed sites (e.g., Carlson
        1986; Grayson, 2001; Grayson and Meltzer, 2002, 2003, 2015;
                                                                                                   and Steele, 1992; Holen, 2006). However, lithic artifacts occur
        Wroe et al., 2004). However, others have proposed the number of
                                                                                                   with proboscidean remains in at least 31 questionable sites
        observed butchery sites is reasonable given the relatively short
                                                                                                   (Table 1). While these 31 sites do not pass the confirmation cri-
                                                                                                   teria, most cannot be ruled out as cultural associations either. At
           *Corresponding author email addresses: mmackie@uwyo.edu (M.E. Mackie);                  least three offer convincing evidence of coincidental association—
        wrhaas@ucdavis.edu (R. Haas).
                                                                                                   the Trappey, Huntington, and Richmond sites, which have point
           Cite this article: Mackie ME, Haas R (2021). Estimating the frequency of coincidental
        spatial associations between Clovis artifacts and proboscidean remains in North America.   types that postdate the Early Paleoindian period. This leaves 28
        Quaternary Research 1–11. https://doi.org/10.1017/qua.2021.1                               sites of questionable association. In this analysis, we take a
        © University of Washington. Published by Cambridge University Press, 2021

Downloaded from https://www.cambridge.org/core. University of Wyoming, on 17 Mar 2021 at 13:36:08, subject to the Cambridge Core terms of use, available at
https://www.cambridge.org/core/terms. https://doi.org/10.1017/qua.2021.1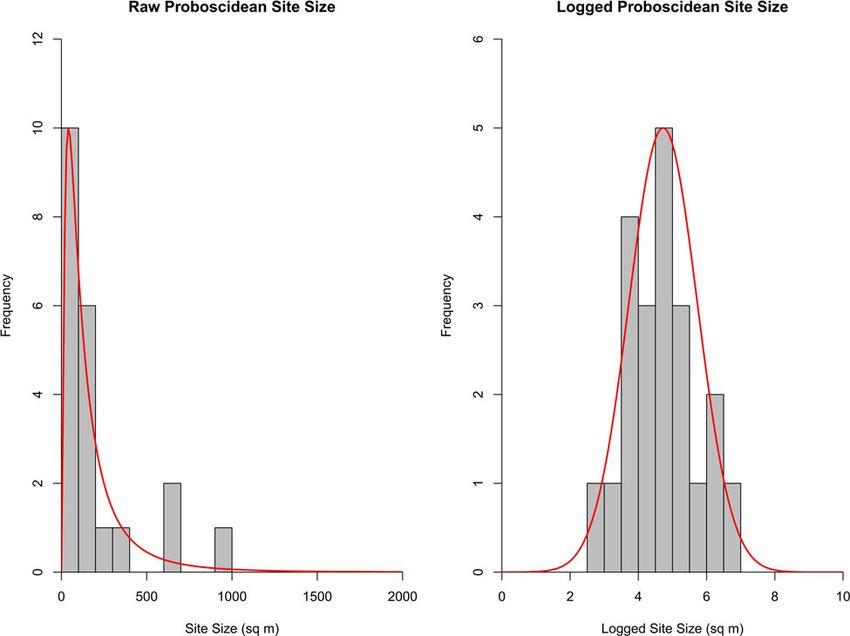
2                                                                                                                                             M.E. Mackie and R. Haas

       Table 1. Cases of spatial association between artifacts and proboscideans at             paleontological record of known associations to evaluate the prob-
       sites not widely accepted as proboscidean kill/butchery sites.                           ability of observing the 31 coincidental associations that are cur-
           Site                  State         Reference                                        rently not considered cultural.

           Aubrey                TX            Ferring, 2001, p. 240
                                                                                                MATERIALS AND METHODS
           Bartow                OK            Kerr, 1964
                                                                                                Multiple previous studies have used computer simulations to ana-
           Boaz                  WI            Palmer and Stoltman, 1976                        lyze Pleistocene megafauna extinction, with an emphasis on
           Chalk Rock            SD            Fosha and Donohue, 2005                          assessing the overkill hypothesis (e.g., Alroy, 2001; Prescott
           Claypool              CO            Dick and Mountain, 1960
                                                                                                et al., 2012; Lima Riebeiro et al., 2013; Zuo et al., 2013; for review,
                                                                                                see Yule et al., 2014). These simulations explored the timing, spa-
           El Abrevadero         CH            Chacon-Soria and Aguilar, 2010                   tial distributions, or human population size required to cause
                                 (MX)
                                                                                                megafauna extinction. Here, modeling is used for a different pur-
           Guest                 FL            Rayl, 1974; Hoffman, 1983                        pose—to create a null model of incidental spatial association
           Hardin County         OH            Lepper, 1983                                     between artifacts and remains of now-extinct megafauna.
                                                                                                    Our analysis follows six major steps: (1) generate a sample of
           Hebior                WI            Overstreet and Kolb, 2003
                                                                                                Clovis and proboscidean sites of empirically informed sizes, (2)
           Huntington            UT            Madsen, 2000                                     model a site probability landscape that accounts for water-
           Reservoir                                                                            tethering behavior, (3) place the sites on the model landscape at
           Jetmore               KS            Asher and Holen, 2013                            an empirically informed geographic density, (4) identify and
           Klein                 CO            Zier et al., 1993
                                                                                                tally geographic overlap between proboscidean and Clovis sites,
                                                                                                (5) repeat the procedure many times, and (6) use the theoretical
           La Prele              WY            Byers, 2002; Mackie et al., 2020                 coincidence frequencies to estimate how many of the 31 empirical
           Leikem                AZ            Haynes and Huckell, 2007                         associations in North America are likely to be coincidental
           Lewisville            TX            Crook and Harris, 1958
                                                                                                (Table 2). In addition to assuming water-tethered use of North
                                                                                                American landscapes, we also compare the empirically observed
           Martins Creek         OH            Brush and Smith, 1994                            record to a second, simpler model that assumes uniformly ran-
           McClean               TX            Ray and Bryan, 1938                              dom spatial distributions to estimate coincidental associations.
                                                                                                We describe the finer points of each step, including sampling pro-
           Miami                 MO            Hamilton, 1996
                                                                                                cedure and parameterization, here and present our code in
           Navarette             AZ            Haynes and Huckell, 2007, p. 3                   Supplementary Material 1.
           Orleton Farms         OH            Thomas, 1952
           Page-Ladson           FL            Halligan et al., 2016                            Clovis site density
           Richmond              IN            Sanford, 1935                                    In discussions of continental trends in the Clovis record, the focus
           Schaefer              WI            Overstreet and Kolb, 2003                        is usually on a limited number of sites classified as “Classic
                                                                                                Clovis” based on their large assemblages, secure dating, or signifi-
           Seeley                OH            Murphy, 1983
                                                                                                cant artifacts (Waters and Stafford, 2007; Miller et al., 2014). In
           Sloth Hole            FL            Hemmings, 1998; Halligan, 2012                   contrast, our simulations require an overall density that represents
           Trappey               LA            Gibson and Miller, 1973                          the sum of all discovered Clovis localities. This is a challenging
                                                                                                number to estimate because of inconsistencies in projectile
           UP                    WY            Haynes et al., 2013; Prasciunas et al.,
                                               2016                                             point classification, difficulties with dating Clovis sites in the
                                                                                                absence of clear temporal diagnostics, and the rarity of terminal
           Virgil Schulz         SD            Fosha et al., 2012                               Pleistocene sites compared to the more abundant recent archaeo-
           Wallmann              NV            Dansie et al., 1988                              logical record. It is further complicated by the fact that many pos-
           Wenas                 WA            Lubinski, 2014
                                                                                                sible Clovis sites are only documented in the gray literature or
                                                                                                have never been formally reported. Fortunately, several formal
           Willard               OH            Falquet and Hanebert, 1978                       surveys of state archaeological databases have systematically
                                                                                                searched and evaluated all possible Early Paleoindian sites.
                                                                                                Archaeological database searches have been published for
       quantitative approach to assessing the nature of associations and                        Wyoming, New Mexico (Mullen, 2008), Texas (Bever and
       ask how many could have occurred by chance alone given what is                           Meltzer, 2007), and Illinois (Loebel, 2012). While the surveys in
       known about the geographic distributions and densities of Clovis                         Wyoming, New Mexico, and Texas show low densities of sites
       and proboscidean sites.                                                                  (approximately one site per 10,000 km2), the Illinois survey
          Using the observed record of Clovis and proboscidean sites                            shows high densities, with approximately one site per 1000 km2
       and knowledge of land-use behavior, we approach the question                             (Fig. 1, Supplementary Table 1).
       of coincidental artifact association with megafaunal remains by                              Densities for 10 additional states were compiled using
       simulation. The simulations use empirically informed densities                           state-specific fluted-point surveys available through the
       and sizes of Clovis and proboscidean sites in concert with water-                        Paleoindian Database of the Americas (PIDBA; http://pidba.utk.
       tethering behavior to estimate how many coincidental spatial                             edu; Anderson et al., 2010, 2019). These point surveys were
       associations we should expect in the archaeological record. This                         selected because they contain projectile points that are classified
       null model is compared to the observed archaeological and                                into diagnostic categories (e.g., Clovis, Folsom, Gainey) and

Downloaded from https://www.cambridge.org/core. University of Wyoming, on 17 Mar 2021 at 13:36:08, subject to the Cambridge Core terms of use, available at https://www.cambridge.org/core/terms
. https://doi.org/10.1017/qua.2021.1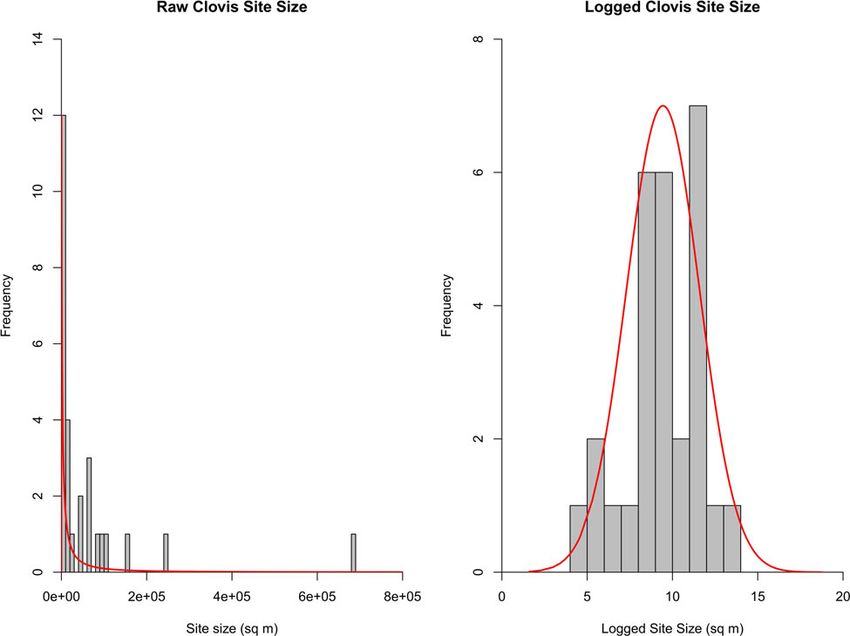
Estimating the frequency of coincidental spatial association between Clovis artifacts and proboscidean remains                                                               3

        Table 2. Pseudocode for simulating and counting coincidental associations between archaeological and paleontological proboscidean sites.

           Line   Description

           1      Site location selection (1000 iterations)
           2           Select 55 x 55 km sample location in the study area
           3           Use the surface water model to calculate linear distances from surface water
           4           Convert linear distances to site-probablity distance decay surface using a decay term of 0.5
           5           Use site probablity model to place 2 proboscidean sites, 4 isolated artifacts, and 2 Clovis sites
           6      Assign site sizes and check for associations (10,000 iterations)
           7           Assign sizes to sites
           8                Select proboscidean and Clovis site areas based on their respective lognormal site-size models
           9                Assigned a radius of 1 m to all isolates
           10          Check for associations
           11               Select a proboscidean site and determine if any archaeological site or isolate have overlapping boundaries
           12                    If yes add an association and continue checking other sites/isolates
           13                    If no move onto next proboscidean site
           14               Save the total number of associations seen at proboscidean sites
           15               Save the attributes (e.g., x, y, type, size) of any proboscidean or archaeological entity which was identified as associated

        include site-level provenience. For each state, we identified the                        Paleoindian projectile points for North America, with point fre-
        projectile points classified as Clovis, or possibly Clovis, and                          quencies totaled for all counties in the United States. The quality
        counted the total number of unique sites that contained these                            of reporting varies, with the most comprehensive records in the
        diagnostics. Points with only county or regional geographic pro-                         eastern states. PIDBA, along with regional surveys (e.g., Bever
        venience were not included in this analysis. Admittedly, isolated                        and Meltzer, 2007; Asher, 2016), currently form the best summa-
        Clovis artifacts located on later occupations could be counted or                        ries of Clovis point densities. While there are inherent biases in
        sites not included in the database could be missed, but we assume                        PIDBA related to inconsistent reporting, lack of standardization,
        such errors are minimal, and that the data offer a reasonable                            population density, extent of agricultural development, and dif-
        approximation of the number of localities containing Clovis diag-                        ferential intensity of research (Anderson and Fought, 1998;
        nostics. For all density variables, site counts were converted to                        Shott, 2002; Prasciunas, 2011), it is widely used as an indicator
        densities using a state’s total land area excluding perennial                            of general trends in point frequencies for large-scale analyses.
        water sources (United States Census Bureau, 2018). While this                            Moreover, those biases pertain to questions about systemic pro-
        could underestimate the areal extent of water sources in the                             cesses that would allow estimates of, for example, Clovis popula-
        Pleistocene, which was generally a wetter period than today, we                          tion densities and mobility patterns. Our purpose is less
        assume any resultant decrease in calculated site density would                           concerned with systemic behaviors per se and more concerned
        be negligible relative to the total landmass under consideration.                        with archaeological outcomes that are the result of both systemic
            We found that Clovis site densities from 14 states range from                        and postdepositional processes, including all of their biases
        0.08 to 2.38 sites per 1000 km2 (Fig. 1). The maximum Clovis site                        (Schiffer, 1987). In other words, the archaeological record is
        density recorded is based on the presence of Clovis points at 12                         what conditions the chance associations of interest to this
        sites in Delaware. The modeled mean density of 0.67 sites per                            analysis.
        1000 km2 is used for the Clovis site density in our simulations.                             To establish reasonable ranges of Clovis isolate densities,
                                                                                                 counts were compiled from PIDBA and various regional surveys
                                                                                                 of Early Paleoindian projectile point databases (e.g., Bever and
        Clovis isolate density
                                                                                                 Meltzer, 2007; Asher, 2016). Only overall quantities of points
        Current site density estimates do not integrate isolated artifacts                       per state were used, and no attempt was made to separate points
        because of archaeological site recording conventions, which                              based on the context of their discovery. Since some of the points
        make a distinction between sites and isolated artifacts. Yet isolates                    likely came from sites where multiple points were present, this
        are crucial for our analysis given the possibility that an isolated                      could spuriously inflate isolate density, thereby increasing the
        Clovis artifact could coincidentally fall within the boundaries of                       chance of an association in the simulations. We assume that
        a proboscidean site, leading to a coincidental association. To                           such effects are likely minimal. If counts for the same state dif-
        establish the density of Clovis isolates we again turned to                              fered between sources, the highest count was used. States that
        PIDBA and various regional surveys. Archaeologists have com-                             had no Clovis points recorded in PIDBA (n = 17) were excluded.
        piled and analyzed fluted-point distributions to evaluate patterns                           Of the 31 states with reported Clovis points, densities vary
        of Paleoindian land use and demography (e.g., Anderson and                               from well under one point to more than six points per 1000
        Fought, 1998; Blackmar, 2001; Taylor, 2003; Bever and Meltzer,                           km2 (Fig. 1, Supplementary Table 2). Based on the mean of 31
        2007; Anderson et al., 2019). PIDBA provides counts of                                   states, isolate density is set to 1.25 points per 1000 km2.

Downloaded from https://www.cambridge.org/core. University of Wyoming, on 17 Mar 2021 at 13:36:08, subject to the Cambridge Core terms of use, available at https://www.cambridge.org/core/terms
. https://doi.org/10.1017/qua.2021.1
4 M.E. Mackie and R. Haas
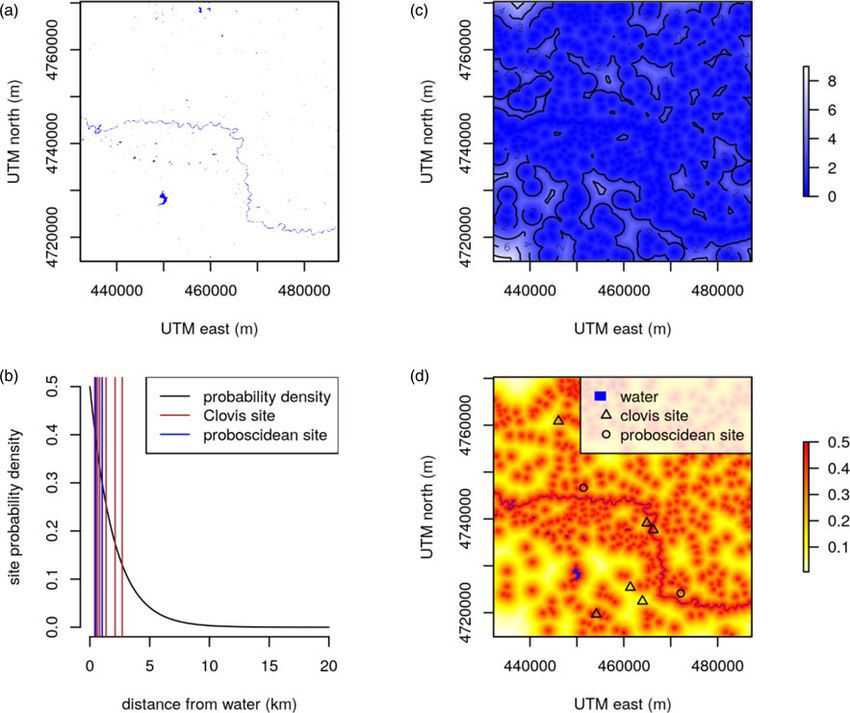
Figure 1. Density of Clovis points (n = 31) and Clovis
sites (n = 14) by state per 1000 km2.
Clovis site size size, nonoverlap between occupations, and dispersion of materi-
als) randomly contribute to area variation, a lognormal distribu-
Ethnographic and archaeological research has shown that many
tion offers a theoretically reasonable model of site-area variation
factors influence hunter-gatherer site size, including reoccupation,
(Mitzenmacher, 2004; Haas et al., 2015).
length of occupation, available area, and occupation group size
In order to model site size, we fit a lognormal distribution to
(Surovell, 2009; Hamilton et al., 2018; Haas and Kuhn, 2019).
archaeologically observed site sizes from 28 well-documented
Additionally, errors during measurement due to amorphous site
Clovis sites (Fig. 2, Supplementary Table 3). Since these areal
shape, postdepositional disturbances, and the subjective nature
extents are meant to replicate the entire Clovis record irrespective
of defining site area can affect site-size estimation. Regardless,
of site type, campsites, kill/scavenges, and workshops were
recent analysis has identified statistical regularities in the
included. If the site size was reported by investigators, that
archaeological outcome of hunter-gatherer site sizes. Haas and
value was used. Otherwise, areal extent was derived using the
colleagues (Haas et al., 2015; Haas and Kuhn, 2019) observed
method outlined by Andrews et al. (2008), which estimates an
that site size from seven different hunter-gatherer settlement sys-
area using the smallest rectangular area that encompasses all
tems in North and South America followed a heavy-tailed distri-
Clovis-aged artifact clusters, excavation units, and trenches. This
bution. In other words, small sites are extremely frequent, and
method systematically overestimates site extent, but minimally
extremely large sites are rare. Two types of continuous statistical
so, and provides a standardized way to establish site area across
distributions—log normal and exponential—characterize varia-
diverse studies. Since overestimation of site size increases the
tion in the areal extents of hunter-gatherer sites remarkably
chance of coincidental spatial association, any effect makes a
well. Assuming the factors that contribute to site area (group
chance association more likely. A lognormal model with a mean
Downloaded from https://www.cambridge.org/core. University of Wyoming, on 17 Mar 2021 at 13:36:08, subject to the Cambridge Core terms of use, available at https://www.cambridge.org/core/terms
. https://doi.org/10.1017/qua.2021.1Estimating the frequency of coincidental spatial association between Clovis artifacts and proboscidean remains 5
Figure 2. (color online) Raw and logged Clovis areal extent (n = 27) with best-fit line of lognormal distribution.
log of 9.44 m2 (12,700 m2) and a log standard deviation of 2.14 m2 sites in the region, it is one of the only systematic attempts to iden-
produced the best fit to the archaeological data by maximum like- tify proboscidean localities over a large area; it therefore offers the
lihood estimation (Fig. 2, Supplementary Table 3). It also offered most complete account of the total number of proboscidean sites
a statistically plausible fit to the Clovis dataset compared to other paleontological compilations. All proboscidean
(Kolmogorov-Smirnov D = 0.10, p = 0.89), suggesting that the sites, regardless of age, were used to calculate densities because pro-
statistical model offers a reasonable approximation of Clovis site- boscidean remains from any period can become coincidentally asso-
size variation. ciated with archaeology. For the simulations, we chose to round up
proboscidean density (0.67 sites per 1000 km2) to account for any
possible underrepresentation in the observed record and to guard
Proboscidean site density against underestimation of coincidental associations. This should
only increase the potential for chance associations.
A recent survey of proboscidean remains from the mid-continent
has produced one of the most comprehensive records of probosci-
dean death sites in the American Midwest, a region known for high
Proboscidean site size
densities of proboscideans (Widga et al., 2017). The study encom-
passed portions of 12 states and identified 627 proboscidean local- Finally, proboscidean site size identifies the potential area for arti-
ities that were dominated by the American Mastodon (Mammut fact association, making it particularly influential for association
americanum) and mammoth (Mammuthus sp.) remains, although rates of Clovis isolates. The areal extent of excavations at 22 probos-
a few localities contained other older proboscidean taxa (Wigda cidean sites was measured (Fig. 3, Supplementary Table 4).
et al., 2017). While most localities only contained teeth (n = 401, Accepted and proposed butchery sites, as well as natural death
61%), 101 (15%) consisted of partial or complete skeletons. Of sites, were included in order to replicate the excavation styles of
the 93 reported dates from this collection, 56% (n = 53) have an archaeologists, paleontologists, and avocationalists. Since artifact
age younger than 15,000 cal yr BP. To establish a density of probos- discoveries are generally limited to excavated portions of sites,
cidean sites, we measured the total area encompassing the localities the excavated area immediately surrounding the proboscidean
(1,476,754 km2), resulting in a density of 0.42 proboscideans per remains was used to identify site extent. If the total area of the
1000 km2. While this density may be inflated compared to other immediate excavation area was reported or could be calculated
portions of the continent due to the high frequency of proboscidean from a published figure, that was used. Sites with poorly defined
Downloaded from https://www.cambridge.org/core. University of Wyoming, on 17 Mar 2021 at 13:36:08, subject to the Cambridge Core terms of use, available at https://www.cambridge.org/core/terms
. https://doi.org/10.1017/qua.2021.16 M.E. Mackie and R. Haas
Figure 3. (color online) Raw and logged proboscidean site areal extent (n = 21) with best-fit line of lognormal distribution.
or irregular excavation blocks were measured using the same expect geographic tethering to water sources to inflate coinciden-
method outlined for determining Clovis site size (Andrews et al., tal co-occurrence of proboscidean and human sites.
2008). Excavation areas varied in size from 20 m2 to more than To model the effects of water tethering on the geographic distri-
950 m2 (Fig. 3). As in our approach to modeling Clovis site-size bution of paleontological and archaeological sites in Pleistocene
variation, a maximum likelihood estimation was used to fit a log- North America, we first modeled the geographic distribution of
normal distribution to the proboscidean site-size data, resulting water using an empirical global surface-water database compiled
in a log mean of 4.73 m2 (113 m2) and a log standard deviation by Pekel et al. (2016). This high-resolution raster database is
of 1.00 m2 (Fig. 3). The modeled site-size distribution was statisti- resolved to approximately 30 m, a resolution that approaches a
cally consistent with the empirical site sizes (Kolmogorov-Smirnov, behaviorally meaningful geographic scale (Fig. 4a). The exact reso-
D = 0.14, p = 0.78), suggesting that the statistical model offers a rea- lution varies slightly by latitude. Despite this high resolution, the
sonable approximation of Clovis site-size variation. model cannot capture small seeps and springs and therefore
tends to underestimate bioavailable surface water. Further, the data-
base reflects contemporary conditions rather than the late
Pleistocene conditions of interest, thus also leading to underestima-
Site placement with water tethering
tion of surface water. To minimize these effects, we used the annual
One approach to modeling a coincidental spatial association maximum water extent dataset. Together, these data limitations are
might be to randomly distribute sites on a virtual landscape, likely to underestimate Pleistocene surface water, inflating the
and we did explore this approach. However, such a uniform ran- chances of spatial coincidence of proboscidean and human archae-
dom distribution fails to capture land-use biases that can affect ological sites. Thus, the surface-water model is a liberal model for
geographic co-occurrence. Perhaps the most important factor estimating the frequency of coincidental associations and a conser-
biasing both proboscidean and human land-use patterns is vative model for estimating the frequency of systemic associations.
water. Both species are obligate drinkers, requiring nearly daily Although the surface-water model allows us to identify promi-
access to water (Packer 2002; Institute of Medicine 2004, nent locations on proboscidean and human landscapes, it does
pp. 73–185). Observations of modern mass African elephant not specify how tightly those species should adhere to those loca-
(Loxodonta africana) die-offs have shown that remains are rarely tions. Water is critical, but it must be balanced against access to
found more than 6–8 km from water sources (Corfield, 1973; other geographically dispersed resources. Following basic Poisson
Haynes, 1988; Haynes and Klimowicz, 2015). We might therefore point-process dynamics (Tijms, 2003), we modeled water tethering
Downloaded from https://www.cambridge.org/core. University of Wyoming, on 17 Mar 2021 at 13:36:08, subject to the Cambridge Core terms of use, available at https://www.cambridge.org/core/terms
. https://doi.org/10.1017/qua.2021.1Estimating the frequency of coincidental spatial association between Clovis artifacts and proboscidean remains 7
Figure 4. (color online) The water-tethering model used in one iteration of this analysis. (a) Surface-water model for a selected 3025-km2 area on the landscape. (b)
A distance-from-water model derived from the surface-water model. (c) An exponential decay model for site occurrence relative to surface water, based on Corfield
(1973), which assumes that 95% of proboscidean and human sites will be within 6 km of water. (d) The distance-from-water model converted to a probability of
occurrence surface using the exponential decay water-tether function. Simulated sites from one iteration are shown in (c) and (d).
as an exponential distance decay function such that the probability Table 3. Site densities and frequencies per simulation.
of finding a site is highest at the water source and decays with dis-
Number
tance (Fig. 4b). To obtain an appropriate distance-decay rate, we Observed continental placed per
solved for an exponent that ensures 95% of occurrences fall within averages 3025-km2
6 km from water, which is an approximation of Corfield’s (1973) Model variables (sites/1000 km2) simulation
and Haynes’s (1988) observations that African elephant remains
Clovis site density 0.67 2
are rarely found more than 6–8 km from water. We found that
an exponential decay term of 0.5 meets this criterion. We assume Clovis isolate density 1.25 4
the same decay function for humans, given that both elephants Proboscidean site density 0.42 2
and humans have similar water requirements.
To place a given proboscidean or Clovis site on the simulated
landscape, we created a Euclidean distance-to-water model from
the surface-water model (Fig. 4c; Hijmans, 2019), drew a distance
Model parsing and iteration
from the exponential probability function (see Fig. 4b), and
placed the site at the location on the distance-to-water raster near- Because of the continental geographic scale of our study and the
est to the drawn distance (Fig. 4d). For example, to place a pro- high resolution of the surface-water dataset, it was computation-
boscidean site on the landscape, we might draw a distance of ally prohibitive to conduct our simulations for the entire study
150.24 m from the exponential probability function, locate the area all at once. We therefore parsed our analysis into 1000
cell in the distance-to-water raster that has a value closest to smaller geographic units. To do this, 1000 random locations
150.24 m, and place the site at that location. This procedure were selected from the study area, defined as the boundary of
ensured that site placement was biased to water under realistic the coterminous United States. To minimize geographic bias in
conditions of surface water geometry and water-tethering our selection, the study area was projected to the Albers equal-
behavior. area conic projection. For each location, we selected a
Downloaded from https://www.cambridge.org/core. University of Wyoming, on 17 Mar 2021 at 13:36:08, subject to the Cambridge Core terms of use, available at https://www.cambridge.org/core/terms
. https://doi.org/10.1017/qua.2021.18 M.E. Mackie and R. Haas
55-x-55-km (3025 km2) area centered on the location and pro- coincidental associations but suggests at least 11 additional coin-
jected the sample area to the Universal Transverse Mercator cidental associations. Conversely, at least 17 of the 31 archaeolog-
(UTM) system. The UTM projection served to minimize geo- ically observed artifact-proboscidean sites are likely systemic.
graphic distance distortion. Once the 3025-km2 sample area was The results from the water-tethered model can be compared to
defined and projected, the corresponding surface-water raster a second null model that randomly places sites on the landscape
was selected, projected to the corresponding UTM system, and using the same archaeological and paleontological densities and
cropped to the sample area. All geographic projections were per- site sizes. Of the 200,000 proboscidean sites simulated (two sites
formed in the R statistical computing environment (R Core Team for 100,000 iterations), 19 proboscidean sites (0.0095%) were
2020) using the packages Raster (Hijmans, 2019), Geospatial Data coincidentally associated with a Clovis archaeological site. This
Abstraction Library (Bivand et al., 2019a), Geometry Engine gives a chance-association rate of 6.3 × 10⁻⁸ associations/km2
Open Source (Bivand et al., 2019b), and sp (Pebesma and [19 associations/(3025 km2 × 100,000 iterations)]. Projecting this
Bivand, 2005; Bivand et al., 2013). co-occurrence rate to continental North America, we should
For each of the 1000 sample areas, two proboscidean sites, four not expect to observe any coincidental associations (6.3 × 10⁻⁸
isolated Clovis points, and two Clovis sites were placed on the associations/km2 × 14 million km2 = 0.88 associations). Since at
landscape (Table 3). These counts reflect the densities deduced least three of the 31 observed sites are likely coincidental associ-
in our empirical analyses presented above. Each Clovis and pro- ations, this simulation appreciably underestimates chance associ-
boscidean site was further assigned a size based on the lognormal ations and shows that water tethering plays an important role in
statistical models derived from real-world areal extents, also pre- driving chance associations, even if such behavior cannot account
sented above (Figs. 2 and 3). Clovis isolates were given an areal for all empirical associations.
extent of 3.14 m2 (radius of 1 m), which approximates the spatial
proximity that archaeologists would typically accept as a tentative
DISCUSSION
spatial association between artifact pairs.
Geographic associations between Clovis and proboscidean Our literature review indicates that of the 45 proboscidean sites
sites were tallied for the 1000 sample areas, which total approxi- with lithic artifact associations in North America, 14 are accepted
mately 3 million km2. To derive an expected coincidental associ- butchery sites, meeting the strictest criteria of spatial association
ation frequency for North America, that rate of occurrences was and evidence of human-animal interaction (Grayson and
then projected to the size of habitable land in Pleistocene North Meltzer, 2015). Conversely, at least three sites are likely coinciden-
America, which is estimated at 14 million km2. This estimate is tal associations. The remaining 28 sites are indeterminate, having
based on the total area of North America (25 million km2) less not been confirmed as systemic associations (Table 1). We have
an estimated areal extent of Pleistocene glaciers (10 million taken a quantitative approach to assessing the proportion of
km2) and southern Mexico (1 million km2). Southern Mexico is these indeterminate sites that could reasonably be excluded or
excluded because of a general lack of Paleoindian research in included as systemic cultural associations given the basic proper-
that region. Finally, site-size assignment and coincidental fre- ties of Clovis and proboscidean site size and geographic distribu-
quency estimation were repeated 10,000 times to estimate error tion. Given observed densities and sizes of Clovis and
in the modeled association frequencies. proboscidean sites and tethering to water sources, our simulations
To assess the effects of water-tethering behavior, a second null suggest that the most likely frequency is nine coincidental associ-
model placed site locations randomly within each 3025-km2 ations and 22 systemic associations, with 95% of the simulations
simulation area. The same archaeological and paleontological densi- producing 5–14 coincidental associations. These observations fur-
ties were used—two proboscidean sites, four Clovis points, and two ther suggest that many of the empirically observed artifact-
Clovis sites within each iteration—with site sizes dictated by the log- proboscidean associations (17–26) are likely systemic. If anything,
normal models created from real-world extents (Figs. 2 and 3). this simulation may overestimate coincidental associations given
Associations between archaeological and paleontological sites were our conservative approach, which guards against underestimating
tallied for 100,000 iterations, which totaled 302 million km2. chance associations. The second, uniformly random spatial model
shows that in the absence of water tethering, no coincidental asso-
ciations should be expected in an area the size of North America
RESULTS
at these site densities. Given that at least three of the empirically
Of the 20 million water-tethered proboscidean sites simulated observed sites are likely coincidental associations, we know this is
(2000 sites simulated 10,000 times), 20,835 proboscidean sites an underestimation of chance associations, as archaeological land-
(0.1%) were coincidentally associated with a Clovis archaeological scapes are spatially heterogeneous.
site (Fig. 5). No Clovis isolates were found in association with a Given the relatively small number of 14 widely accepted pro-
proboscidean site. Per 1000 sample areas, iterated 10,000 times, boscidean butchery sites, the addition of any site to the record
the number of associations varied from zero to seven, with a is significant. Our conservative estimate more than doubles the
mode of two associations per 3.025 million km2 and 95% of the count, suggesting a 121% increase in butchery sites. Our best esti-
iterations producing one to three associations (Fig. 5). When mate of 22 systemic sites suggests a 157% increase. These figures
this result is scaled to the size of North America, the modal expec- hold implications for ongoing debates in Paleoindian archaeology
tation is nine coincidental associations, with 95% of simulations related to Clovis subsistence and the cause of Pleistocene mega-
predicting 5–14 coincidental associations. Conversely, the results faunal extinctions. For example, one common critique of the over-
indicate that that 22 of the 31 sites are likely systemic (i.e., kill hypothesis is the apparent low frequency of sites with
“real”) associations, with a 95% confidence interval of 17–26 sys- evidence for human hunting of now-extinct fauna (e.g., Meltzer,
temic associations. In other words, fewer than 14 of the 31 empir- 1986; Grayson, 2001; Grayson and Meltzer, 2002). The increase
ically observed archaeological-proboscidean sites are coincidental. in the number of culturally associated proboscidean sites inferred
This frequency readily accounts for the three confirmed in our analysis is consistent with an appreciably greater degree of
Downloaded from https://www.cambridge.org/core. University of Wyoming, on 17 Mar 2021 at 13:36:08, subject to the Cambridge Core terms of use, available at https://www.cambridge.org/core/terms
. https://doi.org/10.1017/qua.2021.1Estimating the frequency of coincidental spatial association between Clovis artifacts and proboscidean remains 9
Figure 5. Histogram of the number of coincidental associations
for 10,000 iterations of the 1000 site locations expressed as both
raw count of associations per iteration (3.025 million km2) and
expected coincidental associations adjusted to the total area
of Pleistocene North America (14 million km2).
proboscidean hunting, thus supporting the hypothesis that additional field or collections work before they can be widely
humans played a role in their disappearance from North America. accepted (Grayson and Meltzer, 2002, 2015). Some have had
The relatively low frequency of secure cultural associations this work recently completed (e.g., Halligan et al., 2016; Mackie
with proboscidean remains has led to the conclusion that these et al., 2020), but it was since the last significant review of mega-
species were not frequently included in the Clovis diet because fauna butchery sites (Grayson and Meltzer, 2015), so we contin-
there are “strikingly few archaeological sites that document ued to place them on the indeterminate list. Several sites do not
human predation on, or scavenging of, these now extinct animals” have well-defined ages (Dick and Mountain, 1960; Zier et al.,
(Grayson and Meltzer, 2015, p. 188). The addition of 17 or more 1993), a problem that can be addressed via concerted dating
sites with proboscidean remains would more than double the efforts. Others have the potential to contain geofacts (e.g.,
known instances of hunting or butchery. Further, there are only Lubinski et al., 2014) instead of human-produced assemblages,
approximately 40 sites that are commonly used to define the which would eliminate them from the potential megafauna butch-
Classic Clovis complex (Miller et al., 2014), 13 of which contain ery list (e.g., Tune et al., 2018).
megafauna (38%). Adding more proboscidean sites would create
an even greater portion of sites containing megafauna remains,
CONCLUSIONS
strengthening the arguments for dietary specialization.
No isolates were found in association with proboscidean It is only with the consolidation of nearly a century’s worth of
remains during the simulations. This highlights the extreme unlike- archaeological and paleontological data that we can begin to
lihood of a Clovis artifact falling within the area generally excavated take such quantitative approaches to the question of human-
around proboscidean remains. However, caution should be taken if megafauna associations. Based on the simulations presented
the projectile point is more recent, as archaeological site densities here, coincidental associations between archaeology and mega-
increase exponentially through time (Surovell et al., 2009). The rel- fauna can, and have been shown, to happen. Our best estimate
ative abundance of archaeological sites in more recent times is also suggests nine coincidental associations, and that 22 of the 31
why each of these sites must be evaluated further before acceptance. observed associations are systemic (Table 1). The low estimates
Nonetheless, these simulations do show that instead of skepticism place the additional number of systemic associations at 17,
there is a good chance that many associations with Paleoindian while more generous approximations indicate that 26 observed
artifacts are systemic, not postdepositional. It is worth noting associations are likely systemic. The default position of some
that, while the focus of this work is Clovis, some of the proposed scholars when finding lithics associated with proboscidean
sites listed here predate Clovis (e.g., Halligan et al., 2016). We remains is coincidental association. Our analysis shows that
chose to include them, as sites from any period can become coin- such an approach is likely to lead to overestimation of coinciden-
cidentally associated with artifacts. Further, these sites need to be tal associations. While additional site-specific work is needed
considered, as their inclusion on a list of widely accepted megafau- before any of the 31 spatially associated sites, in particular, are
nal butchery sites would be significant for early Paleoindian studies accepted or rejected as culturally associated, the results of the
as well as the overkill hypothesis. water tethered simulation suggest that 17–26 of these cases are
Although quantitative approaches that examine the record in likely due to systemic associations. Given that only 14 sites are
aggregate, such as this one, cannot assign any particular associa- currently widely accepted, a 121–186% increase in the known pro-
tion as a Paleoindian butchery site or a coincidental association, boscidean butchery sites is significant for understanding the
they nonetheless offer insight into how many known associations human exploitation of proboscideans in the Pleistocene.
can be considered butchery sites or coincidental associations. Depending on one’s theoretical perspective, scholars have tended
Quantitative approaches thus have an important role to play to draw different conclusions from spatial associations. At one
alongside more traditional site-centered approaches in evaluating extreme, any spatial association is viewed as evidence of human-
hypotheses. Most spatially associated sites reviewed here (Table 1) megafaunal interaction. At the other extreme, only spatial associ-
were only preliminarily investigated or reported and require ations without direct evidence of interaction are considered
Downloaded from https://www.cambridge.org/core. University of Wyoming, on 17 Mar 2021 at 13:36:08, subject to the Cambridge Core terms of use, available at https://www.cambridge.org/core/terms
. https://doi.org/10.1017/qua.2021.110 M.E. Mackie and R. Haas
evidence of an absence of interaction. Instead of viewing all spatial Chacon-Soria, E., Aguilar, F.J., 2010. El Abrevadero, Chihuahua: a site with
associations between artifacts and megafauna as confirmatory or remains of Pleistocene fauna and artifacts of early humans in northwestern
suspect, we should consider the full range of possibilities. Mexico. Current Research in Pleistocene 27, 8–9.
Corfield, T.F., 1973. Elephant mortality in Tsavo National Park, Kenya.
Supplementary Material. The supplementary material for this article can African Journal of Ecology 11, 339–368.
be found at https://doi.org/10.1017/qua.2021.1 Crook, W.W., Harris, R.K., 1958. A Pleistocene campsite near Lewisville,
Texas. American Antiquity 23, 233–246.
Acknowledgments. We thank Todd Surovell, Robert Kelly, Melissa Murphy, Dansie, A.J., Davis, J.O., Stafford Jr., T.W., 1988. The Wizards Beach reces-
Mark Clementz, Tom Demere, David Kilby, Tyler Faith, and an anonymous sion: Farmdalian (25,500 yr BP) vertebrate fossils co-occur with early
reviewer for useful comments on earlier drafts of this paper. David Holocene artifacts. In: Willig, J.A., Aikens, C.M., Fagan, J.L. (Eds.), Early
Anderson provided the most recent copy of PIDBA. This research did not Human Occupation in Far Western North America: The Clovis-Archaic
receive any grant from funding agencies in the public, commercial, or Interface. Nevada State Museum Anthropological Papers 21. Carson City,
not-for-profit sectors. Any errors are our own. NV, pp. 153–200.
Dick, H.W., Mountain, B., 1960. The Claypool site: a Cody Complex site in
northeastern Colorado. American Antiquity 26, 223–235.
REFERENCES Falquet, R.A., Hanebert, W.C., 1978. The Willard Mastodon: evidence of
Alroy, J., 2001. A multispecies overkill simulation of the end-Pleistocene human predation. Ohio Archaeologist 28, 17.
megafaunal mass extinction. Science 292, 1893–1896. Ferring, C.R., 2001. The archaeology and paleoecology of the Aubrey Clovis site
Anderson, David G, David Echeverry, D Shane Miller, Andrew A White, (41DN479), Denton County, Texas. Index of Texas Archaeology: Open Access
Stephen J Yerka, E Kansa and Sarah Whitcher Kansa, 2019. Gray Literature from the Lone Star State. https://doi.org/10.21112/ita.2001.1.37.
Paleoindian settlement in the Southeastern United States: the role of large Fosha, M., Donohue, J., 2005. Updates on the Chalk Rock site and its geologic
databases. In Early Floridians: new directions in the search for and interpre- relationship to Holocene/Pleistocene transition soils in South Dakota.
tation of Florida’s earliest inhabitants, edited by D. K. Thulman and E. Newsletter of the South Dakota Archaeological Society 35, 1–3.
G. Garrison, pp. 241–275. University Press of Florida, Gainsville. Fosha, M., Holen, S.R., Donohue, J., 2012. Virgil Schulz Mammoth.
Anderson, David G., D. Shane Miller, Stephen J. Yerka, J. Christopher Newsletter of the South Dakota Archaeological Society 42, 2.
Gillam, Erik N. Johanson, Derek T. Anderson, Albert C. Goodyear Gibson, J.L., Miller, L.J., 1973. The Trappey Mastodon. Institutional Research,
and Ashley M. Smallwood, 2010. PIDBA (Paleoindian Database of the University of Southwestern Louisiana, Lafayette.
Americas) 2010: Current status and findings. Archaeology of Eastern Grayson, D.K., 2001. The archaeological record of human impacts on animal
North America 38:63–89. populations. Journal of World Prehistory 15, 1–68.
Anderson, D.G., Faught, M.K., 1998. The distribution of fluted Paleoindian Grayson, D.K., Meltzer D.J., 2002. Clovis hunting and large mammal extinction:
projectile points: update 1998. Archaeology of Eastern North America 26, a critical review of the evidence. Journal of World Prehistory 16, 313–359.
163–187. Grayson, D.K., Meltzer D.J., 2003. A requiem for North American overkill.
Andrews, B.N., LaBelle, J.M., Seebach, J.D., 2008. Spatial variability in the Journal of Archaeological Science 30, 585–593.
Folsom archaeological record: a multi-scalar approach. American Grayson, D.K., Meltzer D.J., 2015. Revisiting Paleoindian exploitation of
Antiquity 73, 464–490. extinct North American mammals. Journal of Archaeological Science 56,
Asher, B.P., 2016. Across the Central Plains: Clovis and Folsom land use and 177–193.
lithic procurement. PaleoAmerica 2, 124–134. Haas, W.R., Klink, C.J., Maggard, G.J., Aldenderfer, M.S., 2015.
Asher, B.P., Holen, S., 2013. Jetmore Mammoth site (14HO1), Hodgeman Settlement-size scaling among prehistoric hunter-gatherer settlement sys-
County, Kansas. Kansas Anthropologist 34, 1–12. tems in the New World. PLOS ONE 10, e0140127.
Bever, M.R., Meltzer, D.J., 2007. Exploring variation in Paleoindian life ways: Haas, W.R., Kuhn, S.L., 2019. Forager mobility in constructed environments.
the third revised edition of the Texas Clovis fluted point survey. Bulletin of Current Anthropology 60, 499–535.
the Texas Archaeological Society 78, 65–99. Halligan, J., 2012. Geoarchaeological Investigations into Paleoindian
Bivand, R., Keitt, T., Rowlingson, B., 2019a. Rgdal: Bindings for the Adaptations on the Aucilla River, Northwest Florida. Texas A & M
“Geospatial” Data Abstraction Library. R Package Version 1.4-.8. https:// University, College Station.
CRAN.R-project.org/package=rgdal (accessed August 4, 2020). Halligan, J.J., Waters, M.R., Perrotti, A., Owens, I.J., Feinberg, J.M.,
Bivand, R., Pebesma, E., Gómez-Rubio, V., 2013. Applied spatial data anal- Bourne, M.D., Fenerty, B., Winsborough, B., Carlson, D., Fisher, D.C.,
ysis with R. Springer, New York. 2016. Pre-Clovis occupation 14,550 years ago at the Page-Ladson site,
Bivand, R., Pebesma, E., Gómez-Rubio, V., 2019b. Rgeos: Interface to Florida, and the peopling of the Americas. Science Advances 2, e1600375.
Geometry Engine–Open Source (“GEOS”). R Package Version 0.5-1. Hamilton, M.J., Buchanan, B., Walker, R.S., 2018. Scaling the size, structure,
https://CRAN.R-project.org/package=rgeos (accessed August 4, 2020). and dynamics of residentially mobile hunter-gatherer camps. American
Blackmar, J.M., 2001. Regional variability in Clovis, Folsom, and Cody land Antiquity 83, 701–720.
use. The Plains Anthropologist 46, 65–94. Hamilton, T.M., 1996. The Miami Mastodon, 23SA212. The Missouri
Brush, N., Smith, F., 1994. The Martins Creek Mastodon: a Paleoindian Archaeologist 54, 79–88.
butchery site in Holmes County, Ohio. Current Research in the Haynes, C.V., Huckell, B.B., 2007. Murray Springs: A Clovis Site with Multiple
Pleistocene 11, 14–15. Activity Areas in the San Pedro Valley, Arizona. University of Arizona Press,
Byers, D.A., 2002. Taphonomic analysis, associational integrity, and depositio- Tucson.
nal history of the Fetterman mammoth, eastern Wyoming, USA. Haynes, C.V., Surovell, T.A., Hodgins, G.W.L., 2013. The UP Mammoth site,
Geoarchaeology 17, 417–440. Carbon County, Wyoming, USA: more questions than answers.
Byers, D.A., Ugan, A., 2005. Should we expect large game specialization in the Geoarchaeology 28, 99–111.
late Pleistocene? An optimal foraging perspective on early Paleoindian prey Haynes, G., 1988. Longitudinal studies of African elephant death and bone
choice. Journal of Archaeological Science 32, 1624–1640. deposits. Journal of Archaeological Science 15, 131–157.
Cannon, M.D., Meltzer, D.J., 2004. Early Paleoindian foraging: examining the Haynes, G., Klimowicz, J., 2015. Recent elephant-carcass utilization as a basis for
faunal evidence for large mammal specialization and regional variability in interpreting mammoth exploitation. Quaternary International 359, 19–37.
prey choice. Quaternary Science Reviews 23, 1955–1987. Haynes, G., Stanford, D., 1984. On the possible utilization of camelops by
Carlson, D.L., Steele, D.G., 1992. Human-mammoth sites: problems and early man in North America. Quaternary Research 22, 216–230.
prospects. In: Fox, J.W., Smith, C.B., Wilkins, K.T. (Eds.), Proboscidean Hemmings, C.A., 1998. Probable association of Paleoindian artifacts and mas-
and Paleoindian Interactions. Baylor University Press, Waco, TX, pp. todon remains from Sloth Hole, Aucilla River, North Florida. Current
149–169. Research in the Pleistocene 15, 16–18.
Downloaded from https://www.cambridge.org/core. University of Wyoming, on 17 Mar 2021 at 13:36:08, subject to the Cambridge Core terms of use, available at https://www.cambridge.org/core/terms
. https://doi.org/10.1017/qua.2021.1Estimating the frequency of coincidental spatial association between Clovis artifacts and proboscidean remains 11
Hijmans, R.J., 2019. Raster: Geographic Data Analysis and Modeling. R Pacific Mammoth site, Wyoming. In: Kornfeld, M., Huckell, B.B. (Eds.),
Package Version 3.0-2 https://cran.r-project.org/web/packages/raster/index. Stones, Bones, and Profiles: Exploring Archaeological Context, Early
html (accessed August 4, 2020). American Hunter-Gatherers, and Bison. University of Colorado Press,
Hoffman, C.A., 1983. Mammoth kill site in the Silver Springs Run. Florida Boulder, pp. 235–257.
Anthropologist 36, 83–87. Prescott, G.W., Williams, D.R., Balmford, A., Green, R.E., Manica, A.,
Holen, S.R., 2006. Taphonomy of two last glacial maximum mammoth sites in 2012. Quantitative global analysis of the role of climate and people in
the central Great Plains of North America: a preliminary report on La Sena explaining late Quaternary megafaunal extinctions. Proceedings of the
and Lovewell. Quaternary International 142, 30–43. National Academy of Sciences 109, 4527–4531.
Institute of Medicine, 2004. Dietary Reference Intakes for Water, Potassium, Ray, C.N., Bryan, K., 1938. Folsomoid point found in alluvium beside a mam-
Sodium, Chloride, and Sulfate. National Academy Press, Washington, DC. moth’s bones. Science 88, 257–258.
Kelly, R.L., Todd, L.C., 1988. Coming into the country: early Paleoindian Rayl, S.L., 1974. A Paleo-Indian Mammoth Kill Site near Silver Springs,
hunting and mobility. American Antiquity 53, 231–244. Florida. Northern Arizona University, Flagstaff.
Kerr, H., 1964. Bartow Mammoth site. Oklahoma Anthropological Society R Core Team, 2020. R: A Language and Environment for Statistical
Newsletter 12, 4–8. Computing. R Foundation for Statistical Computing (accessed August 4,
Lepper, B., 1983. A preliminary report of a mastodon tooth find and a 2020). https://www.r-project.org/
Paleo-Indian site in Hardin County, Ohio. Ohio Archaeologist 33, 10–13. Sanford, J.T., 1935. The Richmond Mastodon. Proceedings of the Rochester
Lima-Ribeiro, M.S., Felizola Diniz-Filho, J.A., 2013. American megafaunal Academy of Science 7, 137–156.
extinctions and human arrival: improved evaluation using a meta-analytical Schiffer, M.B., 1987. Formation Processes of the Archaeological Record.
approach. Quaternary International 299, 38–52. University of New Mexico Press, Albuquerque.
Loebel, T.J., 2012. Pattern or bias? A critical evaluation of midwestern fluted Shott, M.J., 2002. Sample bias in the distribution and abundance of midwest-
point distributions using raster based GIS. Journal of Archaeological Science ern fluted bifaces. Midcontinental Journal of Archaeology 27, 89–123.
39, 1205–1217. Surovell, T.A., 2009. Toward a Behavioral Ecology of Lithic Technology: Cases
Lubinski, P.M., Terry, K., McCutcheon, P.T., 2014. Comparative methods for from Paleoindian Archaeology. University of Arizona Press, Tucson.
distinguishing flakes from geofacts: a case study from the Wenas Creek Surovell, T.A., Finley, J.B., Smith, G.M., Brantingham, P.J., Kelly, R., 2009.
Mammoth site. Journal of Archaeological Science 52, 308–320. Correcting temporal frequency distributions for taphonomic bias. Journal of
Lupo, K.D., Schmitt, D.N., 2016. When bigger is not better: the economics of Archaeological Science 36, 1715–1724.
hunting megafauna and its implications for Plio-Pleistocene hunter- Surovell, T.A., Grund, B.S., 2012. The associational critique of Quaternary
gatherers. Journal of Anthropological Archaeology 44, 185–197. overkill and why it is largely irrelevant to the extinction debate. American
Mackie, M.E., Surovell, T.A., O’Brien, M., Kelly, R.L., Pelton, S., Haynes, Antiquity 77, 672–687.
C.V., Frison, G.C., et al.., 2020. Confirming a cultural association at the Surovell, T.A., Waguespack, N.M., 2008. How many elephant kills are 14?
La Prele Mammoth site (48CO1401), Converse County, Wyoming. Clovis mammoth and mastodon kills in context. Quaternary
American Antiquity 85, 554–572. International 191, 82–97.
Madsen, D.B., 2000. A high-elevation Allerød-Younger Dryas megafauna Taylor, A.K., 2003. Results of a Great Basin fluted-point survey. Current
from the west-central Rocky Mountains. In: Madsen, D.B., Metcalf, M.D. Research in the Pleistocene 20, 77–79.
(Eds.), Intermountain Archaeology. University of Utah Anthropological Thomas, E.S., 1952. The Orleton Farms mastodon. The Ohio Journal of
Papers, Salt Lake City, pp. 100–113. Science 52, 1–5.
Martin, P.S., 1967. Prehistoric overkill. In: Martin, P.S., Wright, H.E. (Eds.), Tijms, H.C., 2003. A First Course in Stochastic Models. Wiley, New York.
Pleistocene Extinctions: The Search for a Cause. Yale University Press, Tune, J.W, Waters, M.R., Schmalle, K.A., DeSantis, L.R.G., Kamenov, G.D.,
New Haven, CT, pp. 75–120. 2018. Assessing the proposed pre-last glacial maximum human occupation
Meltzer, D.J., 1986. Pleistocene overkill and the associational critique. Journal of North America at Coats-Hines-Litchy, Tennessee, and other sites.
of Archaeological Science 13, 51–60. Quaternary Science Reviews 186, 47–59.
Miller, D.S., Holliday, V.T., Bright, J., 2014. Clovis across the continent. In: United States Census Bureau, 2018. State area measurements and internal
Graf, K., Ketron, C.V., Waters, M.R. (Eds.), Paleoamerican Odyssey. Texas point coordinates (accessed November 25, 2018). https://www.census.gov/
A&M University Press, College Station, pp. 207–220. geo/reference/state-area.html.
Mitzenmacher, M., 2004. A brief history of generative models for power law Waguespack, N.M., 2005. The organization of male and female labor in for-
and lognormal distributions. Internet Mathematics 1, 226–251. aging societies: Implications for early Paleoindian archaeology. American
Mullen, P.O., 2008. The Effects of Climate Change on Paleoindian Anthropologist 107, 666–676.
Demography. University of Wyoming, Laramie. Waguespack, N.M., Surovell, T.A., 2003. Clovis hunting strategies, or how to
Murphy, J.L., 1983. The Seeley Mastodon: a Paleo-Indian kill? Ohio make out on plentiful resources. American Antiquity 68, 333–352.
Archaeologist 33, 12–13. Waters, M.R., Stafford, T.W., 2007. Redefining the age of Clovis: implications
Overstreet, D.F., Kolb, M.F., 2003. Geoarchaeological contexts for late for the peopling of the Americas. Science 315, 1122–1126.
Pleistocene archaeological sites with human-modified woolly mammoth Widga, C., Lengyel, S.N., Saunders, J., Hodgins, G., Walker, J.D.,
remains in southeastern Wisconsin, USA. Geoarchaeology 18, 91–114. Wanamaker, A.D., 2017. Late Pleistocene proboscidean population dynam-
Packer, R., 2002. How Long Can the Average Person Survive Without Water. ics in the North American Midcontinent. Boreas 46, 772–782.
https://www.scientificamerican.com/article/how-long-can-the-average/ Wolfe, A.L., Broughton, J.M., 2020. A foraging theory perspective on the
(accessed August 20, 2020). associational critique of North American Pleistocene overkill. Journal of
Palmer, H.A., Stoltman, J.B., 1976. The Boaz Mastodon: a possible associa- Archaeological Science 119, 105162.
tion of man and mastodon in Wisconsin. Midcontinental Journal of Wroe, S., Field, J., Fullagar, R., Jermin, L.S., 2004. Megafaunal extinction in the
Archaeology 1, 163–177. late Quaternary and the global overkill hypothesis. Alcheringa 28, 291–331.
Pebesma, E., Bivand, R., 2005. Classes and methods for spatial data in R. R Yule, J.V., Fournier, R.J., Jensen, C.X.J., Yang, J., 2014. A review and synthe-
News 5. sis of late Pleistocene extinction modeling: progress delayed by mismatches
Pekel, J.F., Cottam, A., Gorelick, N., Belward, A.S., 2016. High-resolution between ecological realism, interpretation, and methodological transpar-
mapping of global surface water and its long-term changes. Nature 540, ency. The Quarterly Review of Biology 89, 91–106.
418–422. Zier, C.J., Jepson, D.A., McFaul, M., Doering, W., 1993. Archaeology and
Prasciunas, M.M., 2011. Mapping Clovis: projectile points, behavior, and bias. geomorphology of the Clovis-age Klein site near Kersey, Colorado. The
American Antiquity 76, 107–126. Plains Anthropologist 38, 203–210.
Prasciunas, M.M., Haynes Jr., C.V., Nials, F.L., McNees, L.M., Scoggin, Zuo, W., Smith, F.A., Charnov, E.L., 2013. A life-history approach to the late
W.E., Denoyer, A., 2016. Mammoth potential: reinvestigating the Union Pleistocene megafaunal extinction. The American Naturalist 182, 524–531.
Downloaded from https://www.cambridge.org/core. University of Wyoming, on 17 Mar 2021 at 13:36:08, subject to the Cambridge Core terms of use, available at https://www.cambridge.org/core/terms
. https://doi.org/10.1017/qua.2021.1You can also read