Worldwide adoption SHared automation Operating models for - SHared automation ...
←
→
Page content transcription
If your browser does not render page correctly, please read the page content below
SHared automation Operating models for
                Worldwide adoption
                                         SHOW

                    Grant Agreement Number: 875530

                  D10.1: Simulation scenarios and tools

This report is part of a project that has received funding by the European Union’s Horizon 2020
        research and innovation programme under Grant Agreement number 875530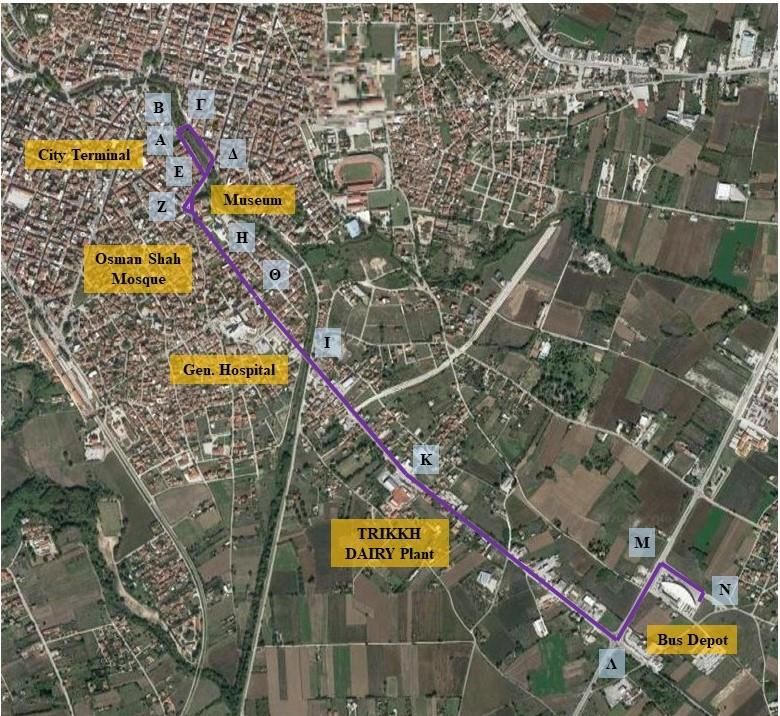
Legal Disclaimer
The information in this document is provided “as is”, and no guarantee or warranty is
given that the information is fit for any particular purpose. The above-referenced
consortium members shall have no liability to third parties for damages of any kind
including without limitation direct, special, indirect, or consequential damages that may
result from the use of these materials subject to any liability which is mandatory due to
applicable law. © 2020 by SHOW Consortium.
This report is subject to a disclaimer and copyright. This report has been carried out
under a contract awarded by the European Commission, contract number: 875530.
The content of this publication is the sole responsibility of the SHOW project.

D10.1: Simulation scenarios and tools                                                  2
Executive Summary
This document identifies all simulation tools which are used by all partners participating
in Work Package 10 of the SHOW project. Their applications range from vehicle level
of shared CCAVs up to mobility level, and they are used to enrich all field experiment
results of the SHOW pilots. In addition, a relation of tools to application areas and to
SHOW pilots is presented. Furthermore, multiple simulation scenarios are introduced,
which define the used tools to evaluate the scenario, their expected results as well as
the addressed KPIs from A9.4. After a short presentation of the SHOW sites that are
investigated in simulation in this WP, the simulation plans of all participating partners
are presented and linked to at least one of the pilot sites. Additionally, data inputs that
are required from the SHOW sites are stated.

D10.1: Simulation scenarios and tools                                                    3
Document Control Sheet
 Start date of project:                 01 January 2020

 Duration:                              48 months

 SHOW Del. ID & Title:                  Deliverable 10.1: Simulation scenarios and
                                        tools

 Dissemination level:                   PU
                                        A10.1: Simulation framework for extension of
 Relevant Activities:                   SHOW test sites – FZI
                                        A10.2: Vehicle and traffic simulations – VIF
                                        A10.3: Person, mobility, freight and
                                        environment related simulations – AIT
 Work package:                          WP10

 Lead authors:                          Lars Töttel (FZI)

 Other authors involved:                Joachim Hillebrand (VIF), Michael Hartmann
                                        (VIF), Christos Katrakazas (NTUA), Christian
                                        Rudloff (AIT), Yun-Pang Flötteröd (DLR)
 Internal Reviewers:                    As in Appendix 2 of D14.1.
 External Reviewers:                    As in Appendix 2 of D14.1.
 Actual submission date:                30/10/2020

 Status:                                FINAL

 File Name:                             SHOW_D10.1_Simulation_scenarios_and_too
                                        ls_SUBMITTED

D10.1: Simulation scenarios and tools                                                  4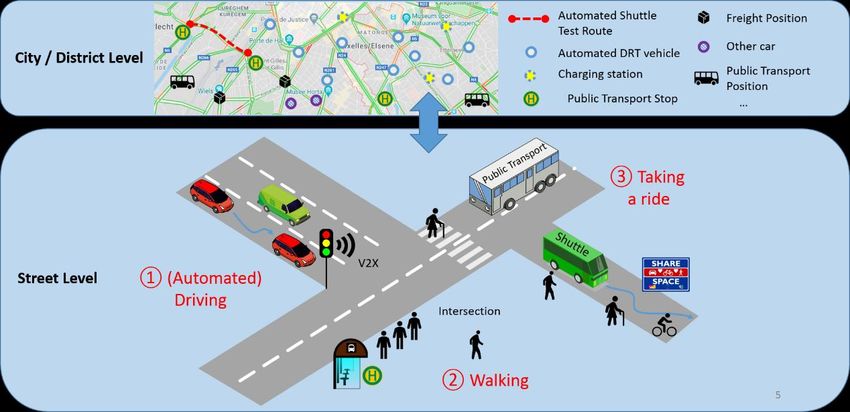
Document Revision History
 Version    Date              Reason                            Editor
 0.1     01/07/2020 Structure of the document;       Lars Töttel (FZI)
                    request for feedback
 0.2     25/09/2020 Inserted content from all        Lars Töttel (FZI)
                    partners                         Joachim Hillebrand (VIF)
                                                     Christian Rudloff (AIT)
                                                     Christos Katrakazas
                                                     (NTUA)
 1.0         05/10/2020 Version sent for internal    Lars Töttel (FZI)
                        peer review.
 2.0         21/10/2020 Peer reviewed version sent    Lars Töttel (FZI)
                        for submission.               Joachim Hillebrand (VIF)
                                                      Michael Hartmann (VIF)
                                                      Christos Katrakazas
                                                      (NTUA)
 2.1         23/10/2020 Change of demo site           Lars Töttel (FZI)
                        Mannheim to Braunschweig Yun-Pang-Flötteröd (DLR)
 2.2         27/10/2020 Removal of description of     Lars Töttel (FZI)
                        Vienna pilot site; references
                        to D10.2 regarding updated
                        information
 2.3         29/10/2020 Update section 5.4 due as     Lars Töttel (FZI)
                        it was highly related to the  Christian Rudloff (AIT)
                        Vienna pilot site

D10.1: Simulation scenarios and tools                                            5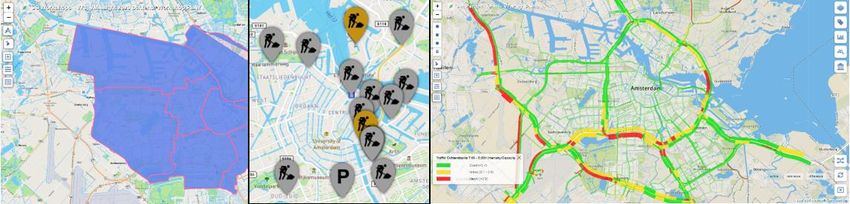
Table of Contents
Executive Summary .................................................................................................. 3
Table of Contents ...................................................................................................... 6
List of Tables ............................................................................................................. 9
List of Figures.......................................................................................................... 10
Abbreviation List...................................................................................................... 11
1     Introduction ...................................................................................................... 13
    1.1      Purpose of the document .......................................................................... 13
    1.2      Intended Audience .................................................................................... 13
    1.3      Interrelations ............................................................................................. 13
2     Identification of Simulation Tools ...................................................................... 14
    2.1      Simulation Environments........................................................................... 15
      2.1.1         Gazebo .............................................................................................. 15
      2.1.2         CARLA ............................................................................................... 15
      2.1.3         FOERST Driving Simulator ................................................................ 16
      2.1.4         Automated Vehicle Scenario Simulator (AVSS) ................................. 16
      2.1.5         MATSim ............................................................................................. 17
      2.1.6         SIMULATE ......................................................................................... 17
      2.1.7         Urban Strategy ................................................................................... 18
      2.1.8         LGSVL Simulator | An Autonomous Vehicle Simulator ....................... 18
      2.1.9         VISUM/VISSIM .................................................................................. 19
    2.2      Frameworks .............................................................................................. 19
      2.2.1         Robot Operating System (ROS) ......................................................... 19
    2.3      Models ...................................................................................................... 20
      2.3.1         Simulation of Urban MObility (SUMO) ................................................ 20
      2.3.2         Menge ................................................................................................ 20
      2.3.3         AIMSUN ............................................................................................. 20
      2.3.4         UrMoAc .............................................................................................. 21
      2.3.5         CarMaker ........................................................................................... 21
      2.3.6         Matlab/Simulink .................................................................................. 21
      2.3.7         New Mobility Modeller (NMM) ............................................................ 22
      2.3.8         VIBE .................................................................................................. 22

D10.1: Simulation scenarios and tools                                                                                       6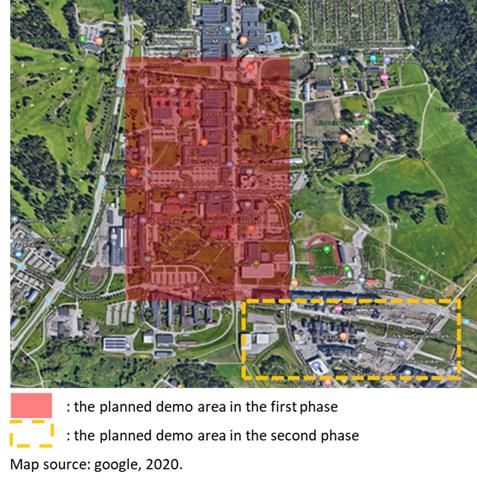
2.4     Summary .................................................................................................. 22
3     Simulation Scenarios........................................................................................ 24
    3.1     Overview of Simulation Focuses ............................................................... 24
    3.2     Scenario 1: Simulation of Automated Shuttles on Fixed Route .................. 24
      3.2.1       Scenario Description .......................................................................... 24
      3.2.2       Used Tools ......................................................................................... 25
      3.2.3       Expected Results ............................................................................... 25
    3.3     Scenario 2: Simulation of Demand Responsive Transport (DRT) .............. 25
      3.3.1       Scenario Description .......................................................................... 25
      3.3.2       Used Tools ......................................................................................... 26
      3.3.3       Expected Results ............................................................................... 26
    3.4     Scenario 3: Simulation of Public Transport Stops ...................................... 27
      3.4.1       Scenario Description .......................................................................... 27
      3.4.2       Used Tools ......................................................................................... 28
      3.4.3       Expected Results ............................................................................... 28
4     Link to SHOW Sites and Data Requirements ................................................... 29
    4.1     The German twin Mega Pilot ..................................................................... 31
      4.1.1       Aachen............................................................................................... 31
      4.1.2       Karlsruhe ........................................................................................... 31
      4.1.3       Braunschweig .................................................................................... 32
    4.2     The Austrian triplet Mega Pilot .................................................................. 33
      4.2.1       Vienna................................................................................................ 33
      4.2.2       Graz ................................................................................................... 33
    4.3     The Swedish twin Mega Pilot - Linköping .................................................. 34
    4.4     Spanish mega site..................................................................................... 35
    4.5     French mega site ...................................................................................... 35
    4.6     Brainport satellite site ................................................................................ 35
    4.7     Tampere satellite site ................................................................................ 36
    4.8     Trikala satellite site.................................................................................... 36
5     Partner Simulation Plans .................................................................................. 39
    5.1     e.GO MOOVE ........................................................................................... 39
    5.2     FZI ............................................................................................................ 39
    5.3     DLR........................................................................................................... 40

D10.1: Simulation scenarios and tools                                                                                        7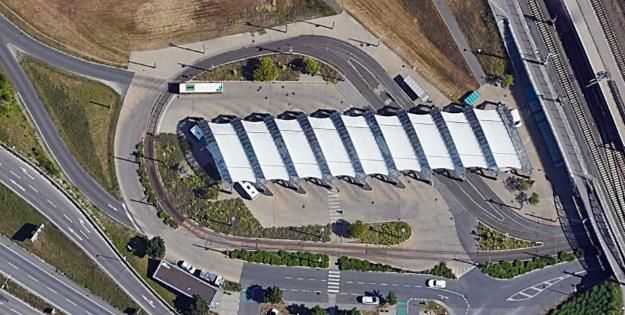
5.4      AIT ............................................................................................................ 40
    5.5      VIF ............................................................................................................ 41
    5.6      DLR & VTI ................................................................................................. 43
    5.7      TNO .......................................................................................................... 43
    5.8      VTT ........................................................................................................... 44
    5.9      CERTH/HIT ............................................................................................... 45
    5.10     NTUA ........................................................................................................ 46
6     Conclusions ..................................................................................................... 47
References.............................................................................................................. 48
Appendix I List of KPIs from A9.4 ............................................................................ 49

D10.1: Simulation scenarios and tools                                                                                         8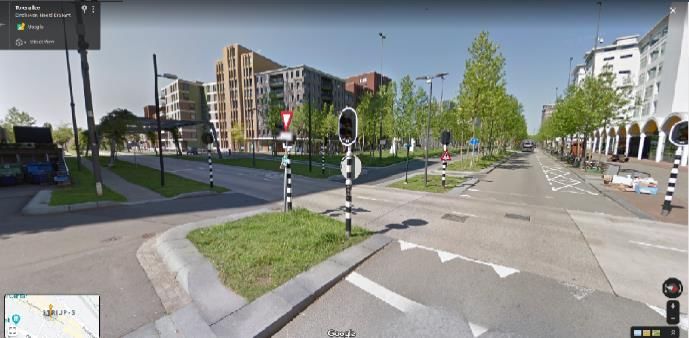
List of Tables
Table 1: Summary of Simulation Tools. ................................................................... 23
Table 2: Relation of partner to SHOW sites. ............................................................ 30

D10.1: Simulation scenarios and tools                                                                     9
List of Figures
Figure 1: Overview of Simulation Tools as used by Partners. .................................. 14
Figure 2: Overview of Simulation Focuses within WP10. ......................................... 24
Figure 3 Public Transport Stop in Graz, Austria....................................................... 27
Figure 4 SHOW demonstration sites. ...................................................................... 29
Figure 5 Test Site Aachen Campus Melaten Nord with symbolic Use Case
Identification (Source: Google Maps) ...................................................................... 31
Figure 6 Overview of the demo site in Braunschweig, Germany (Map source: Google
Maps, 2020). ........................................................................................................... 33
Figure 7 Planned route at the Graz site. .................................................................. 34
Figure 8 Overview of the demonstration areas at the demo site in Linköping (Source:
Google Maps).......................................................................................................... 35
Figure 9 Overview of the Brainport area near Eindhoven and the dedicated bus lanes
(Source: Google Maps). .......................................................................................... 36
Figure 10 Overview of the automated shuttle fixed route at Trikala site (Source: Google
Maps). ..................................................................................................................... 38
Figure 11 Embedding of simulation into Graz test site ............................................. 42
Figure 12 Overview of the Urban Strategy interface ................................................ 44

D10.1: Simulation scenarios and tools                                                                                      10
Abbreviation List
 Abbreviation                 Definition

 AD                           Automated Driving

 AV                           Autonomous Vehicle

 DCP                          Distributed Co-Simulation Protocol

 DRAC                         Deceleration Rate to avoid a Crash

 DRT                          Demand Responsive Transport

 HAD                          Highly Automated Driving

 KPI                          Key Performance Indicator

 MaaS                         Mobility as a Service

 ODD                          Operational Design Domain

 OBU                          Onboard Unit

 OSS                          Open Source Software

 PET                          Post Encroachment Time

 PT                           Public Transport

 RSU                          Roadside Unit

 ROS                          Robot Operating System

 SUMO                         Simulation of Urban MObility

 TraCI                        Traffic Control Interface (for SUMO)

 TTC                          Time to Collision

 VRU                          Vulnerable Road User

 V2I                          Vehicle to Infrastructure

 V2V                          Vehicle to Vehicle

D10.1: Simulation scenarios and tools                                11
Abbreviation                 Definition

 V2X                          Vehicle to Everything

 WP                           Work Package

D10.1: Simulation scenarios and tools                 12
1 Introduction
1.1 Purpose of the document
The purpose of the simulation scenarios and tools is to identify simulation tools
supporting and enriching field experiments results of the real-world SHOW pilots. In
addition, this document provides a description of the simulation scenarios that are
investigated and relates them to the addressed KPIs from Activity A9.4. Furthermore,
the simulation plans of all partners participating in WP10 are described and related to
the SHOW sites.

1.2 Intended Audience
On the one hand, this document serves as a manual for the partners involved in WP10
by providing information on relevant simulation tools and scenarios and showing
connections to the real-world pilots, especially the required inputs. On the other hand,
it serves as an informative document describing the simulation approaches within
SHOW for external stakeholders, and they will be able to understand how these
simulations are integrated into the SHOW sites.

1.3 Interrelations
This document was developed in WP10: Operations simulation models platform and
tools, which started in M1 with Activity A10.1: Simulation framework for extension of
SHOW test sites. All other activities within WP10 are also closely related to the
simulation scenarios and tools as they contribute to the simulation tools being used
and the scenarios being evaluated.
As a starting point, the defined KPIs and the impact assessment framework from A9.4
is used as a starting point for the simulations. Therefore, the simulation scenarios are
defined considering the impact areas that will be assessed as part of WP13.
Finally, this document identifies the contribution of the Pilot sites regarding the
necessary inputs to the simulation partners.

D10.1: Simulation scenarios and tools                                                13
2 Identification of Simulation Tools
Due to the high number of participating partners in Work Package 10, the focus of
simulation might vary strongly amongst the partners. As a result, numerous simulation
tools are used within SHOW. This chapter aims at identifying these tools which are
used by the participating partners of WP10 for all aspects of simulation purposes.
All of these tools are presented with a short description and the area of application
within SHOW. Figure 1 provides an overview of all simulation tools, linked to the
partners that use them within the WP.

Figure 1: Overview of Simulation Tools as used by Partners.

Moreover, the tools are grouped into three categories: simulation environment,
framework and model. Here, simulation environments are simulators which supply an
extensive virtual world composed of 3D actor models such as vehicles or pedestrians,
streets, buildings and more. In addition, the simulation environments support sensors
such as cameras for perceiving the state of this virtual environment, including positions
of actors, their speed and acceleration. Frameworks are software libraries and provide
drivers, hardware abstraction or inter-process communication. In contrast to simulation
environments, models focus on one aspect for simulation, e.g. there are models for
the simulation of one special sensor or models for pedestrian crowd simulation.
In the following, all simulation tools provided in Figure 1 are listed in detail with a
description, type, area of application, sharing (i.e. whether tool is only used internally
or publicly available), usage license, implementation, website and reference.

D10.1: Simulation scenarios and tools                                                  14
2.1 Simulation Environments
2.1.1 Gazebo
  Field Name                                        Field Content
 Description         Gazebo offers the ability to accurately and efficiently simulate populations
                     of robots in complex indoor and outdoor environments. At your fingertips
                     is a robust physics engine, high-quality graphics, and convenient
                     programmatic and graphical interfaces. Best of all, Gazebo is free with a
                     vibrant community.
 Type                Simulation Environment
 Area of             Vehicle Dynamics, Environment
 Application
 Sharing             External (Open Source)
 License             Apache License 2.0
 Implementation      C++
 Website             http://gazebosim.org/
 Reference           -

2.1.2 CARLA
  Field Name                                        Field Content
 Description         CARLA has been developed from the ground up to support development,
                     training, and validation of autonomous driving systems. In addition to
                     open-source code and protocols, CARLA provides open digital assets
                     (urban layouts, buildings, vehicles) that were created for this purpose and
                     can be used freely. The simulation platform supports flexible specification
                     of sensor suites, environmental conditions, full control of all static and
                     dynamic actors, maps generation and much more.
 Type                Simulation Environment
 Area of             Vehicle Dynamics, Environment
 Application
 Sharing             External (Open Source)
 License             MIT License
 Implementation      C++, Python
 Website             http://carla.org/
 Reference           [1]

D10.1: Simulation scenarios and tools                                                           15
2.1.3 FOERST Driving Simulator
Field Name Field Content
Description The driving simulator consists of 3 LCD wide screens 40’’ (full HD:
1920x1080pixels), driving position and support motion base. The
dimensions at a full development is 230x180cm., while the base width is
78cm and the total field of view is 170 degrees. It features adjustable
driver seat, steering wheel 27cm diameter, pedals (throttle, brake, clutch),
dashboard (tachograph, tachometer) and two external and one central
mirror that appear on the side and on the main screen, and display in real
time objects and events that are happening behind the 'vehicle'. The
controls available to the driver are: 5 gears plus reverse gear, flash,
wipers, lights, horn, brake and starter. The virtual - animated road
environment is generated by computer programming tool and displays the
road environment. Users can drive along the road under realistic
conditions. It is highlighted that driving conditions in the simulator cannot
be absolutely identical to those perceived by the driver in real driving, but
the change of the driver behaviour does not necessarily affect the relative
influence of various parameters.
Type Simulation Environment
Area of Environment, Unexpected events
Application
Sharing Internal
License -
Implementation -
Website https://www.fahrsimulatoren.eu/de/
Reference -
2.1.4 Automated Vehicle Scenario Simulator (AVSS)
Field Name Field Content
Description The Automated Vehicle Scenario Simulator (AVSS) is VTT’s in-house
software that is used for analysing and developing AV logic for different
traffic scenarios. It can simulate the decisions and movement of several
automated passenger cars and buses at a time, including pre-
programmed movement of other road users such as other cars,
roadworks, traffic lights, pedestrians etc. The simulation uses real AV
algorithms – although, there are several optional algorithms. It can be
used to study safety-critical scenarios and related logic and safety
margins.
Type Simulation Environment
Area of Vehicle Dynamics, Environment
Application
Sharing Internal
License -
Implementation Java
Website -
Reference -
D10.1: Simulation scenarios and tools 162.1.5 MATSim
Field Name Field Content
Description MATSim provides a framework to implement large-scale agent-based
transport simulations. The framework consists of several modules which
can be combined or used stand-alone. Modules can be replaced by
custom implementations to test single aspects of your own work.
Currently, MATSim offers a framework for demand-modelling, agent-
based mobility-simulation (traffic flow simulation), re-planning, a controller
to iteratively run simulations as well as methods to analyse the output
generated by the modules.
Type Simulation Environment
Area of Agent Based Transport Simulation
Application
Sharing External (Open Source)
License GPL v3.0
Implementation Java
Website https://www.matsim.org/
Reference [2]
2.1.6 SIMULATE
Field Name Field Content
Description SIMULATE is AIT's in-house software that is built on a scalable and flexible
system architecture to develop and apply pedestrian simulation
models from the microscopic to the macroscopic level. SIMULATE
includes a range of pedestrian models (e.g. Social Force approaches,
Cellular Automaton, Optimal Reciprocal Collision Avoidance model,
Optimal Steps Model, Queuing Model, Graph-based Model) as well as
models for movement behaviour of bikes and cars particularly used in
shared spaces analysis. SIMULATE provides APIs to different
programming languages and simulation frameworks (e.g. ROS).
Type Simulation Environment
Area of Agent Based Simulation; Pedestrian Models; Shared Space (Pedestrian,
Application Bike, Cars)
Sharing Internal
License -
Implementation Java, C++, Matlab
Website https://www.ait.ac.at/SIMULATE
Reference [3]
D10.1: Simulation scenarios and tools 172.1.7 Urban Strategy
Field Name Field Content
Description Urban Strategy is an interactive tool for spatial planning, providing
detailed insight into the effects of modifications to the surroundings. It
assigns traffic to the network (for example the activity schedules resulting
from the New Mobility Modeller) and immediately computes resulting
delays, mileage as well as the environmental impact. Besides that,
modifications such as road closures, parking place availability and
changes in speed limits can be applied and within a few minutes the
impact can be visualized.
Type Framework + Simulation environment
Area of Traffic assignment; Environmental impact (air, noise, etc.)
Application
Sharing Internal
License -
Implementation C++, CUDA
Website https://www.tno.nl/en/focus-areas/traffic-transport/roadmaps/smart-and-
safe-traffic-and-transport/societal-impact-for-accessibility-and-
liveability/big-data-ecosystems-collaborating-on-data-controlled-
cities/urban-strategy-brings-planning-effects-into-clear-focus/
Reference -
2.1.8 LGSVL Simulator | An Autonomous Vehicle Simulator
Field Name Field Content
Description The LGSVL Simulator is a simulator that facilitates testing and
development of autonomous driving software systems and is under active
development on Github. The simulator is fully integrated with the popular
open source platforms Apollo and Autoware and has a ROS/ROS2 and
Python interface. It provides real-time outputs from sensors including
camera, LiDAR, RADAR, GPS, and IMU. Environmental parameters can
also be changed, including map, weather, traffic, and pedestrian. The
simulation platform supports flexible specification of sensor suites,
environmental conditions, full control of all static and dynamic actors and
maps generation (road editor or point cloud importation).
Type Simulation Environment
Area of Vehicle Dynamics, Environment
Application
Sharing Internal
License Apache License 2.0
Implementation C++, Python, Unity
Website https://www.lgsvlsimulator.com/
Reference [4]
D10.1: Simulation scenarios and tools 182.1.9 VISUM/VISSIM
Field Name Field Content
Description PTV Vissim is the world’s most advanced and flexible traffic simulation
software
Simulate complex vehicle interactions realistically on a microscopic level
Model demand, supply, and behaviour in detail
Simulate new forms of mobility such as CAV and MaaS
Seamless integration with PTV Visum, the world's leading traffic planning
tool VISUM:
PTV Visum is the world’s leading traffic planning software designed for
transport planners to empower cities
Conduct traffic analyses, forecasts and GIS-based data management
Model all road users and their interactions
Plan public transport services
Develop advanced and future-proofed transport strategies and solutions.
Type Simulation Environment
Area of Macroscopic and Microscopic Traffic Simulation
Application
Sharing External
License commercial
Implementation Proprietary
Website https://www.ptvgroup.com/de/loesungenprodukte/ptv-visum/;
https://www.ptvgroup.com/en/solutions/products/ptv-vissim/
Reference -
2.2 Frameworks
2.2.1 Robot Operating System (ROS)
Field Name Field Content
Description The Robot Operating System (ROS) is a set of software libraries and tools
that help you build robot applications. From drivers to state-of-the-art
algorithms, and with powerful developer tools, ROS has what you need
for your next robotics project. And it's all open source.
Type Framework
Area of Intercommunication, HW abstraction
Application
Sharing External (Open Source)
License BSD-3-Clause
Implementation Python, C++, Lisp
Website https://www.ros.org/
Reference [5]
D10.1: Simulation scenarios and tools 192.3 Models
2.3.1 Simulation of Urban MObility (SUMO)
Field Name Field Content
Description "Simulation of Urban MObility" (Eclipse SUMO) is an open source, highly
portable, microscopic and continuous road traffic simulation package
designed to handle large road networks. It allows for intermodal
simulation including pedestrians and comes with a large set of tools for
scenario creation.
Type Model
Area of Traffic Simulation + simulation environment
Application
Sharing External (Open Source)
License EPLv2
Implementation C++, additional tools in Python
Website https://sumo.dlr.de/docs/index.html
Reference [6]
2.3.2 Menge
Field Name Field Content
Description Menge is a powerful, cross-platform, modular framework for crowd
simulation developed at the University of North Carolina - Chapel Hill.
Crowd simulation is a large, complex domain. Developing an effective
simulator requires developing many interlocking components. Menge
provides basic implementations of many of these components. As such,
Menge provides an extensible common platform to facilitate crowd
simulation research and development. It provides a basis for performing
independent research in motion planning, collision-avoidance, spatial
acceleration, behavioural modelling, and more. Its plug-in architecture
allows researchers to focus on individual aspects of crowd simulation,
relying on built-in functionality for the other components.
Type Model
Area of Pedestrian Crowd Simulation
Application
Sharing External (Open Source)
License Apache License 2.0
Implementation C++
Website http://gamma.cs.unc.edu/Menge/
Reference [7]
2.3.3 AIMSUN
Field Name Field Content
Description Aimsun Next software allows you to model transportation networks small
and large: from a single intersection to an entire region. Static and
dynamic (equilibrium) traffic assignment, mesoscopic, microscopic and
hybrid mesoscopic-microscopic simulation along with OD matrix
manipulation tools
Type Model
Area of Traffic Simulation
Application
Sharing Internal
License AIMSUN Next Advanced Edition
Implementation Python
Website https://www.aimsun.com/aimsun-next/
Reference -
D10.1: Simulation scenarios and tools 202.3.4 UrMoAc
Field Name Field Content
Description UrMoAC is a tool for computing accessibility measures. The tool works
on the fine-grained level of single buildings and computes the fastest
routes between a set of origins and a set of destinations. UrMoAC
supports different limits for computing the accessibility measures as well
as the possibility to load aggregation areas both for sources and for
destinations. Different output options are available. The tool supports the
modes walking, bicycling, motorised individual transport and public
transport.
Type Model
Area of Accessibility Measures
Application
Sharing External (Open Source)
License GPL v3.0
Implementation Java, additional tools in Python
Website https://github.com/DLR-VF/UrMoAC
Reference [8]
2.3.5 CarMaker
Field Name Field Content
Description Complete solution for virtual test driving. Comes with interfaces to
Matlab/Simulink and C, among others.
Type Model
Area of Vehicle dynamics
Application
Sharing External
License Proprietary
Implementation Matlab, C
Website https://ipg-automotive.com/products-services/simulation-
software/carmaker/
Reference -
2.3.6 Matlab/Simulink
Field Name Field Content
Description Model-based designer.
Type Model
Area of Pre- and Postprocessing
Application
Sharing External
License Proprietary
Implementation Matlab, C
Website https://de.mathworks.com/products/simulink.html
Reference [9]
D10.1: Simulation scenarios and tools 212.3.7 New Mobility Modeller (NMM)
Field Name Field Content
Description New Mobility Modeller is an explorative model for destination choice and
mode choice developed for joint impacts of emerging and traditional
mobility concepts. Combing the choice model with a network fundamental
diagram, NMM can be used to assess impacts on mileage, delays and
vehicle number in a city or region, with a large number of traffic conditions.
Type Model
Area of Activity Based Simulation
Application
Sharing Internal
License -
Implementation C++
Website -
Reference [10]
2.3.8 VIBE
Field Name Field Content
Description VIBE: Video Inference for Human Body Pose and Shape Estimation
[CVPR-2020]
Type Model
Area of Pedestrian Detection
Application
Sharing External (Open Source)
License non-commercial scientific research purposes
Implementation Python
Website https://github.com/mkocabas/VIBE
Reference -
2.4 Summary
In summary, Table 1 lists all of the tools mentioned above and summarizes the usage
conditions, the area of application within SHOW as well as the partners using it.
D10.1: Simulation scenarios and tools 22Table 1: Summary of Simulation Tools.
Tool Area of Application
Simulation Environments
Gazebo Vehicle Dynamics, Environment
Carla Vehicle Dynamics, Environment
FOERST Environment, Unexpected Events
AVSS Vehicle Dynamics, Environment
MATSim Agent Based Transport Simulation
SIMULATE Agent Based Simulation, Shared Space
Urban Strategy Traffic Assignment, Environment Impact
LGSVL Simulator Vehicle Dynamics, Environment
VISUM/VISSIM Traffic Simulation
Frameworks
ROS Intercommunication, HW abstraction
Models
SUMO Traffic Simulation, Simulation Environment
Menge Pedestrian Crowd Simulation
AIMSUN Traffic Simulation
UrMoAc Accessibility Measures
CarMaker Vehicle Dynamics
Matlab/Simulink Pre- and Postprocessing
NMM Activity Based Simulation
VIBE Pedestrian Detection
D10.1: Simulation scenarios and tools 233 Simulation Scenarios
This chapter aims at describing the generalized scenarios which are investigated by
the participating partners of WP10 for their simulations. As the focus between the
partners might vary, multiple scenarios are defined. All of the identified simulation
scenarios are presented with a description and furthermore, they are linked to relevant
simulation tools from chapter 2. In addition, expected results from the scenarios are
identified and their addressed KPIs are listed.
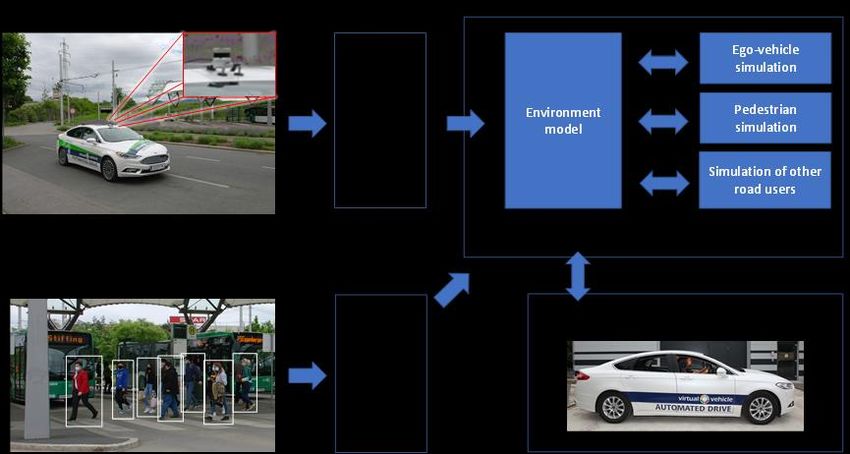
3.1 Overview of Simulation Focuses
As mentioned above, the focus of the simulations conducted in WP10 of the project
varies between the partners. On the one hand, some partners focus on the simulation
of vehicles and/or pedestrians at street level. On the other hand, some others focus
on simulation at city or district level. Figure 2 provides an overview these simulation
focuses by mentioning all relevant aspects.
Figure 2: Overview of Simulation Focuses within WP10.
Starting from the simulation focuses, multiple generic simulation scenarios are
introduced in the following. These scenarios are meant to cover all simulations which
are done by the partners involved in WP10. In addition, the scenarios are linked to the
simulation tools described in chapter 2, as well as the addressed KPIs from Activity
A9.4.
3.2 Scenario 1: Simulation of Automated Shuttles on Fixed
Route
3.2.1 Scenario Description
In this scenario, automated shuttles driving on a fixed route, mostly in an urban
development area, are simulated. Thereby, the aim is to set up or continue the
simulation of a virtual twin of the shuttle route of a real-world pilot within SHOW. One
Example is the fixed shuttle route in Trikala, Greece as part of the Trikala satellite site,
which is described in section 4.8.
In the fixed route scenarios, the automated shuttles follow a given route and stop at
predefined stops in order to allow passengers to get in or out. In simulation, the
D10.1: Simulation scenarios and tools 24geometric environment, for example the road network, is modelled and/or validated.
Consequently, errors in the geometric representation of the route can be detected and
the required adjustments can be communicated to the corresponding real-world pilot
site. Moreover, the shuttles are tested on existing lanes and also in mixed traffic, so
that possible bottlenecks and critical areas can be identified before starting service in
real-world. In particular, mixed traffic includes vulnerable road users (VRUs) such as
pedestrians, so that the vehicle behaviour can be tested in relation to them.
More extended simulations of the fixed route scenario might include the simulation of
intelligent simulation and the interaction of its interaction with automated vehicles.
Furthermore, the simulation scenario can be used to test one or multiple C-ITS Use
Cases (5G) in a defined part of the simulated pilot area.
3.2.2 Used Tools
In the fixed route scenario, the used simulation tools from chapter 2 are the simulation
environments, as they are used to model the geometric representation of the route,
ROS for the simulation of the automated driving stack of the shuttles as well as SUMO
and Menge in order to model additional traffic participants.
3.2.3 Expected Results
As already mentioned above, expected results from the scenario are:
• The identification of errors in the high definition map that is used by the
automated driving stack.
• The identification of bottlenecks and critical areas on the route.
The validation of the automated driving stack in mixed traffic, especially regarding
VRUs, before testing in real-world.
The addressed KPIs of the fixed route simulation scenario are:
• conflicts (time to collision (TTC),
• deceleration rate to avoid a crash (DRAC),
• post encroachment time (PET), optional usage of SSAM-tool for visualization),
• conflicts with VRUs (usage of SSAM-tool1),
• comfort,
• occupancy,
• travel time for pedestrians and vehicles,
• average speed of pedestrians and vehicles,
• waiting times for passengers,
• emissions (CO2, NOx, PMx, noise).
3.3 Scenario 2: Simulation of Demand Responsive Transport
(DRT)
3.3.1 Scenario Description
This scenario deals with the simulation of Demand Responsive Transport (DRT). Its
concept is to allow a fleet of vehicles to serve customer requests based on a central
1 https://highways.dot.gov/research/safety/ssam/surrogate-safety-assessment-model-
overview
D10.1: Simulation scenarios and tools 25dispatcher. Sub-scenarios can include different numbers of vehicles, different zones
of operation or different cost structures. Related issues are, for example, customers
with special needs such as extra capacity for rides, variable boarding duration for each
person and routing efficiency.
The dispatcher communicates with all equipped vehicles of the fleet and its actions
comprise the drop-off and pick-up of passengers as well as the intermodal routing
support for person-trips. In particular, the routing has to start and end within a
pedestrian network, whereby pick-up and drop-off locations might be restricted.
The dispatch algorithms have to cope with multiple inputs: first, the assignment order
has to be specified, for example first come, first served with the consideration of the
reservation date. Second, a single reservation can include either one person or
multiple people. Third, the dispatcher has to be able to pick up additional passengers
while delivering the customers which already got on.
3.3.2 Used Tools
In the DRT scenario, the used simulation tools from chapter 2 are mainly four tools:
SUMO, MATSim, New Mobility Modeller and Urban Strategy. SUMO is utilized for the
actual simulation of DRT, whereas MATSim is used for impact assessment of
automated vehicles in mobility systems using the MATSim DRT-module. Additionally,
the New Mobility Modeller and Urban Strategy will be used for an impact assessment
of the introduction of DRTs on a city or district level. This will specifically focus on
changes in mode choice and the impact on the whole mobility system including traffic
efficiency, energy usage, air quality and noise.
3.3.3 Expected Results
Expected results from the DRT simulation scenario are:
• The development/extension of SUMO’s DRT algorithm. This includes, amongst
others, the extension of the dispatch algorithms, the integrating of a flexible
pick-up and drop-off as well as the extension of the route planning algorithm.
• The examination of the AV-functions according to the shuttles‘ characteristics
and the use of those functions in macrosimulation tools.
• The examination/extension of the features and functions related to public
transit, e.g. busses or trams.
• The development/extension of TraCI functions, for example regarding tele-
operations.
• Deduction of mode choice decisions and modal split under different scenarios
including both soft measures, e.g. congestion charges or changes in ticket
prices for public transport as well as hard measures, e.g. new automated public
transport lines, urban development projects and implementation of new
transport services such as autonomous vehicles.
• Impact assessment and impact forecasting of transport measures and their
impact on traffic conditions, emissions and noise.
• An interactive platform to be used by infrastructure managers or governmental
organizations where one can adjust and add the availability of DRTs such that
the impacts on traffic conditions, emissions and noise will automatically be
computed and visualized.
The addressed KPIs of the DRT simulation scenario are:
• Travel time,
D10.1: Simulation scenarios and tools 26• Distance,
• Average Speed,
• Occupancy rate,
• Amount of travel,
• Shared mobility rate,
• Vehicle utilisation rate,
• Inequality in transport,
• Willingness to pay,
• Willingness to share a ride,
• Reduction in CO2 and noise levels,
• Reduction in energy consumption and
• Empty vehicle kms.
3.4 Scenario 3: Simulation of Public Transport Stops
3.4.1 Scenario Description
In this scenario, the complex environment at public transport stops consisting of both
bus and railway stations is simulated. This includes the simulation of already existing
real-world public transport stops and the integration of AV operation into the simulation.
Hereby, especially very busy stations are handled. An example is given in Figure 3,
showing a public transport stop in Graz, Austria as part of the Austrian Mega Site.
Figure 3 Public Transport Stop in Graz, Austria
Furthermore, boarding and alighting behaviour at stops of the autonomous bus and
the interaction of AVs and other road users, in particular VRUs, are simulated. This is
done by means of connecting different simulation tools (e.g. SIMULATE and SUMO)
in order to integrate road user behaviour in a more realistic fashion.
Another interest is the prediction and simulation of pedestrian movement at the
transport stop, also considering pedestrian activity recognition such as walking or
waiting. This prediction will then be used for the navigation and motion planning of the
autonomous vehicle.
Different sub-scenarios can be defined: first, the peak hour with a high number of
pedestrians and busses will be investigated. Second, extended intervals due to
problems on a bus line cause large groups of waiting passengers, partially blocking
the lane of the AV, are simulated. Third, by reducing the intervals of the bus and tram
lines, reduced waiting times are simulated. Here, the increased traffic of public
transport vehicles will eventually affect the AV operations. Furthermore, a failure of
railway operations will be simulated, resulting in large pedestrian flows from the railway
station to the bus and tram stops. The sub-scenarios are created by varying the origin-
destination relations, the share of public transport usage (bus lines, tram, train), the
number of passengers and the frequency of bus and tram services.
D10.1: Simulation scenarios and tools 27More extended simulations of the public transport stop scenario might include the
simulation of intelligent infrastructure and the integration of V2X communication.
Thereby, pedestrians can be detected offboard in order to support measurements of
the automated vehicle. In addition, creating a photorealistic simulation of the
environment will also be considered.
3.4.2 Used Tools
In the public transport stop scenario, the used simulation tools from chapter 2 are the
simulation environments such as LGSVL, Carla or Microsoft AirSim as they are used
to model the public transport stop. In addition, SIMULATE and Menge are used to
integrate VRUs such as pedestrians or bicycles. They are also used to simulate
boarding and alighting in connection with SUMO for the complete simulation of AVs.
Again, ROS/Autoware are used for the simulation of the automated driving stack.
Regarding measurements, several own programmed software is used.
3.4.3 Expected Results
Expected results from the scenario are:
• Interfaces between different simulation tools, for example between SIMULATE,
SUMO and ROS, will be developed in order to create a more realistic simulation
of the public transport stop.
• The simulated shuttle should not block bus operation at the bus stop by reacting
efficiently to arriving busses. Consequently, it should move away quickly and
stop at another place when a bus arrives.
• An adequate movement prediction of the VRUs and the busses.
• The derivation of interaction information between AVs and VRUs.
• The derivation of information on optimization of station/shuttle designs to
support smaller passenger exchange times.
The addressed KPIs of the public transport stop simulation scenario are:
• Collision avoidance,
• conflicts with VRUs,
• Time headway,
• Proportion of stopping,
• Manual take-over count,
• Hard breaking,
• Travel time,
• Distance,
• Average speed,
• Duration and length of trips,
• Low speed due to VRU,
• User quality perception,
• User trust,
• User safety perception,
• Perceived usefulness,
• Passenger exchange times and
• Average waiting times of the passengers at the station.
D10.1: Simulation scenarios and tools 284 Link to SHOW Sites and Data Requirements All simulations done within the WP are related to the SHOW sites, which are shown in Figure 4. Figure 4 SHOW demonstration sites. The partners involved in the WP are closely linked to specific SHOW sites. This results from the nature of the project. For that reason, not all SHOW sites, but only a subset of them are considered for the first iteration of site-specific simulations. The SHOW sites which have been chosen for the first simulation iteration are shown in Table 2. Other sites, such as the French mega site (see section 4.5), will be considered at a later stage. An update including descriptions of the missing sites will be given in D10.2. D10.1: Simulation scenarios and tools 29
Table 2: Relation of partner to SHOW sites.
Brainport
Aachen Karlsruhe Braunschweig Vienna* Graz Linköping Tampere Trikala Copenhagen*
Eindhoven
DLR x x
TNO C
VIF C
NTUA TBD
AIT C
FZI C
CERTH/HIT C
e.Go Moove x
VTI x
VTT x
Note: x within a cell states that the partner’s simulation is linked to the specific SHOW sites, whereas C states that the partner’s simulation is
essential for the development of the specific SHOW sites. Please also note that first Vienna is not a SHOW site anymore (see also section 4.2.1)
and second NTUA’s link to the Copenhagen site is still under consideration at the time of writing (see also section 5.10). Therefore, these initial
simulation plans will be updated in D10.2.
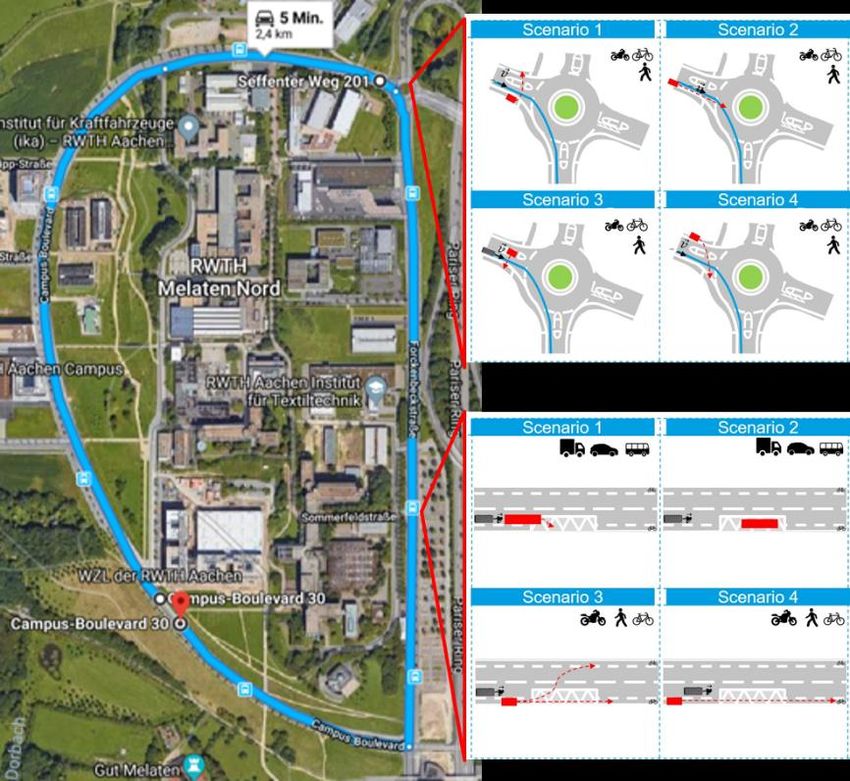
D10.1: Simulation scenarios and tools 30In the following, each SHOW site which is simulated in the first simulation iteration and which is linked to at least one of the scenarios defined in chapter 3 is presented shortly. 4.1 The German twin Mega Pilot 4.1.1 Aachen The test site Campus Melaten Nord in Aachen is shown in Figure 5. It is a peri-urban environment located close to the borders of both Netherlands and Belgium, easily accessible and fully connected to public transport. The Campus Melaten primarily hosts RWTH institutes. The road network consists of mixed lanes for both public transport (PT) and regular traffic. There are bicycle lanes on all roads separated from the road through lane markings as defined in the road traffic regulations. The traffic density is low to medium, consisting of PT, industrial and private vehicles, pedestrians and bicycles. Up to two automated e.GO People Mover will be operating in a ring feeder mode partially as on-demand service and partially to extent and complement the regular PT system within the test site area. The People Movers will be interfacing PT and interfacing to connected intelligent DRT and MaaS applications in Aachen established by the public transport service provider ASEAG. Figure 5 Test Site Aachen Campus Melaten Nord with symbolic Use Case Identification (Source: Google Maps) 4.1.2 Karlsruhe Karlsruhe is located in the south-west of Germany and has about 300,000 residents. At this point of time, the test site used within SHOW is not fully specified yet. A preliminary plan is to have a connection from the Technologiepark in the east of the city to Karlsruhe Institute of Technology (KIT) Campus South via its Campus East. The route contains sections with different speed limits, including 30 km/h, 50 km/h and 60 km/h. The road network consists of mixed lanes for both public transport and regular D10.1: Simulation scenarios and tools 31
traffic. Especially at KIT Campus South, the interaction rate with VRUs is very high. In
addition, the route includes several constrictions, where the automated shuttles will
have to cooperate with other traffic participants. Furthermore, the route contains
multiple intersections.
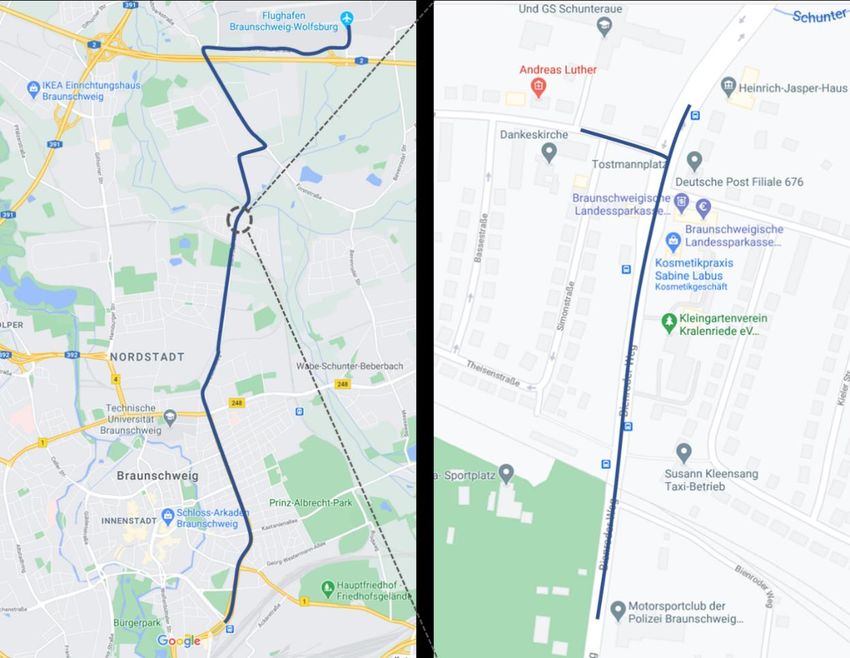
4.1.3 Braunschweig
Originally, it was planned to conduct demo activities at the demo site Mannheim,
Germany. Due to the insufficient number of demo vehicles and a partner leaving the
demo site, Mannheim will be cancelled. In order to ensure and strengthen the overall
performance of the German Mega Site, Braunschweig would be the new demo site,
which has been approved by the Consortium. This change is currently under the
project amendment process for approval.
The demo site Braunschweig locates in the northern part of Germany. The test area is
part of the Test Bed Lower Saxony for automated and connected mobility. 2-3 vehicles
with a maximum speed 50 km/h will be deployed and the demonstration focus is on
DRT service with autonomous vehicles and vehicle platooning in urban and suburban
areas. The addressed test cases include:
1) Automated vehicle with on-demand stops: DRT with fixed stops and including
the possibility of a few virtual stops on the route. This test case is related to
Use Cases 1.1 and 1.6.
2) Platooning in urban environment demo: Platooning showing logical coupling of
vehicles, to be conducted with 2-3 vehicles on parts of the route, focusing e.g.
on signalized intersections. This test case is related to Use Case 1.8.
The adopted route includes mainly urban areas and is connecting the main station in
the city centre to a suburban area (airport/ DLR) with a route length of 10 km. Most
segments of the route are equipped to accommodate autonomous vehicles. The
overview of the demo site and the road test tracks are illustrated in Figure 6 (a) and
(b).
Furthermore, the demonstration is planned to include 3 different weeks of operation
with passengers during the demo period. Commuters will be transported between
airport and DLR, most likely on workdays (Monday – Friday). The pre-demo operation
will be conducted through a nationally funded project in 2021.
D10.1: Simulation scenarios and tools 32(a) route for shuttle with on-demand stops (b) route for the platooning demo Figure 6 Overview of the demo site in Braunschweig, Germany (Map source: Google Maps, 2020). 4.2 The Austrian triplet Mega Pilot 4.2.1 Vienna Vienna is not a SHOW site anymore and will be replaced by another site in Austria. At the time of writing, the replacement still is a process under discussion and will be finalised soon. Updated information will be provided in Deliverable D10.2, which is due in M18 of the project. 4.2.2 Graz VIF develops an autonomous vehicle approaching urban environments in the Graz site. For development, they need several algorithms to build a safe and efficient driving function. For development and validation, a simulation platform (LGSVL Simulator, Carla, Microsoft AirSim) should help them build and test the driving function's functioning in a safe virtual environment before testing the software in a real urban environment with vulnerable road users. The test site has some challenging urban environments with bus stops and pedestrians, busses, and public traffic. A mall and several shops are in the surrounding of the test environment. Figure 7 illustrates one end stop of the planned route at the Graz site. The red line shows one possible route for the shuttle. There might be some difficulties with decision- D10.1: Simulation scenarios and tools 33
making for mission- and motion planning due to pedestrians’ strange behaviours and
bus operation.

Figure 7 Planned route at the Graz site.

4.3 The Swedish twin Mega Pilot - Linköping
There are university, 370 companies, schools, daycare centres and residential houses
at this demo site, shown in Figure 8. The main demo-site in Linköping is in the campus
area. The demonstration track covers normal roads and a shared space section, where
automated buses, pedestrians and bikes can share the space together. Currently, two
out of three shuttles are already running clockwise in the campus area and will be also
running in the residential area, indicated in the orange dash line area in Figure 8, later
on. Currently, there 8 bus stops and the planned service period is from 8 to 18 on
weekdays and from 10 to 17 on weekends.
The planned demonstration services are to improve user experience for all users and
to provide a robust first/last mile solution to public transportation.

D10.1: Simulation scenarios and tools                                                  34
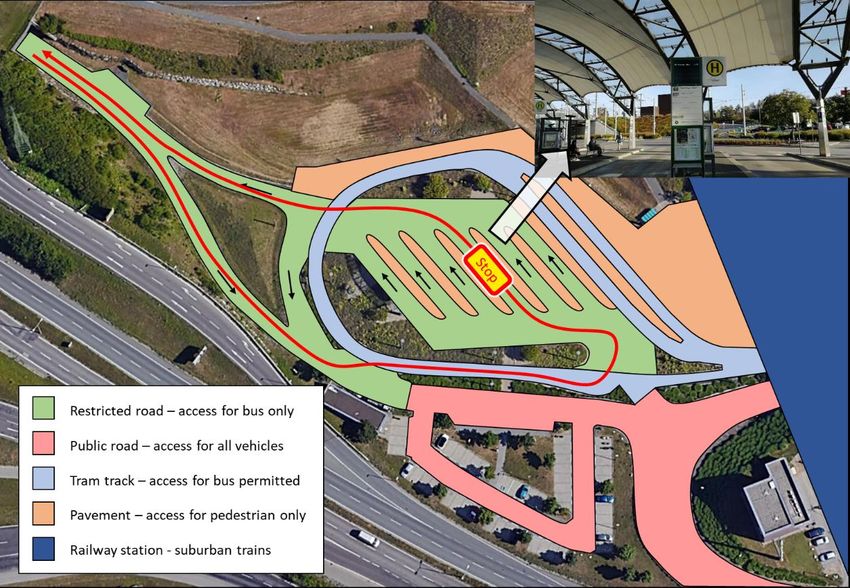
Figure 8 Overview of the demonstration areas at the demo site in Linköping (Source:
Google Maps).

4.4 Spanish mega site
Simulations for the Spanish mega site are not planned according to the DoA [11],
because Spanish partners have the focus on the pilot of the Madrid site and do not
have efforts planned in WP10. Since the demonstrators of the Madrid pilot site show
similarities to other performed simulations (e.g. self-learning DRT demo), a tracking of
activities in Madrid is very interesting for WP10 to update the simulation models.

4.5 French mega site
The French pilot sites in Rennes and Rouen will not be considered for simulation in
the first simulation iteration until M18 due to a re-focus of activities of partner
VEDECOM as reported in the first amendment of SHOW. Since the activities of the
French pilots include fixed-route shuttles and other simulations will be carried out for
this scenario (e.g. in Karlsruhe, Aachen or Graz), the project will not be negatively
impacted by not considering the French mega site for the first simulation iteration.

4.6 Brainport satellite site
The Brainport site (750,000 inhabitants) demonstration will take place in Eindhoven
city (230,000 inhabitants). Eindhoven is the 5th largest city in the Netherlands, with a

D10.1: Simulation scenarios and tools                                                 35
clear strategic interest in mobility innovations. Brainport site focus on operating
automated cars (and optional buses) in a dedicated lane with possible interaction with
traffic signal control and crossing vehicles, cyclists and pedestrians. The test will be
running on a fixed route in the urban/sub-urban area, where an exclusive bus lane is
available. The route will include several bus stops and signal-controlled intersections,
as shown in Figure 9. Tested vehicles will plan their trajectories to stop at the bus stops
to pick up and drop off passengers, and also stop at intersections for traffic signals or
red light violation of pedestrians and cyclists. Additionally, platoon operation of
automated passenger cars will be demonstrated in the test. Automated cars will be run
in a vehicle platoon, involving platoon manoeuvres such as joining, platooning and
exiting. Platoon operation allows a minimum cost for relocating automated vehicles as
a demand responsive transit.

Figure 9 Overview of the Brainport area near Eindhoven and the dedicated bus lanes
(Source: Google Maps).

4.7 Tampere satellite site
Tampere satellite site focuses on operating automated small buses on a fixed
suburban route. The buses are to support a newly built tram line by extending the
coverage of public transportation. The automated route involves interaction with the
tram, a couple of crowded intersections and normal bus stops, where also other buses
stop.

4.8 Trikala satellite site
Trikala is a medium-sized provincial city and the capital of the Trikala regional unit in
the middle of Greece. It hosts a population of about 81,000 inhabitants (130,000
including the suburbs and nearby villages). The municipality of Trikala was formed in
2011 on occasion of the local government reform, which merged 8 former
municipalities making them municipal units. The city hosts around 85,000 people
commuting per day. In total there are 26 municipal buses operating on different lines
across the city (15 bus lines operate in the city and its centre, while 11 bus lines
connect with the surrounding cities or villages). The city residents use mainly driving,
biking and walking for their commuting. Rural and peri-urban areas are underserved
by public transport. Congestion mainly prevails around the grand open market area
and the three bridges that cross the Litheos river, especially during rush hours.
Two demos have been planned for piloting in the municipality of Trikala. The first demo
is encompassing two automated shuttles that will be operating on a fixed route
(spanning 6.85 km long) connecting the city terminal with the intercity bus station
(Figure 10). The automated shuttles will be encountering three 4-way signalized
intersections, four T-intersections (to be converted to signalized), one roundabout and

D10.1: Simulation scenarios and tools                                                   36
You can also read