Literacy and Information - DISCUSSION PAPER SERIES - Institute of Labor Economics
←
→
Page content transcription
If your browser does not render page correctly, please read the page content below

DISCUSSION PAPER SERIES

IZA DP No. 14358

Literacy and Information

Achmad Tohari
Christopher Parsons
Anu Rammohan

MAY 2021
DISCUSSION PAPER SERIES

IZA DP No. 14358

Literacy and Information

Achmad Tohari
University of Western Australia
Christopher Parsons
University of Western Australia and IZA
Anu Rammohan
University of Western Australia

MAY 2021

Any opinions expressed in this paper are those of the author(s) and not those of IZA. Research published in this series may
include views on policy, but IZA takes no institutional policy positions. The IZA research network is committed to the IZA
Guiding Principles of Research Integrity.
The IZA Institute of Labor Economics is an independent economic research institute that conducts research in labor economics
and offers evidence-based policy advice on labor market issues. Supported by the Deutsche Post Foundation, IZA runs the
world’s largest network of economists, whose research aims to provide answers to the global labor market challenges of our
time. Our key objective is to build bridges between academic research, policymakers and society.
IZA Discussion Papers often represent preliminary work and are circulated to encourage discussion. Citation of such a paper
should account for its provisional character. A revised version may be available directly from the author.

                                                     ISSN: 2365-9793

                                           IZA – Institute of Labor Economics
Schaumburg-Lippe-Straße 5–9                      Phone: +49-228-3894-0
53113 Bonn, Germany                             Email: publications@iza.org                                    www.iza.org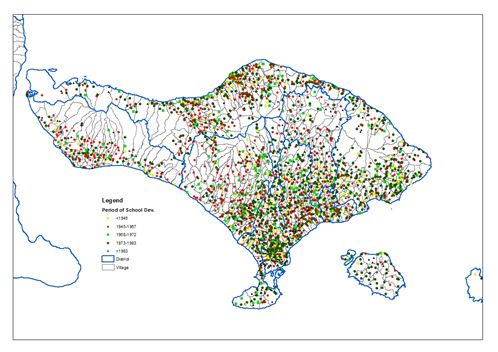
IZA DP No. 14358                                                                                                                      MAY 2021

            ABSTRACT
            Literacy and Information*
            Information campaigns aimed at empowering the poor often fall short of meeting their
            desired aims. We study literacy’s role in determining their efficacy. First, exploiting an
            RD design, we show that receipt of information increased household rice receipts by 30
            percentage points. Second, we show that approximately half of the effect is driven by
            household head literacy. Leveraging novel data on the locations and timings of school
            openings in the 1970s INPRES school building program, we document that household
            heads’ literacy gained during childhood was pivotal for their households subsequently
            receiving their full entitlement of rice during adulthood.

            JEL Classification:               D04, D73, I21, I28, I32, I38, J24, O12
            Keywords:                         poverty, targeting, information, literacy, dynamic
                                              complementarity

            Corresponding author:
            Christopher Parsons
            Economics (UWA Business School)
            University of Western Australia
            35 Stirling Highway
            Crawley WA 6009
            Australia
            E-mail: christopher.parsons@uwa.edu.au

            * We gratefully acknowledge generous funding from the Australian government through the Department of Foreign
            Affairs and Trade (DFAT) and data support from the TNP2K. We wish to extend our gratitude to attendees of the:
            Annual International Conference of the German Economic Association Research Group on Development Economics,
            Zurich, the 14th Australasian Development Economics Workshop and the 31st PhD Conference in Economics and
            Business, especially Victoria Baranov and Michael Jetter, as well as at seminar participants at the Australian National
            University and the University of Freiburg, specifically: Ryan Edwards, Gerrit J. Gonschorek and Tim Kreiger. Sincere
            thank too to Sam Bazzi for providing valuable feedback. We are also grateful to the seminar participants at the
            Indonesian Institute of Sciences and the UWA Indonesia Study Group as well as TNP2K, especially Priadi, Hendratno
            Tuhiman (late) and Sudarno Sumarto for valuable discussions.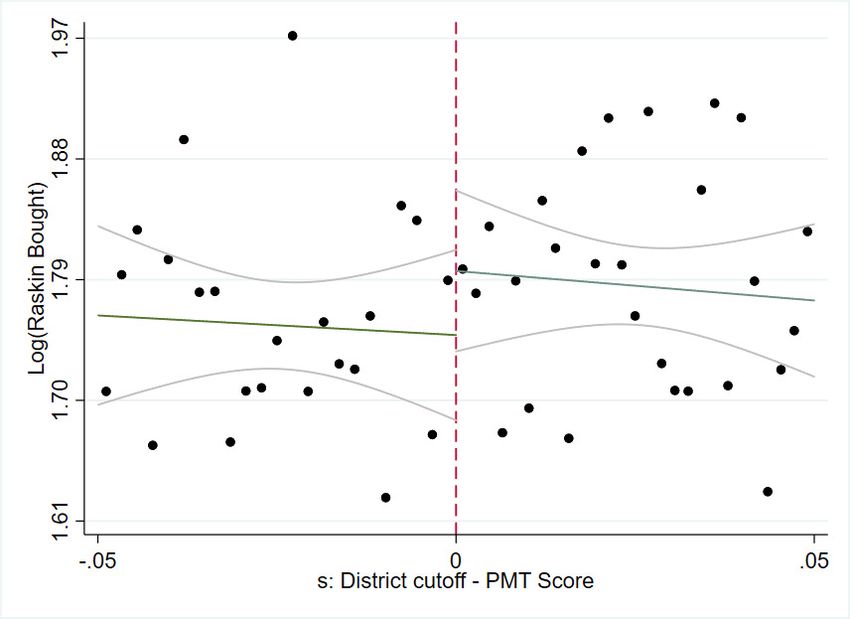
1     Introduction
                                                      Knowledge is power. Information is

                                                      liberating. Education is the premise

                                                      of progress, in every society, in every

                                                      family

                                                                                 Kofi Annan

                                                           7th Secretary-General of the UN

    Social welfare programs constitute potentially crucial interventions to provide mini-
mum levels of income and standards of living to poor households and vulnerable individ-
uals. These programs are plagued by exclusion errors however (Ravallion, 2007), wherein
many intended beneficiaries fail to receive their full program entitlements. Since bene-
ficiary households may not have full information regarding their program entitlements,
incomplete information has been argued to represent key constraints on households re-
ceiving their full program entitlements (Banerjee et al., 2018). Concurrently, many poor
households globally lack access to basic education, which has been shown to be pivotal
in poor household’s social and economic outcomes (Duflo, 2001). Greater dissemination
of information has therefore been championed as a means to empower the poor, while
literacy, in particular, has been singled out as a pre-requisite for information campaigns
to be successful (World Bank, 2004; Ravallion et al., 2013).
    Testing the role of literacy in fostering successful information campaigns is challeng-
ing, since education and information are both endogenous to any social welfare program
outcome. Indeed individuals typically acquire their schooling during childhood, whereas
the effects of information campaigns are likely operate through receipt of information by
household heads during adulthood. Causally identifying the role of literacy in fostering
successful information campaigns therefore necessarily involves linking two causal pol-
icy evaluations over the lifetimes of the same individuals so as to examine this dynamic
complimentarity.

                                             1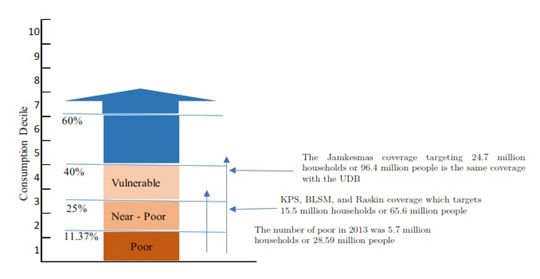
To address this challenge, we implement a two-part intertemporal policy evaluation in
the context of Indonesia. Our analysis during household heads’ adulthoods links the pro-
vision of information with household receipts from a social welfare program in the context
of Raskin rice (see Banerjee et al., 2018). We subsequently show that the efficacy of the
information treatment is in large part driven by household heads’ literacy. Our analysis
during household heads’ childhoods, causally links one of the largest school building pro-
grams to household head literacy in the context of the INPRES school building program
a la Duflo (2001). Ultimately therefore, we are able to provide a causal chain of results,
linking: the information treatment to receipts of Raskin rice, the information treatment
and household head literacy (to show the heterogeneity in households’ receipt of Raskin
rice) and the building of INPRES schools to household head literacy in childhood.
    The setting for our first evaluation, is the 2014 campaign launched by the Government
of Indonesia (GoI) that constituted one of the largest information interventions in the
history of poverty reduction programs (see: Banerjee et al. (2018)). Treated households
were delivered an information package detailing their social welfare program entitlements
(See Figure B1 in the Appendix). Our data detail individual household’s PMT scores
that the GoI used to identify households’ eligibility. The availability of all 482 official
Proxy Mean Test (PMT) district eligibility thresholds in turn motivates a RD design, the
results of which we corroborate with both parametric and semiparametric methods. Our
results show that treated households receive 30 percentage points more Raskin rice. 1
    We subsequently evaluate the impact of the SD INPRES program on household heads’
literacy acquired during their childhood. The SD INPRES program constitutes one of
the largest school construction programs in the world to date (World Bank, 1990). During
the period 1971-1974, the Indonesian government built approximately 61,000 new schools,
one new school per 500 children ages 5 to 14 (Duflo, 2001, 2004), which is equivalent to
a doubling of the stock of primary schools nationally (please refer to Figure 3).
    We leverage novel administrative data from Indonesia’s Ministry of Education on

   1
     In doing so, we provide external validity to Banerjee et al. (2018) in the sense that we use nationally
representative data as opposed to an RCT across six out of 514 municipalities.

                                                     2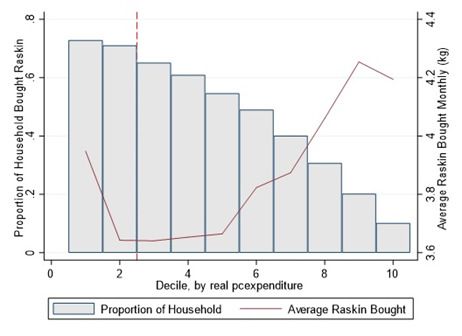
school information, namely DAPODIK (for Data Pokok Pendidikan Dasar dan Menen-
gah or Basic Data on Primary and Secondary Education), to identify the village primary
schools that each of our household heads (receiving our information treatment) were ex-
posed to during their childhood. We subsequently leverage the time and spatial variation
in our school building data to construct instruments for childhood exposure to the SD
INPRES program, having accounted for migration since birth, to causally link the SD
INPRES program to literacy in adulthood. The results suggest that having graduated
from a primary school during childhood increases the probability of the household heads
being literate by 49.4 percentage points.
   Taken collectively, we provide causal evidence that literacy constitutes a key mecha-
nism that determines the efficacy of information campaigns; as measured in our case by
households’ receipts of Raskin rice. In doing so, we link two seminal papers from across
the literature, Duflo (2001) and Banerjee et al. (2018), to demonstrate how treatments
can affect one another intertemporally. In contrast to Banerjee et al. (2018) we interact
household head literacy with our RD estimates, to causally show that approximately half
of the observed effect of information on the receipt of Raskin rice is driven by household
head literacy. We therefore highlight how policy evaluations may complement one an-
other dynamically for the same individual over their lifetimes along the intensive margin,
as opposed to complementing one another when delivered in tandem along the extensive
margin (see Tohari et al., 2019). In doing so, we contribute to the burgeoning literature
on dynamic complimentarities, see for example: Cunha and Heckman (2007); Chetty
et al. (2011); Aizer and Cunha (2012); Attanasio (2015); Attanasio et al. (2017); Foster
and Gehrke (2017); Johnson and Jackson (2019).
   Our research speaks directly to the literature that examines the role of information
campaigns on the uptake of social welfare programs, which to date has delivered mixed
results (Olken, 2007; Reinikka and Svensson, 2004; Pandey et al., 2009; Banerjee et al.,
2010; Pradhan et al., 2014; Lieberman et al., 2014). In our context of anti-poverty pro-
grams, Ravallion et al. (2013) finds that benefits are negatively associated with education.
Banerjee et al. (2018), in evaluating the same information treatment as we do in this paper

                                             3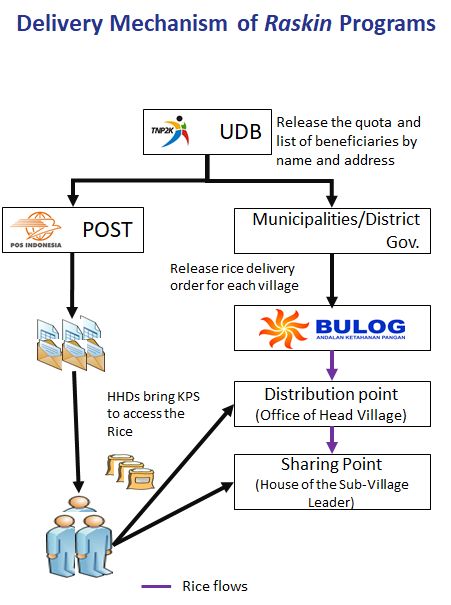
through implementing field experiments, rather use household head literacy to balance
their treatment and control groups. It remains unclear however, why some information-
based interventions succeed, while others do not. One plausible explanation pertains to
the extent to which information is understood by eligible households (Fox, 2007). Indeed,
the World Bank (2004) claims that there is a strong relationship between the success of
information treatments and levels of public literacy, especially among poor people. Our
results provide causal evidence in favor of this explanation.
   We also contribute to the rich and longstanding literature that examines the short,
medium and long-term impacts of the SD INPRES program on: labour force produc-
tivity and economic growth (Duflo, 2001, 2004), improvements in local governance and
public good provision (Martinez-Bravo, 2017), health outcomes (Breierova and Duflo,
2004; Somanathan, 2008) and intergenerational effects (Akresh et al., 2018; Mazumder
et al., 2019). While existing studies examine the SD INPRES program using aggregate
schooling data however, (Duflo, 2001, 2004), our analysis estimates the effect of the school
construction at the village level which are commonly used as catchment areas for primary
schools in Indonesia (see for example Bazzi et al. (2020)). Whereas Martinez-Bravo (2017)
use the school data from PODES which are also disaggregated at the village level, those
data are silent as to when schools were constructed. Indeed, many schools were built prior
to the SD INPRES period, which if left unaccounted for may bias estimates. We leverage
the fact that between 1971 and 1990 the SD INPRES program reduced illiteracy across
Indonesia from 39.1 % to 15.8% Duflo (2001, 2004), a fact that we exploit once house-
hold heads have matured into adulthood. Taken collectively, we interpret our results as
confirmation of the role of past (mass) education policy in improving the effectiveness of
contemporaneous anti-poverty programs.

                                             4
2 Institutional Background
2.1 Pre-Information Campaign Performance of Raskin
Since 1997, the Government of Indonesia has implemented several strategies and pro-
grams to alleviate poverty (see Tohari et al., 2019). These programs are clustered around
their targeted beneficiaries. Programs targeted at individuals (e.g. Jamkesmas) 2 and
households (e.g. Raskin, BLSM, and PKH ) 3 comprise the first cluster. Community tar-
geted programs (e.g. PNPM Mandiri ) 4 fall under the second. The third cluster includes
programs targeted at micro and small enterprises (e.g. Kredit Usaha Rakyat – KUR). 5
Previous research has identified several program deficiencies, which for Raskin include:
(1) Rice not reaching eligible households, i.e. exclusion errors during the delivery process 6
and (2) Evidence of frequent Raskin purchases by poor and non-poor households alike
(Olken, 2005; Banerjee et al., 2018), 7 a fact that underpins our identification strategy; and
(3), Local governments failing to judiciously allocate the Raskin budget thereby leading
poor households to pay higher prices for rice in addition to delays in rice distribution
2
Jamkesmas is health insurance for the poor (previously known as Asuransi Kesehatan untuk Kelu-
arga Miskin, or Askeskin, later renamed Jamkesmas). In 2014, Jamkesmas covered some 24.7 million
households or 96.4 million people.
3
PKH is a Conditional Cash Transfer program managed by the Indonesian Ministry of Social Affairs
that targets the bottom 5% of the population. PKH beneficiaries receive direct cash transfers ranging
from IDR. 600,000 to IDR. 2.2 million or (about USD$67–$250) depending on their family composition,
school attendance, pre-/postnatal check-ups and vaccination completions.
4
PNPM Mandiri (for Program Nasional Pemberdayaan Masyarakat Mandiri or the National Program
for Community Empowerment) is Indonesia’s largest community-driven development program to help
alleviate poverty through empowering local communities. There are several components of the PNPM
Mandiri, two of which are PNPM Rural, that began in 1998 as Kecamatan Development Program (KDP)
and PNPM Urban, which begun in 1999 as the Urban Poverty Program (UPP). Interested readers are
referred to TNP2K (2015b).
5
KUR (for Kredit Usaha Rakyat or credit for micro and small enterprises) are credit/working capital
and/or investment financing schemes for enterprises that are unable to meet certain banking require-
ments. The amount of credit provided to each enterprise is less than IDR. 5 million (about $500).
6
Existing administrative records are unable to indicate the point at which the “missing” rice exits
the delivery chain since no single authority is responsible from the point of Raskin rice procurement to
household purchase (World Bank, 2012).
7
The amount of Raskin rice purchased by a household is roughly constant across the entire consump-
tion distribution, meaning non-poor households buy as much Raskin as poor, near-poor, or vulnerable
households (World Bank, 2012). In 2010, the World Bank (2012) estimates that the average amount of
Raskin rice bought by poor households was approximately 3.8 kilograms per month.
5(Hastuti et al., 2012).
To address these shortcomings, between 2011 and 2014, the GoI made significant
changes to the targeting mechanisms and service deliveries of several anti-poverty pro-
grams including Raskin. Specifically, the Unified Data Base (UDB) was developed to
identify the poorest 40% of the population for inclusion in social assistance programs
through Proxy Means Testing (PMT) (see Tohari et al., 2019, for detailed discussions of
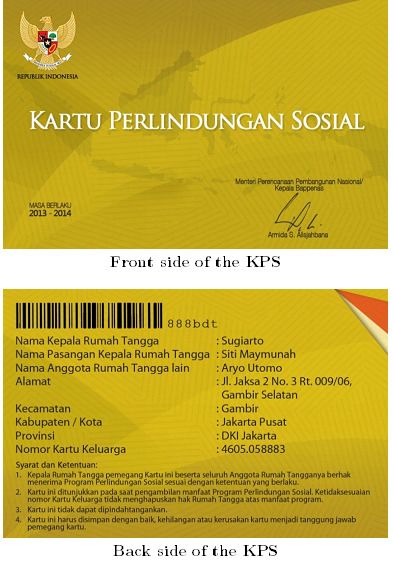
the targeting improvement). Following improvements in targeting, in the third quarter
of 2013, the GoI also distributed Social Security Cards (Kartu Perlindungan Sosial -
KPS) which signify beneficiaries’ eligibility for anti-poverty programs, in additional to an
information packet, the contents of which constitute our first treatment.
2.2 The Information Intervention
The information treatment that we analyse was delivered directly to households using
the postal service. As shown in Figure B.1 of Appendix B, the information provided
details on accessing three different social welfare programs to which the KPS card enti-
tled households, in addition to the complaints procedure to follow should households feel
unfairly treated. Due to the nature of the information intervention which includes sig-
nificant text, a priori one can expect household head literacy to matter in terms of their
understanding the information provided. Our outcome variable however, in line with
Banerjee et al. (2018), is solely on the amount of Raskin rice purchased by households. 8
This information campaign (and the rollout of the KPS card) was targeted at the
bottom 25 percent of households, equivalent to 15.5 million poor and near-poor Indonesian
households, the names and addresses of which were taken from the UDB (see Figure 1).
This intervention was delivered directly to targeted households by PT POS Indonesia,
the State-owned postal company.
8
Details of the KPS card are provided in Appendix Figure B.2 In an effort to protect the card from
fraud, the KPS card includes household details including: household head, their spouse and address as
well as barcodes representing the family card number.
62.3 Raskin Delivery Mechanism
The Raskin program aims to reduce household expenditure on food, particularly on rice,
the staple food in Indonesia. In 2013 and 2014, the program covered around 15.5 million
of the poorest Indonesian households. According to the 2014 Raskin Guidelines,9 the
implementation of the program has not changed since its inception. Figure B.3 in the
Appendix B shows the delivery mechanism for the Raskin program. Since 2011, several
agents have been involved in the procurement and delivery of Raskin rice. They include:
(i) the Coordinating Minister of Social Affairs (for Kementerian Koordinator Bidang Ke-
sejahteraan Rakyat or Coordinating Minister of Social Affairs), later called Kemmenko
PMK (for Menteri Koordinator Bidang Pembangunan Manusia and Kebudayaan or Coor-
dinating Minister of Human Resources and Culture), and the Vice President’s National
Team for the Acceleration of the Poverty Reduction (TNP2K), which together deter-
mine yearly allocation and price of rice, 10 (ii) the Bulog (the National Logistics Agency)
responsible for procuring rice from producers and delivering the rice to over 50,000 dis-
tribution points across Indonesia. Raskin beneficiaries are expected to make monthly
Raskin purchases from these distribution centres 11 and (iii) the District government that
is responsible for the logistics of transporting Raskin rice to recipient households.
We measure the effectiveness of the information intervention using the average amount
of Raskin rice bought by beneficiary households over a three-month period. Summary
statistics of our outcome as well as the characteristics of Raskin beneficiaries are presented
in Appendix Table A.1 On average, households in receipt of the information treatment
bought around six kilograms of Raskin rice, which is less than half the intended allocated
9
Kemenkokesra. (2014). “Pedoman Umum Raskin 2014” (General Guideline: Rice Subsidy for Poor
People 2014). Jakarta: Kemenkokesra.
10
According to the general guidelines of Raskin 2014, the total number and the list of Raskin benefi-
ciaries were obtained from the Unified Database of TNP2K. In terms of benefit, each targeted household
should receive 15 kg/month per month of rice. The price of Raskin rice is IDR 1600 /kg at the Sharing
Point (Titik Bagi ).
11
The distribution centres (or Titik Distribusi ) of Raskin are mostly located in village offices or other
places that are decided upon between Local Government and Bulog. The local government and village
administrative apparatuses are then responsible for notifying eligible beneficiaries and arranging the
transport of rice from distribution points to households (Titik Bagi or sharing points).
7benefit; although this is significantly higher than the purchase of Raskin rice by those
households in 2011, which was only 3.7 kilograms.
Although, as shown in Figure 1, the bottom 25% of the population of Indonesia were de
jure eligible for Raskin rice purchases in addition to the information treatment, de facto,
households on both sides of this threshold were also able to purchase Raskin rice, which
resulted from the actions of village leaders. To substantiate this claim, Figure 2 presents
both the proportion of households purchasing Raskin rice, as well as the average amount
of Raskin rice purchased by consumption decile in 2011. Crucially, from the perspective
of our identification strategy, which focuses on those just above and below the threshold
of the poorest 25% of households, as shown by the dashed (red) line, we do not observe
any significant differences in the amount of Raskin rice purchased between these two
groups. In other words, while there are no discernible differences in Raskin purchases
above and below our threshold, those below our 25% threshold were targeted by the
information campaign, while those above the threshold were not. It is this discontinuity
that we exploit in the first part of our analysis.
3 Data, PMT Score and Eligibility
To evaluate the effect of the information campaign on the amount of Raskin rice received,
we combine several nationally representative surveys with rich administrative data ob-
tained from the GoI.
3.1 The SUSENAS Survey
The National Socioeconomic Survey (SUSENAS) is an annual cross-sectional, nationally
representative dataset, initiated in 1963-1964 and fielded annually else biannually since
then. In 2011, the Central Bureau of Statistics of Indonesia (BPS) changed the survey
frequency to quarterly, and for each quarter, the SUSENAS covers some 300,000 indi-
viduals and 75,000 households. In this paper, we utilize data from the 2014 wave of the
SUSENAS survey to: (i) generate variables that are required to estimate the PMT Score
8for each household using the official PMT coefficients (ii) obtain control variables that
are not included in the PMT score estimation and (iii) construct poverty indicators as
outcome variables.
3.2 Social Protection Survey (SPS)
The second dataset used in our analysis is the 2014 Social Protection Survey (SPS), which
was conducted jointly by the BPS and TNP2K as a supplement to the SUSENAS. This
survey was implemented from the first quarter of 2013 to the first quarter of 2014 and
was specifically aimed at examining the performance of poverty targeting following the
implementation of the UDB. We exploit data from the first quarter of 2014, the period
immediately following our information treatment to construct our treatment and outcome
variables.
3.3 Village Census (PODES)
We use the 2011 and 2014 waves of PODES data, to provide information on all vil-
lages/desa in Indonesia. The variables produced using this census include the character-
istics of the village, some of which were used in estimating the PMT scores.
3.4 DAPODIK
DAPODIK (for Data Pokok Pendidikan Dasar dan Menengah or Basic Data on Primary
and Secondary Education) is the administrative school-level dataset collected by the
Ministry of Education. DAPODIK comprises more than 512 thousand primary and
secondary schools and provides details of schools’: precise location, date of construction,
operational and financial assets etc.
Between 1973 and 1983, the Government of Indonesia embarked on a massive school
construction program to increase primary school enrolment, namely the SD INPRES
program (for Sekolah Dasar Instruksi Presiden or Presidential Decree Primary School),
one of the largest such programs in history. The schools were constructed in provinces
with low primary school enrolment corresponding to one new school per 500 children
9aged 5 to 14 in 1971 (Duflo, 2001, 2004). The approximately 61,000 new schools con-
structed through this program, constituting some 44% of the total, were approximately
proportional to the number of school-aged children not enrolled in school prior to the
program (Martinez-Bravo, 2017). Each new school was allocated three teachers and 120
primary school pupils, aged between 7 and 12 years. 12 Taken together, Figures 3 and
4 highlight the significant variations in primary school construction in Indonesia, across
both time and space. First, we assume that the village household heads currently reside
in are the same villages as where they went to primary school in when aged six years
old. 13 Subsequently, we exploit the spatial and time variations in the SD INPRES school
construction program, in order to define a dummy variable equal to one should a partic-
ular household head have had access to a primary school when they themselves became
of primary school age.
3.5 Merging the datasets
The greatest challenge in merging our datasets is the fact that since 2011, the BPS has not
published the village and subdistrict codes for their household survey data. To address
this, we proceed as follows:
i). We merge the Quarter 1 2014 SPS data with the Quarter 1 2014 SUSENAS using
the household ID available in both datasets. Overall, 70,336 households from the
SPS sample can be identified from the total of 71,051 households in the SUSENAS
survey.
ii). These combined data are then merged with the 2014 pooled SUSENAS to obtain
village and sub-district IDs using a ‘bridging code’ privately shared with us by the
BPS. 14
12
Based on the DAPODIK Data, 63,518 primary schools were built through the INPRES Program
(from 1974 to 1987), representing about 44% of the total primary schools in Indonesia (total=145,782).
13
In the SUSENAS 2014, the BPS did not collect any information on migration. In 2019 SUSENAS,
however, questions about migration were included in SUSENAS Core questionnaire, and there are 20.23
percent of the population who lived in a municipality different from their birthplace municipality.
14
We are grateful to a TNP2K targeting team who provided us with this bridging code.
10iii). We subsequently merge the resulting dataset with selected variables from PODES
using a village identifier so as to obtain village-level variables. After merging with the
PODES data, we are able to identify 67,118 households including details of their
expenditure and social protection as well as village-level information that can be
combined with the official PMT coefficients in order to obtain individual household
PMT scores, which are discussed in detail below.
iv). Finally, using village identifiers from PODES, we construct village polygons using
an official map obtained from the BPS. We then conduct spatial merges to overlay
all these polygons with the geolocations of all schools detailed in the DAPODIK
dataset. From this process, we know the exact catchment area for each school as
presented in Figure 4.
3.6 Estimating the Household’s PMT Score and their eligibility
Measuring household PMT scores is crucial in defining the eligibility status of each house-
hold to our information treatment. Estimating the PMT score involves:
1. Selecting the poorest 25% or 15.5 million households from the UDB. The UDB con-
tains information on the bottom 40% of the Indonesian population collected through
PPLS11 (Program Pendataan Perlindungan Sosial 2011) together with their estimated
PMT scores. To estimate the PMT score and rank of each household in the UDB, the
GoI used coefficients that are measured using SUSENAS and PODES 2011. These
coefficients are unique to the 482 districts from the total of Indonesia’s 497 districts
in 2011. 15 The PMT score for each household is then measured using each house-
hold’s observable information, which in turn is plugged into the corresponding district
coefficient and subsequently ranked. Using household’s PMT scores and ranks, the
government then selects a list of intended beneficiary households.
15
For other 15 districts, the GoI implement universal targeting system. For these specific areas, such
as several districts which have high incidence of poverty, the GoI selects intended beneficiaries using a
‘negative lists’ method, which means all households are eligible for poverty programs, except those that
contain a public servant, local leaders, high ranking military officials etc.
112. Using these official PMT coefficients, this study recovers households’ PMT scores in
2014: (1) using data from SPS, SUSENAS and PODES in 2014, to construct variables
that are comparable to those variables used in PPLS11 (2) following the same steps
as conducted by the GoI in which the 2014 variables are plugged into the official PMT
coefficients and (3) ranking each household based on their PMT score. As our study
uses nationally representative data, the household rank represents their rank relative to
the total population. Each household’s eligibility for social welfare programs depends
upon whether their PMT score lies above or below their district’s cut-off. The cut-off
for each district is measured using the official quota used by the GoI to select the list
of KPS program beneficiaries that are unique to each district.
We plot the result of this process, the estimates of our PMT score against the proba-
bility of receiving the information treatment using a nonparametric Fan (1992) regression
estimation in Figure B.4 in the Appendix. The Figure confirms an overall negative rela-
tionship between the PMT Score and the likelihood of receiving information intervention,
since higher PMT implies lower eligibility for the program.
4 Estimation Strategy
Household’s eligibility for the information treatment is based on their household PMT
score relative to their district’s cut-off. We investigate the impact of receiving the infor-
mation treatment on household’s reciepts of Raskin rice. Let pmti,d be the PMT score
for each household and pmtd be the PMT cutoff for each district. Then, I, defines the
eligibility of each household to receive the information intervention, (TNP2K, 2015a):
8
>
>
>
:0 if pmti,d > pmtd
For each eligible household, we can define their potential outcome, B, with (B1 ) if
they received the treatment and (B0 ) otherwise. Following Rubin (1974), the difference
between the average benefit of recipient households relative to non-treated households
12becomes:
E(B | I = 1) − E(B | I = 0) = E(B1 − B0 | I = 1) + E(B0 | I = 1) − E(B0 | I = 0)
| {z } | {z }
θ b
(2)
Our estimate of interest is the average treatment-on-the-treated, i.e, the effect of
receiving the information treatment, θ, for a subgroup of compliers. The main threat to
identification is the prospect of omitted variable bias, b; unobserved determinants that
are potentially correlated with the probability of receiving the information as well as with
the level of benefits received.
4.1 The Impact of Information on the Benefit Received
First we implement a regression discontinuity methodology by exploiting the discontinuity
in the eligibility of information provision around our 25% threshold, as in Equation (1).
The baseline analysis estimates the following regression model within a narrow window
around the district cut-off:
Outi,d = β0 + β1 Inf ormationi,d + β2 (pmtd − pmti,d ) + β3 Inf ormationi,d ∗
(3)
f (pmtd − pmti,d ) + β4 (1 − Inf ormationi,d ) ∗ f (pmtd − pmti,d ) + εi,d
Where Outi,d is the average amount of Raskin rice bought per month in kilograms by
household i in district d. Inf ormationi,d is an indicator variable equal to 1 if household
receive information treatment, and pmtd −pmti,d is the distance between households’ PMT
scores and their respective district cut-offs. We examine alternative functional forms,
f (.), of the RD polynomial for robustness. The baseline specifications follow Gelman
and Imbens (2019) and implement RD polynomials of differing orders. First however,
we show that the information treatment had a significant increase in the amount of rice
bought from the Raskin program in 2014, for those households located within the RD
envelope, see Figure 5.
Table 1 presents our baseline results from estimating Equation (3). To select the
optimal bandwidth, we follow the criteria proposed by Imbens and Kalyanaraman (2012)
13henceforth, IK2012, in the first three Columns and Calonico et al. (2014), henceforth,
CCT2014, in Columns four to six. The polynomial order, the size of the bandwidth and
the observations inside the bandwidth are presented in Table 1.
The 2SLS coefficients using nonparametric estimates without adjusting for covariates,
in Columns (1) and (4) in Panel A of Table 1, show that in general, receiving informa-
tion increases the amount of Raskin rice purchased by around 30.6 percentage points
according to IK2012, and 39.2 percentage points according to CCT2014. We also test
whether the treatments differed between Java and Non-Java, by splitting the sample.
Java is the most populous island in Indonesia and previous studies (e.g. Ravallion and
Dearden, 1988) have shown that Java tends to be more egalitarian whereby benefits are
more often shared. Given this, the distribution of the benefits received from poverty pro-
grams could differ between Java and other areas of the country. The results using linear
order polynomials in Panel A of Table 1 are presented in Columns (2) and (3) based
on IK2012, and Columns (5) and (6) results are based on CCT2014. They show that
there are indeed significant differences between the impact of information dissemination
in Java and the other provinces, even though the effects are not statistically significant
using lower order of polynomials. When we implement cubic order polynomials however,
the results in both Java and Non-Java become statistically significant. Under this speci-
fication, the effect of information on the Java sub sample is about 61.1 percentage points
higher and statistically significant, while the effects in the Non-Java provinces are about
32.8 percentage points under IK bandwidths. Our estimates using higher order polynomi-
als, those excepting cubic order polynomials under the CCT bandwidth selection, likely
generate higher estimates because higher order polynomials assign far greater weights to
observations further away from the discontinuity Gelman and Imbens (2019).
We also include pre-intervention covariates related to village and head of village char-
acteristics following Frölich (2007) Frolich (2007) and Calonico et al. (2019). 16 Imbens
and Kalyanaraman (2012) however, note that the inclusion of additional covariates should
not significantly affect such analyses. The results presented in panel B of Table 1, shows
16
Pre-intervention covariates related to village and head of village are derived from 2011 PODES data.
14that in general the inclusion of covariates produces slightly lower estimates. For example,
using linear order polynomials and the IK bandwidth selection, the covariates-adjusted
estimates of providing information on Raskin are about 25.9 percentage points higher,
while under non-adjusted covariates estimation it is about 30.9 percentage points.
Interestingly the covariates-adjusted RDD estimation under IK2012 bandwidth selec-
tion and linear order polynomial produces the closest estimate when compared to the
results of Banerjee et al. (2018). Those authors find that the same information treatment
increases the amount of Raskin rice purchased by approximately 26% when compared to
the control group. Since we exploit nationally representative data, as opposed to basing
our estimation on an RCT in 550 villages across six districts, we argue that our research
provides external validity of Banerjee et al.’s results.
4.2 Robustness Checks and Extensions
4.2.1 Sensitivity Tests
First, we choose a range of placebo cut-offs to ensure that the discontinuity of the outcome
of interest only occurs at the true cut-off. Table 2 summarizes the estimate of the effect
of information for selected cut-offs ranging from -0.1 to 0.1 in increments of 0.05. Figure
6 plots the estimates. The cut-off at 0 is included as a benchmark. As expected, with
the exception of 0 i.e. the true cut-off, there is no effect of the information treatment at
any of the placebo cut-offs. In terms of magnitude, the effect of information is smaller
compared to the true effects at all other cut-offs. This implies that the outcome of interest
does not jump discontinuously at any other cut-off other than at zero.
In choosing a bandwidth, it is critical to consider an optimal balance between esti-
mation precision and estimation bias (Lee and Lemieux, 2010). Larger bandwidths, on
the one hand, yield more precise estimates since more observations can be relied upon in
estimation (i.e. greater efficiency). On the other hand, when a larger bandwidth is used,
the resulting estimates are less likely to be accurate as increasingly more observations are
considered that are located further from the threshold (i.e. greater bias). Figure 7 plots
the estimated 2SLS coefficients of the effect of information and the associated confidence
15intervals for different bandwidth selections or window lengths using IK2012. The area
within the vertical dashed lines represents the location of the true optimal bandwidths
that are selected based on both IK2012 and CCT2014. Evidentially, as the bandwidth
increases, the bias of the estimator increases as its variance decreases. Therefore, it is
natural that the larger the bandwidth, the smaller the confidence intervals, but due to
bias, the point estimates are also displaced.
4.2.2 Comparing RD, LATE and LARF
The results from the local kernel regression results confirm that receiving information
significantly increases the benefits received from the Raskin program. Below we ex-
amine whether these effects are also consistent if they are estimated following Angrist
et al. (1996) parametric estimate and Abadie (2003) semiparametric approach. 17 Our
parametric approach, the estimation of the LATE, implements an instrumental variable
technique with eligibility status of the household used as our instrument for treatment.
Our semiparametric approach as detailed in Abadie (2003), instead proposes to use a
Local Average Response Function (LARF) that allows one to compare the characteristics
of treated and non-treated individuals within the compliers’ subset, in the absence of
knowledge as to who is and is not a complier. The estimation of the LARF is conducted
in two steps which are: (1) to measure weights, w, by estimating parametrically (or non-
parametrically) p(Z = 1|X) and (2) estimating the effects using Weighted Least Square
(WLS) with weights equal to w.
With regards national level effects, Columns (2) and (5) in Table 3, show the results
from both our parametric and semiparametric estimators, which are slightly different
and statistically significant. The magnitude of the effects and their signs show that the
provision of information increases the benefits received from the Raskin program by about
37.1 percentage points in parametric and 48.5 in semiparametric estimations, respectively.
The result of parametric estimation is in the range of the estimated effects from our
17
Lee and Lemieux (2010) note a number of alternative estimation strategies and suggest that no
single method be relied upon. Our parametric and semiparametric estimations are therefore included to
complement our non-parametric approach.
16nonparametric approach in Table 1, while the result of semiparametric estimation is
slightly higher in all nonparametric alternative estimations.
The difference in the effects of the information treatment between Java and Non-
Java is noteworthy. In general, our parametric and semiparametric estimates produce
consistent results with the nonparametric estimation in which the effect of information
on social benefits away from Java is lower than in Java itself and all the results are
statistically significant. In terms of the magnitude however, using our parametric results
in Columns (3) and (4) of Table 3, we observe that the provision of information increases
the benefits received from the Raskin program by about 42.6 percentage points in Java
households and by 36.8 percentage points in Non-Java households, respectively. Moreover,
our semiparametric results for Java and Non-Java households, produce the same results
with small difference between Java and Non-Java compared to our parametric results.
Finally, it is important to note that the OLS estimate in Column (1) of Table 3 is
downwardly biased. According to the OLS result, the increase in the benefits received
from Raskin is about 21.5 percentage points conditional on covariates. The estimated
effect of information increases when we instrument this variable with the household’s
eligibility to receive treatment. Overall therefore, we can conclude that the provision
of information to eligible households increases the level of benefits received by between
30-40 percentage points on average.
4.3 Information Intervention and Household Head Literacy
Knowing that the information treatment has a positive impact on the benefit received
from Raskin program, in this section, we investigate whether household characteristics
have contributed to explaining variation in the level of benefits received. As pointed
out by Tohari et al. (2019) one of the aims of KPS and information intervention was to
increase the complementarities among poverty program in Indonesia. In that paper we
show that the implementation of the KPS has increased the complementarities of the pro-
grams related to their extensive margin. In this section, we further investigate whether
household head literacy contributes to the effectiveness of the information intervention,
17in effect providing a formal test of the conclusions of World Bank (2004); hypothesising
that literate household heads receive more of their entitlements in comparison with illit-
erates. This is consistent with the argument that information can only improve public
participation and increase benefits if the information is understandable and actionable
(Fox, 2007). We therefore modify Equation (3) and estimate the following regression:
Outi,d = β0 + β1 Inf ormationi,d + β2 (pmtd − pmti,d ) +
β3 Inf ormationi,d ∗ f (pmtd − pmti,d ) + β4 Inf ormationi,d ∗ IN Di,d +
(4)
β5 (pmtd − pmti,d ) ∗ IN Di,d + β6 (Inf ormationi,d )∗
f (pmtd − pmti,d ) ∗ IN Di,d + εi,d
where IN Di,d represent indicator variables which equal 1 if households i in the district
d have specific characteristics, for example, they receive other programs than Raskin,
have head or wife who can read, and other characteristics and 0 otherwise.
Table 4 presents the result of whether a household head’s literacy explains the het-
erogeneity in the impact of information intervention on the amount of rice purchased by
poor households. Column 1 reproduces the baseline result as presented in the previous
section. Column 2 examines whether the effect of information is larger if the household
head is literate, which is plausible since literacy is a necessary condition for households
to understand the contents of the treatment, through the addition of an interaction term
comprising a dummy variable that is equal to one should the household head be literate.
The coefficient on the interaction term shows that approximately half of the total effect
of the information treatment operates through the channel of household head literacy.
We continue by evaluating the comparable effect for household head’s wives. The results
are reported in column 3 and show that the overall effect of the information treatment is
even larger and statistically significant when the wife is literate, although the interaction
effect is slightly smaller than the comparable estimate of household head literacy. In
summary, literacy is shown to be a critical factor determining the effectiveness of our
information treatment.
184.4 Literacy and Past Education Policy
Since household literacy is shown to have a significant impact on the effectiveness of in-
formation campaigns, in this section, we examine the effect of past education policy on
household literacy. Specifically, we exploit the massive school construction program to
increase primary school enrolment, namely SD INPRES program (for Sekolah Dasar In-
struksi Presiden or Presidential Decree Primary School) which was implemented between
1973 and 1983. The schools were specifically constructed in provinces with low primary
school enrolment. Figure 3 shows the development of primary school in Indonesia from
1890 to 1990. The figure confirms that during the INPRES program, there had been a
significant increase of primary school building in Indonesia, equivalent of around 44% of
the total stock as of 1990.
We therefore estimate the LATE regression following Angrist et al. (1996) as follows:
Liti,d = β0 + β1 Gradi,d + υi,d
(5)
Gradi,d = α0 + α1 Schooli,d + εi,d
Where Liti,d is an indicator variable equal to 1, if individual i in village d is literate,
while Gradi,d is an indicator variable equal to 1 if an individual graduated from primary
school. Since Grad is an endogenous dummy variable, we instrument that variable with
School, an indicator variable equal to 1 if a primary school construction had been com-
pleted in household (or wife) heads’ villages, when they first entered primary education,
when he/she was 6 years old.
In order to construct the School variable, we use a novel dataset known as DAPODIK
(for Data Pokok Pendidikan or Education database) which has been collected by the
Indonesian Ministry of Education since 2014. This database contains rich information
on schools in Indonesia including information: on their exact location transformed into
geolocations, when the school was built and first operationalized etc. This estimation
strategy is at odds with those operationalised in previous studies that examined the
impact of the SD INPRES program, which relied upon aggregated data (e.g. Duflo,
2001, 2004). The additional levels of detail in our data allow us to examine the impact
19of school construction on individuals in the catchment areas of specific primary schools.
It is common that the primary school catchment is in Indonesia is at the village level.
Table 5 reports the results concerning the impact of graduating from an SD INPRES
primary school on the literary of household heads (along with their wives). Columns
1 and 4 report the results from our baseline OLS estimates. Columns 3 and 6 rather
present the average treatment effects of graduation on literary rates. Household heads
graduating from primary school increased the likelihood of male household heads being
literate by some 49.4 percentage points. For their wives, the effect is even larger, since the
probability of being literate rose by some 73.3 percentage points. Nevertheless, migration
since childhood could bias our results (Duflo, 2004). For the sake of robustness, we
therefore estimate Equation 5 separately for migrant and non-migrant households. Table
A.2. and Table A.3. report the results. While our overarching results hold, we find that
the magnitudes of our estimated effects are somewhat attenuated for household heads
and strengthened for the wives of migrant households; while the converse also holds true
for non-migrant households.
5 Conclusion
Information campaigns have been proffered as low cost interventions to empower the poor.
We contribute to the limited evidence base on their efficacy, evaluating the previously
untested hypothesis that literacy is pivotal to their success (World Bank, 2004; Fox, 2007).
Such an evaluation is non-trivial, since literacy is typically acquired during childhood,
while receipt of information campaigns is most often received during adulthood.
The setting for the first part of our policy evaluation is the 2013 targeted information
campaign of the GoI, one of the largest information interventions in history. In evaluating
this information campaign, we draw upon several extraordinarily rich sources of adminis-
trative data, including GoI PMT coefficients that we use to recover each household’s PMT
score and which we subsequently compare to that household’s district PMT threshold in
order to definitively pin down which households should have received the treatment. We
20implement in an RD framework. We find that the provision of information increased
households’ receipts of Raskin rice by between 30 and 40 percentage points. In doing so,
we provide external validity to the results of Banerjee et al. (2018) that evaluated the
same policy only using a geographically constrained RCT.
We continue by interacting our RD coefficients with measures of household head liter-
acy, to show that large fractions of the total estimated effect of information on the receipt
of Raskin rice is driven by household head literacy. Finally, leveraging administrative data
detailing the precise locations and opening years of the universe of primary schools in
Indonesia, we conduct a second policy evaluation that causally links school building to
literacy gained during childhood. Specifically, we examine the role of graduating from
primary school on literacy, while instrumenting having graduated with a variable that
captures whether that individual lived in a village with an SD INPRES primary school
during their primary school age.
Ultimately, we provide a chain of causal evaluations showing that the school building
program dramatically affected household head literacy during childhood. Household head
literacy in turn explains around half of the observed heterogeneity in the effect of the
information campaign on household receipts of Raskin rice. Finally, we show that overall
the information campaign resulted in a significant increase in poor household’s receipt
of Raskin rice. Taken collectively, our results highlight the prominent role of literacy
in explaining the efficacy of information campaigns, an evaluation of which has been
hampered due to the extraordinary data requirements.
21References
Abadie, A. (2003). Semiparametric instrumental variable estimation of treatment re-
sponse models. Journal of econometrics, 113(2):231–263.
Aizer, A. and Cunha, F. (2012). The production of human capital: Endowments, invest-
ments and fertility. Technical report, National Bureau of Economic Research.
Akresh, R., Halim, D., and Kleemans, M. (2018). Long-term and intergenerational ef-
fects of education: Evidence from school construction in indonesia. Technical report,
National Bureau of Economic Research.
Angrist, J. D., Imbens, G. W., and Rubin, D. B. (1996). Identification of causal ef-
fects using instrumental variables. Journal of the American statistical Association,
91(434):444–455.
Attanasio, O., Meghir, C., Nix, E., and Salvati, F. (2017). Human capital growth and
poverty: Evidence from ethiopia and peru. Review of economic dynamics, 25:234–259.
Attanasio, O. P. (2015). The determinants of human capital formation during the early
years of life: Theory, measurement, and policies. Journal of the European Economic
Association, 13(6):949–997.
Banerjee, A., Hanna, R., Kyle, J., Olken, B. A., and Sumarto, S. (2018). Tangible
information and citizen empowerment: Identification cards and food subsidy programs
in indonesia. Journal of Political Economy, 126(2):451–491.
Banerjee, A. V., Banerji, R., Duflo, E., Glennerster, R., and Khemani, S. (2010). Pitfalls
of participatory programs: Evidence from a randomized evaluation in education in
india. American Economic Journal: Economic Policy, 2(1):1–30.
Bazzi, S., Hilmy, M., and Marx, B. (2020). Islam and the state: Religious education in
the age of mass schooling. Technical report, National Bureau of Economic Research.
Breierova, L. and Duflo, E. (2004). The impact of education on fertility and child mor-
tality: Do fathers really matter less than mothers? Technical report, National bureau
of economic research.
Calonico, S., Cattaneo, M. D., Farrell, M. H., and Titiunik, R. (2019). Regression discon-
tinuity designs using covariates. Review of Economics and Statistics, 101(3):442–451.
Calonico, S., Cattaneo, M. D., and Titiunik, R. (2014). Robust nonparametric confidence
intervals for regression-discontinuity designs. Econometrica, 82(6):2295–2326.
Chetty, R., Friedman, J. N., Hilger, N., Saez, E., Schanzenbach, D. W., and Yagan, D.
(2011). How does your kindergarten classroom affect your earnings? evidence from
project star. The Quarterly journal of economics, 126(4):1593–1660.
Cunha, F. and Heckman, J. (2007). The technology of skill formation. American Eco-
nomic Review, 97(2):31–47.
Duflo, E. (2001). Schooling and labor market consequences of school construction in
indonesia: Evidence from an unusual policy experiment. American economic review,
91(4):795–813.
Duflo, E. (2004). The medium run effects of educational expansion: Evidence from a
large school construction program in indonesia. Journal of Development Economics,
74(1):163–197.
Fan, J. (1992). Design-adaptive nonparametric regression. Journal of the American
statistical Association, 87(420):998–1004.
Foster, A. D. and Gehrke, E. (2017). Start what you finish! ex ante risk and schooling
investments in the presence of dynamic complementarities. Technical report, National
Bureau of Economic Research.
22Fox, J. (2007). The uncertain relationship between transparency and accountability.
Development in practice, 17(4-5):663–671.
Frölich, M. (2007). Regression discontinuity design with covariates. University of St.
Gallen, Department of Economics, Discussion Paper, (2007-32).
Gelman, A. and Imbens, G. (2019). Why high-order polynomials should not be used in
regression discontinuity designs. Journal of Business & Economic Statistics, 37(3):447–
456.
Hastuti, S., Mawardi, S., et al. (2012). Tinjauan Efektivitas Pelaksanaan Raskin dalam
Mencapai Enam Tepat.
Imbens, G. and Kalyanaraman, K. (2012). Optimal bandwidth choice for the regression
discontinuity estimator. The Review of economic studies, 79(3):933–959.
Johnson, R. C. and Jackson, C. K. (2019). Reducing inequality through dynamic comple-
mentarity: Evidence from head start and public school spending. American Economic
Journal: Economic Policy, 11(4):310–49.
Lee, D. S. and Lemieux, T. (2010). Regression discontinuity designs in economics. Journal
of economic literature, 48(2):281–355.
Lieberman, E. S., Posner, D. N., and Tsai, L. L. (2014). Does information lead to more
active citizenship? evidence from an education intervention in rural kenya. World
Development, 60:69–83.
Martinez-Bravo, M. (2017). The local political economy effects of school construction in
indonesia. American Economic Journal: Applied Economics, 9(2):256–89.
Mazumder, B., Rosales-Rueda, M., and Triyana, M. (2019). Intergenerational human
capital spillovers: Indonesia’s school construction and its effects on the next generation.
In AEA Papers and Proceedings, volume 109, pages 243–49.
Olken, B. A. (2005). Revealed community equivalence scales. Journal of Public Eco-
nomics, 89(2-3):545–566.
Olken, B. A. (2007). Monitoring corruption: evidence from a field experiment in indone-
sia. Journal of political Economy, 115(2):200–249.
Pandey, P., Goyal, S., and Sundararaman, V. (2009). Community participation in public
schools: impact of information campaigns in three indian states. Education Economics,
17(3):355–375.
Pradhan, M., Suryadarma, D., Beatty, A., Wong, M., Gaduh, A., Alisjahbana, A., and
Artha, R. P. (2014). Improving educational quality through enhancing community
participation: Results from a randomized field experiment in indonesia. American
Economic Journal: Applied Economics, 6(2):105–26.
Ravallion, M. (2007). Evaluating anti-poverty programs. volume 4, pages 3787–3846.
Elsevier.
Ravallion, M. and Dearden, L. (1988). Social security in a” moral economy”: An empirical
analysis for java. The Review of Economics and Statistics, pages 36–44.
Ravallion, M., van de Walle, D., Dutta, P., and Murgai, R. (2013). Testing information
constraints on India’s largest antipoverty program. The World Bank.
Reinikka, R. and Svensson, J. (2004). Local capture: evidence from a central government
transfer program in uganda. The quarterly journal of economics, 119(2):679–705.
Rubin, D. B. (1974). Estimating causal effects of treatments in randomized and nonran-
domized studies. Journal of educational Psychology, 66(5):688.
Somanathan, A. (2008). Use of modern medical care for pregnancy and childbirth care:
does female schooling matter? The World Bank.
TNP2K (2015a). Indonesia’s Unified Database for Social Protection Programmes - Man-
23You can also read