Future renewable energy costs: solar-thermal electricity - Renewable Energies How technology innovation is anticipated to reduce the cost of ...
←
→
Page content transcription
If your browser does not render page correctly, please read the page content below
Renewable Energies

Future renewable energy
costs: solar-thermal electricity
How technology innovation is anticipated to reduce the cost
of energy from European solar-thermal electricity plants
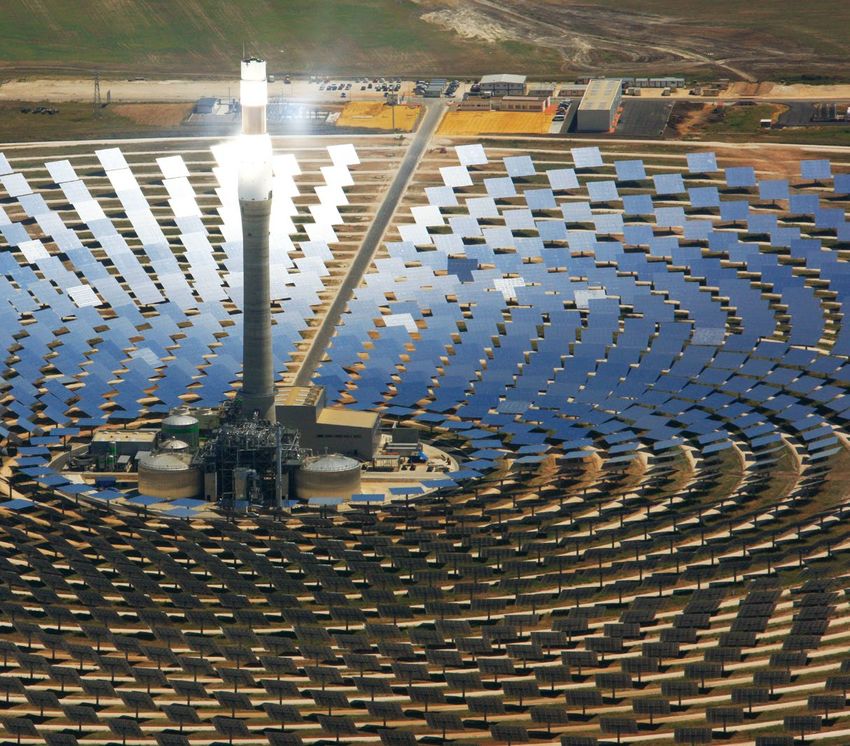
KIC InnoEnergy
KIC InnoEnergy is a European company dedicated to
promoting innovation, entrepreneurship and education
in the sustainable energy field by bringing together
academics, businesses and research institutes.
KIC InnoEnergy’s goal is to make a positive impact on
sustainable energy in Europe by creating future game
changers with a different mindset, and bringing innovative
products, services and successful companies to life.
KIC InnoEnergy is one of the first Knowledge and
Innovation Communities (KICs) fostered by the European
Institute of Innovation and Technology (EIT). It is a
commercial company with 28 shareholders that include
top-ranking industries, research centres and universities, all
of which are key players in the energy field. More than 150
additional partners contribute to the company’s activities
to form a first-class and dynamic network that is always
open to new entrants and furthers KIC InnoEnergy’s pursuit
of excellence. Although KIC InnoEnergy is profit-oriented,
it has a “not for dividend” financial strategy, reinvesting any
profits it generates back into its activities.
KIC InnoEnergy is headquartered in the Netherlands, and
develops its activities across a network of offices located in
Belgium, France, Germany, the Netherlands, Spain, Portugal,
Poland and Sweden.

Front cover image courtesy of Gemasolar
KIC InnoEnergy
Renewable Energies

Future renewable energy
costs: solar-thermal electricity
How technology innovation is anticipated to reduce the cost
of energy from European solar-thermal electricity plants

Leading authors / Coordination of the study
Eduardo Zarza Head of R+D Unit - Solar Concentrating Systems, PSA-Ciemat
Emilien Simonot Renewable Energies Technology Officer, KIC InnoEnergy
Antoni Martínez Renewable Energies CTO, KIC InnoEnergy
Thomas Winkler Intern from University of Leoben (Austria), KIC InnoEnergy
Contributing authors
Carlos-David Pérez-Segarra UPC
Luis Crespo Estela Solar
Marcelino Sanchez CENER
Robert Pitz-Paal DLR
05

 Foto: Abengoa Solar

                       Executive summary
                       KIC InnoEnergy is developing credible future technology cost models for four renewable
                       energy generation technologies using a consistent and robust methodology. The
                       purpose of these cost models is to enable the impact of innovations on the levelised
                       cost of energy (LCOE) to be explored and tracked in a consistent way across the four
                       technologies. While the priority is to help focus on key innovations, credibility comes
                       with a realistic overall LCOE trajectory. This report examines how technology innovation
                       is anticipated to reduce the LCOE from European solar-thermal electricity (STE) plants
                       over the next 12 to 15 years.
                       For this STE report, input data is closely based on the KIC InnoEnergy technology strategy
                       and roadmap work stream published in October 2014. The output of that work was an
                       exhaustive and comprehensive set of discrete innovations and groups of innovations
                       together with their potential impact on known reference plants, built on expert vision and
                       knowledge. For this report, the temporal scope of KIC InnoEnergy technology strategy
                       and roadmap, five years ahead, has been extended to 12 to 15 years according to the
                       methodology set up for this series of reports.
                       At the heart of this study is a cost model, developed for KIC InnoEnergy by BVG Associates,
                       in which elements of baseline STE plants are impacted on by a range of technology
                       innovations. These power plants are defined in terms of the applied technology type:
                       parabolic trough collector (PTC); central receiver (CR); and linear Fresnel reflector (LFR). Each
                       type is analysed at three points in time at which the projects reach the final investment
                       decision (FID): 2014 [the baseline]; 2020; and 2025). In this study, the plants’ lifetimes are
                       set to 25 years for the purpose of LCOE calculation. These plants are representative of the
                       European market.
                       The combined impact that technology innovations over the period are anticipated
                       to have on projects with different combinations of Technology Types is presented in
                       Figure 0.1.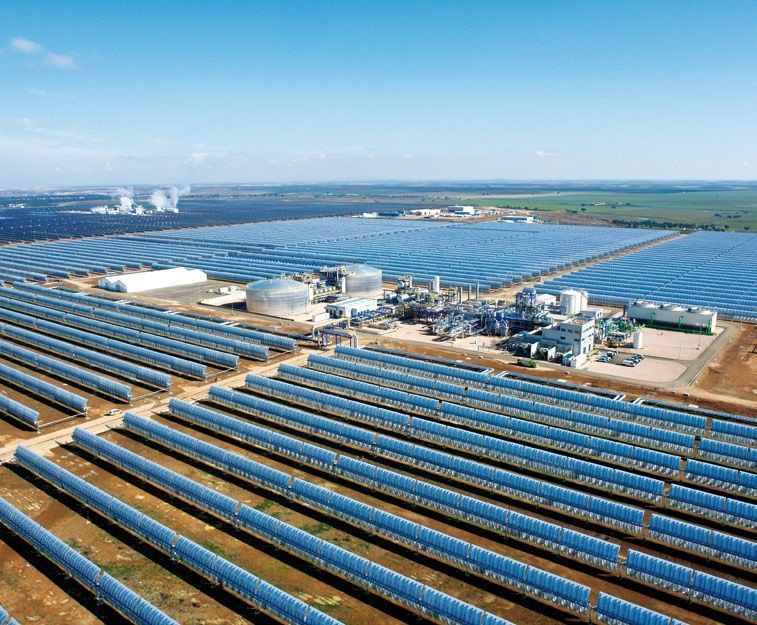
Future renewable energy costs: solar-thermal electricity   06

  Figure 0.1 Anticipated impact of all innovations by Technology Type FID in 2025, compared with an STE plant
  with the same capacity with FID in 2014. (Site type 2050DNI).
          Impact on CAPEX                 Impact on OPEX                           Impact on net AEP                          Impact on LCOE

    0%                           10%                                    20%                                             0%
   -5%                            0%                                    15%                                           -10%
  -10%                          -10%                                    10%                                           -20%
  -15%                          -20%                                     5%                                           -30%
  -20%                          -30%                                     0%                                           -40%
   Tech     PTC   CR   LFR       Tech     PTC   CR    LFR                Tech        PTC      CR     LFR               Tech    PTC   CR       LFR
                                                                                                                                      Source: KIC InnoEnergy

The study concludes that LCOE savings of at least 28.7% are anticipated for PTC technology,
with a capacity factor of 27.4%. Numerous innovations generate small improvements in
LCOE through changes in capital expenditure (CAPEX), operational expenditure (OPEX) and
annual energy production (AEP). The baseline parameter (fully detailed in Appendix A) for
this prediction is a 100MW plant situated in Spain, with a direct normal irradiation (DNI) of
2,050kWh/m2 per year and, for PTC and CR technology types, a storage of 1GWht in order to
operate the plant for an additional four hours at nominal power.
For CR technology, the anticipated impact is predicted to be an approximate 27.0% reduction
in LCOE. The capacity factor of the baseline CR plant is expected to be 26.3%. Other baseline
parameters remain the same as applied to PTC technology.
For LFR technology, LCOE is expected to lower by 23.6%, comparing current projects to
those with FID in 2025. The estimated capacity factor of 18.8% for LFR plants is significantly
lower than for other Technology Types. Also, the reference plant for this technology is
assumed to operate without thermal storage. Other baseline parameters stay the same. The
potential of LFR technology is to be seen in the lower investment costs compared to other
Technology Types. However, the efficiency of LFR plants is currently lower than competing
Technology Types (as shown by the capacity factor) and higher operations, maintenance
and service (OMS) costs per kWhe generated are a challenge to overcome.
For all the Technology Types, the impacts from STE technology innovations (excluding
transmission, decommissioning, pre-FID risk, supply chain and finance effects) contribute an
anticipated reduction in the LCOE of at least 23.6%. Figure 0.2 shows that well over half of the
total anticipated technology impact is achieved through seven innovations. The largest potential
is expected to rest on the improvement of component manufacturing, excluding supply
chain effects such as volume and competition. As the market for modern STE technologies is
relatively young, competition is not very strong in this field and the potential optimisation of
production processes remains largely untapped. By analysing existing operational experience
and implementing innovative changes in production and assembly lines, a significant decrease
in capital expenditures is possible. It is also expected that pure supply chain effects, such as
economies of scale and competition, will emerge as a function of market growth, delivering an
additional reduction in LCOE.
07    KIC InnoEnergy · Renewable Energies

Figure 0.2a Anticipated impact of technology innovations for an STE plant using PTCs with FID in 2025,
compared with an STE plant with FID in 2014.
                                                                                              70%   75%   80%   85%   90%      95%           100%
                          LCOE for an STE plant with PTC technology and FID in 2014
Improved and cheaper manufacturing methods and automated production of components
                                               Advanced high-temperature working fluids
                                                       Improved solar concentrator design
                                                               High-temperature receivers
                                                Tools for onsite checks of solar equipment
  Efficient plant monitoring and control with continuous onsite checks of solar equipment
                                                    Software development at system level
                                                                      14 other innovations
                          LCOE for an STE plant with PTC technology and FID in 2025
                                                                                                                            Source: KIC InnoEnergy

Figure 0.2b Anticipated impact of technology innovations for an STE plant using a CR with FID in 2025,
compared with an STE plant with FID in 2014.
                                                                                              70%   75%   80%   85%   90%      95%           100%
                               LCOE for an STE plant with CR technology FID in 2014
Improved and cheaper manufacturing methods and automated production of components
                                                        Improved solar concentrator design
                                                    Software development at system level
  Efficient plant monitoring and control with continuous onsite checks of solar equipment
                                                 Tools for onsite checks of solar equipment
                                                         Design and coating of CR receivers
                                                Software development at component level
                                                                       17 other innovations
                               LCOE for an STE plant with CR technology FID in 2025
                                                                                                                            Source: KIC InnoEnergy

Figure 0.2c Anticipated impact of technology innovations for an STE plant using LFR with FID in 2025,
compared with an STE plant with FID in 2014.
                                                                                              70%   75%   80%   85%   90%      95%           100%
                          LCOE for an STE plant with LFR technology and FID in 2014
Improved and cheaper manufacturing methods and automated production of components
                                                Tools for onsite checks of solar equipment
  Efficient plant monitoring and control with continuous onsite checks of solar equipment
                                               Advanced high-temperature working fluids
                                                               High-temperature receivers
                                                    Software development at system level
                                                                    Advanced power cycles
                                                                      12 other innovations
                          LCOE for an STE plant with LFR technology and FID in 2025
                                                                                                                            Source: KIC InnoEnergy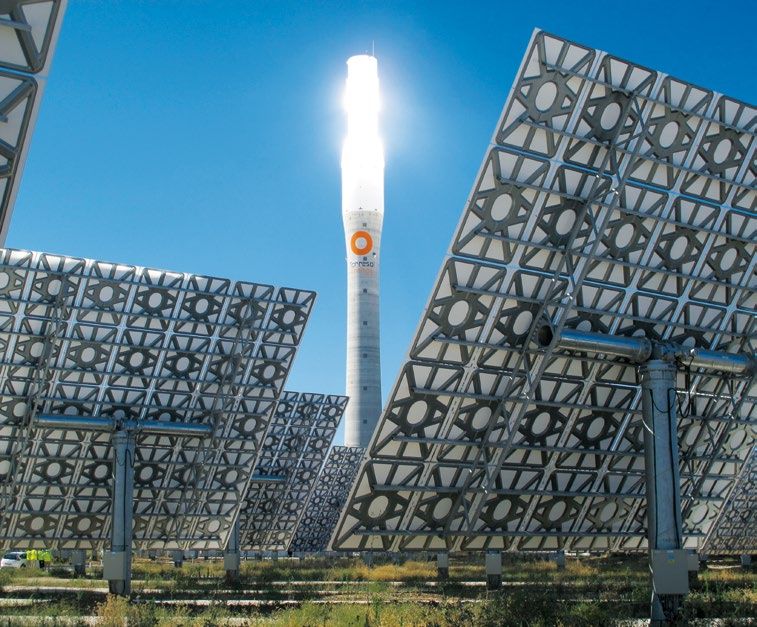
Future renewable energy costs: solar-thermal electricity   08

Between 19 and 24 technology innovations for each Technology Type were identified as
having the potential to cause a substantive reduction in LCOE through a change in the
design of hardware, software or process. Technology innovations are distinguished from
supply chain innovations, which are addressed separately. Many more technical innovations
are in development, so some of those described in this report may be superseded by others.
Overall, however, industry expectation is that the LCOE will reduce by the aggregate level
described. In most cases, the anticipated impact of each innovation has been significantly
moderated downwards in order to give overall LCOE reductions in line with industry
expectations. The availability of this range of innovations with the potential to impact LCOE
further gives confidence that the picture described is achievable.
To calculate a realistic LCOE for each scenario, real-world effects of supply chain dynamics,
pre-FID risks, cost of finance, transmission and decommissioning are considered in addition
to technology innovations.
In plant development, the innovations are mainly based on the implementation and
improvement of software, either on a component level or on a plant level. In this sector, the
reduction in LCOE is predicted to be at least 4.6%. The dominant improvements relate to
well-validated and verified software models that support the engineering process.
Innovations around concentrators and receivers result in an anticipated impact of at least
7.1% LCOE reduction. A significant share of the cost reduction – up to 4.5% – is contributed
by the improvement of the solar concentrator design. Other innovations enable moves
towards high-temperature receivers and better efficiency of both the receiver as well as the
concentrators. Sometimes sites with a high direct normal irradiance (DNI) also have harsh
environmental conditions (e.g., sand storms, great differences between daily maximum and
minimum temperatures), making durability of key components crucial if such sites are to be
exploited effectively.
Improvements in heat transfer fluids (HTFs) and storage solutions result in an expected
LCOE reduction varying from 2.3% for CR to 5.6% for PTC. The use of new and improved
working fluids along with the cost reduction of storage systems towards more competitive
price levels is the main driver for optimisation in this section. The introduction of direct
steam generation (DSG) in once-through operation mode is expected to play an important
role for LFR (with an anticipated 3.1% reduction in LCOE).
The cumulative impact of the innovations in balance of plant (BoP) varies from 1.4% to
over 2%, however, this result is controversial. Some innovations result in an increase in the
LCOE (which is not modelled here), which derives from the implementation of efficient
dry-cooling systems. This is tolerated as these systems lower the water consumption and
make STE possible in areas with high DNI but where water is a scarce resource. Other
innovations refer to the adoption of new thermodynamic cycles and the improvement of
thermodynamic efficiency for currently used cycles.
The anticipated impact of innovation in the field of construction is at least 8.5%. The
majority of LCOE reduction within this section, around 4%, is provided by improvements
in the manufacturing process, excluding supply chain effects such as competition and
economies of scale. Further cost reductions arise from improvements to, and optimisation
of, the commissioning process.
09   KIC InnoEnergy · Renewable Energies

     In OMS, software development has strong potential to lower LCOE. An efficient plant
     monitoring concept makes up half of the 3.1% of overall anticipated reductions. Another
     large impact is expected to come from the development of models and methodologies to
     predict long-term behaviour of key components and degradation in extreme environments.
     Cost-efficient sun-tracking as well as effective cleaning systems are assumed to have a
     moderate effect in this area. Innovations in this section deliver LCOE reduction by lowering
     OPEX for the plant and raising AEP, while CAPEX stays almost the same.
     Overall, reductions in CAPEX per megawatt installed over the period are anticipated to be
     between 8% (LFR) and 15% (PTC). OMS costs are anticipated to reduce by 5% (LFR) to 12%
     (CR). The biggest anticipated reduction of LCOE is caused by an increase in AEP in the range
     of 20% (CR and PTC) and 22% (LFR).
     Although CAPEX, OPEX and AEP are unique to each Technology Type, the overall LCOE
     reductions modelled are similar. PTC has shown to present the greatest potential for
     innovations in the future; however, as CR plants already achieved lower LCOE in 2014, CR
     is predicted to be cheaper in 2025 as well. LFR technology has a lower CAPEX than PTC
     currently; however, its lower efficiency leads to a higher LCOE. LCOE reduction for LFR is not
     expected to become higher than the other Technology Types within the next 10 years, but
     it has the potential to become a competitive alternative to PTC through efficiency increases.
     There is a range of innovations not discussed in detail in this report because either their
     anticipated impact is still negligible on projects reaching FID in 2025 or their evaluation
     is difficult because no reference plant exists. Among these are new process concepts,
     such as the coupling to solar desalination plants, which are especially interesting for arid
     regions with high DNI. Thermochemical reactions within an absorber of a CR plant also offer
     potential for the development of concentrated solar power. It would therefore be possible
     to directly produce solar fuels such as hydrogen with a significantly lower carbon footprint
     than is currently possible via natural gas reformation. The unrealised potential of innovations
     modelled in the project at FID in 2025, coupled with this further range of innovations not
     modelled, suggests there are significant further cost reduction opportunities when looking
     to 2030 and beyond.
10

Glossary
AEP. Annual energy production.
Anticipated impact. Term used in this report to quantify the anticipated market impact of a
given innovation. This figure has been derived by moderating the potential impact through
applying various real-world factors. For details of methodology, see section 2.
Balance of plant (BoP). Support structure and array electrical, see Appendix A.
Baseline. Term used in this report to refer to “today’s” technology, as would be incorporated
into a project.
Capacity factor (CF). Ratio of annual energy production to annual energy production if the
plant is generating continuously at rated power.
CAPEX. Capital expenditure.
CR. Central receiver.
CSP. Concentrated solar power.
DECEX. Decommissioning expenditure.
DNI. Direct normal irradiation.
DSG. Direct steam generation.
FEED. Front end engineering and design.
FID. Final investment decision, defined here as that point of a project life cycle at which
all consents, agreements and contracts that are required in order to commence a project
construction have been signed (or are at or near execution form) and there is a firm
commitment by equity holders and, in the case of debt finance or debt funders, to provide or
mobilise funding to cover the majority of construction costs.
Generic WACC. Weighted average cost of capital applied to generate LCOE-based
comparisons of technical innovations across scenarios. Different from Scenario-specific WACC.
GWHt. Thermal gigawatt hour.
HTF. Heat transfer fluid.
kWhe. Kilowatt hour electrical.
LCOE. Levelised Cost of Energy, considered here as pre-tax and real in mid-2014 terms. For
details of methodology, see section 2.
LFR. Linear Fresnel reflector.
MW. Megawatt.
MWh. Megawatt hour.
OMS. Operations, planned maintenance and unplanned (proactive or reactive) service in
response to a fault.
OPEX. Operational expenditure.
Other effects. Effects beyond those of power plant innovations, such as supply chain
competition and changes in financing costs.
Potential impact. Term used in this report to quantify the maximum potential technical
impact of a given innovation. This impact is then moderated through application of various
real-world factors. For details of methodology, see section 2.
PTC. Parabolic trough collector.
RD&D. Research, development and demonstration.
Scenario. A specific combination of technology type and year of FID.
Scenario-specific WACC. Weighted average cost of capital associated with a specific scenario.
Used to calculate real-world LCOE incorporating other effects, ref. section 2.4.
STE. Solar-thermal electricity.
Technology Type. Term used in this report to describe a concept that could be implemented
in order to realise an STE project. For details of methodology see section 2.
TES. Thermal energy storage.
WACC. Weighted average cost of capital, considered here as real and pre-tax.
WCD. Works completion date.
11   KIC InnoEnergy · Renewable Energies

			Table of contents
			 Executive summary                                                     05
			Glossary                                                               10
		          1. Introduction                                               13
		          2. Methodology                                                15
		          3. Baseline solar-thermal electricity plants                  21
		          4. Innovations in STE plant development                       25
		          5. Innovations in concentrators and receivers                 29
		          6. Innovations in the HTF and TES                             37
		          7. Innovations in BoP                                         43
		          8. Innovations in construction                                49
		          9. Innovations in plant operations, maintenance and service   55
		         10. Summary of the impact of innovations                       63
		         11. Conclusions                                                67
		         12. About KIC InnoEnergy                                       70
			Appendix A                                                             72
			 Appendix B                                                            77
			 List of figures                                                       82
			 List of tables                                                        84
Future renewable energy costs: solar-thermal electricity 12
13

 Foto: ACS Cobra

                   1. Introduction
                   1.1. Framework
                   As an innovation promoter, KIC InnoEnergy is interested in evaluating the impact of visible
                   innovations on the cost of energy from various renewable energy technologies. This analysis is
                   critical in understanding where the biggest opportunities and challenges are from a technology
                   point of view.
                   In publishing a set of consistent analyses of various technologies, KIC InnoEnergy seeks to help
                   in the understanding and definition of innovation pathways that industries could follow to
                   maintain the competitiveness of the European renewable energy sector worldwide. In addition,
                   it seeks to help solve the existing challenges at the European level: reducing energy dependency;
                   mitigating climate change effects; and facilitating the smooth evolution of the generation mix
                   for the final consumers.
                   With a temporal horizon out to 2025, this work includes a range of innovations that might
                   be further from the market than normally expected from KIC InnoEnergy. This constitutes a
                   longer term approach, complementary to the KIC InnoEnergy technology mapping focusing on
                   innovations reaching the market in the short to mid-term (up to five years ahead).

                   1.2. Purpose and background
                   The purpose of this report is to document the anticipated future solar thermal electricity
                   cost of energy to projects reaching their financial investment decision (FID) in 2025, by
                   reference to robust modelling of the impact of a range of technical innovations and other
                   effects. This work is based on KIC InnoEnergy technology strategy and roadmap work
                   stream published in October 2014. This work involved significant industry experts, as
                   detailed in the above report, and this has been augmented by taking into consideration
                   the existing literature in the field, including the ESTELA Strategic Research Agenda1

                   1 http://www.estelasolar.eu/fileadmin/ESTELAdocs/documents/Publications/ESTELA-Strategic_Reseach_Agenda_2020-2025_
                     Jan2013_Full_HD.pdf
Future renewable energy costs: solar-thermal electricity 14 and ERKC Thematic Research Summary2, as well as continued dialogue with players across industry, right up until publication of this report. The study does not consider the market share of the different technology types considered. The actual average levelised cost of energy (LCOE) in a given year will depend on the mix of such parameters for projects reaching FID in that year. 1.3. Structure of this report Following this introduction, this report is structured as follows: Section 2 Methodology. This section describes the scope of the model, project terminology and assumptions, the process of technology innovation modelling, industry engagement and the treatment of risk and health and safety. Section 3 Baseline STE plants. This section summarises the parameters relating to the three baseline STE plants for which results are presented. Assumptions relating to these STE technologies are presented in Section 2. The following six sections consider each element of the STE plant in turn, exploring the impact of innovations in that element. Section 4 Innovations in STE plant development. This section incorporates the STE plant design, consenting, contracting, land rent and developer’s project management activities through to the works completion date (WCD). Section 5 Innovations in concentrators and receivers. This section incorporates the reflectors, heliostats, receiver and receiver tubes as well as the piping within the solar field itself. Section 6 Innovations in the heat transfer fluid and thermal energy storage. This section incorporates the heat transfer fluid (HTF) and piping used to transfer the heat from the receiver (tube) to the non-solar equipment and the thermal energy storage (TES). Section 7 Innovations in balance of plant. This section incorporates the components of the power cycle: the pre-heater / steam generator / super-heater (not for direct steam generation [DSG]); the turbine; the condenser/cooler; the generator; and the elements needed for power control. Section 8 Innovations in construction. This section incorporates the innovations that may apply to the manufacturing of the components at the factory site (supply chain effects as volume is not considered here), the transportation of all elements and the construction processes on the designated plant site as well as the supportive actions during commissioning. Section 9 Innovations in operations, maintenance and service. This section incorporates all activities after the WCD until decommissioning. Section 10 Summary of the impact of innovations. This section presents the aggregate impact of all innovations, exploring the relative impact of innovations in different STE elements. Section 11 Conclusions. This section includes technology-related conclusions. Appendix A. Details of methodology. This appendix discusses project assumptions and provides examples of methodology use. Appendix B. Data tables. This appendix provides tables of data behind figures presented in the report. 2 http://setis.ec.europa.eu/energy-research/sites/default/files/docs/ERKC%20TRS%20Concentrating%20Solar%20Power_print.pdf
15                      KIC InnoEnergy · Renewable Energies

 Foto: Solana Abengoa

                        2. Methodology
                        2.1. Scope of model
                        The basis of the model is a set of baseline elements of capital expenditure (CAPEX), operational
                        expenditure (OPEX) and annual energy production (AEP) for a range of different representative
                        Technology Types with given direct normal irradiation (DNI), impacted on by a range of
                        technology innovations. Analysis is carried out at a number of points in time (years of FID), thus
                        describing various potential pathways that the industry could follow, each with an associated
                        reduction of LCOE.

                        2.2. Project terminology and assumptions
                        2.2.1. Definitions
                        A detailed set of project assumptions were established in advance of modelling. These are
                        presented in Appendix A, covering technical and non-technical global considerations and STE-
                        specific parameters.
                        2.2.2. Terminology
                        For clarity, when referring to the impact of an innovation that lowers costs or the LCOE, terms
                        such as reduction or saving are used, and the changes are quantified as positive numbers. When
                        these reductions are represented graphically or in tables, reductions are expressed as negative
                        numbers as they are intuitively associated with downward trends.
                        Changes in percentages (for example, losses) are expressed as a relative change. For example, if
                        losses are decreased by 5% from a baseline of 10%, then the resultant losses are 9.5%.

                        2.3. Technology innovation modelling
                        The basis of the model is an assessment of the differing impact of technology innovations in
                        each of the STE elements on each of the baseline STE plants, as outlined in Figure 2.1. This
                        section describes the methodology, developed by BVG Associates, analysing each innovation in
                        detail. An example is given in Appendix A.
Future renewable energy costs: solar-thermal electricity 16
Figure 2.1 Process to derive impact of innovations on the LCOE.
Baseline parameters for given project
Anticipated technical impact of innovations for
Revised parameters for given STE plant
given Technology Type, and year of FID
Figure 2.2 Four-stage process of moderation applied to the maximum potential
technical impact of an innovation to derive anticipated impact on the LCOE.
Maximum technical potential impact of innovation
under best circumstances
Relevance to
Technical potential impact for a given
Technology Type
Technology Type
Technical potential impact for a given
Commercial readliness
Technology Type and year of FID
Anticipated technical impact
for a given Technology Type and Market share
year of FID
2.3.1. Maximum technical potential impact
Each innovation may impact a range of different costs or operational parameters, as listed in Table 2.1.
The maximum technical potential impact on each of these is recorded separately for the Technology
Type most suited to the given innovation. Where relevant and where possible, this maximum technical
impact considers timescales that may go well beyond the final year of FID considered in this study.
Frequently, the potential impact of an innovation can be realised in a number of ways, for example,
through reduced CAPEX or OPEX or increased AEP. The analysis uses the implementation
resulting in the largest reduction in the LCOE, which is a combination of CAPEX, OPEX and AEP.
Table 2.1 Information recorded for each innovation. (%)
Impact on cost of Impact on
• Project up to WCD • Balance of Plant (BoP) • Gross AEP
• Solar field • Operation and planned maintenance, and • Losses
• Receiver and heat transfer system • Resource and service
• Thermal storage system17 KIC InnoEnergy · Renewable Energies
2.3.2. Relevance to Technology Type
The maximum technical potential impact of an innovation compared with the baseline may not
be realised on every Technology Type. In some cases, an innovation may not be relevant to a
given Technology Type at all. For example, sensible heat storage concepts are unlikely to have an
impact on LFR plants, so the relevance of this innovation to LFR is set to 0%. In other cases, the
maximum technical potential may only be realised on some plant types, with a lower technical
potential realised on others. In this way, relevance indicators for a given Technology Type may be
between zero and 100% with, at least one Technology Type having 100% relevance.
This relevance is modelled by applying a factor specific to each Technology Type independently
for each innovation. The factor for a given Site Type and Turbine Size combination is applied
uniformly to each of the technical potential impacts derived above.
2.3.3. Commercial readiness
In some cases, the technical potential of a given innovation will not be fully realised even on a
project reaching FID in 2025. This may be for a number of reasons:
• Long research, development and demonstration period for an innovation,
• The technical potential can only be realised through an ongoing evolution of the design based
on feedback from commercial-scale manufacture and operation, or
• The technical potential impact of one innovation is decreased by the subsequent introduction
of another innovation.
This commercial readiness is modelled by defining a factor for each innovation specific to
each year of FID, defining how much of the technical potential of the innovation is available to
projects reaching FID in that year. If the figure is 100%, this means that the full technical potential
is realised by the given year of FID.
The factor relates to how much of the technical potential is commercially ready for deployment
in a project of the scale defined in the baseline, taking into account not only the supplier offering
the innovation for sale but also the customer’s appetite for purchase. Reaching this point is likely
to have required full-scale demonstration. This moderation does not relate to the share of the
market that the innovation has taken but rather how much of the full benefit of the innovation
is available to the market.
2.3.4. Market share
Each innovation is assigned a market share for each Technology Type and year of FID. This is a
market share of an innovation for a given Technology Type for projects reaching FID in a given
year; it is not a market share of the innovation in the whole of the market that consists of a range
of projects with different Technology Types.
The resulting anticipated impact of a given innovation, as it takes into account the anticipated market
share on a given Technology Type in a given year of FID, can be combined with the anticipated
impact of all other innovations to give an overall anticipated impact for a given Technology Type and
year of FID. At this stage, the impact of a given innovation is still captured in terms of its anticipated
impact on each capital, operational and energy-related parameter, as listed in Table 2.1.
These impacts are then applied to the baseline costs and operational parameters to derive the
impact of each innovation on LCOE for each Technology Type and year of FID, using a generic
weighted average cost of capital (WACC).Future renewable energy costs: solar-thermal electricity 18 The aggregate impact of all innovations on each operational and energy-related parameter in Table 2.1 is also derived, enabling a technology-only LCOE to be derived for each Technology Type and FID year combination. 2.4. Treatment of other effects To derive a real-world LCOE, this technology-only LCOE is factored to account for the impact of various other effects, defined for each combination of Technology Type and year of FID as follows: • Scenario-specific WACC, taking into account risk (or contingency) • Transmission fees, covering transmission capital and operating costs and charges related to the infrastructure from input to substation to the transmission network • Supply chain dynamics, simplifying the impact of the supply chain levers such as competition and collaboration • Insurance and contingency costs, both relating to construction and operation insurance and typical spend of construction phase contingency • The risk that some projects are terminated prior to FID, thereby inflating the equivalent cost of work carried out in this phase on a project that is constructed. For example, if only one in three projects reaches FID, then the effective contribution to the cost of energy of work carried out on projects prior to FID is modelled as three times the actual cost for the project that is successful, and • Decommissioning costs, as described in Appendix A. A factor for each of these effects was obtained from the KIC InnoEnergy technology strategy and roadmap work stream published in October 2014 and the consultation to experts lead afterwards. The factors are applied as follows: • Scenario-specific WACC is used in place of the generic WACC to calculate a revised LCOE, and • Each factor is applied in turn to this LCOE to derive the real-world WACC, that is, a 5% effect to account for transmission costs (the first factor in Table A.4) is applied as a factor of 1.05. These factors are kept separate from the impact of technology innovations in order to clearly identify the impact of innovations, but they are needed in order to be able to compare LCOE for different scenarios rationally. The effects of changes in construction time are not modelled. 2.5. Treatment of health, safety and environmental impacts As solar-thermal electricity (STE) is similar to the power block of conventional power plants (steam or gas turbine), the issues related to the health and safety of operation personnel are well known and the measures to be taken are well defined. It is important, however, to recognise that the large collector fields will be different from the usual electricity plants. The health and safety of operational staff is of primary importance to the STE industry. This study incorporates into the cost of innovations any mitigation required in order to at least preserve existing levels of health and safety. Many of the innovations that are considered to reduce the LCOE over time have an intrinsic benefit to health and safety performance, for example the increased reliability of equipment and hence less time working in the solar field.
19   KIC InnoEnergy · Renewable Energies

     Another important issue for power plants using STE will be their environmental impact. Topics
     for the minimisation of the environmental impact that are considered in this report are:
     • Implementation of dry-cooling systems at higher costs in order to save water,
     • Improvement of cleaning methods for lower water consumption in the operation of an STE plant,
     • Innovations related to efficiency improvements in order to lower the demand for land for solar
       collectors, and
     • Substitution of biologically hazardous thermal oil with alternative HTFs.

         Specificity of the methodology: differences between anticipated
         and potential impacts of innovation

        This report presents the evolution of the economic parameters of different STE plants
        from the present day to 2025 and how a number of technology innovations are expected
        to impact upon them, including the increase or decrease of CAPEX, OPEX, the energy
        generated and an overall reduction in the LCOE from those plants over time.
        The methodology developed for the study presented in this report goes beyond the
        traditional cost-benefit and technical analysis commonly used for such works and seeks to
        explore and track the impact of such innovations in a wider context, taking into consideration
        their different levels of development. This recognises that effects will be evident at different
        times and accepted by the market at different stages due to their progressive incorporation.
        Those specific points could well explain why the results presented here may differ from
        other reference studies. This broader scope is of special interest for KIC InnoEnergy as it
        highlights the close relationship needed between technology development and innovation
        and market acceptance.
        It is important to note that this study’s time horizon is 2025. Therefore, many of the listed
        innovations will not have reached their full potential impact by that date. This, together
        with the effect of a range of innovations not discussed in detail in this report (because their
        anticipated impact is still negligible in the next 10 years), means that further relevant cost
        reductions can be expected in the long term.
Future renewable energy costs: solar-thermal electricity 20
21

 Foto: ACS Cobra

                   3. Baseline solar-thermal
                   electricity plants
                   The modelling process described in Section 2 will:
                   • Define a set of STE plants and derive costs and energy-related parameters for each,
                   • For each of a range of innovations, derive the anticipated impact on these same parameters for
                     each baseline STE plant for a given year of FID, and
                   • Combine the impact of a range of innovations to derive costs and energy-related parameters
                     for each of the baseline STE plants for each year of FID.
                   This section summarises the costs and other parameters for the baseline STE plants. The baselines
                   were developed from the analysis undertaken to deliver the KIC InnoEnergy technology strategy
                   and roadmap report, based on the technical parameters of the baseline STE power plants (see
                   Appendix A).
                   It is recognised that there is significant variability in costs between projects due to the limited
                   track record of the technology itself and supply chain and technology effects, even within the
                   portfolio of a given developer.
                   The baseline costs presented in Table 3.1, Figure 3.1 and Figure 3.2 are values obtained from cost
                   data currently available from recent projects or commercial bids and are for projects reaching
                   FID in 2014.
                   As such, they incorporate real-life supply chain effects such as the impact of competition. All
                   results presented in this report incorporate the impact of technology innovations only, except
                   for when the LCOE are presented in Figure 3.3 and in Section 10.3, which also incorporate the
                   other effects discussed in Section 2.4.
                   As there are already commercial STE plants in operation with a unit power higher than 100MW
                   and there are also plants of less than 100MW, the assumption of a power plant with 100MW
                   seems reasonable. “Commercially available” means that it is technically possible to build such
Future renewable energy costs: solar-thermal electricity 22
STE plants and that they have been sufficiently prototyped and demonstrated so they have a
reasonable prospect of sale into a project. Baseline STE plants considered for this study have
been defined, taking into consideration the state-of-the-art of the three technologies analysed.
Some parameters have been assumed in order to allow the analysis of some innovations. For
example, a working temperature of 500 º C has been assumed when analysing the impact of
receivers and working fluids for parabolic trough collectors (PTC) with higher temperature,
while a 650 º C working temperature has been assumed for central receiver (CR) plants.
Table 3.1 Baseline parameters.
Type Parameter Units PTC-2050DNI-14 CR-2050DNI-14 LFR-2050DNI-14
CAPEX Project up to WCD €k/MW 687 651 534
Solar field €k/MW 1,755 1,360 1,000
Receiver and heat transfer system €k/MW 450 638 225
Thermal storage system €k/MW 450 200 -
BoP €k/MW 750 750 938
OPEX Operation and planned maintenance €k/MW/yr 56 52 49
Resources and service €k/MW/yr 15 12 11
AEP Gross AEP MWh/yr/MW 2,727 2,614 1,875
Losses % 12.0 12.0 12.0
Net AEP MWh/yr/MW 2,400 2,300 1,650
Net capacity factor % 27.4 26.3 18.8
Source: KIC InnoEnergy
Figure 3.1 Baseline CAPEX by element.
Note: Receiver data points are partially overlapped by thermal storage system data points
(for values see Appendix B. Data supporting tables).
€k/MW PTC-2050DNI-14 CR-2050DNI-14 LFR-2050DNI-14
2,000
1,500
1,000
500
0
•Project up to WCD •Solar field •Receiver & heat transfer system •Thermal storage system •BoP
Source: KIC InnoEnergy23 KIC InnoEnergy · Renewable Energies
Figure 3.2 Baseline OPEX and net capacity factor.
The timing profile of CAPEX and OPEX spend, which is important in deriving the LCOE,
is presented in Appendix A.
€k/MW/yr PTC-2050DNI-14 CR-2050DNI-14 LFR-2050DNI-14
80
60
40
20
0
Source: KIC InnoEnergy
• Operation and planned maintenance • Resources and service •
Net capacity factor
These baseline parameters are used to derive the LCOE for the three baseline Technology Types.
A comparison of the relative LCOE for each of the baseline STE plants is presented in Figure 3.3.
At this time, CR provides the lowest LCOE of the three Technology Types. PTC may have the best
capacity factor, but it also has the highest investment costs. LFR plants are the cheapest in terms
of CAPEX, but their significantly lower power output raises the LCOE above the level of PTC and
CR technology.
Figure 3.3 Relative LCOE and net capacity factor for baseline STE plants with
other effects incorporated. Ref. Section 2.4.
% PTC-2050DNI-14 CR-2050DNI-14 LFR-2050DNI-14
100
80
60
40
20
0
Source: KIC InnoEnergy
• LCOE as % of PTC-2050DNI-14 • Net capacity factorFuture renewable energy costs: solar-thermal electricity 24
25

                           Foto: Solana Abengoa

                                                  4. Innovations in STE
                                                  plant development
                                                  4.1. Overview
                                                  Innovations in STE plant development are anticipated to reduce the LCOE by around 5% between
                                                  FID 2014 and 2025, with the largest savings anticipated for CR power plants. The savings are
                                                  dominated by improvements in AEP but also include a slightly lower CAPEX.
                                                  Figure 4.1 shows that all Technology Types achieve approximately the same advantage from
                                                  this area of innovation. With significant savings on CAPEX for the solar field and better overall
                                                  efficiency, it is possible to cut LCOE by at least 4.6%.

Figure 4.1 Anticipated impact of STE plant development innovations by Technology Type with FID in 2025,
compared with a plant with the same nominal power with FID in 2014. (Site type 2050DNI).
       Impact on CAPEX                                     Impact on OPEX                  Impact on net AEP                Impact on LCOE

 0%                                                 0%                               8%                               0%
-2%                                                -2%                               6%                              -2%
-4%                                                -4%                               4%                              -4%
-6%                                                -6%                               2%                              -6%
-8%                                                -8%                               0%                              -8%
Tech    PTC   CR    LFR                            Tech    PTC    CR   LFR          Tech     PTC   CR   LFR          Tech     PTC   CR       LFR
                                                                                                                                     Source: KIC InnoEnergy
Future renewable energy costs: solar-thermal electricity 26
Figure 4.2 to Figure 4.4 and Table 4.1 to Table 4.3 show that the individual innovation with the
largest anticipated impact by FID 2025 is software development on the system level. Software
implementation for both component design and plant optimisation offers potential for cost
reduction: however, the verification and validation of these software tools will be necessary in
order to achieve the set goals.
4.1.1. Parabolic trough collector
Figure 4.2 Anticipated and potential impact of STE plant development innovations for a PTC plant of 100MW with FID
in 2025, compared with a plant with the same nominal power on the same Site Type with FID in 2014.
Software development at component level
Software development at system level
Impact on LCOE 0% 2% 4% 6% 8% 10%
• Anticipated impact FID 2025 • Maximum technical potential impact Source: KIC InnoEnergy
Table 4.1 Anticipated and potential impact of STE plant development innovations for a PTC plant of 100MW with
FID in 2025, compared with a plant with the same nominal power on the same Site Type with FID in 2014.
Innovation Maximum Technical Potential Impact Anticipated impact FID 2025
CAPEX OPEX AEP LCOE CAPEX OPEX AEP LCOE
Software development at component level 3.8% 0.0% 0.0% 3.2% 2.1% 0.0% 0.0% 1.8%
Software development at system level 0.0% 1.3% 5.1% 5.1% 0.0% 0.7% 2.9% 2.9%
Source: KIC InnoEnergy
4.1.2. Central receiver
Figure 4.3 Anticipated and potential impact of STE plant development innovations for a CR plant of 100MW with FID in
2025, compared with a plant with the same nominal power on the same Site Type with FID in 2014.
Software development at component level
Software development at system level
Impact on LCOE 0% 2% 4% 6% 8% 10%
• Anticipated impact FID 2025 • Maximum technical potential impact Source: KIC InnoEnergy27 KIC InnoEnergy · Renewable Energies
Table 4.2 Anticipated and potential impact of STE plant development innovations for a CR plant of 100MW with
FID in 2025, compared with a plant with the same nominal power on the same Site Type with FID in 2014.
Innovation Maximum Technical Potential Impact Anticipated impact FID 2025
CAPEX OPEX AEP LCOE CAPEX OPEX AEP LCOE
Software development at component level 3.8% 0.0% 0.0% 3.2% 2.1% 0.0% 0.0% 1.8%
Software development at system level 0.0% 1.7% 8.5% 8.1% 0.0% 0.7% 3.6% 3.6%
Source: KIC InnoEnergy
4.1.3. Linear Fresnel reflector
Figure 4.4 Anticipated and potential impact of STE plant development innovations for an LFR plant of 100MW with FID
in 2025, compared with a plant with the same nominal power on the same Site Type with FID in 2014.
Software development at component level
Software development at system level
Impact on LCOE 0% 2% 4% 6% 8% 10%
• Anticipated impact FID 2025 • Maximum technical potential impact Source: KIC InnoEnergy
Table 4.3 Anticipated and potential impact of STE plant development innovations for an LFR plant of 100MW
with FID in 2025, compared with a plant with the same nominal power on the same Site Type with FID in 2014.
Innovation Maximum Technical Potential Impact Anticipated impact FID 2025
CAPEX OPEX AEP LCOE CAPEX OPEX AEP LCOE
Software development at component level 3.8% 0.0% 0.1% 3.1% 2.1% 0.0% 0.1% 1.8%
Software development at system level 0.0% 1.3% 5.1% 5.1% 0.0% 0.7% 2.9% 2.9%
Source: KIC InnoEnergy
4.2. Innovations
Innovations in STE plant development span a range of technical modelling and optimisation
improvements. A subset of the more important of these has been modelled here.
Software development at the component level
Practice today: Presently, the design of components for STE plants is supported by the use of
modelling and simulation. Since many projects are still being researched, many components
have their own models, which are not yet optimised.
Innovation: To improve the future design of components (for example, CRs, heliostat fields,
TES systems, dry-cooling condensers and others), their dynamic behaviour must be accuratelyFuture renewable energy costs: solar-thermal electricity 28 modelled. In particular, transient processes resulting in operation outside of the nominal design envelope must be included in these models in order to achieve improved plant performance. Relevance: The innovation is equally relevant for all Technology Types. Commercial readiness: About half of the benefit of this innovation will be available for projects with FID in 2020, rising to about 80% for projects with FID in 2025. For a single plant with FID 2025, the expected impact of this innovation is expected to bring a 2.6% reduction in LCOE for PTC and CR technologies and 2.5% for LFR technology. Market share: Market share is anticipated to be about a half of projects with FID in 2020. This is anticipated to rise to 70% for projects with FID in 2025. Software development at the system level Practice today: Although many commercial projects using STE have been implemented, there are still opportunities to improve the software development for such systems. The complex processes involved render efforts to find a good model for the behaviour of an STE plant. Innovation: Ongoing software development campaigns will deliver improved algorithms utilising all relevant data sources to provide verified and validated models of plant behaviour. These models will allow developers and operators to optimise both the configuration of the plant and operation processes against the lifetime performance of the plant. Furthermore, probabilistic methods could be used not only to calculate deterministic values but also to track their stability when input variables change. This is anticipated to result in decreases in OPEX and losses and an associated increase in AEP. Relevance: The innovation is equally relevant for all Technology Types. Commercial readiness: For PTC and LFR, about half of the benefit of this innovation will be available for projects with FID in 2020, rising to about 80% for projects with FID in 2025. For CR technology, the commercial readiness is anticipated to be 30% for projects with FID in 2020 and 60% for projects with FID in 2025. For a single plant with FID 2025, the expected impact of this innovation is expected to bring a 5% reduction in LCOE for all technologies. Market share: Market share is anticipated to be about a half of projects with FID in 2020. This is anticipated to rise to 70% for projects with FID in 2025.
29

                           Foto: Gemasolar

                                             5. Innovations in
                                             concentrators and receivers
                                             5.1. Overview
                                             Innovations in the area of concentrators and receivers are anticipated to reduce the LCOE by
                                             between 6% and 10% between FID 2014 and 2025. The savings are dominated by improvements
                                             in AEP, but significant savings are also evident within OPEX.
                                             Figure 5.1 shows that the impact on LCOE is greatest for a CR power plant. This is because some of
                                             the significant innovations in this area are anticipated to be applied only to this Technology Type.
                                             Furthermore, it is evident that the reduction is potentially higher for CR power plants once the
                                             technology is fully commercially available. One should also recognise that some of the innovations
                                             are applicable to all the Technology Types while others apply specifically to one type of STE plant.

Figure 5.1 Anticipated impact of STE plant development innovations by Technology Type with FID in 2025,
compared with a plant with the same nominal power with FID in 2014. (Site type 2050DNI).
       Impact on CAPEX                                 Impact on OPEX                  Impact on net AEP                  Impact on LCOE

 0%                                            0%                                8%                                0%
-2%                                           -2%                                6%                               -3%
-4%                                           -4%                                4%                               -6%
-6%                                           -6%                                2%                               -9%
-8%                                           -8%                                0%                              -12%
Tech    PTC   CR    LFR                       Tech     PTC   CR    LFR          Tech     PTC   CR    LFR          Tech     PTC     CR        LFR
                                                                                                                                 Source: KIC InnoEnergy
Future renewable energy costs: solar-thermal electricity 30
Table 5.2 to Figure 5.4 and Table 5.1 to Table 5.3 show that the innovation anticipated to have
the biggest impact is the improvement of the design of solar concentrators including cheaper
materials and increased efficiency. For LFR plants, the impact of this innovation is only surpassed
in terms of impact on LCOE by the utilisation of high-temperature receivers.
5.1.1. Parabolic trough collector
Figure 5.2 Anticipated and potential impact of concentrator and receiver innovations for a PTC plant of 100MW with
FID in 2025, compared with a plant with the same nominal power on the same Site Type with FID in 2014.
Better reflecting mirrors
Improved solar concentrator design
Advanced coatings for PTC and LFR receivers
Improved durability of key components
High-temperature receivers
Impact on LCOE 0% 2% 4% 6% 8% 10% 12% 14% 16%
• Anticipated impact FID 2025 • Maximum technical potential impact Source: KIC InnoEnergy
Table 5.1 Anticipated and potential impact of concentrator and receiver innovations for a PTC plant of 100MW
with FID in 2025, compared with a plant with the same nominal power on the same Site Type with FID in 2014.
Innovation Maximum Technical Potential Impact Anticipated impact FID 2025
CAPEX OPEX AEP LCOE CAPEX OPEX AEP LCOE
Better reflecting mirrors 0.0% 0.0% 1.3% 1.2% 0.0% 0.0% 0.8% 0.8%
Improved solar concentrator design 6.2% 3.7% 0.0% 5.8% 4.0% 2.4% 0.0% 3.7%
Advanced coatings for PTC and LFR receivers 0.0% -0.4% 2.0% 1.9% 0.0% -0.2% 1.1% 1.1%
Improved durability of key components 0.0% 6.2% 0.1% 1.1% 0.0% 3.5% 0.0% 0.6%
High-temperature receivers 0.0% -0.8% 6.0% 5.6% 0.0% -0.5% 3.6% 3.4%
Source: KIC InnoEnergy31 KIC InnoEnergy · Renewable Energies
5.1.2. Central receiver
Figure 5.3 Anticipated and potential impact of concentrator and receiver innovations for a CR plant of 100MW with FID
in 2025, compared with a plant with the same nominal power on the same Site Type with FID in 2014.
Better reflecting mirrors
Improved solar concentrator design
Design and coating of CR receivers
Improved durability of key components
High-temperature receivers
New CR concepts and designs
New high-temperature CR materials
Impact on LCOE 0% 2% 4% 6% 8% 10% 12% 14% 16%
• Anticipated impact FID 2025 • Maximum technical potential impact Source: KIC InnoEnergy
Table 5.2 Anticipated and potential impact of concentrator and receiver innovations for a CR plant of 100MW
with FID in 2025, compared with a plant with the same nominal power on the same Site Type with FID in 2014.
Innovation Maximum Technical Potential Impact Anticipated impact FID 2025
CAPEX OPEX AEP LCOE CAPEX OPEX AEP LCOE
Better reflecting mirrors 0.0% 0.0% 2.2% 2.2% 0.0% 0.0% 0.9% 0.9%
Improved solar concentrator design 8.8% 6.6% 2.7% 10.8% 3.6% 2.7% 1.1% 4.5%
Design and coating of CR receivers -3.2% 0.0% 13.3% 9.4% -0.7% 0.0% 2.8% 2.2%
Improved durability of key components 0.0% 8.3% 0.1% 1.4% 0.0% 3.5% 0.0% 0.6%
High-temperature receivers -0.7% 0.0% 4.1% 3.4% -0.2% 0.0% 1.4% 1.2%
New CR concepts and designs 1.6% 2.8% 3.2% 4.8% 0.4% 0.8% 0.9% 1.4%
New high-temperature CR materials 0.3% 0.4% 2.1% 2.4% 0.0% 0.0% 0.1% 0.1%
Source: KIC InnoEnergyFuture renewable energy costs: solar-thermal electricity 32
5.1.3. Linear Fresnel reflector
Figure 5.4 Anticipated and potential impact of concentrator and receiver innovations for an LFR plant of 100MW with
FID in 2025, compared with a plant with the same nominal power on the same Site Type with FID in 2014.
Better reflecting mirrors
Improved solar concentrator design
Advanced coatings for PTC and LFR receivers
Improved durability of key components
High-temperature receivers
Impact on LCOE 0% 2% 4% 6% 8% 10% 12% 14% 16%
• Anticipated impact FID 2025 • Maximum technical potential impact Source: KIC InnoEnergy
Table 5.3 Anticipated and potential impact of concentrator and receiver innovations for an LFR plant of 100MW
with FID in 2025, compared with a plant with the same nominal power on the same Site Type with FID in 2014.
Innovation Maximum Technical Potential Impact Anticipated impact FID 2025
CAPEX OPEX AEP LCOE CAPEX OPEX AEP LCOE
Better reflecting mirrors 0.0% 0.0% 1.3% 1.3% 0.0% 0.0% 0.8% 0.8%
Improved solar concentrator design 2.3% 0.1% 0.0% 1.9% 1.5% 0.1% 0.0% 1.2%
Advanced coatings for PTC and LFR receivers 0.0% 0.0% 1.3% 1.3% 0.0% 0.0% 0.7% 0.7%
Improved durability of key components 0.0% 6.2% 0.1% 1.4% 0.0% 3.5% 0.1% 0.8%
High-temperature receivers -0.5% -1.8% 6.0% 4.9% -0.3% -1.1% 3.6% 3.0%
Source: KIC InnoEnergy
5.2. Innovations
Innovations in concentrators and receivers are primarily focused on maximising the collected
energy and the temperature that can be achieved. A subset of the more important of these has
been modelled here.
Mirrors with higher reflectivity
Practice today: STE technologies all rely on reflecting DNI towards a certain spot or line in order
to get a higher spectral flux density. For this reason, all commercial STE plants need large areas
of reflecting material to concentrate the solar irradiation.
Innovation: Development of mirror technology incorporating new or improved coating
materials (for example, glass) with higher transmittance, improving the reflectivity of the mirror
material itself, or producing new mirror designs for an STE plant will reduce losses. These
improvements will result in higher AEP.33 KIC InnoEnergy · Renewable Energies
Relevance: The innovation is equally relevant to all Technology Types.
Commercial readiness: For both PTC and LFR, it is assumed that 50% and 80% of the potential
of this innovation is commercially available for projects with FID in 2020 and 2025 respectively.
Heliostats for CR plants will be able to use only 30% of the benefit of this innovation for projects
with FID in 2020 and 50% in 2025.
For a single plant with FID 2025, the expected impact of this innovation is expected to bring a
1% reduction in LCOE for all technologies.
Market share: Market share is anticipated to be 50% for PTC and LFR, and 60% for CR, projects
with FID in 2020. For projects with FID in 2025, the market share for all Technology Types is
anticipated to be 80%.
Improved solar concentrators design
Practice today: The design of solar concentrators is based mainly on a steel construction with
a concrete foundation. The mirrors used in PTCs have a certain shape to focus the solar radiation
at a focal line where the receiver tube is located. LFR concentrators are composed of a set of
parallel rows of almost flat mirrors set at angles to direct radiation towards the overhanging
receiver tube. CR technology uses a field of individual heliostats to obtain the necessary flux
density.
Innovation: For PTC systems, research projects are analysing the use of lightweight materials
and larger units with the potential to reduce the total specific investment cost (i.e., €/m2),
including material, manufacturing, transport and installation costs. The potential in improving
CR plants lies in both advanced heliostat field layouts and new heliostat designs with lower
specific cost (i.e., €/m2). Implementing a two-stage concentration could bring some advantages
for LFR technology (e.g., a better intercept factor and lower thermal losses at the receiver). The
benefits of this innovation mainly affect the CAPEX related to the solar field and, to a lesser
extent, the planned maintenance.
Relevance: The innovation is equally relevant to all Technology Types.
Commercial readiness: For both PTC and LFR, 50% and 80% of the potential of this innovation
is predicted to be commercially available for projects with FID in 2020 and 2025 respectively. The
commercial readiness for CR technology is assumed to be only 20% for projects with FID in 2020
and 45% in 2025.
For a single plant with FID 2025, the expected impact of this innovation is expected to bring a
4.6% reduction in LCOE for PTC technology, 5% for CR and 1.5% for LFR.
Market share: It is anticipated that half of projects using PTC and LFR with FID in 2020 will use
this innovation, rising to 80% for projects with FID in 2025. For CR plants, the market share is
anticipated to be 60% for projects reaching FID in 2020 and 90% in 2025.
Advanced selective coatings for PTC and LFR receivers
Practice today: Selective coatings reduce the heat transfer losses caused by radiation from the
receiver tube. Incoming “short” wave lengths (approximately 0.3-1.5µm) can be absorbed by the
receiver tube while, at longer wave lengths (2µm and higher), the reflectivity of the coating rises
to high values therefore preventing the receiver tube from emitting too much heat radiation
because its emissivity is low. Emissivity values of 10% at 400 ºC are usual nowadays. Is spite of the
current high absorptivities (α>95%) and low emissivities (εYou can also read