FUTURE SCENARIOS FOR ENERGY SECURITY AND SUSTAINABLE DESALINATION IN JORDAN - DIVA
←
→
Page content transcription
If your browser does not render page correctly, please read the page content below
Future Scenarios for Energy
 Security and Sustainable
 Desalination in Jordan

 Miles Weinstein

 Master of Science Thesis
 KTH School of Industrial Engineering and Management
 Energy Technology TRITA-ITM-EX 2019:608
 Division of Energy Systems Analysis
 SE-100 44 STOCKHOLM
-2-
Master of Science Thesis TRITA-ITM-EX 2019:608

 Future Scenarios for Energy
 Security and Sustainable
 Desalination in Jordan

 Miles Weinstein

Approved Examiner Supervisor

 Francesco Fuso-Nerini Francesco Fuso-Nerini
 Commissioner Contact person

 milesw@kth.se

 -3-
Preface
This thesis has been carried out in accordance with the InnoEnergy MSc SELECT dual-degree program, a
collaboration between the Universitat Politècnica de Catalunya (UPC) in Barcelona and KTH Royal
Institute of Technology, Stockholm. The thesis project was performed in collaboration with KTH,
Division of Energy Systems Analysis (KTH-dESA) within the context of the FAO project “Implementing
the 2030 Agenda for Water Efficiency/Productivity and Water Sustainability in NENA Countries.” The
FAO project is operating in several countries in the NENA region, with nexus analyses being
implemented in Jordan and Morocco.

 -4-

Abstract
Jordan is one of the most water-scarce countries in the world and contains very limited reserves of
traditional energy resources. In fact, the country is classified as extremely water scarce according to FAO,
with a water availability of less than 100 m3 per person annually. Additionally, in 2017, 94% of total
primary energy resources were imported. In parallel, the Kingdom’s population has more than doubled
since 1997, due mainly to regional instability, putting a further strain on resources. Furthermore, climate
change will only exacerbate water scarcity issues in the coming years.
The objective of this thesis is to identify future scenarios for increased energy independence in Jordan and
to examine the effect of desalination on the associated increase in water consumption for power
generation. This intersection between water and energy resources is known as the Water-Energy nexus.
Nexus planning is a holistic strategy that aims to create synergies between sectors, whereas traditional
planning can in some cases put them at odds with each other (UNECE, 2015). The methodology is widely
used for regional- or national-scale intersectoral planning and serves as the underlying motivation for this
investigation.
A model of Jordan’s power system on the national level was built using the Open Source Energy
Modeling System (OSeMOSYS) with eight scenarios to 2050. OSeMOSYS uses linear programming for
cost optimization in long-term planning. The program seeks to minimize cost based on the given data and
constraints input by the modeler. Because the Jordanian Ministry of Energy and Mineral Resources
(MEMR), has set a target for 40% of all energy to be supplied by domestic resources by 2025, several
scenarios were created with varying domestic resource targets by that year. As a case study for
desalination, The Red Sea-Dead Sea Water Conveyance Project (RSDSP) was used. The RSDSP is a
massive desalination and hydropower project that, if constructed, will connect the Red Sea to the Dead
Sea.
The results of the scenarios have demonstrated that a 100% domestic power supply is, in fact, feasible by
2025. To achieve that, renewables, specifically wind and solar, will supply much of the added domestic
resource capacity. At the same time, combined cycle power plants will also remain an integral part of the
energy mix in order to provide dispatchable power production, as battery storage was found not to be cost
effective. Large scale desalination, in the context of the RSDSP, was shown to be net freshwater positive
in all scenarios. Thus, it is highly recommended that the project be constructed in order to provide a
sustainable and reliable water source for the region. Together, the results of this project provide pathways
for a sustainable and secure future for the energy and water sectors in Jordan.

 -5-
List of abbreviations
ATPS Aqaba Thermal Power Station
BAU Business As Usual
BCF Billion cubic feet
CCGT Combined cycle gas turbine
CEPP Combustion engine power plant
CLEWs Climate, land, energy, & water systems
CSP Concentrated Solar Power
EIA U.S. Energy Information Administration
EPA U.S. Environmental Protection Agency
FO Fuel oil
GHG Greenhouse gas
IRENA International Renewable Energy Agency
JOD Jordanian Dinar
 1 JOD = 1.41 USD
KTH Royal Institute of Technology, Sweden
LFG Landfill gas
LNG Liquefied natural gas
MCM Million cubic meters
MEMR Ministry of Energy and Mineral Resources, Jordan
MMCF Million cubic feet
MSW Municipal solid waste
MWI Ministry of Water and Irrigation, Jordan
NENA Near East and North Africa
NEPCO National Electric Power Company, Jordan
NG Natural gas
NPC National Petroleum Company, Jordan
PV Photovoltaics
RES Reference energy system
RSDSP Red Sea-Dead Sea Water Conveyance Project
SDGs Sustainable Development Goals
SEI Stockholm Environment Institute
SMR Small modular reactor
TPES Total Primary Energy Supply

 -6-

UN United Nations
WWTP Wastewater treatment plant

Units

 -7-

Table of Contents
Preface ............................................................................................................................................................................. 4
Abstract ........................................................................................................................................................................... 5
List of abbreviations ..................................................................................................................................................... 6
List of Figures ..............................................................................................................................................................10
List of Tables................................................................................................................................................................10
1 Introduction ........................................................................................................................................................11
 1.1 Background and context ..........................................................................................................................11
 1.2 The nexus approach..................................................................................................................................11
 1.3 Research question and objective.............................................................................................................11
2 Literature Review ...............................................................................................................................................13
 2.1 Introduction to Jordan .............................................................................................................................13
 Geography and water resources ....................................................................................................13
 Energy resources ..............................................................................................................................14
 Energy balance .................................................................................................................................16
 Electricity demand and consumption ...........................................................................................17
 National grid .....................................................................................................................................18
 2.2 Water-Energy Nexus ................................................................................................................................19
 2.3 Red Sea-Dead Sea Water Conveyance Project .....................................................................................21
3 Methodology .......................................................................................................................................................23
 3.1 OSeMOSYS ...............................................................................................................................................23
 3.2 The Reference Energy System ................................................................................................................24
 3.3 The Jordan model .....................................................................................................................................25
 Technologies & fuels .......................................................................................................................26
 Costing Data .....................................................................................................................................26
 Availability & capacity factors ........................................................................................................28
 Efficiencies ........................................................................................................................................29
 Demand .............................................................................................................................................30
 Domestic resource limits ................................................................................................................31
 Emissions ..........................................................................................................................................31
 Water accounting .............................................................................................................................32
 Storage ...............................................................................................................................................33
 Capital Investment Constraint .......................................................................................................33
 Assumptions .....................................................................................................................................34
 3.4 Sensitivity Analysis ....................................................................................................................................34
4 Results ..................................................................................................................................................................35
 4.1 BAU Scenarios...........................................................................................................................................35

 -8-
4.2 60% Domestic Scenarios .........................................................................................................................36
 4.3 90% Domestic Scenarios .........................................................................................................................37
 4.4 100% Domestic Scenarios .......................................................................................................................38
 4.5 Water consumption ..................................................................................................................................39
 4.6 Scenario comparison.................................................................................................................................39
 4.7 Sensitivity analysis results.........................................................................................................................40
5 Discussion ...........................................................................................................................................................42
6 Conclusion...........................................................................................................................................................45
 6.1 Future work................................................................................................................................................46
Bibliography .................................................................................................................................................................47
Appendix A ..................................................................................................................................................................51
 Cost data ..................................................................................................................................................................51
Appendix B: Complete Results .................................................................................................................................52
 Production by Technology....................................................................................................................................52
 Fuel Mix ...................................................................................................................................................................55
 Water consumption ................................................................................................................................................58

 -9-
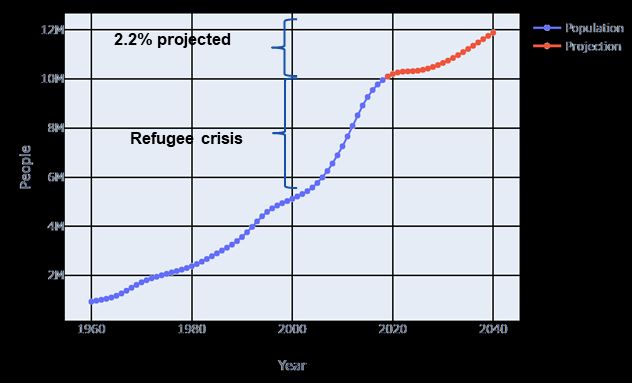
List of Figures
Figure 1: Past and future population growth in Jordan shows how the population has and will continue to
rapidly increase (Pastor Pascual, 2019) ....................................................................................................................13
Figure 2. Fuel mix in the power sector. The effects of instability in 2011 can be seen in the major shift by
2015. Source: Own elaboration based on data from (IEA, 2018). ......................................................................14
Figure 3: Global horizontal irradiance and average wind speed (World Bank, 2017), (MEMR, 2016) .........15
Figure 4: Primary energy and electricity generation by fuel ..................................................................................16
Figure 5: Monthly Morning, Evening, and Minimum loads in 2017 (CEGCO, 2018b) ..................................18
Figure 6: Jordanian interconnected grid (NEPCO, 2018) ....................................................................................19
Figure 7: Diagram of the proposed project (Sherwood, 2013) ............................................................................22
Figure 8: Modeling process flowchart ......................................................................................................................23
Figure 9: Reference energy system............................................................................................................................24
Figure 10: Capital costs over the model period. Note that Nuclear SMR is omitted because it is more than
2x costlier than any other technology ......................................................................................................................28
Figure 11: Demand profiles with and without the RSDSP ..................................................................................31
Figure 12: Electricity mix for BAU scenarios in 2025 ...........................................................................................35
Figure 13: Fuel mix for BAU scenarios in 2025 .....................................................................................................36
Figure 14: Electricity mix for 60% domestic scenarios in 2025 ...........................................................................36
Figure 15: Fuel mix for 60% scenarios in 2025 ......................................................................................................37
Figure 16: Electricity mix for 90% domestic scenarios in 2025...........................................................................37
Figure 17: Fuel mix for 90% domestic scenarios in 2025 .....................................................................................38
Figure 18: Electricity mix for 100% domestic scenarios in 2025 ........................................................................38
Figure 19: Fuel mix for 100% domestic scenarios in 2025 ...................................................................................39
Figure 20: Due to the sensitivity analysis, the model is able to meet demand during periods of little to no
renewable resource availability ..................................................................................................................................41
Figure 21: Annual new capacity additions in scenario 90A ..................................................................................42
Figure 22: Annual new capacity additions in scenario 100A ................................................................................43
Figure 23: Cumulative installed capacity over the model period for scenario 90A ..........................................43
Figure 24: Cumulative installed capacity over the model period for scenario 100A ........................................44
Figure 25: Annual Capital Investment in 100A ......................................................................................................44
Figure 26: Annual capital investment in scenario 100B ........................................................................................45

List of Tables
Table 1: Existing generating capacity .......................................................................................................................17
Table 2: Water consumption for power generation technologies from Macknick et al., 2012 .......................20
Table 3: Scenarios created ..........................................................................................................................................25
Table 4: Power generation technologies and fuels .................................................................................................26
Table 5: Fuels by origin ..............................................................................................................................................26
Table 6: Availability factors used ..............................................................................................................................28
Table 7: Capacity factors used (except solar) ..........................................................................................................29
Table 8: Solar capacity factors ...................................................................................................................................29
Table 9: Power generation efficiencies.....................................................................................................................30
Table 10: Water consumption values used ..............................................................................................................33
Table 11: Scenario comparison .................................................................................................................................40
Table 12: Cost data for 2019 .....................................................................................................................................51
Table 13: Fuel costs.....................................................................................................................................................51

 -10-
1 Introduction
1.1 Background and context
Jordan is often cited as the fourth most water-scarce country in the world and contains very limited
reserves of traditional energy resources. In fact, in recent years, fossil fuel imports equated to 20% of the
country’s GDP and 40% of the country’s budget was spent on energy (OECD Clean Energy Investment Policy
Review of Jordan, 2016). At the same time the population has almost doubled in the last two decades, due
mainly to refugee crises in the region, greatly increasing the strain on resources (The World Bank, 2019).
Furthermore, water scarcity will only be exacerbated by climate change in the coming years.
Despite such formidable challenges, solutions for a sustainable future are possible when a coordinated
effort between sectors is taken to address them. As such, this project incorporates a nexus approach to
planning that engages multiple interconnected sectors.

1.2 The nexus approach
Nexus assessment is a relatively new concept that promotes intersectoral coordination and integrated
planning for Climate, Land, Energy, and Water systems (CLEWs). The overarching idea behind the
strategy is that these systems are deeply interrelated and thus affect each other in a multitude of ways. As a
simple example, energy systems consume water for power plant cooling or resource extraction, and water
systems consume energy for pumping, wastewater treatment, and desalination. Climate change will
continue to affect all sectors by causing more extreme weather events at higher frequencies, reduced
precipitation, desertification, and increased erosion, among other effects. One study showed that holistic
consideration of the water-energy-food nexus would lead to a more optimal allocation of resources,
improved economic efficiency, lower environmental and health impacts, and improved economic
development conditions. Typically, however, governments are split sectorally with little to no intersectoral
coordination. Nexus planning aims to create synergies and avoid trade-offs between sectors in order to
promote sustainable development and policy goals (UNECE, 2015).
The concept first gained international recognition at the First Nexus Conference in Bonn, Germany in
2011 and has since been frequently used in projects around the world. A great example of the importance
of nexus analysis is demonstrated by the project in Mauritius by (Howells et al., 2013). At the time of the
study, Mauritius was planning to increase its biofuel production from local sugarcane in order to decrease
its GHG emissions and its reliance on imported oil. While well-intentioned, the policy was fatally flawed.
A nexus analysis showed that the increased need for irrigation water for the sugarcane, coupled with
decreasing rainfall due to climate change, would require greater levels of desalination. If this desalination
was powered by electricity from coal, as planned, the net GHG emissions would actually increase, along
with coal imports. Thus, the analysis demonstrated that biofuels were, in fact, not a sustainable option. In
the context of extreme water scarcity in Jordan, it is easy to see how a calculated, coordinated approach
must be taken to identify a sustainable strategy for the future.
Nexus assessment addresses several of the UN Sustainable Development Goals (SDGs), a group of 17
wide-ranging goals that were adopted by all UN Member States in 2015 as part of the 2030 Agenda for
Sustainable Development. The most directly related are SDGs 2, 6, 7, and 13, being respectively Zero
hunger, Clean water and sanitation, Clean and affordable energy, and Climate action. Most or all other
SDGs also can be affected by or play a role in nexus analyses; as an example, (Fuso Nerini et al., 2018)
found that 85% of targets within the SDGs have synergies or tradeoffs with SDG7 alone.

1.3 Research question and objective
In light of the aforementioned challenges facing Jordan, this project aims primarily to develop and analyze
potential future scenarios for the country to increase its incorporation of endogenous resources into the
electricity mix. A country-level focus was taken during the analysis in keeping with the scope of the

 -11-
aforementioned FAO project which has provided the context for this thesis. Meanwhile, a nexus analysis
has been performed to examine the impacts of large-scale desalination and the associated increase in
energy and water consumption. The Red Sea-Dead Sea Water Conveyance Project (RSDSP), a proposed
desalination and hydropower production scheme, was taken as a case study for desalination scenarios.

 -12-
2 Literature Review
2.1 Introduction to Jordan
The Hashemite Kingdom of Jordan is a mostly landlocked country in the Middle East bordered by Syria,
Israel, Palestine, Saudi Arabia and Iraq. Jordan is an upper-middle income country with a high level of
human development, ranking 95th globally in Human Development Index with a score of 0.736. For
comparison, this level is similar to the Dominican Republic and Tunisia (UNDP, 2017; World Bank,
2019a). The population has increased tenfold since the 1960s and nearly doubled in the last two decades
to 10 million people, including 1.4 million refugees. Almost half of those are victims of the conflict in
Syria. The Syrian refugee crisis alone has reportedly increased water consumption by 22% (Randall, 2019;
UNHCR, 2019). Past growth and future projections are shown in Figure 1.

Figure 1: Past and future population growth in Jordan shows how the population has and will continue to rapidly increase (Pastor Pascual, 2019)

 Geography and water resources
At less than 100 m3/capita/year of renewable water resources, Jordan is significantly below the threshold
of absolute water scarcity (MWI, 2016; UN Water, n.d.). Almost all (10 out of 12) of Jordan’s groundwater
basins are over-abstracted, the remaining two being in sparsely populated desert regions (MWI, 2017a).
Surface water makes up less than 1% of the country’s total area. Jordan has just 26 km of coastline which
can be found in the south on the Red Sea, including the Port of Aqaba (CIA, 2019). Other surface water
bodies include the Jordan River, Yarmouk River, and Zarqa River, all in the northwest, as well as the Dead
Sea at the outlet of the Jordan River (FAO, 2008). In addition, there are numerous wadis, or seasonal rain-
fed rivers, throughout the country.
A remarkable 75% of Jordan’s land area is considered desert, and only 2% is arable (UNFPA Jordan, n.d.).
The majority of its rainfall occurs in the northwest highlands region, which receives over 500 mm
precipitation annually in some locations. Almost 90% of the country’s population is concentrated in this
region, which includes the capital, Amman (Belda González, 2018). The majority of the country’s
agricultural activity can be found there as well.

 -13-
Energy resources
In stark contrast to many surrounding Arab nations, Jordan has an extreme lack of conventional energy
resources. In 2017, 94% of total primary energy resources were imported, which, in fact, is a slight
improvement over previous years (MEMR, 2018a). As proven in recent years, this dependence on imports
poses a risk to security of supply and cost of energy. In 2011, during unrest in the region related to the
Arab Spring, a natural gas pipeline bringing gas to Jordan from Egypt was attacked in the Sinai Peninsula.
This incident cut off a major energy source for the country, as 80% of Jordan’s energy was received
through this pipeline in 2010 (OECD Clean Energy Investment Policy Review of Jordan, 2016). Subsequently,
much of the gas generation was supplemented with oil products, as shown in Figure 2 (IEA, 2018), a
costly endeavor for both the national budget and the environment. In 2012, the National Electric Power

Figure 2. Fuel mix in the power sector. The effects of instability in 2011 can be seen in the major shift by 2015. Source: Own elaboration based on data
from (IEA, 2018).

Company (NEPCO) subsidized 56% of the newly elevated electricity price, causing the company to suffer
a loss of over 2 billion JOD ($2.8 billion), equivalent to 5% of the Kingdom’s GDP in 2011 (OECD Clean
Energy Investment Policy Review of Jordan, 2016). Furthermore, it made apparent the immediate need for
energy security in a historically volatile region. As a medium-term solution, an LNG port was opened at
Aqaba resulting in a rapid increase in natural gas utilization, as is apparent in Figure 2. Due to these
circumstances, MEMR has set an ambitious goal to reach 40% of energy production from domestic
resources by 2025 as part of the Updated National Energy Strategy 2015-2025 (Dabbas, 2016).

2.1.2.1 Fossil and mineral resources
Traditional fossil fuel resources in Jordan are limited to one gas field (Risha) and one oil field (Hamza).
Risha Gas Field, located in the desert near the Iraqi border, has produced 221 BCF of gas since the
discovery of commercial reserves in 1987. The National Petroleum Company (NPC) has a concession for
the area until 2046 with a daily production of 9-10 MMCF (MEMR, n.d.). A new well was recently
discovered at Risha with an additional capacity of 7 MMCF per day, likely to be under commercial
production by NPC in 2020 (Jordan Times, 2019). Hamza Oil Field began production in 1985 and
produces 20,000-25,000 barrels of oil daily, equal to almost one quarter of the country’s oil demand
(Ghazal, 2014).
Additionally, the Kingdom contains one unconventional fossil fuel resource: oil shale. Oil shale is a
sedimentary rock containing both inorganic matter and organic kerogen and bitumen (Gharaibeh, 2017).
It can be directly combusted for power production or converted into shale oil via pyrolysis as a crude oil
replacement. MEMR reports 70 billion tons of proven reserves and 37 billion tons of indicated
commercial reserves of oil shale, the 6th largest reserves in the world (Alali et al., 2015; MEMR, 2019).
Plans to utilize this vast resource are already underway, with the Attarat oil shale direct combustion power
plant expected online in 2020. The environmental impacts of oil shale extraction and combustion can be
quite significant. Oil shale combustion is one of the most carbon intensive power generation methods.

 -14-
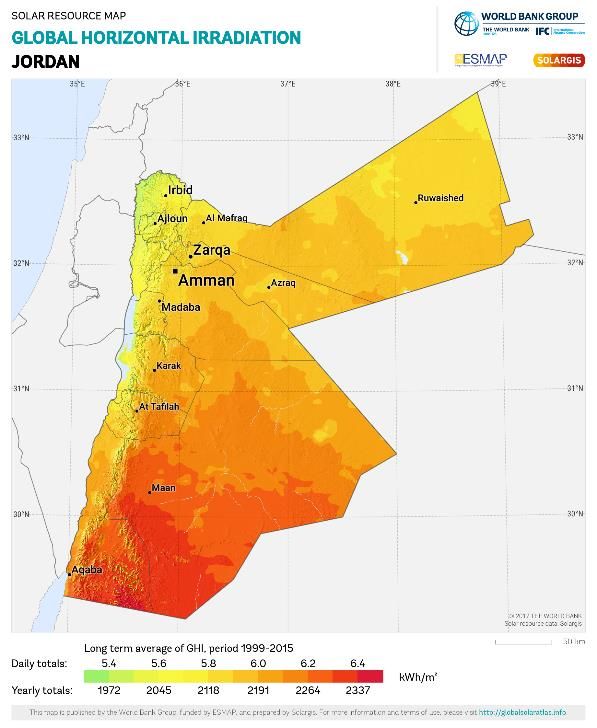
New advancements are likely to reduce GHG emissions from 60% higher than coal to about the same
level as coal; still a considerably high level of emissions for power production (EASAC, 2007). In the
experience of oil shale utilization in Estonia, heavy metals, including radioactive ones, were emitted into
the atmosphere or leached into the soil from fly ash dumps (Raukas and Punning, 2009). However, studies
in the Jordanian context have shown the levels of trace elements in leachate to be within the acceptable
limit of both Jordanian and U.S. EPA standards, and that groundwater contamination would be unlikely
under normal conditions (Gharaibeh, 2017).
Additionally, Jordan contains an estimated 70,000 tons of uranium (IAEA, 2018). Plans to build a nuclear
power station have been under consideration for several years, with the eventual outcome still uncertain.
Initial plans involved a large-scale, 1000-2000 MW generating station. However, more recent reports point
to the likelihood of building multiple small modular reactors of approximately 200 MW capacity (World
Nuclear Association, 2019).

2.1.2.2 Renewable resources
Jordan has abundant solar resources with an average global solar irradiation of 2.01 MWh/m2/year and
3311 annual sunshine hours (Hrayshat, 2009). Wind power potential is also significant with wind speeds
reaching 7.5 m/s in the north and west, sometimes up to 11.5 m/s in the highlands. The distribution of
these resources is shown in Figure 3. Hydropower resources in Jordan are quite limited due to the limited
water resource. The only dammed reservoir is King Talal Dam with an installed capacity of 6.4 MW.
Other hydropower resources currently in use include small turbines installed at Aqaba Thermal Power
Station and As-Samra Wastewater Treatment Plant (see section 2.1.3 for more details). A potential future
hydropower source is the proposed RSDSP, which could provide 400-800 MW hydropower capacity.
Biomass resources are mainly limited to agricultural waste, municipal solid waste (MSW), and sewage
sludge. Additionally, low to medium geothermal waters have been discovered along the Dead Sea Rift
valley (Rahim, 2015).

Figure 3: Global horizontal irradiance and average wind speed (World Bank, 2017), (MEMR, 2016)

 -15-
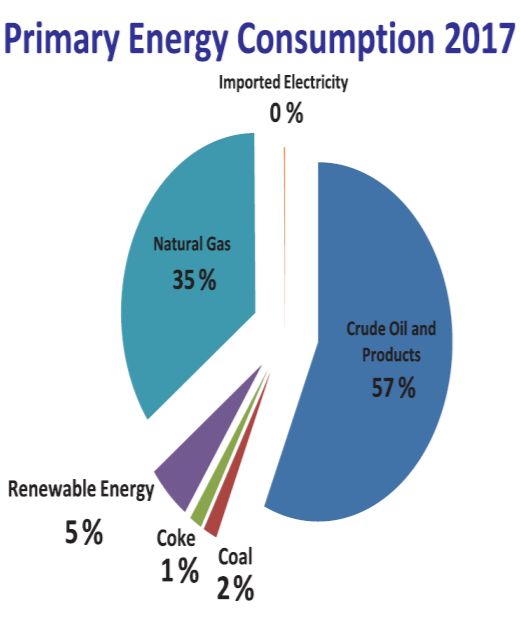
Energy balance
In 2017, the vast majority of Total Primary Energy Consumption was supplied by fossil fuels, specifically
oil and natural gas. Renewable energy made up only 5% of the mix (MEMR, 2018a). When considering
only electricity generation the renewable contribution rises to 7%, with 80% being covered by natural gas.
The primary energy consumption and electricity generation by fuel for 2017 are shown in Figure 4.

 Figure 4: Primary energy and electricity generation by fuel

The majority of the fossil fuel power plants are Combined Cycle Gast Turbine (CCGT) plants with natural
gas as the primary fuel and fuel oil as a backup or alternative fuel. Aqaba Thermal Power Station (ATPS),
on the other hand, is a steam power plant that can be fueled by natural gas, heavy fuel oil, or light fuel oil.
Originally constructed in 1985 with the ability only to run on heavy fuel oil, the plant underwent a fuel
switching project in 2007 (CDM, 2006; CEGCO, 2018a). A full list of current installed capacity can be
found in Table 1. The total installed generating capacity is estimated to be 5500 MW.
Currently there are 851 MW of PV and 283 MW of wind connected to the grid, with another 596 MW PV
and 334 MW wind under construction. Other renewable energy sources currently in use or under
development include hydropower and biomass. In addition to the previously mentioned King Talal Dam,
Aqaba Thermal Power Station has 6 MW hydropower turbines incorporated into its seawater cooling
system and As-Samra WWTP has 4.2 MW total and the inlet and outlet of the plant. Additionally, As-
Samra has a 9.5 MW biogas electric generator that utilizes biogas produced in-plant from sewage sludge.
Together these systems produce energy equal to almost 50% of Jordan’s WWTP demand, thus making
As-Samra a positive example for future WWTP development in the Kingdom. There are currently two
landfill gas (LFG) power plants at Al-Ghawabi and Rusaifeh landfills of approximately 5 MW and 3.5
MW, respectively. LFG is captured methane from landfills which can then be used in a gas turbine. Al-
Ghawabi is planned for expansion to 14 MW by 2027. Finally, the proposed RSDSP could produce 400-
800 MW hydropower while also providing up to 840 MCM desalinated freshwater to Jordan, Israel, and
Palestine. This project is described in detail in section 2.3. Concentrating solar power (CSP) has been
investigated in the Jordanian context but is not currently under development likely due to its higher cost
and lower level of maturity. In total, MEMR expects more than 2400 MW of grid-connected renewables
by 2021 to bring installed capacity to 30% renewable and production to 20% renewable (Belda González,
2018; Beyth, 2007; Marar, 2019).
An additional new project, and a major goal of MEMR, is the increasing incorporation of oil shale into the
energy mix. Attarat Power Plant is a 470 MW oil shale direct combustion power plant currently under
construction, with expected completion in 2020. In that year oil shale is intended to contribute 15% of the
energy mix according to the National Energy Strategy (MEMR, 2019).
The National Energy Strategy also aims for 5% coal contribution to Total Primary Energy by 2025.
Currently, only a 30 MW coal-fired power plant exists in the Kingdom and all coal must be imported
(NEPCO, 2018).

 -16-
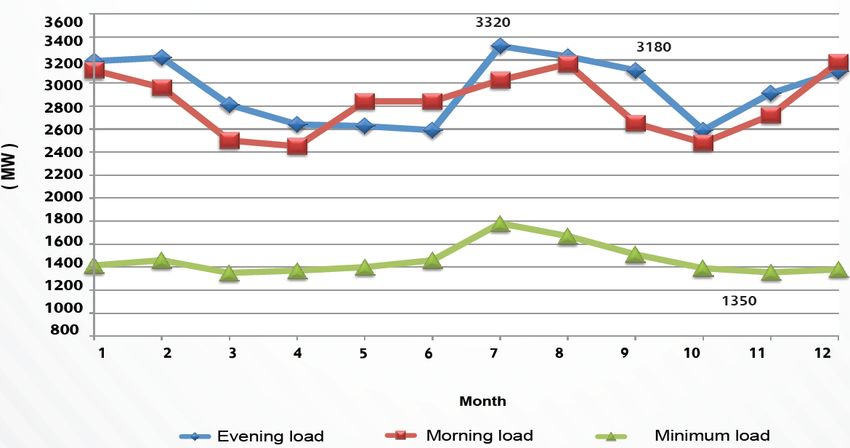
Table 1: Existing generating capacity

Name Type Nominal Capacity (MW) Fuel
Aqaba Thermal Power Station Steam 650 Natural gas (NG) & Heavy
 fuel oil (HFO)
Risha Gas Power Station OCGT (?) 60 NG & Diesel Oil
Rehab Gas Turbine Power CCGT 357 NG & Diesel Oil
Station
Samra Thermal Power Station CCGT 1175 NG
Amman East Power Plant (IPP1) CCGT 370 NG & distillate FO backup
Al Qatrana Power Plant (IPP2) CCGT 373 NG & distillate FO backup
Zarqa Power Plant CCGT 485 NG & distillate FO backup
IPP3 Tri-fuel Power Plant CEPP 573 NG, HFO, Light fuel oil
 (LFO)
IPP4 Al-Manakher CEPP 250 NG, HFO, LFO
Manaseer Cement Power Plant Steam 30 Coal & pet coke
Rusaifeh Landfill Gas SCGT 3.5 Landfill gas & biogas
Al-Ghabawi Landfill Gas SCGT 5 Landfill gas
As Samra Biogas Digestor Anaerobic 9.5 Biogas
 Digestor
As Samra Hydro Hydropower 4.2 Water
Aqaba Thermal PP Hydro Hydropower 6 Water
KTR Dam Hydropower 6.4 Water
Wind (cumulative) 283
PV (cumulative) 851

 Electricity demand and consumption
The all-time peak system load was 3320 MW in summer 2017, with average minimum daily loads around
1450 MW that year. According to the available load profiles, daily minimums usually occur in the early
morning hours and climb steadily until the peak around 4 to 5 in the afternoon, when Jordanians typically
leave work and begin cooking. It is notable, in consideration of solar power production, that the earliest
winter sunsets occur around 4:30 p.m., exactly during peak demand. Seasonal peaks occur in summer and
winter, whereas spring and autumn tend to have lower daytime demand. As an example, the monthly
maximum and minimum loads are displayed in Figure 5. Total primary energy demand increased on
average 5% annually between 2012-2017. Consumed electrical energy in Jordan was 17503.8 GWh in
2017, an increase of 4.8% over the previous year. In the same period, the per capita increase was only
1.7%, suggesting that a large part of the increased demand can be attributed to rapid population growth.
NEPCO expects an average annual growth rate of 3.7% in electrical loads and 4.3% in electricity
generated through 2040 (CEGCO, 2018b; NEPCO, 2018).

 -17-
Figure 5: Monthly Morning, Evening, and Minimum loads in 2017 (CEGCO, 2018b)

Electricity consumption by sector in 2017 was dominated by Domestic & government buildings (46%),
followed by Industry (22%), Agriculture & water pumping (15%), Commercial & hotels (14%), and Street
lighting (2%) (NEPCO, 2018).

 National grid
The reported grid capacity for the interconnected system is 5259 MW, a substantial increase over previous
years. Grid capacity has been a problem in Jordan in the past, with some renewable projects reportedly
being canceled in 2014 due to the grid’s inability to support them. The Green Corridor Project will
increase grid capacity to accommodate 1000 MW of new renewables in the south of the Kingdom for
transmission to population centers. This will bring the new total capacity for renewable penetration to
almost 1500 MW by the end of 2019 (GoJ, 2018; NEPCO, 2019; Rahim, 2015).
The electrical grid is interconnected with some neighboring grids, as seen in Figure 6. Jordan signed a
memorandum of understanding with Saudi Arabia to connect the countries’ grids, therefore connecting
Jordan to the wider Gulf Cooperation Council (GCC) Power Grid. Additional connections include Egypt
via the Red Sea town of Taba, export to a station on the Iraqi border, and future export to Palestine.
Additionally, there is a connection to Syria, but it has not operated in recent years due to the ongoing
conflict there (Nakayama et al., 2017; NEPCO, 2018).

 -18-
Figure 6: Jordanian interconnected grid (NEPCO, 2018)

2.2 Water-Energy Nexus
The water and energy sectors intersect with each other in numerous ways. Energy is required for water
pumping, wastewater treatment and desalination. In fact, water pumping in Jordan accounts for 15% of
the Kingdom’s total energy demand (MEMR, 2018b). Water is almost always required for power
production; especially in thermal power plants, which require cooling water. Additionally, water is used in
the extraction and processing of many fuels. Water consumption for power generation is highly dependent
on cooling method. For example, natural gas combined cycle with dry cooling consumes just 2 gal/MWh,
whereas with tower cooling it consumes 205 gal/MWh. Notably, solar PV and wind power are the only
technologies analyzed that consume little to no water. PVs require water only for cleaning of the modules
from dust or other particles, and wind turbines do not require any water for operation. CSP, on the other
hand, requires as much water as thermal power plants in some cases. Table 2 from (Macknick et al., 2012)
lists typical water consumption values of some power generation technologies.

 -19-
Table 2: Water consumption for power generation technologies from Macknick et al., 2012

Fuel type Cooling Technology Median water
 consumption factor
 [gal/MWh]

PV N/A Utility scale PV 1

Wind N/A Wind turbine 0

CSP Tower Trough 906

 Power tower 786

 Fresnel 1,000

 Dry Trough 78

 Power Tower 26

 Hybrid Trough 338

 Power Tower 170

 N/A Stirling 5

Biopower Tower Steam 553

 Biogas 235

 Once-trough Steam 300

 Pond Steam 390

 Dry Biogas 35

Geothermal Tower Flash 15

 Dry Flash 5

 Binary 270

 EGS 505

 Hybrid Binary 461

Hydropower N/A In-stream and reservoir 4,491*

Nuclear Tower Generic 672

 Once-through Generic 269

 Pond Generic 610

Natural gas Tower Combined cycle 205

 Steam 826

 -20-
Combined cycle with CCS 393

 Once-through Combined cycle 100

 Steam 240

 Pond Combined cycle 240

 Dry Combined cycle 2

Coal Tower Generic 687

 Subcritical 479

 Supercritical 493

 IGCC 380

 Subcritical with CCS 921

 Supercritical with CCS 846

 IGCC with CCS 549

 Once-through Generic 250

 Subcritical 113

 Supercritical 103

 Pond Generic 545

 Subcritical 779

 Supercritical 42

*Hydropower has a very large range of values, reaching up to 18,000 gal/MWh

2.3 Red Sea-Dead Sea Water Conveyance Project
The RSDSP is a proposed Jordanian-Israeli project to pump seawater from the Red Sea to the Dead Sea, a
distance of approximately 150 km. The Dead Sea is the lowest point on Earth; thus the net 400 m
elevation drop between the two locations will be taken advantage of to produce hydropower with an
installed capacity of 400-800 MW. A desalination plant along the way will produce up to 840 MCM for
Jordan, Israel, and Palestine with 570 MCM to Jordan, according to (Beyth, 2007). A diagram of the
project is shown in Figure 7. The National Water Strategy 2016-2025, meanwhile, predicts 85 MCM to
Jordan by 2021 and 235 MCM by 2025 (MWI, 2016). For context, the entire country consumes
approximately 900 MCM water annually (SEI, 2018).
Because the Dead Sea has much higher salinity than the oceans, the brine that is produced as a waste
product of desalination can be pumped into the Dead Sea in an attempt to restore water levels, which
have been dropping at an alarming rate in recent years. However, there are some ecological concerns with
the project. Such large-scale alteration of natural environments could have unforeseen consequences for
both seas. Furthermore, a brine spill from the pipeline could ruin local aquifers and agriculture in the case
of an earthquake or another unexpected event (Randall, 2019).

 -21-
The price tag of the project is at least $2 billion, to be split equally between Jordan and Israel (Ackerman,
2019). Aside from the primary benefits, the project is a positive example of international cooperation
between Israel and its neighbors and is intended to increase regional security.

Figure 7: Diagram of the proposed project (Sherwood, 2013)

 -22-
3 Methodology
A model of Jordan’s power system was created in order to develop scenarios for increased domestic
resource integration until 2050. Additionally, large-scale desalination was incorporated using the RSDSP as
a case study. A flow chart of the modeling process is seen in Figure 8. The subsequent text of this section
describes the process in detail.

Figure 8: Modeling process flowchart

3.1 OSeMOSYS
Because the intention of the model is to determine the most recommendable future strategy for Jordan,
modeling for this project was completed using the Open Source Energy Modeling System (OSeMOSYS)
due to its suitability for developing medium- to long-term models based on a set of current inputs.
Developed by a consortium of international organizations, including KTH Royal Institute of Technology,
OSeMOSYS is an open source software that uses linear programming for optimization in long-term

 -23-
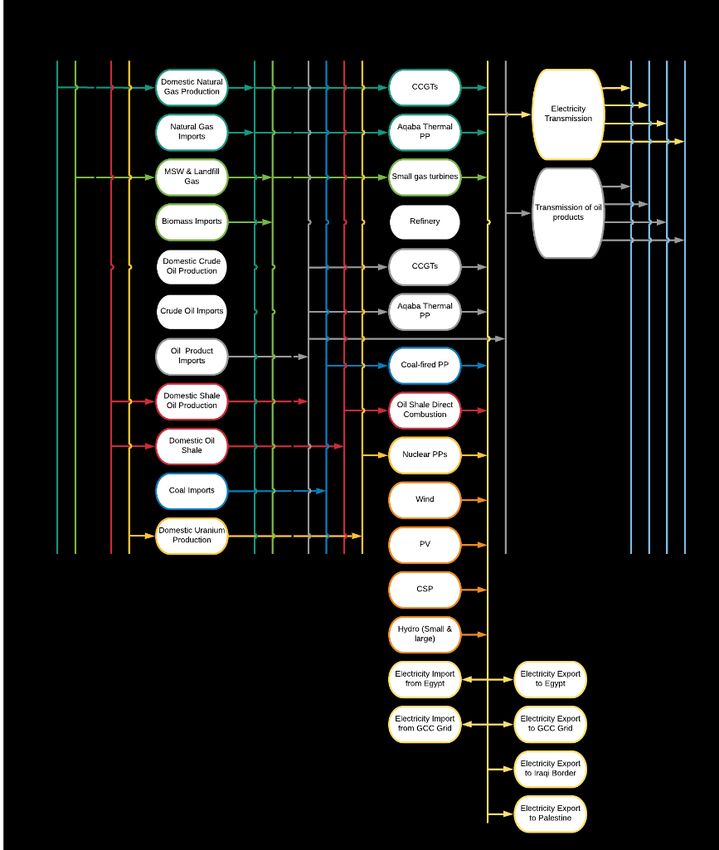
planning. The program seeks to minimize total cost over the entire model period based on the given data
and constraints input by the modeler (KTH-dESA, 2018).
The main inputs to the model include the following: capital, variable, and fixed costs, efficiency, capacity
and availability factors, demand profile, emissions, storage, and various constraints as applicable to the
specific modeling goals.

3.2 The Reference Energy System
The Reference Energy System (RES) is a tool used to visualize the region’s current and future energy
system before building a model in OSeMOSYS. Starting at the resources level, flows were tracked through
each step until the final energy demand. The RES for Jordan can be seen in Figure 9. While the
OSeMOSYS model only considered the power system, the RES also includes oil products for final use
outside the power sector. Additionally, the RES includes final demand divided by sector whereas in the
model, final demand was considered as a lump sum.

 Figure 9: Reference energy system

 -24-
3.3 The Jordan model
As previously mentioned, the OSeMOSYS model takes a country-level scope in keeping with the FAO
project that provides the context for this thesis. The primary objective of the model is to analyze scenarios
for Jordan to increase its domestic resource ratio. The Updated National Energy Strategy 2015-2025 states
the Kingdom’s objective to reach 40% of energy production from domestic resources by 2025 (Dabbas,
2016). The OSeMOSYS model, however, considers only the Kingdom’s electricity system as it has the
fewest barriers to rapid integration of domestic resources, such as renewables, and would therefore likely
be the first sector to experience these changes. According to the UNSD energy balance from 2016, only
21% of Jordan’s TPES is used for power generation (UN Statistics Division, 2018). Therefore, even a
100% domestic power supply will only satisfy about half of MEMR’s goal. It is in this context that the
model and subsequent analysis have been carried out. The secondary objective of the model is to provide
a Water-Energy nexus assessment of water consumption for electricity production and the effect of
desalination on both.

Eight scenarios have been developed: two Business-As-Usual (BAU), two constrained to a minimum 60%
domestic supply by 2025, two constrained to 90% domestic by 2025, and two constrained to 100%
domestic by 2025. The scenarios are constrained from the production side, meaning that 60%, 90%, or
100% of production must originate from domestic resources (see Section 3.3.7 for more details). Within
each of the previous four categories there is one desalination scenario in which the RSDSP is
implemented, and one no-desalination scenario. The scenarios are described in Table 3. While the target
year for the scenarios is 2025, the model period extends from 2019 to 2050 in order to provide further
useful insights in the medium to long term.

Table 3: Scenarios created

Scenario Name Domestic resource constraint Desalination

0A None (BAU) Yes, RSDSP implemented

0B None (BAU) No, RSDSP not implemented

60A 60% Yes, RSDSP implemented

60B 60% No, RSDSP not implemented

90A 90% Yes, RSDSP implemented

90B 90% No, RSDSP not implemented

100A 100% Yes, RSDSP implemented

100B 100% No, RSDSP not implemented

 -25-
Technologies & fuels
The technologies and corresponding fuels in Table 4 were used in the Jordan OSeMOSYS model.
Table 4: Power generation technologies and fuels

Power generation technology Input fuels Notes
Anaerobic digester Domestic biomass (sewage Such as in use at As-Samra WWTP
 sludge)
Coal-fired thermal power plant Coal imports
CSP N/A
Large-scale hydropower N/A
(RSDSP)
Small-scale hydropower N/A Such as in use at As-Samra WWTP
Combustion engine power NG & FO1
plants (CEPP)
CCGT NG & FO1
Aqaba Thermal Power Station NG & FO1
(ATPS)
Nuclear SMR Domestic uranium
Oil shale direct combustion Domestic oil shale
Utility-scale PV N/A
LFG turbines Domestic biomass (landfill gas)
Wind N/A
1 These fuels can be imported or domestic, within local production capacity

Table 5 shows fuels used in the model and whether they are domestic, imported, or potentially both.
Table 5: Fuels by origin

Fuel Biomass Coal Fuel oil Natural Oil shale Uranium
 gas
Imported/Domestic Domestic Import Both Both Domestic Domestic
 only only only only

For biomass, only MSW and sewage sludge are considered in the model. Other domestic biomass
resources in Jordan include livestock manure and agricultural residues. However, the potential biofuel
production from these sources is smaller due to higher difficulty in collecting the resource. Whereas
manure and agricultural residues are distributed over large areas with no infrastructure in place to gather it,
LFG and sewage sludge are already collected in landfills and WWTPs (Al-Hamamre et al., 2013). It should
also be noted that domestic fuel oil is produced from domestic crude and shale oil.

 Costing Data
Cost data specifically for Jordan was not always available, and thus the closest possible approximations
were made. Capital cost projections to 2050 for the following power generation technologies modeled

 -26-
were taken from the Commonwealth Scientific and Industrial Research Organisation (CSIRO) GenCost
2018 report: Coal, CSP, CCGT, ATPS, Nuclear SMR, PV, and Wind. For ATPS the coal power plant cost
was used due to lack of available information (Graham et al., 2018). Capital costs over the model period
are displayed in Figure 10. Note that Nuclear SMR is omitted from the chart because it is more than twice
as costly as any other technology. A full table of values used for initial (2019) costs can be found in
Appendix A, Cost data.
The present capital cost of anaerobic digestion was obtained from IRENA and projected to 2050 using
the trend obtained from CSIRO for biomass power plants (IRENA, 2014a). For large-scale hydropower
the expected cost of the RSDSP was used, thus simultaneously adding desalination cost. The cost of the
RSDSP is expected to be $2 billion over 25 years split evenly by Jordan and Israel. Thus, in the model only
the cost supported by Jordan was considered (Ackerman, 2019). The present cost of small hydropower
was taken from IRENA data for the Middle East (IRENA, 2014b). CEPP current costs were taken as the
average costs of Jordanian power plants IPP3 and IPP4 (AES Jordan, n.d.; Power Technology, n.d.). Oil
shale power plant cost was obtained from a report by the Jordan Times on the Attarat power plant
(Ghazal, 2017). Small hydropower, CEPP, and Oil shale power plants are considered mature technologies.
The Jordanian oil shale plant is being built by Enefit, an Estonian company, where the technology has
been mature for decades. Because costs of mature technologies are unlikely to decrease significantly, costs
were then extrapolated to 2050 with a consistent annual decrease of 0.16%, the same trend used by
CSIRO for natural gas combined cycle, another mature technology. LFG turbine cost was taken from the
actual cost of Al-Ghawabi LFG plant and extrapolated using the same trend as the anaerobic digester.
Fixed and variable cost data were taken from CSIRO for the same technologies as above as well as oil
shale, anaerobic digestion, and LFG. For the latter two, the biomass power plant costs were used. For oil
shale, coal power plant costs were used and for ATPS the gas peaker plant cost were used. For large and
small hydropower the costs were obtained from the IRENA Renewable Power Generation Costs in 2017
report (IRENA, 2018). No variable cost for small hydropower was reported so it was assumed to be 2%
higher than large. CEPP costs were taken from the EIA Cost and Performance Characteristics of New
Generating Technologies report (EIA, 2019a).
Fuel cost was incorporated as the variable cost of extraction and import technologies. For coal imports,
10-year averages of Australian and South African coal prices were used (World Bank, 2019b). For fuel oil
and domestic natural gas, the actual Jordanian price was found from (MEMR, 2018b). The report did not
specify whether this fuel oil was imported or domestic, and thus the value was used for both. Imported
natural gas prices were estimated from the 10-year average Henry Hub LNG price, the global market
indicator (EIA, 2019b). Oil shale price was estimated from (Jaber et al., 2004) and adjusted for inflation to
2019 USD (Bureau of Labor Statistics, n.d.). Uranium price was taken from (Ahmad, 2015). Jordanian oil
shale and uranium have not yet been commercially exploited, thus making any price a mere estimate.

 -27-
Power Generation Capital Cost
 5000

 4000

 3000
 $/kW

 2000

 1000

 0
 2019

 2034

 2047
 2020
 2021
 2022
 2023
 2024
 2025
 2026
 2027
 2028
 2029
 2030
 2031
 2032
 2033

 2035
 2036
 2037
 2038
 2039
 2040
 2041
 2042
 2043
 2044
 2045
 2046

 2048
 2049
 2050
 Coal CCGT PV CSP
 Wind RSDSP (Large hydro) Small Hydro ATPS
 Oil Shale LFG Anaerobic Digester ICE PPs

Figure 10: Capital costs over the model period. Note that Nuclear SMR is omitted because it is more than 2x costlier than any other technology

 Availability & capacity factors
Average availability factor for all existing Jordanian power plants for years 2016 and 2017 was taken from
(NEPCO, 2018). There was an approximate 0.5% annual increase from 2016-2017. Due to lack of further
historical data, the availability was assumed to increase by a steady 0.5% until reaching 100% in 2026. New
generating plants were given a default availability factor of 100%. Availability of transmission lines was
also found from (NEPCO, 2018). Input values are shown in Table 6.
Table 6: Availability factors used

 2019 2020 2021 2022 2023 2024 2025 2026 … 2050
Existing 0.9690 0.9739 0.9787 0.9836 0.9885 0.9935 0.9985 1 … 1
generating
plants
New 1 1 1 1 1 1 1 1 … 1
generating
plants
Transmission 0.9995 0.9995 0.9995 0.9995 0.9995 0.9995 0.9995 0.9995 … 0.9995
lines

Capacity factors used are reported in Table 7 and Table 8 for all time slices and years. Most values were
taken from the U.S. averages of years 2013-2018, as reported by the EIA.

 -28-
Table 7: Capacity factors used (except solar)

Technology Capacity factor Source
Anaerobic digester 0.696 (EIA, 2019c)
Coal 0.56 (EIA, 2019c)
Large & small 0.6 Estimated; because they originate from pumped sources, they
hydro will not vary seasonally
CEPP 0.516 Estimate based on intended operating strategy (Wartsila,
 2013)
CCGT 0.528 (EIA, 2019c)
ATPS 0.5 Estimated for base load power plant
Nuclear 0.918 (EIA, 2019c)
Oil shale 0.56 Assumed same as coal
LFG 0.696 (EIA, 2019c)
Wind 0.3515 (Bataineh and Dalalah, 2013)

For renewables it was important to use local capacity factor data, as OSeMOSYS does not take weather
data as an input. The wind capacity factor was calculated as the average from several sites in Jordan at
varying heights and different turbine models. This average is 0.3515. Subsequently, the sensitivity analysis
described Section 3.4 was performed, giving a capacity factor of 0.058 during autumn days and nights of
years 2021, 2026, 2031, 2036, 2040, 2041, & 2045.
CSP capacity factor was estimated from a value for the Jordanian context (Al-Soud and Hrayshat, 2009)
and PV from a value for the NENA region in general (Griffiths, 2013). The capacity factors were
estimated seasonally based on the ratios of average sunshine duration: spring and autumn show average
sunlight while summer has three hours more and winter has three hours less.
Table 8: Solar capacity factors

 Autumn Autumn Spring Spring Summer Summer Winter Winter
 Days Nights Days Nights Days Nights Days Nights
CSP 0.53 0 0.53 0 0.6019 0 0.4681 0
PV 0.4 0 0.4 0 0.45 0 0.35 0

 Efficiencies
The efficiencies listed in Table 9, below, were used to calculate the Input Activity Ratio in OSeMOSYS.
The values are static over the model period. The Input Activity Ratio values used in OSeMOSYS are
merely the inverse of the values presented here.

 -29-
You can also read