Peroxy radical partitioning during the AMMA radical intercomparison exercise
←
→
Page content transcription
If your browser does not render page correctly, please read the page content below
Atmos. Chem. Phys., 10, 10621–10638, 2010
www.atmos-chem-phys.net/10/10621/2010/                                                                    Atmospheric
doi:10.5194/acp-10-10621-2010                                                                               Chemistry
© Author(s) 2010. CC Attribution 3.0 License.                                                             and Physics

Peroxy radical partitioning during the AMMA radical
intercomparison exercise
M. D. Andrés-Hernández1 , D. Stone2,3 , D. M. Brookes4 , R. Commane2,* , C. E. Reeves5 , H. Huntrieser6 , D. E. Heard2,7 ,
P. S. Monks4 , J. P. Burrows1 , H. Schlager6 , D. Kartal1 , M. J. Evans3 , C. F. A. Floquet2 , T. Ingham2,7 , J. Methven8 , and
A. E. Parker4
1 Institute of Environmental Physics, University of Bremen, Bremen, Germany
2 School  of Chemistry, University of Leeds, Leeds, UK
3 School of Earth and Environment, University of Leeds, Leeds, UK
4 Department of Chemistry, University of Leicester, Leicester, UK
5 School of Environmental Sciences, University of East Anglia, Norwich, UK
6 Institute of Atmospheric Physics, Deutsches Zentrum für Luft- und Raumfahrt (DLR),

Oberpfaffenhofen, Germany
7 National Centre for Atmospheric Science, University of Leeds, Leeds, UK
8 Department of Meteorology, University of Reading, Reading, UK
* now at: School of Engineering and Applied Science, Harvard University, Cambridge, USA

Received: 11 February 2010 – Published in Atmos. Chem. Phys. Discuss.: 1 April 2010
Revised: 8 October 2010 – Accepted: 4 November 2010 – Published: 11 November 2010

Abstract. Peroxy radicals were measured onboard two sci-           radical variability, concur with variations in photolysis rates
entific aircrafts during the AMMA (African Monsoon Mul-            and in other potential radical precursors. Model results pro-
tidisciplinary Analysis) campaign in summer 2006. This pa-         vide additional information about dominant radical forma-
per reports results from the flight on 16 August 2006 dur-         tion and loss processes.
ing which measurements of HO2 by laser induced fluores-
cence spectroscopy at low pressure (LIF-FAGE) and total
peroxy radicals (RO∗2 = HO2 + 6RO2 , R = organic chain) by
two similar instruments based on the peroxy radical chemi-         1   Introduction
cal amplification (PeRCA) technique were subject of a blind
                                                                   Hydroperoxy- (HO2 ) and alkyl peroxy (RO2 ; R = organic
intercomparison. The German DLR-Falcon and the British
                                                                   chain) radicals are involved in many of the oxidation mech-
FAAM-BAe-146 flew wing tip to wing tip for about 30 min
                                                                   anisms taking place in the troposphere. They are short lived
making concurrent measurements on 2 horizontal level runs
                                                                   species originating from the oxidation of carbon monox-
at 697 and 485 hPa over the same geographical area in Burk-
                                                                   ide (CO) and volatile organic compounds (VOCs) (Monks,
ina Faso. A full set of supporting measurements comprising
                                                                   2005). Their reactions are closely coupled with those of the
photolysis frequencies, and relevant trace gases like CO, NO,
                                                                   most important atmospheric oxidative agent, the hydroxyl
NO2 , NOy , O3 and a wider range of VOCs were collected si-
                                                                   radical OH, and the formation mechanisms of chemically or
multaneously.
                                                                   toxicologically important pollutants like ozone (O3 ), peroxy
   Results are discussed on the basis of the characteristics and   acetyl nitrate (PAN), aldehydes, acids, etc. Knowledge of the
limitations of the different instruments used. Generally, no       atmospheric radical content and radical distribution provides
data bias are identified and the RO∗2 data available agree quite   essential information about the oxidative state of an air mass.
reasonably within the instrumental errors. The [RO∗2 ]/[HO2 ]      In spite of their importance in the chemical processing of
ratios, which vary between 1:1 and 3:1, as well as the peroxy      the troposphere, only a very limited number of airborne per-
                                                                   oxy radical measurements are available (Brune et al., 1998;
                     Correspondence to:                            Jaeglé et al., 2001; Hanke et al., 2002; Cantrell et al., 2003a,
                     M. D. Andrés-Hernández                      b; Martinez et al., 2008). In particular, there are no previous
                     (lola@iup.physik.uni-bremen.de)               measurements in or over Africa.

Published by Copernicus Publications on behalf of the European Geosciences Union.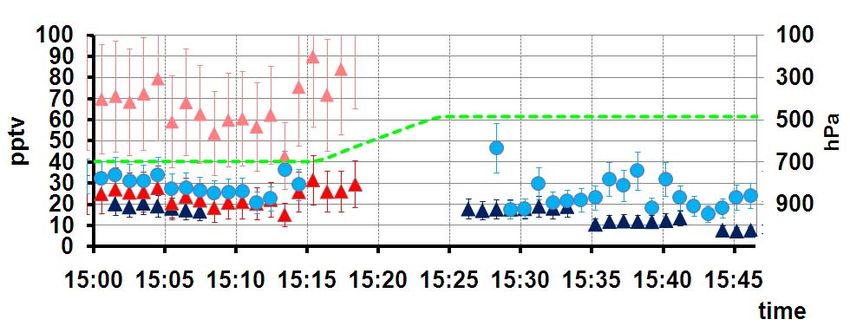
10622                                                             M. D. Andrés-Hernández et al.: Peroxy radical partitioning during AMMA

   Within the European Project AMMA (African Monsoon
Multidisciplinary Analysis) the fast photochemical process-
ing during the West African Monsoon (WAM) period was in-
vestigated. Overall the AMMA project aims to improve the
knowledge about the WAM variability and the impact on the
local and global atmospheric composition. One of the main
scientific objectives was to investigate the development of
Mesoscale Convective Systems (MCS), including their im-
pact on the transport of trace gases. For this, 5 different
instrumented aircrafts were deployed within AMMA cover-
ing the measurement of trace gases over a broad vertical and
horizontal area (Reeves et al., 2010). The importance of con-
vection in determining the abundance of radical precursors
in the Upper Troposphere (UT) has recently been confirmed
experimentally within AMMA by Bechara et al. (2009), who
measured enhancement of isoprene and other VOCs up to
10 km altitude within MCS episodes. Some of the products
of isoprene oxidation have lifetimes of several hours, and it
is possible that such compounds, as well as brominated and
iodinated hydrocarbons, are locally transported to the UT by
convective activity. Peroxy radical observations made within Fig. 1.Fig. Flight1.
                                                                                trackFlight   track
                                                                                      on 16 August     onThe16partAugust
                                                                                                   2006.                      2006.
                                                                                                                   corresponding         The
                                                                                                                                  with the  AMMApartintercomparison
                                                                                                                                                       corresponding exercise is
AMMA (Andrés-Hernández et al., 2009) are indicativeFigure
                                                          of en- 1:    with
                                                                 highlighted in the   AMMA
                                                                                blue and           intercomparison
                                                                                         was from 15:00                      exercise
                                                                                                        toth15:50 whilst the Meteosat
                                                                     Flight track on the 16 August 2006. The part corresponding            is
                                                                                                                                      infrared  highlighted
                                                                                                                                               image is from 15:00in  blue with the A
                                                                                                                                                                   UTC.
hanced in situ production of peroxy radicals in the upper   tro-
                                                         intercomparison exercise is highlighted in blue and was from 15:00 to 15:50iswhilst the Me
                                                                       and    was    from    15:00    to  15:50     whilst    the  Meteosat        infrared     image
posphere during convective episodes, linking the boundary              from 15:00 UTC.
                                                         infrared image is from 15:00 UTC.
layer, free troposphere and UT/LS chemistry.
   The general interpretation of the impact of radical chem-
                                                                       in Reeves et al. (2010). Results of the initial CO compari-
istry relies consequently on the data quality control designed
                                                                       son led to a comparison of standards which showed that the
to prevent any misinterpretation of results derived from off-
                                                                       data for the D-Falcon and BAe-146 should be corrected by a
sets or other kind of instrumental artefacts. The intercalibra-
                                                                       factor of 0.997 and 1.069, respectively.        24
tion of similar instruments is a crucial part of the data anal-
                                                                            Table 1 summarises the instrumentation in both aircrafts
ysis and interpretation, and the results obtained can be used
                                                                       used for the present data analysis. A more detailed descrip-
to provide an estimate of the uncertainty associated with the
                                                                       tion of individual instruments is included in the following
airborne measurement of radicals. As reported by Reeves
                                                                       sections
et al. (2010) wing tip to wing tip comparison flights along
straight and level runs at various altitudes were performed            2.1 Peroxy Radical Chemical Amplification
during AMMA. The present work focuses on the compari-
son and evaluation of peroxy radical measurements.                     The Peroxy Radical Chemical Amplification technique
                                                                       (PeRCA) utilises the amplified conversion of the peroxy rad-
                                                                       icals entering the reactor into NO2 in a chain reaction involv-
2 Experimental description                                             ing NO and CO, namely:

Three instruments for the measurement of peroxy radicals                             HO2 + NO −→ NO2 + OH
participated in the intercomparison exercise which took place                                                M
on the 16 August 2006. Figure 1 depicts the correspond-                              OH + CO + O2 −→ CO2 + HO2
ing flight track over the MSG (Meteosat Second Genera-
                                                                                     RO2 + NO −→ NO2 + RO
tion) satellite image at 15:00 h with IR brightness temper-
ature. These images were usually used to locate the MCS                              RO + O2 −→ HO2 + organic products
during AMMA. The German DLR-Falcon (hereafter referred
to as D-Falcon) and the British FAAM-BAe-146 (hereafter                              By switching the addition of the reagent CO with an identi-
referred to as BAe-146) flew wing tip to wing tip for ap-                            cal flow of N2 between the front and back of the reactor the
proximately 30 min, first in a straight and level westward run                       chain chemistry is modulated between chain amplification
at 697 hPa followed by a straight and level eastward run at                          mode (i.e., NO2 from the conversion of peroxy radicals plus
485 hPa over the same geographical area in Burkina Faso.                             other background trace gases producing NO2 in their reac-
More details of the intercomparison including the results for                        tion with NO like O3 , plus NO2 itself) and background mea-
measurements of CO, O3 , CO2 , HCHO and NOy are given                                surement mode (i.e., NO2 comprising that in outside air plus

Atmos. Chem. Phys., 10, 10621–10638, 2010                                                                  www.atmos-chem-phys.net/10/10621/2010/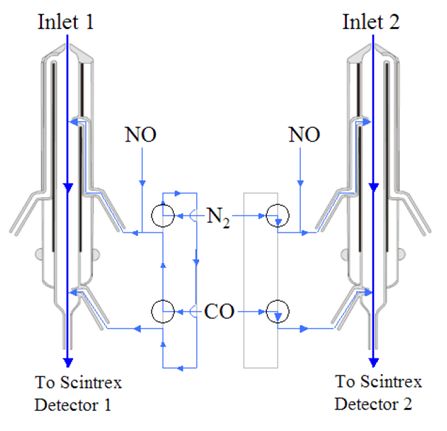
M. D. Andrés-Hernández et al.: Peroxy radical partitioning during AMMA                                                     10623

Table 1.     Summary of the measurement techniques deployed during the AMMA peroxy radical intercomparison exercise,
[RO∗2 ]=([HO2 ]+6[RO2 ]); dl: detection limit.

                   Instrument/   Technique           Measurement       Institution    Time           Special features
                   Aircraft                                                           resolution
                   DUALER/       PeRCA               [RO∗2 ]           IUP-UB         1 s, 60 s      Dual inlet,
                   D-Falcon                                                           reported       P controlled,
                                                                                                     HO2 calibration
                   PeRCA 4/      PeRCA               [RO∗2 ]           University     1 s, 60 s      Dual inlet,
                   BAe-146                                             of Leicester   avg            CH3 O2 calibration
                   BAe-146       FAGE                HO2 by            University     1 s, 60 s      Commane et al., 2010
                                                     titration to OH   of Leeds       reported
                   UV            UV absorption       O3                DLR            1 s, 5%        dl: 1 ppb
                   photometer/                                                        accuracy
                   D-Falcon
                   Aerolaser     VUV                 CO                DLR            1 s, 3%        dl: 1 ppb
                   AL5002/       fluorescence                                         accuracy
                   D-Falcon
                   NR-IR         IR absorption       CO2               DLR            1 s, 0.3 ppm   dl: 0.1 ppm
                   photometer/                                                        accuracy
                   D-Falcon
                   Whole Air     off line analysis   VOCs              University     15 min         Grab samples
                   Samples       with dual channel                     of York
                   (WAS)/        GC
                   BAe-146
                   NOx –NOy /    Phot. convert-NO2   NOy , NO          DLR            1s             dl: 5 pptv (NO)
                   D-Falcon      Au- convertor-NOy                                                   15 pptv (NOy )
                                 Chemilumin. (NO)
                   /BAe-146      Gas                 PAN               University     90 s
                                 Chromatography                        of Leeds
                   YES, Inc,     Hantzsch            HCHO              DLR            60 s, 15%      dl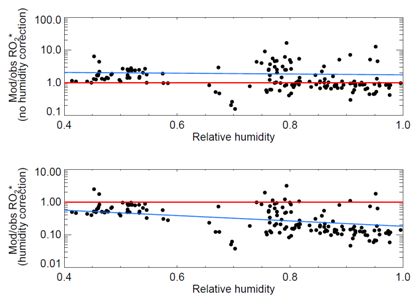
10624                                               M. D. Andrés-Hernández et al.: Peroxy radical partitioning during AMMA

   The CL depends on humidity (Mihele and Hastie, 1998;          tors respect to the ambient as Tambient Preactor causes the decrease
2003), residence time in and shape and material of the re-                H2 O
                                                                 in the Ppartial in the reactors (Kartal, 2009). The in flight de-
actor, and on the ratio of the gases added for the chemical      tection limit and accuracy of the instrument depend on the
conversion, i.e., [NO]/[CO]. Instruments based on PeRCA          stability of the luminol flow, the variability of the air mass
have been developed for the airborne measurement of per-         composition sampled and the operating pressure. For most
oxy radicals (Green et al., 2003). In order to increase sen-     of the AMMA airborne measurements the relative accuracy
sitivity and accuracy, dual systems comprising two identical     was between 25 and 45% and the RO∗2 detection limit var-
reactors, which concurrently measure in the same or alternate    ied between 2 and 5 pptv for a 20 s time resolution (Kartal et
modes, are coupled with one or two detectors (Cantrell et al.,   al., 2009). During the intercomparison exercise the decrease
1996; Green et al., 2006). Interferences related to short term   in the RH relative to the ambient was dominated by the de-
variations of concentrations during the airborne sampling cy-                      H2 O
                                                                 crease in the Ppartial   as the DUALER operated at 300 mbar.
cle are thereby minimized.
                                                                 The RH in the reactors remained below 15%. At 300 mbar
                                                                 this effect in the CL is expected to be within the error of the
2.1.1   DUALER (DUal channel Airborne peroxy radicaL             CL determination.
        chemical amplifiER)
                                                                 2.1.2   PeRCA 4
As indicated in Table 1, the Institute of Environmental
Physics of the University of Bremen (IUP-UB) participated
                                                                 The University of Leicester airborne PeRCA instrument
in the wet monsoon measurement campaign of AMMA in
                                                                 (designated PeRCA 4) is a dual channel (two inlet, two de-
August 2006 with the measurement of the total sum of per-
                                                                 tector) PeRCA and was operated on board the BAe-146 dur-
oxy radicals, RO∗2 , onboard of the German D-Falcon using a
                                                                 ing AMMA. The PeRCA 4 instrument was originally de-
DUALER.
                                                                 signed and built jointly between the University of Leices-
   The airborne DUALER deployed on the D-Falcon has              ter and the University of East Anglia. The application of
been developed by IUP-UB from the first calibrated PeRCA         the PeRCA 4 dual channel system to ground based measure-
(Hastie et al., 1990) which has been gradually improved and      ments was first described by Green et al. (2006). The aircraft
implemented in several campaigns and comparison exercises        instrument, its characterisation, calibration procedures and
for ground based measurements (Zenker et al., 1998; Andrés      performance during the measurement campaign are detailed
Hernández et al., 2001; Burkert et al., 2001a, b, 2003). This   in Brookes (2009).
instrument bases on the concept described in Sect. 2.2. for
                                                                    PeRCA 4 uses two equivalent channels each comprising a
aircraft measurements. The IUP-UB DUALER utilises a
                                                                 low-volume pyrex inlet coupled to a modified LMA-3 Scin-
common inlet, and comprises a double reactor (21 mm ID,
                                                                 trex NO2 detector channel. A sample flow of 2 slpm is
310 mm L stainless steel cylinders, with a 10 mm inlet ori-
                                                                 drawn through each inlet inclusive of ambient air and reagent
fice) sampling from a common pre-reactor nozzle and con-
                                                                 gases. In each inlet the chain chemistry described in Sect. 2.1
nected to two identical luminol detectors. Three way valves
                                                                 is modulated between chain amplification mode and back-
in the inlet system are switched every 60 s and alternate the
                                                                 ground measurement mode by switching the addition of a
modes of the reactors. The DUALER is kept at a below
                                                                 flow of the reagent CO (100 sccm, 5%/vol. equivalent in
ambient, constant fixed pressure during the measurement.
                                                                 the sample flow) with an identical flow of N2 between the
The CL decreases with the pressure and the sensitivity of
                                                                 front and back of the inlet (typically every 60 s)while a flow
the instrument reaches a maximum for an operating pres-
                                                                 of the reagent NO (10 sccm, 3 ppmv equivalent in the sample
sure around 500 mbar. During the intercomparison exercise
                                                                 flow) is added continuously at the front of the inlet. Reagents
the DUALER was kept at 300 mbar. The characterisation,
                                                                 and N2 are supplied under pressure from gas cylinders held
calibration procedures and performance during the measure-
                                                                 within the instrument rack inside the aircraft cabin with
ment campaign are described in detail elsewhere (Kartal et
                                                                 flow control maintained using mass flow controllers (Tylan
al., 2010).
                                                                 FC260, now manufactured and distributed by Celerity Inc.).
   The known dependency of the CL on the relative hu-            Total sample flow is maintained at 2 slpm (1.79 slpm ambi-
midity (RH) of the air sampled (Mihele and Hastie, 1998;         ent air, 0.21 slpm reagent gases) by a combination of mass
Mihele et al., 1999; Reichert et al., 2003) has a negligi-       flow meters (MFM, Tylan FM360) in series with stepper mo-
ble effect under the AMMA measurement conditions. The            tor controlled needle valves; active control of the stepper mo-
DUALER inlet is not heated during the AMMA flights but           tors via computer software provides sample flows to within
its inner part is connected to the cabin of the aircraft. As     ±50 sccm. A Leybold Sogevac SV16 oil filled rotary vacuum
a consequence, the temperature of the reactors remains al-       pump (capable of a pumping speed of 14.5 m3 h−1 , down to
ways higher than   that of the outside
                                         air. Therefore, the    a pressure of 80 mbar) provides suction to pull the sample
                     H2 O   H2 O
RH, being RH= Ppartial /Psaturation , decreases in the reac-     air flow from the inlets through to the Scintrex detectors.

Atmos. Chem. Phys., 10, 10621–10638, 2010                                          www.atmos-chem-phys.net/10/10621/2010/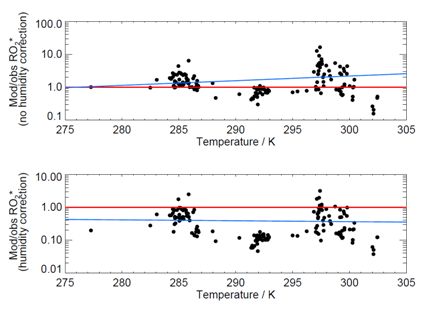
M. D. Andrés-Hernández et al.: Peroxy radical partitioning during AMMA                                                         10625

                      a)                                     b)

Fig. 2. (a) Scale diagram of aircraft inlet and (b) PeRCA 4 dual inlet scheme: Inlet 1 in chain amplification mode (NO and CO addition at
front port, N2 at back), Inlet 2 in background measurement mode (NO and N2 addition at front port, CO at back), arrows indicate direction
of gas flow, circles indicate 2-way valves (from Brookes, 2009).

The channels are run out of phase as shown in Fig. 2, to               model using the pressure and temperature altitude profiles
provide simultaneous measurements of chain amplified and               measured from the BAe-146 during AMMA, further details
background NO2 , and the radical chain amplified NO2 sig-              of the model setup can be found in Brookes (2009). At the
nal is determined by subtraction of the background measure-            altitude of the intercomparison level run where the PeRCA 4
ment.                                                                  operated (700 mbar) a reduction in the CL of the order 20%
   It was not possible to perform in flight CL calibra-                is modelled. The reduction of the PeRCA 4 chain length
tions on board the BAe-146, and consequently calibrations              with altitude will contribute to systematic bias between the
were performed at ground level in the laboratory follow-               PeRCA 4 and DUALER measurements, where the DUALER
ing the AMMA campaign. The calibration procedure for                   reactor is pressure controlled and the PeRCA 4 chain length
the PeRCA 4 inlet chain lengths is based on the method                 has not been corrected. The modelled variation in the CL at
of Clemitshaw et al. (1997), whereby known concentrations              altitude (CLalt ) relative to the CL at ground level (CL0 ) is
of methyl peroxy are generated through UV photolysis of                shown as a function of pressure in Fig. 3.
methyl iodide. The calibration procedure as yet does not take             To correct for the humidity interference to the chain chem-
into account the change in CL with temperature and pressure            istry a correction function (dependent on relative humidity)
although it would be preferable to perform CL calibrations at          was derived and applied to the AMMA PeRCA 4 [RO∗2 ]
different altitudes, to account for the temperature and pres-          dataset as demonstrated in Fig. 4. The model to measure-
sure dependent rate constants of the chain chemistry reac-             ment ratio as a function of temperature shows the humidity
tions.                                                                 corrected data consistently over estimates the model with no
   The PeRCA 4 inlets (Fig. 2) sample the airflow at ambient           real trend. A slight increasing trend with temperature is ob-
air pressure perpendicular to the aircraft direction of flight.        served in the non humidity corrected model to measurement
The inlets can be heated to reduce the impact of humidity on           ratio. This has no relationship to humidity and in fact can
the chain length, however this system fails in flight on the           be explained the changing composition of the radical pop-
BAe-146. The result is that for the PeRCA 4 instrument the             ulation with altitude (Brookes, 2009). Model to measure-
air temperature, pressure and humidity are expected to re-             ment agreement improves at higher altitude (lower tempera-
main at ambient levels on sampling and impact on the chain             ture) where the radical population is primarily composed of
length. A systematic reduction in the chain length with al-            HO2 and CH3 O2 . At lower altitudes (higher temperature) a
titude has been modelled (Brookes, 2009) using the FAC-                more complex population of organic peroxy radicals influ-
SIMILE package (v4.40.101, MCPA Software Ltd.) using an                enced by the surface emissions of isoprene is modelled and
inlet chemistry reaction mechanism based on that of Hastie             the increased model to measurement ratio reflects a reduced
et al. 1991) and rate coefficients taken from the recommen-            sensitivity of the measurement to these components of the
dations of Sander et al. (2006) and Atkinson et al. (2004,             radical population.
2006). Pressure and temperature were constrained in the

www.atmos-chem-phys.net/10/10621/2010/                                                 Atmos. Chem. Phys., 10, 10621–10638, 2010
10626 M. D. Andrés-Hernández et al.: Peroxy radical partitioning during AMMA
above the freezing point in highly saturated conditions dur-
ing AMMA (Brookes, 2009). Although the condensation of
water vapour prior to the reaction zone may reduce the im-
pact of humidity on the chain length, significant sampling
losses of HO2 are expected (Brookes, 2009) as reported by
Green et al. (2003). Systematic differences in the RO∗2 mea-
surements may then be attributed to the relative sensitivity of
the respective PeRCA instruments to inorganic and organic
peroxy radicals.
The PeRCA 4 inlet chain lengths were calibrated follow-
ing the AMMA campaign in reference to known concentra-
HO2-CLrel
CH3O2-CLrel tions of the methyl peroxy radical, for details see e.g. Green
et al. (2003). The accuracy of the derived RO∗2 concentration
will depend on the relative proportion of the radical popula-
tion made up by the methyl peroxy radical and radicals with
a similar effective chain length. The calibration procedure
for the NO2 sensitivity of the LMA-3 Scintrex detectors is
detailed in Brookes (2009). Ordinarily the LMA-3 detectors
are calibrated by mixing the output from a VICI Metronics
NO2 wafer permeation device with varying flows of zero air,
Fig.3. Modelled variation in the chain length relative to ground level (CL0) for HO2 but owing to technical problems with the calibration system
Fig. 3. Modelled variation in the PERCA 4 chain length relative to ground level (CL0 ) for HO2 and CH3 O2 ,
and CH3.
Fig. 3O2Modelled
, CLalt. stands for CL at in
variation single
thealtitude
PeRCA (Brookes,
4 chain 2009)
length relative to
CLalt. stands for CL at single altitude (Brookes, 2009). on board the BAe-146, it was not possible to perform reli-
ground level (CL0 ) for HO2 and CH3 O2 , CLalt. stands for CL at
able in-flight calibrations. An alternative method was devel-
single altitude (Brookes, 2009).
oped using the background signal on the LMA-3 detectors
along with the in-situ ozone measurements made on board
the BAe-146 with a commercial Thermo Environmental In-
On application of the correction to the AMMA dataset as struments Inc. 49C ozone analyser. The relative levels of
whole the concentrations typically scaled on average by a ozone and NO2 encountered during AMMA were such that
factor of 4.4 resulting in up to several
26 hundreds of pptv [RO∗2 ] the background signals measured on the LMA-3 detectors
(Brookes, 2009); this scaling is considered unrealistic since were almost entirely due to the oxidation of reagent NO by
concentrations this high have not been reported in the tropi- ozone with a negligible contribution from ambient NO2 . The
cal troposphere. By comparison of the uncorrected PeRCA 4 absolute NO2 background concentration generated from this
[RO∗2 ] dataset to output from the DSMACC model (Emmer- reaction was derived using the temperature dependence of the
son and Evans, 2009; Stone et al., 2010), the uncorrected data reaction rate constant and the variation of the residence time
was assessed for any systematic bias with humidity (Brookes, with temperature and pressure. The derived background NO2
2009). The model to measurement ratio exhibits no trend concentration within the sample flow was used to weight the
with relative humidity. To apply the humidity correction to detector response. Thus the NO2 sensitivity of the detectors
this dataset may therefore be inappropriate and the intercom- was calculated along the flight track for every point during
parison was made using the uncorrected data. which ozone measurements were available.
The expected humidity bias in the measurement response The estimated accuracy of the PeRCA 4 measurements is
was not observed in the PeRCA 4 AMMA dataset despite the of the order 40%, not accounting for uncertainty introduced
consistently high humidity encountered during the monsoon by variation in the CL by altitude and systematic differences
season (Brookes, 2009), and thus a potential explanation is introduced by the weighting of the response by the CL with
sought. Owing to their low thermal mass the PeRCA 4 in- respect to the methyl peroxy radical. The average detection
lets are expected to be in thermal equilibrium with the air- limit of the PeRCA 4 dual channel measurement over the in-
craft cabin and ambient airflow. A temperature gradient is tercomparison run at 697 hPa is 10.4 pptv for a 60 s averaging
also expected between the inlet tip in contact with the ambi- interval.
ent airflow, and the inside in contact with the aircraft cabin.
The most significant interaction between the inlet and the 2.2 Fluorescence Assay by Gas Expansion (FAGE)
ambient airflow will occur on sampling and it is hypoth-
esized that at this cold point water vapour may condense, Fluorescence Assay by Gas Expansion (FAGE) is a low pres-
thus reducing the relative humidity sampled. This hypoth- sure laser-induced fluorescence technique used for the detec-
esis also provides an explanation of the observed loss of tion of OH and HO2 . The instrument and associated cal-
sample flow through the mechanism of inlet tip icing; the ibrations are described in detail in Commane et al. (2010)
sample flow was observed to drop dramatically at altitudes and only a brief overview will be presented here. During
Atmos. Chem. Phys., 10, 10621–10638, 2010 www.atmos-chem-phys.net/10/10621/2010/M. D. Andrés-Hernández et al.: Peroxy radical partitioning during AMMA 10627
a)
b)
Fig. 4. DSMACC model to PeRCA 4 measurement ratio as a function of relative humidity (as a fraction).
Fig. 4. DSMACC model to PERCA 4 measurement ratio as a function of relative humidity (as a fraction).
the intercomparison flight described here, only HO2 was ob- collected at 1 Hz and averaged to 60 s for comparison here.
served. OH was not observed due to technical problems dur- The mean limit of detection of the instrument for the data
ing the period of the campaign. Fig. 4: DSMACC model to PERCA 4 measurement
27 discussed here is 0.31ratio
pptv as
(60a sfunction of a)time).The total
integration
relative humidity (as a fraction), and b) temperature (in Kelvin).
uncertainty of the measurement is 26% at 2σ .
In this instrument HO2 is titrated to OH by the addition of
pure NO (99.999%). Air was sampled from a side-mounted
inlet through a 0.75 mm pinhole into the fluorescence cell. A 2.3 Further instrumentation
Nd:YAG pumped Ti:Sapphire laser is used to generate light
at λ≈308 nm in order to excite the Q1(2) transition of the OH A complete description of the aircraft instrumentation during
molecule. The exact excitation wavelength is determined us- AMMA can be found elsewhere (Reeves et al., 2010). For
ing a reference cell. The subsequent fluorescence of the OH the data analysis of the present work, O3 , CO2 , CO, HCHO
molecule is also detected at λ≈308 nm. Maintaining the fluo- and reactive organic compounds measured on board the D-
rescence cell at low pressure (1.5–2.5 Torr) allows for tempo- Falcon by using respectively UV absorption (Schlager et al.,
ral gating of the fluorescence detection. The sensitivity of the 1997), IR absorption (Schulte et al., 1997), UV fluorescence
instrument to HO2 was determined by calibration before and (Gerbig et al., 1996), a fluorometric technique (Hantzsch re-
after the campaign. In these calibrations, a known concen- action), and two O3 /NO-chemiluminescence detectors and a
tration of HO2 is produced by the photolysis of water vapour gold converter for reduction of higher oxidized NOy com-
(at λ=184.9 nm) in a turbulent flow of air. The HO2 data was pouds to NO (Schlager et al., 1997; Ziereis et al., 2000)
www.atmos-chem-phys.net/10/10621/2010/ Atmos. Chem. Phys., 10, 10621–10638, 201010628 M. D. Andrés-Hernández et al.: Peroxy radical partitioning during AMMA
were used. The NOx was also measured by the UEA NOxy Where observations of alkanes and alkenes were not avail-
instrument on the BAe-146 that thermally converts NOy to able, concentrations were estimated as a linear function of
NO2 , using a gold convertor, photolytically converts NO2 to the CO concentration (Stone et al., 2010).
NO and measures NO by chemiluminescence (Brough et al., For each time point, those species which have not been
2003; Stewart et al., 2008). The instrument has detection observed are set initially to zero. Those species which have
limits of 3, 15 and 10 pptv and precisions of 10, 30 and 21% been observed are set to the observed value and kept con-
for NO, NO2 and NOy , respectively. stant. However, concentrations of oxides are nitrogen are
Information regarding VOCs comes from the 15 min treated differently to other species in the model. For each
whole air samples (WAS) on board the BAe-146 which were time point during a day the concentration of NOy (defined as
analysed on the ground by dual-channel gas chromatography NO + NO2 + NO3 + 2 N2 O5 + HONO + HNO4 ) is corrected
and flame ionization detection (Hopkins et al., 2003). The so that the total NOy concentration is kept constant, but the
VOC detection limits and precisions varied from 1–10 pptv concentration of the NOy species varies owing to changes in
and 1–3%, respectively, depending on compound. Isoprene, photolysis rates etc. At the end of each day the calculated
acetone and the sum of methyl vinyl ketone (MVK) and concentration of one of the NOy species (typically either NO
methacrolein (MACR) were also measured by proton mass or NO2 ) is compared to the equivalent measured concentra-
transfer mass spectrometry (PTR-MS) at a higher time reso- tion and the concentration of all NOy species is fractionally
lution and frequency (Table 1), but with detection limits of increased or decreased so that the measured and the modelled
20–80 pptv and 10% precision. PAN was measured by gas concentrations of the observed species match.
chromatography (30 pptv detection limit and 3% precision). Photolysis rates in the model are calculated from the Tro-
O3 and NO2 photolysis frequencies (j (O1 D) and j (NO2 )) pospheric Ultraviolet- Visible Model (TUV; http://cprm.acd.
were measured on board the BAe-146 using 4 π sr filter ra- ucar.edu/Models/TUV/), assuming a constant ozone column
diometers (see Table 1). A 4 π sr j (NO2 ) radiometer (Me- of 260 Dobson units and an albedo of 0.1. Cloud correc-
teorology Consult, GmbH, Glasshütten, 10% accuracy) was tion factors for all reactions other than O3 →O(1 D)+O2 are
also used on board the D-Falcon. calculated from the ratio of observed to simulated j (NO2 ),
with the cloud correction factor for O3 →O(1 D)+O2 calcu-
lated from the ratio of observed to simulated j (O1 D).
3 Supporting calculations or modelling A removal reaction was included for all species which can
be considered as a continuous deposition process (such as
Model calculations have been made using the Dynami- dry deposition or continuous wet deposition). The deposi-
cally Simple Model of Atmospheric Chemical Complex- tion lifetime was initially set at 24 h and the sensitivity inves-
ity (DSMACC) (Emmerson and Evans, 2009; Stone et al., tigated.
2010). DSMACC is a zero-dimensional box model using For each observation of HO2 or RO2 the objective is to cal-
the Kinetic Pre-Processor (KPP) (Sandu et al., 2006), con- culate an expected value from the other parameters measured
strained to observations of long-lived species with a chem- on board the aircraft and the chemical scheme used. All air-
istry scheme generated by the Master Chemical Mecha- craft parameters have been merged onto a 60 s timebase for
nism (MCM) (Saunders et al., 2003). expediency. The model is integrated forward in time with di-
A full description of the model calculations undertaken for urnally varying photolysis rates until a steady state is reached
the AMMA campaign can be found in Stone et al. (2010). To when the fractional difference in mean species concentration
be modelled, time points needed to have observations of HO2 between a day and the previous day is less than 0.01. Full
or RO2 together with the physical state (latitude, longitude, details can be found in Stone et al. (2010).
pressure, temperature and water vapour) and observations of
CO, O3 , NO, j (O1 D) and j (NO2 ).
Observations of ethane, propane, iso-butane, n-butane, 4 Discussion of results
ethene, propene, acetylene, methanol, ethanol, acetone,
formaldehyde, PAN, methyl ethyl ketone (MEK), isoprene, Figure 5 shows the peroxy radicals measured by the
MVK and MACR were also included where available and DUALER, PeRCA 4 (RO∗2 ) and FAGE (HO2 ) at the two pres-
kept constant at the observed value. All observations used sure levels of the intercomparison exercise. As explained
as input to the model were made on the BAe-146. There in Sect. 2.2.2, a relative humidity correction was applied
was virtually no difference in the model output when includ- to the PeRCA 4 data set [RO2 *-PeRCA 4] but this lead to
ing benzene and toluene measured on the BAe-146 in test spuriously high concentrations. Figure 6 illustrates the loss
runs. The results indicate that for a set of reactive species in PeRCA 4 sample flow during the intercomparison flight.
the model is relatively insensitive and the model covers the With the aircraft ascending to higher altitude the temperature
dominant radical production and loss processes. falls below freezing and simultaneously the water content
Concentrations of methane and hydrogen were kept con- changes from a mixed phase to condensed water (ice) only,
stant at values of 1770 ppmv and 550 ppmv, respectively. as indicated by the Nevzorov probe data from the BAe-146.
Atmos. Chem. Phys., 10, 10621–10638, 2010 www.atmos-chem-phys.net/10/10621/2010/M. D. Andrés-Hernández et al.: Peroxy radical partitioning during AMMA 10629
* * *
HO2-BAe RO2 -BAe RO2 -DF RO2 -BAecorr ---- P
Fig. 5. Peroxy radicals measured during the AMMA intercomparison exercise. The pressure at the two measurement levels is indicated in
Fig. 5. Peroxy radicals measured during the AMMA intercomparison exercise. The pressure at the two mea-
green. RO∗2 -BAecorr are the [RO∗2 ] obtained by applying the relative humidity correction of the CL to the PeRCA 4 instrument. [RO∗2 -DF]
∗ surement levels is indicated in grey. RO∗2 -PERCA4corr are the [RO∗2 ] obtained by applying the relative humidity
are the [RO2 -DUALER] measured at the D-Falcon.
correction of the CL to the PERCA 4 instrument.
centrations remains generally between 15 and 45 pptv. There
is no indication of any experimental artefact related to the
45 pptv [RO∗2 -DUALER] measured at the beginning of the
layer. This apparent outlier mixing ratio agrees temporally
with short term peak variations of other trace gases measured
(acetone, CO, O3 ).
For this leg [HO2 ] varies within and 6 and 18 pptv and
the temporal variation shows two abrupt steps at 15:35 and
15:42 h. Both of these steps follow periods where the laser
wavelength is rescanned to the maximum of the OH rota-
tional line. This rescanning process takes ca. 2 min and no
ambient data are collect during this procedure. Laser diag-
nostic measurements of power and wavelength stability dur-
Fig. 6. Time series of PERCA 4 sample flow, with temperature and water content during the intercomparison 28 ing the three HO2 measurement periods in this leg show there
Fig. 6. Time series of PERCA 4 sample flow, with temperature and water content during the intercomparison flight
Fig.
flight. 6. Time series of PeRCA 4 sample flow, with temperature and is no evidence to suggest that the instrument sensitivity has
water content during the intercomparison flight. undergone a change and it is concluded that the two steps in
the HO2 concentration are real variations. It can be demon-
strated that the observed [HO2 ] is directly and linearly pro-
The simultaneous drop in sample flow with a phase change portional to the excitation laser power which is monitored
in water is seen to indicate condensation followed by freez- at 1 Hz during ambient measurements and used to normalize
ing occurs, which then blocks the sample flow to the inlet. the observed signal. This normalization procedure has been
The combination of the ambient temperature dropping below applied to the data in question. The relationship between the
freezing and elevated ice content coincident to a drop in sam- observed [HO2 ] and excitation wavelength is non-linear and
ple flow is common in all AMMA 29
flights where the PeRCA 4 is an integration of the laser wavelength and line width and
instrument was operational on board the BAe-146. There has the OH rotational line width. A confirmation that the laser
as yet been no experimental verification to quantify the level wavelength was centered on the OH rotational line through-
of humidity within the inlet in flight. out this period before and after the rescanning process is ob-
[RO2 *-PeRCA 4] are only available for the first pressure tained by monitoring the signal produced in the OH reference
level measured (697 hPa) owing to a loss of sample airflow cell in which a high and very stable [OH] (produced by the
at the higher altitude. As can be seen in Fig. 5, within this thermolysis of water vapour) is probed by a measured laser
level [RO∗2 ] vary between 15 and 35 pptv and [HO2 ] between power. The signal obtained from the reference cell during
18 and 20 pptv. If the humidity correction is not applied, the period where the steps in ambient [HO2 ] were observed
[RO2 *-PeRCA 4] and [RO∗2 -DUALER] agree within their was stable. The additional factor which affects the observed
respective errors, otherwise [RO∗2 -PERCA 4] is significantly [HO2 ] is the flow rate of NO into the detection cell, and again
greater. At the second pressure level (485 hPa), the variabil- the relationship is non-linear, but the flow of NO is controlled
ity of [RO∗2 -DUALER] increases although the range of con- and measured by used of a thermal mass flow controller and
www.atmos-chem-phys.net/10/10621/2010/ Atmos. Chem. Phys., 10, 10621–10638, 201010630 M. D. Andrés-Hernández et al.: Peroxy radical partitioning during AMMA
jO1D-BAe jNO2-BAe jNO2-DF
Fig. 7. Temporal variability
Fig. 7. of the photolysis
Temporal variabilityrates
of themeasured
photolysisduring the AMMA
rates measured duringintercomparison exercise. exercise.
the AMMA intercomparison DF stands DFfor D-Falcon and BAe
for BAe-146. stands for D-Falcon and BAe for BAe-146.
during this ambient measurement period the flow was at the the upward facing radiometers get both, direct and diffuse
set point value of 10.0 sccm. Therefore there is no indication radiation. As a consequence, upward looking radiometers
of any systematic variation in instrument sensitivity to HO2 have an additional uncertainty due to the azimuth and zenith
in this period. dependence of the radiometer sensitivity. Previous investi-
Interestingly, the variations of [RO∗2 -DUALER] and [HO2 ] gation has shown that the total combined accuracy of the D-
do not agree temporally, in particular for the flight period be- Falcon upward looking radiometer is 14% and of the down-
tween 15:35–15:45 h. As the [HO2 ] remains very even, the ward looking radiometer is 3%. If both radiometers are sub-
[RO∗2 -DUALER] seems to mirror a change in the radical par- ject to similar errors, it is reasonable that the upward facing
titioning of the air mass sampled in favour of organic peroxy j (NO2 ) measurements, with lower accuracy, show a larger
radicals. difference within the combined total errors, than the down-
In principle, the atmospheric radical variability is driven ward facing radiometers. Differences in the surface reflec-
by radiation and/or other trace gas variability. Therefore, tivity around the sensors in each aircraft may also affect the
the radical temporal evolution observed during the flight was result.
compared with the variability of the photolysis frequencies The temporal variations observed in j (NO2 ) and j (O1 D)
and radical precursors measured simultaneously. agree qualitatively with the decrease in radical production
30 measured between 15:05 and 15:10 h at 697 hPa but do
4.1 Photolysis rates not correlate at all with the radical variability observed at
485 hPa.
Measurements of j (NO2 ) and j (O1 D) are presented in Fig. 7.
There is no BAe-146 data for the second intercomparison 4.2 Radical related trace gases
level as the field of view of the downward facing radiome-
ters were obscured owing to the deployment of a protective Concerning other related trace gases, NO and NOx remain
shutter. around the detection limit. Both NOy (D-Falcon) and PAN
(BAe-146) are significant higher at 485 hPa (Stewart et al.,
j (O1 D) was not measured on board the D-Falcon. At
2008) as are CO2 (not shown, 1CO2 ∼1 ppm), CO and O3 .
697 hPa, a systematical difference between j (NO2 ) radiome-
The [RO∗2 -DUALER] variations closely follow the changes
ters on both aircrafts was identified (see Fig. 7). While the
in [CO] between 15:30 and 15:50 h (Fig. 8), the minimum in
downward facing j (NO2 ) radiometers show very good agree-
the [CO]/[O3 ] ratio at 15:45 indicating horizontal advection
ment (within 6%), the D-Falcon upward j (NO2 ) radiome-
of an air mass enriched in CO rather than vertical convection,
ter is about 25–35% systematically higher than the BAe-146
as [CO] remains lower in the previous higher altitude run at
upward facing sensor at both pressure levels. According to
697 hPa.
Volz-Thomas et al. (1996), temperature variations between
Acetone measured by PTR-MS shows minor short term
25 and −40 ◦ C can only account for 2–3% changing in the in-
variations in both pressure levels, and similarly to the
strument sensitivity. The calibrations of the upper and lower
HCHO measured on board the D-Falcon decreases slightly
j (NO2 ) radiometers in the BAe-146 before and after AMMA
at 495 hPa on average from 1 ppbv to 0.8 ppbv. The corre-
are consistent with one another having both been referenced
sponding WAS results indicate more marked peak concen-
to the TUV radiation model. Calibrations of the D-Falcon
trations at 15:30 in acetone and also in acetaldehyde which
sensors carried out before and after the AMMA campaign
likely result from the integration related to the lower time
show little variance (6%). The downward facing radiome-
resolution of the WAS samples.
ters are mainly exposed to indirect diffuse radiation while
Atmos. Chem. Phys., 10, 10621–10638, 2010 www.atmos-chem-phys.net/10/10621/2010/M. D. Andrés-Hernández et al.: Peroxy radical partitioning during AMMA 10631
Fig. 8. Variation of relatedFig.Figure
trace gases8: Variation
8. Variation of related
during of
the related
trace
AMMAgasestrace gases
during
radical duringradical
AMMA the AMMA
the intercomparison radical intercomparison
intercomparison
exercise: exercise:
CO, O3CO, , NO O3y,,exercise:
NO
andy , and
HCHO as measured on board
the D-Falcon, (CH3 )2 CO, HCHO CO,
CH3 COH, O NO ,
MEK, and HCHO
on PAN as measured
andD-Falcon,
CH3 OH(CH on board the
as3 )measured D-Falcon,
on board (CH ) CO,
the BAe-146.CH COH,
and CH3 OH Theas MEK,(CHPAN
as measured board the 2 CO, CH3 COH, MEK, PAN measured 2 CO measured by PTR-MS
3 )on
3 y 3 2 3
(blue line) agree reasonably and the
with CH3WASOH assamples
measured on dots).
board the BAe_146. ofThe
theperiods of the intercomparison are
board the BAe-146. The (CH3 )2(blue
CO measured byThe periods
PTR-MS (blue line) intercomparison
agree reasonably withare highlighted
the WAS samples in the top figure in yelow.
highlighted in the top figure in yelow.
(blue dots). The periods of the intercomparison are highlighted in the top figure in yelow.
Isoprene and its oxidation products MVK and MACR (not CH3 O2 + RO2 → CH3 O + RO + O2 (R2a)
shown) remain low and relatively constant, not indicating any
recent influence of biogenic VOC. CH3 O2 + RO2 → CH3 OH + R0 CHO + O2 (R2b)
Owing to the strong altitude dependence on the sam-
pling and zeros reported by Murphy et al. (2010) during the 31 The HCHO measured on board the D-Falcon increases con-
AMMA measurement campaign, no PTR CH3 OH data are current to CH3 OH from 350 to 385 pptv. This can be con-
available for the intercomparison period. The GC analysis of sidered as an upper limit of the CH3 OH which can be at-
the WAS samples at lower time resolution shows a significant tributed to Reaction (R1b). Other minor sources of methanol
CH3 OH maximum (1.6 ppbv) at the beginning of the first are biomass burning and biofuels and fossil fuel combustion
pressure level (around 15:00 h) and an increase from 0.3 to and industrial activities, as in the case of MEK. Acetonitrile
0.5 ppbv between 15:30 and 15:35 h at 485 hPa. Similarly, and benzene do not provide any indication of recent biomass
MEK increases from 0.05 to 0.7 ppbv at 15:35 h. MEK is an burning influence in the air mass.
indicator of industrial and gasoline engine emissions, and its Summarising, the variability of the trace gases measured
major sink is the reaction with OH producing acetaldehyde. at the second pressure level of the intercomparison exercise
Apart from biogenic emissions, CH3 OH is produced by reac- indicate changes in the composition of the air mass sampled
tion of the methylperoxy radical with itself and other organic which can reasonably be correlated to the variability of the
peroxy radicals (Madronich and Calvert, 1990; Tyndall et al., local peroxy radicals measured.
2001):
CH3 O2 + CH3 O2 → CH3 O + CH3 O + O2 (R1a)
CH3 O2 + CH3 O2 → CH3 OH + HCHO + O2 (R1b)
www.atmos-chem-phys.net/10/10621/2010/ Atmos. Chem. Phys., 10, 10621–10638, 201010632 M. D. Andrés-Hernández et al.: Peroxy radical partitioning during AMMA
Fig. 9. [RO∗2 ]/[HO ] ratio
Fig.29. [ROmeasured during
∗ ]/[HO ] ratio the AMMA
measured intercomparsion
during exercise. In blueexercise.
the AMMA intercomparsion and green In are
bluetheand
data corresponding
green are the to the first
2 2
pressure level measured (697 hPa).
data5:corresponding
Fig. [RO2*]/[HO2] ratiotomeasured
the firstduring
pressure level intercomparsion
the AMMA measured (697 hPa). In blue and green are the data corresponding to the first pressure
exercise.
level measured (697 hPa)
4.3 Radical partitioning [HO2 ]/[CH3 O2 ] ratio. The [RO2 ]/[HO2 ] ratios vary mostly
between 1:1 and 2:1 during the intercomparison exercise and
Figure 9 shows the ratio ([RO∗2 -DUALER]/[HO2 ]) for both CH3 O2 is expected to constitute 88% of the total organic per-
measured levels. At 697 hPa, both the variability of the mea- oxy radicals (see Sect. 4.4). Under these conditions the ex-
sured mixing ratios and the number of HO2 measurements perimental [RO∗2 -DUALER] reported in this work might be
available is smaller and the ratio seems to remain quite stable 8 to 16% overestimated.
around 2.5. This ratio is more scattered at 485 hPa, remain- Radical partitioning over the whole AMMA campaign
ing between 1 and 3 as result of the variability of [RO∗2 ] dis- derived from the simultaneous measurement of [RO∗2 ] and
cussed above. There are only a few [RO∗2 ]/[HO2 ] values re- [HO2 ] on board the BAe-146 is discussed more in detail in
ported for the upper troposphere (1.86: Cantrell et al, 2003a; Brookes (2009).
1.25: Cantrell et al., 2003c). It is important to emphasise
that [RO∗2 ]/[HO2 ] is not expected to be constant but to be di- 4.4 Modelling of radical concentrations
rectly related to the NO and VOC content and history of the
air mass sampled. Comparisons between modelled [HO2 ] and [RO∗2 ] with ob-
∗
A similar comparison between [HO2 ] and [RO2 ] measured servations are shown in Figs. 10–12. As mentioned above,
by LIF and Chemical Ionisation Mass Spectrometry (CIMS) HO2 was only partially measured at 697 hPa and RO∗2 -
respectively was undertaken within the TRACE-P measure- PeRCA 4 is completely unavailable for the second intercom-
32 parison period. This reduces drastically the statistics and rep-
ment campaign (Eisele et al., 2003; Cantrell et al., 2003a, b).
The [RO∗2 ] versus [HO2 ] average data, are quite scattered as resentativeness of the results obtained within the intercom-
expected since the [RO2 ]/[HO2 ] ratio is not necessarily con- parison exercise.
stant during the three sets of intercomparison flights, but can At a first glance the model results in Fig. 10 seem to gen-
reasonably be fitted by a slope of 2.46. erally overestimate [HO2 ] during the intercomparison exer-
The CL of the DUALER measured in the laboratory is an cise, which results in some overprediction of total modelled
[RO ∗ ]. It is possible that flying adjacent to the D-Falcon may
effective CL (eCL) coming from the chain reaction of the 2
radicals not being lost in the pre-reactor nozzle. As the per- have had some effect on the flow conditions within the FAGE
oxy radicals are reacting rapidly with the walls, the losses at inlet, resulting in greater loss of HO2 in the inlet and reduced
this nozzle before the addition of CO and NO are expected HO2 detection compared to calibration conditions, although
to be important. According to the laboratory characterisation such effects have not been reported in previous aircraft HOx
of the response of the DUALER for different peroxy radi- intercomparison exercises (Eisele et al., 2003). This might
cals (Kartal et al., 2010), higher eCL is to be expected for partly explain the stepwise temporal evolution of [HO2 ] ob-
CH3 O2 than for HO2 as a consequence of lower wall losses served at 485 hPa.
of CH3 O2 in the pre-reactor nozzle. Using a common eCL It is important noting that the use of the model in particular
∗
for the determination of [RO2 ] in ambient samples as dur- for the AMMA intercomparison period is subject to impor-
ing AMMA can cause an overestimation depending on the tant restrictions derived from following issues:
Atmos. Chem. Phys., 10, 10621–10638, 2010 www.atmos-chem-phys.net/10/10621/2010/M. D. Andrés-Hernández et al.: Peroxy radical partitioning during AMMA 10633
Fig. 10. Comparison of model and observations ([HO2 -FAGE] in dark blue, [RO∗2 -DUALER] in blue *and [RO∗2 -PeRCA
∗ -DUALER] ∗-
4] in red) for the
Figure
Fig. 10. 10: Comparison
Comparison of observations
of model and model and observations
([HO2 -FAGE] ([HO 2]blue,
in dark in dark
[ROblue,
2
[RO2 -D-Falcon] in blue
in blue and [RO 2 1 D) measured on
697 hPa pressure level during the* intercomparison exercise. Model results (triangles) are constrained to j (NO2 ) and j (O
PERCA and4][RO 2 -BAe-146]
in red) 697 in red) for the 697 hPa the
pressure level during the intercomparison exercise.
board the BAe-146. The periods of for
thethe hPa pressure
intercomparison arelevel during
highlighted in intercomparison
the top figure inexercise.
yelow. Model results (triangles)
Model results (triangles) are1 constrained to j(NO2) and j(O1D) measured on board the BAe-146.
are constrained to j (NO2 ) and j (O D) measured on board the BAe-146. The periods of the intercomparison
are highlighted in the top figure in yelow.
33
Fig. 11. Comparison ofFigure
model11: andComparison
observations of([HO 2 ] inand
model blue, [RO∗2 -DUALER]
darkobservations ([HO 2] in
in blueblue,
dark [RO∗2*-PeRCA
and [RO -D-Falcon]4] ininred) for the 697 hPa
∗ - blue
Fig.the
pressure level during 11. intercomparison
Comparison
*
of model and Model
exercise. observations ([HO
results 2 ] in dark
(triangles) blue,
are [RO∗2 -DUALER]
constrained to j (NOin) blue and [RO
measured on 2 board the D-Falcon
and [RO2 -BAe-146] in red) for the 697 hPa pressure level during the intercomparison 2 exercise.
scaled to the j (NOPERCA
2 )-BAe4] in red)measured
values for the 697
at hPa
697pressure
hPa. The level duringofthe
periods theintercomparison
intercomparisonexercise. Model results
are highlighted (triangles)
in the top figure in yelow.
Model results (triangles) are constrained to j(NO2) measured on board the D-Falcon scaled to the
are constrained to j (NO2 ) measured on board the D-Falcon scaled to the j (NO2 )-BAe values measured at
j(NO2)-BAe values measured at 697 hPa.
697 hPa. The periods of the intercomparison are highlighted in the top figure in yelow.
(a) Photolysis rates: 25% higher than the j (NO2 )-BAe-146 measurement (see
Fig. 7). Scaling of the j (NO2 )-D-Falcon to the values
As described in Sect. 3, the DSMACC model requires observed on the BAe-146 gives similar results to model
observations of j (NO2 ) and j (O1 D), which were not avail- results constrained to the BAe-146 photolysis results, and
able for the second altitude level. The existing discrepancies provides some additional data points during the second
between j (NO2 ) measured on board the BAE-146 and D- intercomparison period (Fig. 11). The agreement between
Falcon prevent the direct use of the j (NO2 )-D-Falcon data [HO2 ] modelled and measured improves and the modelled
for the 485 hPa pressure level without introducing unknown [RO∗2 ] for the second period show good agreement on the
uncertainties. Model runs using j (NO2 )-D-Falcon show average with the observed [RO∗2 -DUALER] though the short
higher radical concentrations than model runs constrained term variability of the observations is not completely picked
to photolysis rates measured on the BAe-146 as expected up (Fig. 12).
since the j (NO2 )-D-Falcon measurement is systematically
www.atmos-chem-phys.net/10/10621/2010/ Atmos. Chem. Phys., 10, 10621–10638, 2010
3410634 M. D. Andrés-Hernández et al.: Peroxy radical partitioning during AMMA
instruments deployed, the comparison of the model with a
reliable experimental reference as described in Sect. 3 is not
possible.
The importance of some of these issues in the application
of box models to observationally based predictions of HOx
radicals has been recently evaluated by Olson et al. (2004,
2006). The present work intends to focus on the analysis of
the uncertainties of experimental data rather than on the com-
parison with model results. Given the limitations described
above and the inherent challenges of the airborne radical
measurement and modelling, the overestimate of HO2 during
the intercomparison period does not appear to be an indica-
tion of an inability in the model to replicate observations of
HO2 . In fact there is no significant overestimation of mea-
sured [HO2 ] for the modelling of the AMMA campaign as
a whole, as discussed in Stone et al. (2010) and summarised
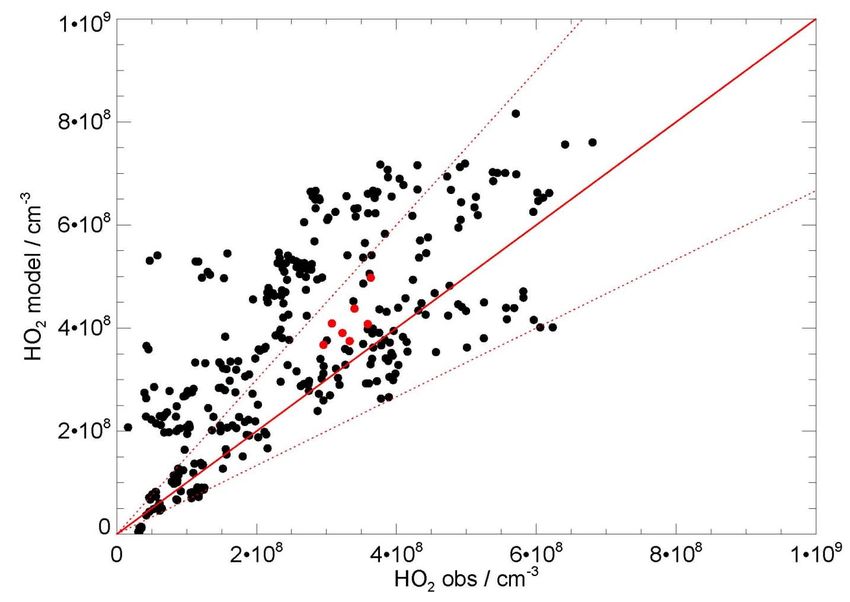
in Fig. 14. The major uncertainty in the model derives from
the uncertainty in the measured photolysis rates. Model sen-
sitivity to input parameters, is discussed in detail in Stone
et al. (2010), and show that any overestimation of radical
species in the model may be explained by the uncertainty in
Fig.Fig.
12. [HO12. [HO
2 +RO 2 +versus
2 ] model RO2[RO
] model versus [RO∗2 ]D-Falcon
∗ ] observations on board the
2 observations on board
for both altitudes during the measured photolysis rates. The model does, however, repli-
AMMAthe intercomparison
D-Falcon exercise.
for both altitudes
The model during
is constrained the
to j (NO AMMA
2 ) measured intercompari-
on board the D-Falcon scaled
cate the variability in observations, as shown in Figure 14 and
to the
sonj (NO 2 )-BAe values measured
exercise. at 697 hPa.
The model is constrained to j (NO2 ) measured on
* evidenced by the r 2 correlation coefficient of 0.75 between
O2+RO2] model board versus
the [RO 2 ] observations
D-Falcon scaled to the on jboard
(NO2the )-BAe D-Falcon
values for both altitudes
measured at during the AMMA
the modelled and measured HO2 concentrations.
son exercise. The model
697 hPa. is constrained to j(NO 2 ) measured on board the D-Falcon scaled to the j(NO2)-BAe
ured at 697 hPa. Rates of production/destruction analyses
(ROPAs/RODAs) for the model run using photolysis
rates measured on the BAe-146 indicates that the domi-
Concerning j (O1 D), the BAe-146 measurements may nant reactions responsible for HO2 production during the
have been subject to a systematic 35
bias derived from the intercomparison periods were OH + CO (39%), CH3 O + O2
non-linearity of j (O1 D) calibration factors for total O3 (15%), HCHO + OH (10%) and HCHO photolysis (9%).
column, temperature and solar zenith angle, as described While individual contributions to HO2 production from
in Stone et al. (2010) and Brookes (2009). This results RO + O2 reactions are relatively small, they do contribute
in a potential requirement for reduction in j (O1 D) by a significantly to the remainder of the total.
factor of 0.7. The bias appears more significant at altitudes Dominant loss processes for HO2 were HO2 + NO,
above 4 km where the impact of cloud and aerosol is much comprising 35% of the total loss, HO2 + HO2 (28%),
reduced. A similar correction to the j (O1 D) in the model did HO2 + CH3 O2 (11%) and O3 + HO2 (8%). Cycling of HO2
result in a lowering of the modelled HO2 , and although the between the HO2 and HO2 NO2 was also a significant process
reduction in j (O1 D) rectifies much of the overestimation for during the intercomparison periods, and reactions of HO2
HO2 in the model, it was not sufficient to explain the model with RO2 species also contributes significantly to the total
discrepancy during the intercomparison period. HO2 loss.
The dominant peroxy species in terms of HO2 loss were
(b) Input of trace gas observations: also the most abundant RO2 species in the model, with
CH3 O2 constituting 88% of the total organic peroxy radi-
There are a limited number of VOC observations at cal concentration. A more detailed RO2 speciation from the
high temporal resolution during the intercomparison period. model is given in Table 2.
As the input for the model is updated every 60 s, the use of
WAS samples with 15 min resolution can introduce unrealis-
tic stepwise significant variations in the mixing ratio of trace 5 Summary and conclusions
gases. In addition, as reported on Reeves et al. (2010) the
HCHO measured on board the BAe-146 showed unrealistic The measurement of peroxy radicals requires the use of very
oscillations during the intercomparison exercise. Figure 13 sensitive and well calibrated measurement techniques. Ow-
compares the HCHO output of the model with the HCHO ing to the particular complexity of airborne measurements,
measured on board the D-Falcon. Furthermore, as the NOx any laboratory characterisation must however be accompa-
mixing ratios remained below the detection limit of the nied by in flight intercomparisons and calibrations of the
Atmos. Chem. Phys., 10, 10621–10638, 2010 www.atmos-chem-phys.net/10/10621/2010/You can also read