Response of a remnant marmot population to habitat enhancement yields insights into marmot ecology
←
→
Page content transcription
If your browser does not render page correctly, please read the page content below
Journal of Mammalogy, 101(3):658–669, 2020
DOI:10.1093/jmammal/gyaa021
Published online March 28, 2020

Response of a remnant marmot population to habitat enhancement
yields insights into marmot ecology
Melissa J. Reynolds-Hogland,* Alan B. Ramsey, August T. Seward, Kristine L. Pilgrim, Cory Engkjer,
and Philip W. Ramsey
Wildlife Research and Education Foundation, Frenchtown, MT 59834, USA (MJR-H)
MPG Ranch, Florence, MT 59833, USA (ABR, ATS, PWR)

                                                                                                                                               Downloaded from https://academic.oup.com/jmammal/article/101/3/658/5813001 by guest on 06 November 2020
USDA Rocky Mountain Research Station, Missoula, MT 59801, USA (KLP, CE)
* Correspondent: mjreynoldshogland@gmail.com

         We evaluated the response of a remnant population of yellow-bellied marmots (Marmota flaviventris) to targeted
         habitat enhancement in an ecological system that had been degraded during ~100 years of intensive livestock
         management, including marmot eradication. We used capture-recapture data and a novel use of a multistate
         framework to evaluate geographic expansion of the marmot population pre- and post-habitat enhancement. We
         also estimated age-structured survival, reproduction, and sex ratios. The marmot population appeared to respond
         positively to new habitat opportunities created by habitat enhancement: the number of marmots captured increased
         from three marmots pre-habitat enhancement to 54 (28 adults and yearlings, 26 young) post-habitat enhancement
         at the end of the study. Marmots expanded geographically by transitioning into habitat-enhanced areas, and adult
         females occupied and reproduced in all habitat-enhanced areas. The sex ratio of the young population in 2019
         was strongly female-biased, which may have been influenced by poor body condition of breeding females owing
         to unusually prolonged snow cover that year. Adult and yearling survival were within the range of that reported
         for colonial adults and yearlings in Colorado. Our results suggest that active habitat enhancement can assist in the
         recovery of marmot populations in systems where marmots historically existed.

         Key words:    conservation, demography, habitat transition, Montana, multistate models, restoration, sex ratio

Degraded, fragmented, and damaged ecosystems resulting from                 members have been eliminated or have drastically declined,
human-altered landscapes threaten biodiversity worldwide                    often involves species reintroduction efforts (e.g., wolf rein-
(Sala et al. 2000; Wilson et al. 2016). Assisting in the recovery           troduction in Yellowstone National Park; Gunnison’s prairie
of such ecosystems is the foundation of ecological restoration              dogs [Cynomys gunnisoni] in New Mexico—Davidson et al.
(SER 2004), a rapidly developing field of research (Wortley                 2018), and is beginning to include habitat enhancement sin-
et al. 2013). Increasingly, studies of ecological restoration are           gularly targeted for the species of interest. For example, par-
incorporating measures of wildlife response, which is essential             ticular native shrubs (e.g., seacoast marsh elder, Iva imbricata
to evaluating the efficacy and value of restoration efforts (Miller         Walter) were planted expressly to enhance habitat for the en-
and Hobbs 2007; Suding 2011; Vesk et al. 2015). For example,                dangered Perdido Key beach mouse (Peromyscus polionotus
recent studies have evaluated the response of small mammals                 trissyllepsis) in Florida after the species’ habitat was damaged
(Smith and Gehrt 2010; Larsen et al. 2016), snowshoe hares                  by storms (Stoddard et al. 2019). In Hungary, Russian olive
(Kumar et al. 2018), and large mammals (Stokes et al. 2011) to              trees (Elaeagnus angustifolia) and certain scrub species were
forest system restoration, as well as small mammal response                 removed to enrich habitat for the vulnerable European ground
to grassland system restoration (Mulligan et al. 2013; Mérő                 squirrel (Spermophilus citellus—Kenyeres et al. 2018).
et al. 2015), riparian system restoration (Golet et al. 2011), and             For our study, we implemented targeted habitat enhancement
desert scrub system restoration (Patten 1997).                              for a population of yellow-bellied marmots that had been deci-
   Ecological restoration aimed at reestablishing ecosystem                 mated due to human impact, and measured marmot response
processes by increasing a specific wildlife population, whose               pre- and post-habitat enhancement. Although yellow-bellied

© The Author(s) 2020. Published by Oxford University Press on behalf of the American Society of Mammalogists.
This is an Open Access article distributed under the terms of the Creative Commons Attribution Non-Commercial License
(http://creativecommons.org/licenses/by-nc/4.0/), which permits non-commercial re-use, distribution, and reproduction in any medium,
provided the original work is properly cited. For commercial re-use, please contact journals.permissions@oup.com

                                                                      658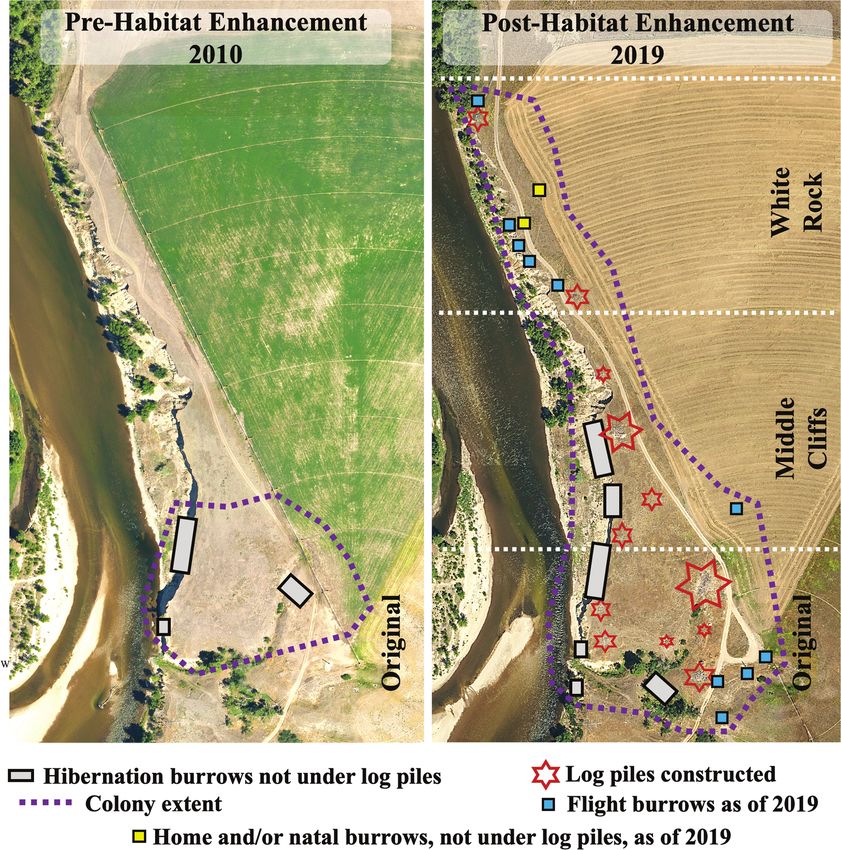
REYNOLDS-HOGLAND ET AL.—MARMOT RESPONSE TO HABITAT ENHANCEMENT 659
marmots are not listed as endangered or threatened, local colo successful. Finally, we evaluated annual survival of the marmot
nies of marmots that have been persecuted over long periods colony and documented sex ratios for comparison with those of
can all but disappear, resulting in degraded ecosystems. Yellow- other marmot colonies.
bellied marmots are important to the stability of ecological
communities of which they are a part because they are prey for
numerous predator species, including coyotes (Canis latrans), Materials and Methods
raptors, American martens (Martes americanus), long-tailed Study area.—Our study was conducted on MPG Ranch
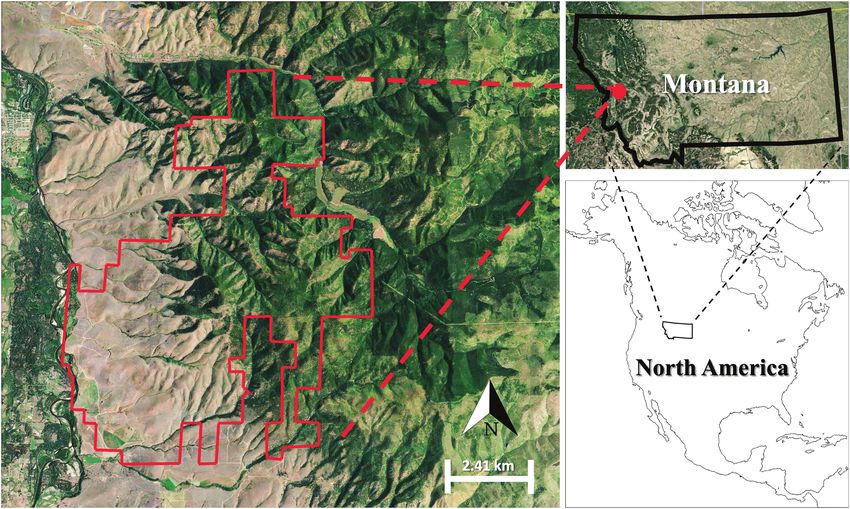
weasels (Mustela frenata), red foxes (Vulpes vulpes), and (46°42′26″”N, 114°00′16″W), a 6,191-ha conservation prop-
American black bears (Ursus americanus—Van Vuren 1991, erty located in the Northern Sapphire Mountains in western
2001; Harrison et al. 2019). Montana, United States (Fig. 1). MPG Ranch consists primarily
Yellow-bellied marmots have been the focus of previous of open, west-facing, grass-covered slopes with narrow decidu
Downloaded from https://academic.oup.com/jmammal/article/101/3/658/5813001 by guest on 06 November 2020
research, revealing important insights into marmot popula- ous woody draws that lead to bottomland riparian cover spe-
tion demography (Oli and Armitage 2004; Ozgul et al. 2007; cies of the Bitterroot River floodplain (Noson and Rodriguez
Borrego et al. 2008), sociality and matrilines (Armitage 1984; 2015) with alfalfa fields adjacent to the river. The climate is
Armitage 2013), antipredator behaviors (Blumstein et al. 2009), temperate with sunny summers lasting ~3 months and snowy
and communication (Blumstein and Récapet 2009). However, winters lasting ~5 months. Elevations range from the summit
the response of a remnant marmot colony to habitat enhance- of Mount Baldy (1,833 m) to the river floodplain (966 m). Tree
ment remains to be evaluated. As landscape management shifts species include Douglas-fir (Pseudotsuga menziesii), subalpine
away from intensive resource extraction toward ecologically fir (Abies lasiocarpa), Ponderosa pine (Pinus ponderosa), and
sustainable resourcing and restoring ecological processes, quaking aspen (Populus tremuloides). The marmot colony we
understanding how to restore local populations of previously studied existed along the western edge of MPG Ranch, adjacent
diminished wildlife, such as marmots or prairie dogs, will be- to the Bitterroot River. The entire colony lived in an area of ~2
come increasingly important. Moreover, demonstrating that the ha; elevation within the colony area ranged between 1,060 and
response of a marmot population to habitat enhancement can be 1,075 m above sea level.
quantified and rigorously analyzed is important to marmot con- Habitat enhancement.—Marmots require adequate water, hi-
servation and broadly relevant to mammal conservation, resto- bernation opportunities, availability of grasses and forbs, and se-
ration, and research. curity cover such as rock outcrops (Svendsen 1974; Ozgul et al.
Restoring ecological processes has been a broad objective of 2006), under and near which marmots dig burrows (Blumstein
our work, as the landscape that the marmot colony of interest and Pelletier 2005). On MPG Ranch, alfalfa (Medicago stavia)
occupies (MPG Ranch) is a conservation landscape that has and water were available throughout the marmot active period
been undergoing ecological restoration, and the focus of res- each year, but large rock outcrops were sparse. We therefore fo-
toration research, starting in 2009 (Lekberg et al. 2013; Herget cused habitat enhancement efforts on constructing security log
et al. 2015; Mummey and Ramsey 2017). Although marmots piles, which we hoped would serve as surrogates for rock out-
historically occupied an area called Woodchuck Creek on MPG crops, where marmots could watch for predators and thermo-
Ranch, as evidenced by Salish place names and oral traditions regulate, as well as dig burrows (hibernacula, natal, and home).
documented by Malouf (1974), marmots had all but disap- We constructed security log piles in the area where the rem-
peared from MPG Ranch by 2009 because the ranch had by nant marmot population was observed, near Woodchuck Creek,
then been intensively managed for livestock for 100+ years; during 2009–2013 (Original burrows area), and in two addi-
during that time, marmots were shot on sight. In 2009, MPG tional areas north of the Original burrows area (Middle Cliffs
Ranch was purchased and immediately transitioned into a con- and White Rock burrows areas; Fig. 2). Habitat enhancement
servation property. Despite a moratorium on marmot shooting efforts spanned 3 years: 2014–2016. During summer 2014, we
initiated in 2009, the remnant marmot population had not created one large and two small log piles in the Original bur-
shown signs of recovery by 2013. We therefore began targeted rows area, one large and three small log piles in the Middle
habitat enhancement in 2014 to potentially help restore the Cliffs burrows area, and two small log piles in the White Rock
marmot population. burrows area. During summer 2015, we constructed three small
We lacked specific information about the reference condition log piles in the Original burrows area and expanded one small
of the marmot population prior to 2009. We therefore made a log pile in the White Rock burrows area. In summer 2016, we
general prediction that marmots would respond to habitat en- incorporated 49 m2 of concrete slabs (each slab was 0.3–1.2 m2)
hancement by increasing in number and expanding geograph- into the large log pile at Middle Cliffs burrows area.
ically into habitat-enhanced areas. Because social systems of To construct the security log piles, we stacked logs (~20 logs
yellow-bellied marmots consist of closely related female kin for smaller piles, ~50 logs for larger piles) to a height of ~3
groups, with mother–daughter–sister groups or matrilines m, like a teepee, covering an area of approximately 2.4 m ×
(Armitage 1984, 2002), one benchmark of our restoration work 2.4 m for small piles and 4.6 m × 4.6 m for large piles. Logs
(sensu Block et al. 2001) was that adult females would occupy came from thinning and beetle control actions in the upland
all enhanced habitat areas. Another benchmark was that adult forests on MPG Ranch. We used both ponderosa pine brood
females in enhanced habitat areas would be reproductively trees (trees cut while infested with pine bark beetles; 20–50 cm660 JOURNAL OF MAMMALOGY
Downloaded from https://academic.oup.com/jmammal/article/101/3/658/5813001 by guest on 06 November 2020
Fig. 1.—The ~2-ha colony of yellow-bellied marmots (Marmota flaviventris) was located on the western border of MPG Ranch (red outline), a
6,191-ha conservation property in western Montana.
stem diameters) and smaller Douglas-fir trees (3–20 cm stem
diameters). Log piles were placed near steep banks adjacent to
the Bitterroot River and within 200 m of alfalfa fields, which
were irrigated throughout each summer season during the study
period. Because marmots that disperse > 500 m are less likely
to survive (Van Vuren 1990), we placed security log piles < 500
m from other security log piles to minimize mortality due to
movements over long distances.
Trapping marmots.—From fall 2013 to spring 2019, we
livetrapped yellow-bellied marmots using Tomahawk live trap
model 608.5 (Tomahawk Live Trap, Hazelhurst, Wisconsin)
for 2 weeks each August, immediately pre-immergence (here-
after termed “fall”) and each March or April, immediately post-
hibernation and pre-birth (hereafter termed “spring”), except
during fall 2015 during which time we trapped only 3 days, and
during fall 2017 when trapping was cancelled due to logistical
constraints. Except during fall 2015 and fall 2017, we continued
trapping until we had reasonable assurance of having captured
all marmots on site. We pit tagged each marmot upon first cap-
ture (HPT 12PLT 8mm; Biomark, Boise, Idaho), scanned each
recaptured marmot (Biomark Global Pocket Reader Plus, Boise,
Fig. 2.—The yellow-bellied marmot (Marmota flaviventris) colony
Idaho), recorded trap location, and collected hair for DNA ana-
on MPG Ranch in western Montana, pre- and post-habitat enhance-
ment during 2010–2019. Stars represent areas where we constructed
lyses. Beginning in spring 2014, we recorded size based on
security log piles, gray rectangles represent hibernation burrows con- visual observation (VO; small or large) while marmots were
structed by marmots, blue squares represent flight burrows created by in-hand. If marmots were clearly pups or yearlings, they were
marmots, and yellow squares represent home or natal burrows con- documented as “small.” If marmots were adults, they were docu-
structed by marmots located near, but not under, security log piles. mented as “large.” Beginning in fall 2018, we recorded sex whileREYNOLDS-HOGLAND ET AL.—MARMOT RESPONSE TO HABITAT ENHANCEMENT 661
marmots were in-hand and confirmed sex via DNA analyses. period, so we created encounter histories based on a 1-season
Beginning in spring 2019, we recorded mass (kg). Marmots that time interval for each marmot during fall 2013 to spring 2019
weighed < 2 kg were categorized as yearlings and those that (i.e., 12 encounter periods). We included fall 2015 and fall
weighed ≥ 2 kg were categorized as adults (Borrego et al. 2008). 2017 in all marmot encounter histories, but constrained these
Beginning in early summer 2019, we livetrapped marmot pups two encounters to zero. We included data from each fall and
immediately post-emergence from natal dens until all pups were spring capture because important information about marmot
thought to have been captured. We weighed, determined the sex, transitions among habitat states were only obtainable by in-
and pit tagged all pups, and we collected hair for DNA analyses cluding both fall and spring data. For example, if marmot x was
to confirm identification and sex. During all trap sessions, we captured during fall in habitat state “Original burrows area”
monitored traps from a research station located 1.2 km from the and recaptured the following spring in habitat state “White
marmot colony, using a network of live-feed video cameras with Rock burrows area,” then evaluating only spring capture data
Downloaded from https://academic.oup.com/jmammal/article/101/3/658/5813001 by guest on 06 November 2020
zoom, tilt, and pan capabilities (Model Q6114-E PTZ Dome; or pooling seasonal data for annual analyses would have re-
Axis Communications, Lund, Sweden), and processed marmots sulted in lost information critical to this particular evaluation.
immediately after capture. Because we used live-feed video to Although this data structure was suitable for understanding
observe marmot captures from a distance, trap effort was intense transition probabilities among habitat states, using seasonal
in that we were able to set and reset traps multiple times daily data within a multistate framework to simultaneously estimate
until we felt all marmots had been captured. In addition to cap- annual survival for this population using this data set was not
turing marmots, we observed marmot activity throughout MPG optimal because trap effort was not equal for two fall sessions.
Ranch to identify new sites of marmot occupancy outside the We therefore modeled age-structured survival separately using
2-ha colony. We used 243 cameras (75 buckeye cameras with live only spring capture data and a Cormack–Jolly–Seber model
images, 126 trail cameras, 17 internet protocol cameras, 13 time (see “Modeling age-structured survival” section below).
lapse cameras, and 12 video cameras). All procedures followed Modeling transition probabilities.—Data were insufficient to
ASM guidelines (Sikes et al. 2016) and complied with the re- estimate transition probabilities among all three habitat states,
quirements of the Institutional Animal Care and Use Committee so we collapsed the two northernmost burrow areas into one
for Montana Fish Wildlife and Parks (IACUC # FWP16-2013 habitat state. Thus, we estimated ψ between the Original bur-
through IACUC # FWP03-2019, Missoula, Montana). rows area habitat state (O) and the North burrows area hab-
DNA methods.—We extracted genomic DNA from hair sam- itat state (N), with the latter including Middle Cliffs burrows
ples using the QIAGEN DnEasy Blood and Tissue kit (Qiagen, area and White Rock burrows area. We used the multistate
Valencia, California) according to the manufacturer’s instruc- recaptures-only model in Program Mark (White and Burnham
tions for tissue, and using modifications for hair samples from 1999) to estimate the probability of individual i transitioning
Mills et al. (2000). We carried out sex identification using DNA
from Original habitat state to North habitat state = ψON i,t , and
by amplifying the male specific minor histocompatibility com-
the probability of individual i transitioning from North habitat
plex antigen (Smcy) along with a microsatellite control using
primers UroSmcF/MarSmcR, and GS14F/GS14R (Gorrell et al. state to Original habitat state = ψNOi,t , between occasion t and
2012). Reaction volumes of 20 μl contained 50–100 ng DNA, 1× t + 1, and recapture probability (p). We held survival (φ) con-
reaction buffer (Thermo Fisher, Carlsbad, California), 2.5 mM stant. We evaluated goodness of fit of the most parameterized
MgCl2, 200 μM each dNTP, 1 μM each primer, 1 U Titanium model (i.e., the global model) using a bootstrap approach with
Taq polymerase (Takara Bio USA, Inc., Mountain View, 1,000 simulations. We estimated the overdispersion parameter
California). The PCR program was 94°C/5 min, [94°C/1 min, (c) and, in the case of overdispersion, we adjusted c-hat accord-
54°C/1 min, 72°C/1 min 30 s] × 34 cycles, 72°C/5 min. The ingly. We used Akaike’s information criterion (Akaike 1973)
quality and quantity of template DNA were determined by adjusted for sample size (QAICc) to rank models in terms of
2.5% agarose gel electrophoresis. their ability to explain the data. Models with ΔQAIC values <
Modeling transition probabilities in a multistate 2.0 were considered to have substantial support (Burnham and
framework.—To evaluate whether the marmot population ex- Anderson 2002). We evaluated Akaike weights for each model.
panded geographically, we analyzed the capture-reencounter Prior to modeling transition probabilities between habitat
data using a multistate framework to estimate transition prob- states, we conducted preliminary analyses to determine the best
abilities (ψ) among habitat states. We assigned habitat states parameterization for recapture probability (p). Based on marmot
based on burrow area of marmot capture. Burrow areas were biology and our study design, p may have been affected by
grouped into three categories: Original burrows area, Middle season. Theoretically, p should have been relatively high during
Cliffs burrows area, and White Rock burrows area (Fig. 2). On spring sessions because spring trapping occurred pre-birth when
the rare occasion that a marmot was captured in more than one all marmots in the population would have been available for
of the three burrow areas during a single 2-week trapping ses- capture during the previous fall. Similarly, p should have been
sion, we assigned the first capture location as the habitat state relatively low during fall sessions because fall trapping occurred
for that marmot for that session. post-birth when young of the year were available for first cap-
Encounter histories.—We were interested in evaluating tran- ture. We therefore tested the effect of trap season on p, relative
sition probabilities among habitat states throughout the study to the fully time-varying model and the null model.662 JOURNAL OF MAMMALOGY
For preliminary analyses, we also wanted to know if p was marmot size. For every marmot captured during spring 2019,
affected by habitat enhancement efforts. We evaluated p as a we first documented age class for each marmot based on VO of
function of three possible pre- and post-habitat enhancement marmot size while the marmot was in-hand. We then weighed
time periods to coincide with the three habitat enhancement each marmot and assigned an age class according to mass. We
periods that occurred at MPG Ranch: 1) habitat enhancement subsequently compared age class based on VO of marmot size,
that occurred in summer 2014 {pre-habitat enhancement = time to age class based on marmot mass, for each marmot.
prior to summer 2014}; 2) habitat enhancement that occurred We used an age-structured Cormack–Jolly–Seber model
in summer 2015 {pre-habitat enhancement period = time prior (Lebreton et al. 1992) in Program Mark (White and Burnham
to summer 2015}; and 3) habitat enhancement that occurred in 1999) to estimate age specific φ and p. Although there can be
summer 2016 {pre-habitat enhancement period = time prior to at least three marmot age classes (juveniles, yearlings, and
summer 2016}. For example, we evaluated the effect of restora- adults—Ozgul et al. 2006), we included only two age classes
Downloaded from https://academic.oup.com/jmammal/article/101/3/658/5813001 by guest on 06 November 2020
tion efforts that occurred during summer 2014 by constraining (yearlings and adults) because our analyses were based on cap-
p among trap sessions prior to summer 2014 (pre-habitat en- ture data only collected during spring sessions, when all mar-
hancement) to be equal and simultaneously constraining p mots were either adults or yearlings. Marmots are considered
among trap session after summer 2014 (post-habitat enhance- adult by age 2, so we modeled age-structured φ by partitioning
ment) to be equal. φ of yearlings into two groups: 1) φ during the first 1-year
To account for two missing trap sessions during fall 2015 interval when yearlings were between 1 and 2 years old; and
and fall 2017, we constrained p for those two periods to be 2) φ during all other 1-year intervals, after yearlings had transi-
equal, both of which were zero. We evaluated goodness of fit tioned into adults. Survival of marmots categorized as adults at
of the most parameterized model (i.e., the global model) using first capture was modeled the same as yearlings that had tran-
a bootstrap approach with 1,000 simulations. We estimated c sitioned to adults.
and, in the case of overdispersion, we adjusted c-hat accor Apparent survival was bounded between 0 and 1, so we used
dingly. We used Akaike’s information criterion (Akaike 1973) the logit link to develop models of φ. We modeled φ and p as
adjusted for sample size (QAICc) to rank models in terms of a function of age structure, time, age class (age at first capture
their ability to explain the data. Models with ΔQAIC values without age structure), and the interaction between age class
< 2.0 were considered to have substantial support (Burnham and time. We evaluated goodness of fit of the most parameter-
and Anderson 2002). We evaluated Akaike weights for each ized model, φ(t * g) p(t * g), using a bootstrap approach with
model. After selection of the best parameterization for p, we 1,000 simulations (Franklin et al. 2004). We estimated c and, in
modeled habitat transition probabilities ( ψON NO
i,t , ψi,t ) as a fully
the case of overdispersion, we adjusted c-hat accordingly. We
time-varying function and as a function of habitat enhancement used Akaike’s information criterion adjusted for sample size
efforts using the three possible pre- and post-habitat enhance- (QAICc—Akaike 1973) to rank models in terms of their ability
ment time periods, using the methods described above for pre- to explain the data. Models with ΔQAIC values < 2.0 were
liminary analyses of p. considered to have substantial support (Burnham and Anderson
Modeling age-structured survival.—Using an information 2002). We evaluated Akaike weights for each model.
theoretic approach (Burnham and Anderson 1998), we evalu-
ated the effect of age structure on apparent survival (the prob-
ability that the animal is alive and remains in the study area, Results
hence is available for recapture; φ) and p. We created encounter Marmot captures.—During fall and spring trap sessions
histories, based on a 1-year time interval, for each marmot cap- 2013–2019, we captured 112 individual yearling and adult
tured during spring trapping sessions, 2014–2019. We included marmots 319 times. Because we intensively trapped marmots
data only from spring trap sessions to ensure equal trap effort during trap sessions, we believe we captured most individuals
among trap sessions. In so doing, our analyses included annual of the population that were present and available for capture (or
pre-birth sample data. Pups captured during early summer 2019 recapture), barring fall 2015 and fall 2017. Overall, the number
were not included in this analysis. of unique individuals captured was relatively low at the begin-
Ideally, it is best to evaluate survival by age class and sex si- ning of the study, increased through spring 2017, decreased
multaneously, but our sample size of known-sex individuals was during spring 2018, and increased again through spring 2019
too small; we therefore focused on possible age class effect. (Fig. 3). A relatively small number of marmots were captured
Marmots that were visually observed as “small” at first capture pre-habitat enhancement, all of which were localized in the
during spring 2014 to fall 2018, or those that weighed < 2 kg at Original burrows area. Post-habitat enhancement, the overall
first capture during spring 2019 were categorized as yearlings at number of marmots captured increased and the number of mar-
first capture. Marmots that were visually observed as “large” at mots captured in areas north of the Original burrows area in-
first capture during spring 2014 to fall 2018, or those that weighed creased. More individuals were captured at the Middle Cliffs
≥ 2 kg at first capture during spring 2019 were categorized as burrows area compared to the White Rock burrows area.
adults at first capture. During spring 2019 trapping, we con- We documented sex for 47 unique nonpup individuals
ducted a double-blind test to evaluate the accuracy of our early (12M:35F) during fall 2018 and spring 2019 (Fig. 4). Most
method of categorizing age class based on visual observation of captured marmots in fall 2018 were subadults (95%). By springREYNOLDS-HOGLAND ET AL.—MARMOT RESPONSE TO HABITAT ENHANCEMENT 663
Downloaded from https://academic.oup.com/jmammal/article/101/3/658/5813001 by guest on 06 November 2020
Fig. 3.—The number of unique yellow-bellied marmot (Marmota flaviventris) individuals captured at the three burrow areas (Original, Middle
Cliffs, and White Rock burrows) during each trap session fall 2013 to spring 2019, in relation to timing of habitat enhancement on MPG Ranch in
western Montana. Because research trapping did not occur during fall 2015 or fall 2017, these two trap sessions are not included.
2019, the proportion of subadults captured (57%) was closer Based on observations using our large network of video cam-
to that of adults (43%). All subadults captured during spring eras and direct observations by field ecologists who worked
2019 were yearlings, but subadults captured during fall 2018 during the marmot active period, we documented only seven
could not be categorized as juveniles or yearlings because we observations of yearling or adult marmots outside the 2-ha
lacked data on mass for fall 2018. Eleven adult females were marmot colony during the entire 6-year study period. In spring
captured during spring 2019; six were captured at the Original 2017, two marmots were sighted 2.74 km, and one 1.29 km
burrows area, four at Middle Cliffs burrows area, and one at north, of the 2-ha colony. These three data points could have
White Rock burrows area. Only one adult female was captured been three observations of one individual. At the 2.74 km dis-
during fall 2018. One adult male was captured during spring tant location, we successfully captured one adult marmot that
2019; no adult males were captured during fall 2018. was not tagged. It is possible that the untagged adult dispersed
During early summer 2019, we captured 26 marmot pups from the 2-ha colony and simply had not previously been cap-
144 times. The earliest that pups were observed anywhere on tured. Alternatively, the individual could have dispersed from
the colony was 24 May, when we began pup trapping. Mean the only other known colony nearby, a very small colony lo-
weight of pups was 0.50 kg (95% CI = 0.47–0.54). The sex cated off MPG Ranch about 4.3 km north of the 2-ha colony. In
ratio of the young population was 0.44:1 (8M:18F; Fig. 4). summer 2018, a single marmot was sighted 2.14 km southeast
Seventeen pups (65%) were captured at the large security log of the 2-ha colony; we do not know from where this marmot
pile in the Middle Cliffs burrows area, two at a small security dispersed. In summer 2019, a single marmot was observed 635
log pile in the Original burrows area, three at the large security m east of the 2-ha colony; we successfully trapped the marmot,
log pile in the Original burrows area, and four at a satellite site which was a tagged yearling male. As a result of the foregoing,
next to a burrow on the decommissioned road in the White we had, by 2019, conclusively documented only one male dis-
Rock burrows area. perser from the 2-ha colony.664 JOURNAL OF MAMMALOGY
pre-birth when all marmots in the population would have been
available for capture during the previous fall (p should have
been relatively high). That the model of p with season effect
was at least 33 times more likely to be selected over any other
model underpins the importance of carefully considering pos-
sible interactions between species biology and study design,
which has implications for other studies. Second, habitat en-
hancement did not affect p. All three models that included
the effects of habitat enhancement on p had zero likelihood,
indicating that as the population responded to habitat enhance-
ment by growing in number and expanding geographically, the
Downloaded from https://academic.oup.com/jmammal/article/101/3/658/5813001 by guest on 06 November 2020
probability of recapture remained approximately constant.
Using the most parsimonious model of p (season; F15 = F17),
we evaluated ψ between Original burrows area and North bur-
rows area, and vice versa. The estimate of c-hat was 1.35 so we
adjusted for overdispersion. Four models had ΔQAICc < 2.0
(Table 1). The top-ranked model did not include a habitat en-
hancement effect on transition probabilities, but the other three
top-ranking models did. Model weight (ω) for the top-ranked
model (0.29) was identical to model weight for the second-
ranked model (0.29), indicating strong support for both models.
The summed model weights for the three models that included
habitat enhancement effect was 0.71.
Based on parameter estimates from the top-ranked model,
the probability of transitioning from the Original burrows area
to the North burrows area, and vice versa, was 0.17 (0.09, 0.31;
Table 2). Based on parameter estimates from the second-ranked
model, the probability of transitioning from the Original bur-
rows area to North burrows area pre-habitat enhancement was
0.00 (0.00, 0.00), which differed statistically from the prob-
ability of transitioning from the Original burrows area to the
Fig. 4.—Number of yellow-bellied marmots (Marmota flaviventris) North burrows area post-habitat enhancement (0.22; Table 2).
captured during fall 2018 and spring 2019, by sex and age class, and The probability of transitioning from the Original burrows area
number of marmot pups captured immediately post-emergence during to the North burrows area pre-habitat enhancement also dif-
early summer 2019, by sex, at MPG Ranch in western Montana. fered statistically from the probability of transitioning from the
North burrows area to the Original burrows area at any time
Habitat transition probabilities within a multistate during the study.
framework—Of the 112 unique yearling and adult marmots we Age-structured survival.—During spring trapping sessions
captured, we documented capture location for 109, which as a 2014–2018, we documented marmot size based on VO while
result was our sample size for habitat transition analyses. C-hat marmot was in-hand for 52 individuals (42 S:10 L), and used
for our preliminary analyses to determine the most parsimo- size to assign age class at first capture for all 52 marmots. In
nious model for recapture probability (p) was 1.35 so we ad- spring 2019, we also began weighing marmots. We weighed
justed for overdispersion. The only model with ΔQAICc < 2.0 28 individuals and assigned age class at capture according to
was φ(.) p(season; F15 = F17) ψ(.). As strength of evidence mass. Of the 28 individuals captured during spring 2019, 20
for model selection, the AICc weight for the top-ranked model were recaptured marmots which had previously been assigned
was 0.97, which was at least 33 times more likely to be selected age class at first capture. We therefore had information on
over any other model. The models that included differences in age class at first capture for a total of 61 individuals (48 year-
p pre- and post-habitat enhancement ranked very low, as did the lings:13 adults). Results of our double-blind test during spring
null model. All of these low-ranking models had zero weight 2019 showed that age class assignment based on VO matched
and zero model likelihood. age class assignment based on mass for 26 of the 28 individ-
Results from preliminary analyses yielded two interesting uals (93% accuracy). The two marmots that were incorrectly
insights. First, season informed p, which we theorized might assigned age class based on VO weighed close to 2 kg, which
occur, given the timing of our field trapping with respect to was borderline between adult and yearling age classes. In both
marmot biology: fall trap sessions occurred post-birth when cases, the marmot size was documented as small (yearling)
young of the year were available for first capture (p should have when, in fact, both marmots weighed slightly more than 2 kg,
been relatively low), whereas spring trap sessions occurred making them adults.REYNOLDS-HOGLAND ET AL.—MARMOT RESPONSE TO HABITAT ENHANCEMENT 665
Table 1.—Model rankings of transition probability (ψ) between the Original burrows area (O) and North burrows area (N), and vice versa, for
yellow-bellied marmots (Marmota flaviventris) on MPG Ranch in western Montana 2013–2019, where survival (φ) is held constant and recap-
ture rate (p) varies by season, with fall 2015 and fall 2017 constrained to zero. ΔQAICc = difference between model QAICc and lowest QAICc.
ω = QAICc model weight. k = number of estimable parameters. Deviance = measure of model fit. Model covariates include the three possible
habitat pre- and post-habitat enhancement periods (pre- and post-habitat enhancement constructed in 2014, pre- and post-habitat enhancement
constructed in 2015, and pre- and post-habitat enhancement constructed in 2016), and the fully time-varying model. Only models with ΔQAICc
values < 2.0 are shown, except the null and global models are also shown for comparison.
Model ΔQAICc ω Model likelihood k Deviance
φ(.) p(season; F15 = F17) ψ(.) 0.00 0.29 1.00 5 111.13
φ(.) p(season; F15 = F17) ψ ON(pre/post 2015a) ψ NO(.) 0.05 0.29 0.98 7 106.80
φ(.) p(season; F15 = F17) ψ ON(pre/post 2014a) ψ NO(.) 0.53 0.23 0.77 7 107.28
Downloaded from https://academic.oup.com/jmammal/article/101/3/658/5813001 by guest on 06 November 2020
φ(.) p(season; F15 = F17) ψ ON(pre/post 2016a) ψ NO(.) 0.83 0.19 0.66 7 107.58
Null model 42.48 0.00 0.00 6 151.44
Global model 199.43 0.00 0.00 66 72.63
a
Pre/post YEAR: pre-habitat enhancement = period before summer YEAR, post-habitat enhancement = period after summer YEAR.
Table 2.—Estimates of habitat transition (ψ) probabilities from the top and second-ranked models (from Table 1), with SEs and 95% confidence
intervals, for yellow-bellied marmots (Marmota flaviventris) on the MPG Ranch in western Montana, 2013-2019. * denotes statistical signifi-
cance. “O” = Original burrow area; “N” = Northern burrows area; pre = prehabitat enhancement; post = post-habitat enhancement.
Lower Upper
confidence confidence
Model Parameter Estimate SE interval interval
φ (.) p(season;F15=F17) ψ(.) ψ (.) 0.17 0.06 0.09 0.31
φ (.) p(season;F15=F17) ψON (pre/post 2015) ψNO(.) ψON pre 0.00* 0.00 0.00 0.00
ψON post 0.22 0.06 0.12 0.37
ψNO (.) 0.06 0.06 0.01 0.40
For analyses of φ, the estimate of c-hat was 1.57 so we ad- Original burrows area beginning in 2015, and in the Middle
justed c-hat for overdispersion. Three models had ΔQAICc < Cliffs and White Rock areas beginning in 2016.
2.0 (Table 3). The top-ranked model was the null model, the Given that our study was observational, we could not rule out
second-ranked model included the effect of age structure on the possibility that marmots responded to something other than
φ, and the third-ranked model included the effect of age class construction of security log piles. It is possible that the mora-
(without age structure) on p. As strength of evidence for model torium on marmot shooting alone, which began in 2009, might
selection, the model weight (ω) for the null model was 0.36, have been sufficient for the remnant population to recover.
compared to 0.20 for the second-ranked model, indicating However, four years after the shooting moratorium began, only
that the top-ranked model was only 1.8 times more likely to three marmots were captured during an intensive 2-week trap
be selected over the second-ranked model. Based on the top- session in fall 2013. On the other hand, the number of marmots
ranked model, φ was 0.63 (0.36, 0.84; Table 4) and p was 0.62 captured increased to 31 within only three years of construc-
(0.27, 0.87). Based on the second-ranked model, φ for year- tion of the first security log piles. In addition, the probability
lings was 0.50 (0.22, 0.78) and that for adults was 0.71 (0.36, that marmots transitioned from the Original burrows area to the
0.92). Standard error estimates for φ were equal for adults and Northern burrows area was zero before any security log piles
yearlings (SE = 0.16). were constructed―the few marmots of the remnant popula-
tion were localized in the Original burrows area pre-habitat en-
hancement. After security log piles were constructed, and thus
Discussion became available to marmots in northern areas, the probability
Our findings showed that the marmot population responded that marmots transitioned to northern areas increased signifi-
positively to habitat enhancement: the number of marmots cap- cantly. These findings indicate that active habitat enhancement
tured during trap sessions markedly increased from three mar- assisted in the recovery of this degraded system.
mots pre-habitat enhancement to 54 (28 adults and yearlings, Building on previous research focused on using multistate
26 young) post-habitat enhancement by the end of the study, analyses to understand ecological processes, we demonstrated
and marmots expanded geographically by transitioning into that marmot response to habitat enhancement can be quantified
habitat-enhanced areas post-habitat enhancement. Importantly, and rigorously analyzed. In particular, to assess whether mar-
adult females occupied and reproduced in all habitat-enhanced mots expanded geographically into enhanced habitat areas, we
areas. Moreover, we observed new flight burrows near the used a novel approach within a multistate framework. Previous666 JOURNAL OF MAMMALOGY
Table 3.—Model rankings for annual apparent survival (φ) of yellow-bellied marmots (Marmota flaviventris) at MPG Ranch in western Mon-
tana, 2014–2019. ΔQAICc = difference between model QAICc and lowest QAICc. ω = QAICc model weight. k = number of estimable parameters.
Deviance = measure of model fit. Model covariates include age structure (yearlings and adults), age class (yearlings and adults), time, and inter-
actions between time and age structure and between time and age class. Only models with ΔQAICc values < 2.0 are shown, except the global
model is also shown for comparison.
Model ΔQAICc ω Model likelihood k Deviance
Null model 0.00 0.36 1.00 2 23.58
φ(age structure) p(.) 1.23 0.20 0.54 3 22.59
φ(.) p(age class) 1.94 0.14 0.38 3 23.30
Global model 48.13 0.00 0.00 20 15.38
Downloaded from https://academic.oup.com/jmammal/article/101/3/658/5813001 by guest on 06 November 2020
Table 4.—Estimates of apparent survival (φ) and recapture probability (p) from the top and second-ranked models (from Table 3), with SEs and
95% CIs, for yellow-bellied marmots (Marmota flaviventris) on the MPG Ranch in western Montana, 2013–2019.
Model Parameter Estimate SE Lower CI Upper CI
Null model φ 0.63 0.13 0.36 0.84
p 0.62 0.18 0.27 0.87
φ(age structured) p(.) Yearling φ 0.50 0.16 0.22 0.78
Adult φ 0.71 0.16 0.36 0.92
p 0.64 0.17 0.30 0.88
studies have used multistate frameworks to evaluate transi- 1962). Our pup trapping methods closely followed that of other
tion probabilities among age classes (Ozgul et al. 2007; Muths marmot studies, particularly in terms of trapping pups within
et al. 2014; Prochazka et al. 2017); among habitats (Hotaling days of emergence and determining sex, and sex of young in
et al. 2009; Breininger et al. 2010; Spurgeon et al. 2018); to our study was confirmed by DNA analyses, so the difference
estimate occupancy (Schmidt et al. 2014; Gorresen et al. 2018; we found in sex ratio of the young population was not likely due
Wilson et al. 2018); and recently to estimate effect of body to observer error. It may be that female age and recruit status
condition and habitat on survival (Boulanger et al. 2013), and helped explain the female-biased sex ratio of young: younger
cause-specific mortality (Raithel et al. 2017). Here, we used adult females in Colorado produced female-biased litters com-
a multistate framework to estimate the probability (with esti- pared to older adult females (Armitage 1987) and recruiter fe-
mates of error) that a population moved into enhanced habitat males produced more females per litter than did nonrecruiters
areas post-habitat enhancement. This multistate methodology (Armitage 1984).
has broad application for wildlife conservation and research Alternatively, the female-biased sex ratio of the young
aimed at estimating spatial expansion of wildlife populations population at MPG Ranch may have been affected by sex
into restored habitats. ratio adjustment. Under certain circumstances for some
Results from sex ratio analyses yielded surprising insights populations of polygynous species, “natural selection must
into this marmot population, as 69% of young captured were favor one or more genes that adjust the sex ratio produced by
female (8M:18F). We were unable to determine sex ratio for an adult female to her own condition at the time of parental
every litter based on observation because unlike other marmot investment” (Trivers and Willard 1975). In these populations,
colonies where two or more breeding females rarely occupied females in relatively good condition may maximize fitness
the same burrow (Armitage 1984), we commonly observed by investing in male offspring, whereas females in relatively
more than three adults and 17 young at one natal log pile. That poor condition may maximize fitness by investing in female
said, we were able to conclusively determine litter sex ratio for offspring (Trivers and Willard 1975). For adult female yel-
a single female that denned in a discrete satellite site in the low-bellied marmots, the energetically taxing period of
White Rock burrows area: the natal den was occupied by only parental investment occurs during pregnancy through lacta-
one adult female who shared space with four pups. The litter tion, the former begins immediately post-emergence in early
sex ratio was 1M:3F, consistent with the overall sex ratio of spring. During this energetically expensive time, prolonged
the young population, which was strongly female-biased. Other snow cover can negatively affect energy reserves because
studies of yellow-bellied marmots found that adult populations the hibernation period is extended (Armitage 2013), which
were female-biased (Pattie 1967; Armitage 1974) due to differ- can ultimately result in reduced litter size, reproductive fre-
ential mortality of dispersing males that are more susceptible quency, and proportion of female marmots that reproduce
to predation (Van Vuren 1990), but none reported strong fe- (Johns and Armitage 1979; Van Vuren and Armitage 1991;
male bias in young. On the contrary, sex ratio of weaned litters Armitage 2013). Following this line of reasoning, prolonged
was very close to 1:1 in the Beartooth Mountains of Wyoming snow cover resulting in depleted energy reserves would be
(Pattie 1967), the East River Valley in Colorado (Armitage considered a state of relatively poor condition for adult fe-
1974, 1987; Svendsen 1974) and in Yellowstone (Armitage male marmots.REYNOLDS-HOGLAND ET AL.—MARMOT RESPONSE TO HABITAT ENHANCEMENT 667
It is highly likely that marmots on the study site were in rel- During the first stage, yearlings left natal home ranges and es-
atively poor condition during emergence and mating in 2019 tablished new home ranges nearby (mean distance = 265 m),
because they experienced an unusually long hibernation period then moved further away about 40 days later. Armitage (1991)
owing to abnormally prolonged snow cover. Snow was still hypothesized that the first-stage movement likely allowed year-
covering over 50% of the colony area (and areas adjacent to the lings to escape social stress from aggressive adult males and the
colony area) on 1 April 2019, more than 1 month later than the second-stage movement involved locating suitable, unoccupied
mean Julian date for 50% snowmelt during the previous 5 years habitat. If yearlings that were born in the Original burrows area
(mean Julian date = 53; 22 February). The first aboveground at MPG Ranch dispersed in two stages, they may have estab-
marmot in 2019 was observed on 25 March, 19 days later than lished new home ranges in the Middle Cliffs or White Rock
the first aboveground marmot observed in 2018. Because the areas during the first stage as they sought local refugia from
unusually lengthy period of hibernation in 2019 likely resulted adult males. Because the Middle Cliffs and White Rock areas
Downloaded from https://academic.oup.com/jmammal/article/101/3/658/5813001 by guest on 06 November 2020
in relatively high depletion of energy reserves, adult females provided accessibility to food, lookout sites, and hibernacula,
would have been in relatively poor condition during emer- yearlings may have forgone the second stage of dispersal and
gence and mating that year, which could have affected sex remained at Middle Cliffs or White Rock areas, particularly
ratio of offspring according to the Trivers and Willard model. during the period immediately post-habitat enhancement when
Armitage (1987) previously reported that stress and female age these areas should have been unoccupied. Nonetheless, if per-
(indicators of body condition) did not affect litter sex ratio of manent emigration was higher than what we observed, then our
yellow-bellied marmots, and therefore concluded the Trivers estimates of yearling survival were biased low.
and Willard model was not supported. However, the Armitage In conclusion, we monitored the response of a remnant
(1987) study evaluated the effect of social stress and stress marmot population to habitat enhancement in an ecological
chemicals in the blood on litter sex ratio during 2 years, during system that had been dismantled during ~100 years of intensive
which time females may not have been subjected to unusually livestock management, which included eradicating marmots.
depleted reserves following markedly prolonged snow cover. We found that the marmot population appeared to respond
Given the hypothesis that females will produce the cheaper sex positively to new habitat opportunities created by the construc-
during periods of poor environmental conditions (Myers 1978), tion of security log piles, and gained insights into sex ratio of
additional work to understand proximate causation of sex ratio marmot offspring, which has implications for marmot conser-
of yellow-bellied marmot offspring may be warranted. vation, ecology, and evolutionary biology. Findings stemming
Survival estimates for adults and yearlings in our study were from this work are useful to resource managers interested in
within the range of those reported for a population of marmots restoring degraded landscapes that historically included wild
in Colorado that has been studied since 1962. Adult survival marmots. In addition, the multistate modeling approach we
in our study was estimated as 0.63 (95% CI = 0.36–0.84) and used to evaluate geographic expansion of the marmot popula-
0.71 (95% CI = 0.36–0.92) based on the intercept-only and age- tion has broad application to other wildlife studies seeking to
structured models, respectively. Mean adult survival for colonial estimate spatial expansion of populations.
marmots in Colorado was 0.71 (Oli and Armitage 2004), 0.74
(Ozgul et al. 2007), and 0.76 (Ozgul et al. 2006). Yearling sur-
vival in our study was estimated as 0.63 (95% CI = 0.36–0.84)
Acknowledgments
and 0.50 (95% CI = 0.22–0.78) based on the intercept-only and We are grateful to MPG Ranch for generously funding this re-
the age-structured models, respectively, which seemed some- search, and to MPG Ranch ecologists and restoration staff who
what higher than survival rates reported for colonial yearlings helped us monitor marmot activity outside the 2-ha colony.
in Colorado, where mean yearling survival was 0.30 (Ozgul We thank Matt Schertz, Dan Stone, Tor Bertin, Tanner Banks,
et al. 2006), 0.45 (Ozgul et al. 2007), or ranged from 0.12 to Benjamin Turnock, Carly Muench, and Jordan Hoffmaster for
0.26 (Borrego et al. 2008). their help with field work. We are grateful to Mike Henning
We evaluated apparent survival, which did not account for and his construction crew as well as Jeff Clarke and his field
immigration or emigration. Most yearling male yellow-bellied crew for creating the habitat enhancement for marmots at MPG
marmots disperse from their natal area (Armitage 1991), but Ranch, and to Bob Schroeder for his insights into the history
permanent dispersal appeared relatively low in our study based of the remnant marmot population at MPG Ranch. We thank
on observational data. Using a large network of cameras and Augustus Ballantine, Kenley Fields, and Morgan Byrne, for
observations by dozens of field ecologists and landscape res- laboratory assistance. We are also grateful to L. A. Ruedas,
toration staff working throughout the marmot active period, B. Swanson, and two anonymous reviewers, whose comments
we conclusively documented only one male disperser outside and suggestions greatly improved this manuscript.
the 2-ha colony site during the entire 6-year study period. It is
possible that the minimal observations of dispersing yearlings Literature Cited
were due to yearling mortality during dispersal. Akaike, H. 1973. Information theory and an extension of the max-
Alternatively, it may have been that some yearlings dispersed imum likelihood principle. Pp. 267–281 in Proceedings of the 2nd
from their natal dens but remained in the colony. Van Vuren International Symposium on Information Theory (B. Petrov and
(1990) found that many yearling males dispersed in two stages. F. Cazakil, eds.). Akadémiai Kiadó. Budapest, Hungary.668 JOURNAL OF MAMMALOGY
Armitage, K. B. 1962. Social behaviour of a colony of the yel- Gorrell, J. C., S. Boutin, S. Raveh, P. Neuhaus, S. D. Côté, and
low-bellied marmot (Marmota flaviventris). Animal Behavior D. W. Coltman. 2012. Sexing the Sciuridae: a simple and accurate
10:319–316. set of molecular methods to determine sex in tree squirrels, ground
Armitage, K. B. 1974. Male behaviour and territoriality in the yel- squirrels and marmots. Molecular Ecology Resources 12:806–809.
low-bellied marmot. Journal of Zoology (London) 172:233–265. Gorresen, P. M., K. W. Brinck, M. A. DeLisle, K. Montoya-
Armitage, K. B. 1984. Recruitment in yellow-bellied marmot popula- Aiona, C. A. Pinzari, and F. J. Bonaccorso. 2018. Multi-state
tions: kinship, philopatry, and individual variability. Pp. 377–403 in occupancy models of foraging habitat use by the Hawaiian hoary
Biology of ground-dwelling squirrels (J. O. Murie and G. R. Michener, bat (Lasiurus cinereus semotus). PLoS ONE 13:e0205150.
eds.). University of Nebraska Press. Lincoln, Nebraska. Harrison, J. T., M. N. Kochert, B. P. Paul, and J. A. Heath.
Armitage, K. B. 1987. Do female yellow-bellied marmots adjust the 2019. Using motion-activated trail cameras to study diet and pro-
sex ratios of their offspring? American Naturalist 129:501–519. ductivity of cliff-nesting golden eagles. Journal of Raptor Research
Armitage, K. B. 1991. Social and population dynamics of yel- 53:26–37.
Downloaded from https://academic.oup.com/jmammal/article/101/3/658/5813001 by guest on 06 November 2020
low-bellied marmots: results from long-term research. Annual Herget, M. E., K. M. Hufford, D. L. Mummey, and
Review of Ecology and Systematics 22:379–407. L. N. Shreading. 2015. Consequences of seed origin and bio-
Armitage, K. B. 2002. Social dynamics of yellow-bellied marmots: logical invasion for early establishment in restoration of a North
strategies for evolutionary success. Pp. 9–21 in Proceedings of the American grass species. PLoS ONE 10:e0119889.
3rd International Conference on Marmots (K. B. Armitage and Hotaling, A., J. Martin, and W. Kitchens. 2009. Estimating tran-
Y. Rumiantsev, eds.). ABF Publishing House. Moscow, Russia. sition probabilities among Everglades wetland communities using
Armitage, K. B. 2013. Climate change and the conservation of mar- multistate models. Wetlands 29:1224–1233.
mots. Natural Science 5:36–43. Johns, D. W., and K. B. Armitage. 1979. Behavioral ecology
Block, W. M., A. B. Franklin, J. P. Ward, J. L. Ganey, and of alpine yellow-bellied marmots. Behavioral Ecology and
G. C. White. 2001. Design and implementation of monitoring Sociobiology 5:133–157.
studies to evaluate the success of ecological restoration on wild- Kenyeres, Z., N. Bauer, L. Nagy, and S. Szabó. 2018. Enhancement
life. Restoration Ecology 9:293–303. of a declining European ground squirrel (Spermophilus citellus)
Blumstein, D. T., E. Fernando, and T. Stankowich. 2009. A population with habitat restoration. Journal for Nature Conservation
test of the multipredator hypothesis: yellow-bellied marmots re- 45:98–106.
spond fearfully to the sight of novel and extinct predators. Animal Kumar, A. V., J. R. Sparks, and S. L. Mills. 2018. Short-term re-
Behavior 78:873–878. sponse of snowshoe hares to western larch restoration and seasonal
Blumstein, D. T., and D. Pelletier. 2005. Yellow-bellied marmot needle drop. Restoration Ecology 26:156–164.
hiding time is sensitive to variation in costs. Canadian Journal of Larsen, A., J. Jacquot, P. Keenlance, and H. Keough. 2016.
Zoology 83:363–367. Effects of an ongoing oak savanna restoration on small mammals in
Blumstein, D. T., and C. Récapet. 2009. The sound of arousal: Lower Michigan. Forest Ecology and Management 367:120–127.
the addition of novel nonlinearities increases responsiveness in Lebreton, J. D., K. P. Burnham, J. Clobert, and D. R. Anderson.
marmot alarm calls. Ethology 115:1074–1081. 1992. Modeling survival and testing biological hypotheses using
Borrego, N., A. Ozgul, K. B. Armitage, D. T. Blumstein, and marked animals: a unified approach with case studies. Ecological
M. K. Oli. 2008. Spatiotemporal variation in survival of male yel- Monographs 62:67–118.
low-bellied marmots. Journal of Mammalogy 89:365–373. Lekberg, Y., S. M. Gibbons, S. Rosendahl, and P. W. Ramsey.
Boulanger, J., M. Cattet, S. E. Nielsen, G. Stenhouse, and 2013. Severe plant invasions can increase mycorrhizal fungal
J. Cranston. 2013. Use of multi state models to explore rela- abundance and diversity. Multidisciplinary Journal of Microbial
tionships between changes in body condition, habitat and sur- Ecology 7:1424–1433.
vival of grizzly bears (Ursus arctos horribilis). Wildlife Biology Malouf, C. 1974. Economies and land use by the Indians of western
19:274–289. Montana. Pp. 117–178 in Interior Salish and Eastern Washington
Breininger, D. R., et al. 2010. Multistate modeling of habitat dy- Indians (D. A. Horr, ed.). Garland. New York.
namics: factors affecting Florida scrub transition probabilities. Mérő, T., R. Bocz, L. Polyak, G. Horvath, and S. Lengyel.
Ecology 91:3354–3364. 2015. Local habitat management and landscape-scale restora-
Burnham, K. P., and D. R. Anderson. 1998. Model selection and tion influence small-mammal communities in grasslands. Animal
inference; a practical information-theoretic approach. Springer- Conservation 18:442–450.
Verlag Inc. New York. Miller, J. R., and R. J. Hobbs. 2007. Habitat restoration—do we
Burnham, K. P., and D. R. Anderson. 2002. Model selection and know what we’re doing? Restoration Ecology 15:382–390.
multimodel inference. Springer-Verlag Inc. New York. Mills, L. S., K. L. Pilgrim, M. K. Schwartz, and K. L. McKelvey.
Davidson, A., et al. 2018. Reintroducing a keystone burrowing ro- 2000. Identifying lynx and other North American felids based on
dent to restore an arid North American grassland: challenges and mtDNA. Conservation Genetics 1:285–288.
successes. Restoration Ecology 26:909–920. Mulligan, M., R. Schooley, and M. Ward. 2013. Effects of connec-
Franklin, A. B., D. R. Anderson, R. J. Gutierrez, and tivity and regional dynamics on restoration of small mammal commu-
K. P. Burnham. 2004. Population dynamics of the California nities in Midwestern grasslands. Restoration Ecology 21:678–685.
spotted owl: a meta-analysis. Ornithological Monographs Mummey, D. L., and P. W. Ramsey. 2017. Can sainfoin improve
54:1–555. conditions for establishment of native forbs in crested wheatgrass
Golet, G. H., T. Gardali, J. W. Hunt, D. A. Koenig, and stands? Ecological Restoration 35:127–137.
N. M. Williams. 2011. Temporal and taxonomic variability in Muths, E., L. L. Bailey, and M. K. Watry. 2014. Animal re-
response of fauna to riparian restoration. Restoration Ecology introductions: an innovative assessment of survival. Biological
19:126–135. Conservation 172:200–208.You can also read