Response of white sharks exposed to newly developed personal shark deterrents
←
→
Page content transcription
If your browser does not render page correctly, please read the page content below
Response of white sharks exposed to newly
             developed personal shark deterrents

C Huveneers1, S Whitmarsh1, M Thiele1, C May1, L Meyer1, A Fox2 and
                                  CJA Bradshaw1
1College   of Science and Engineering, Flinders University, Adelaide, South Australia
             2Fox   Shark Research Foundation, Adelaide, South Australia

Photo: Andrew Fox

                                                                                    1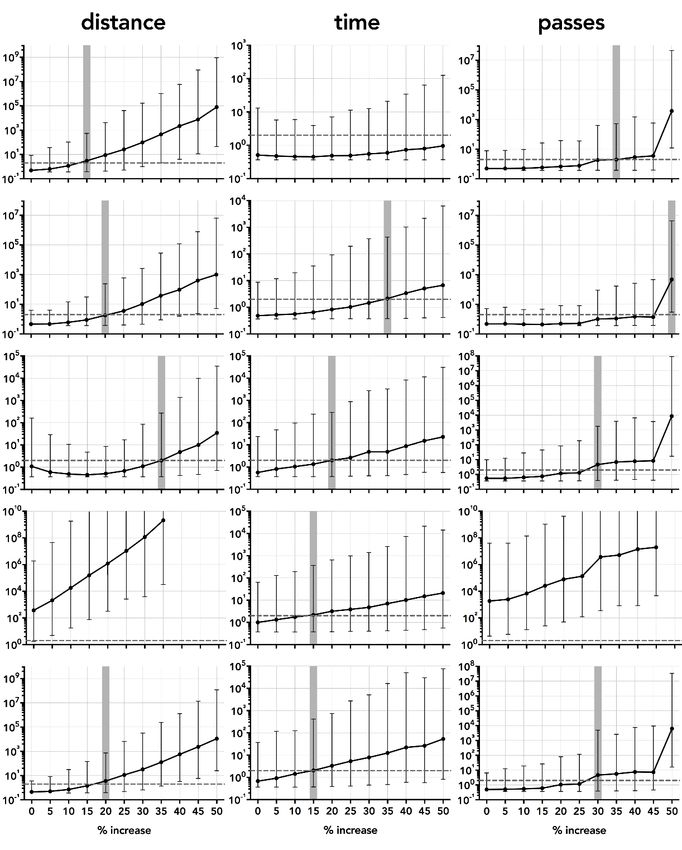
1. TABLE OF CONTENTS
2.     List of figures ................................................................................................................. 3

3.     List of tables................................................................................................................... 5

4.     Acknowledgements ........................................................................................................ 6

5.     Executive Summary ....................................................................................................... 7

6.     Introduction .................................................................................................................... 8

7.     Methods ....................................................................................................................... 11

     7.1      Study species and site .......................................................................................... 11

     7.2      Deterrent set-up .................................................................................................... 11

     7.3      Field sampling....................................................................................................... 12

     7.4      Video processing and filtering ............................................................................... 13

     7.5      Data analysis ........................................................................................................ 15

     7.6      Power analysis ...................................................................................................... 16

8.     Results ......................................................................................................................... 16

     8.1      Power analysis ...................................................................................................... 25

9.     Discussion ................................................................................................................... 27

10.        References ............................................................................................................... 32

                                                                                                                                         2
2. LIST OF FIGURES
Figure 1. Illustration of the board set-up with the five deterrent tested................................. 12
Figure 2. Number of passes of white sharks (Carcharodon carcharias) during the 297 trials
according to approach type and level of intent (white = low; grey = medium; black = high). 17
Figure 3. (a) Percentage of board or bait touched or taken and (b) reaction by white sharks
during 15-minute trials with a control board (grey) or one of five deterrents (coloured bar).
White bars represent trials when the board and bait were not touched or taken, or without
any reaction. Numbers above bars represent (a) the number of trials with board and bait
touched/taken or not touched/taken and (b) the number of pass with or without reaction. (c)
Frequency distribution of the distance at which white sharks (Carcharodon carcharias)
reacted to the Rpela (light blue; n = 17) and the Shark Shield (Ocean Guardian) Freedom+
Surf (dark blue; n = 79). Only deterrents for which sharks reacted more than 15 times were
included. ............................................................................................................................. 18
Figure 4. Density distribution of the distance between white shark and the bait. Dash lines
represent means for each deterrent. Grey = control; orange = Chillax Wax; light green =
magnet band; green = magnet leash; light blue = Rpela; blue = Shark Shield (Ocean
Guardian) Freedom+ Surf. Coloured numbers indicate the number of passes from which the
density distributions were calculated and match the colours of the deterrents. .................... 20
Figure 5. Number of passes per trial and shark during 15-minute trials (grey circles; with
small ‘jittering’ to improve clarity). Median values are indicated by the horizontal bar; length
of the box is the inter-quartile range; whiskers represent quartiles; circles are data points;
and red diamond is the mean. Y-axis shown on the log10 scale. Grey = control; orange =
Chillax Wax; light green = magnet band; green = magnet leash; light blue = Rpela; blue =
Shark Shield (Ocean Guardian) Freedom+ Surf. Numbers indicate total number of passes.
........................................................................................................................................... 21
Figure 6. Time taken (minutes) for white sharks to touch or bite the board or bait (grey
circles; with small horizontal ‘jittering’ to improve clarity). Median values are indicated by the
horizontal bar; length of the box is the inter-quartile range; whiskers represent quartiles;
circles are data points; and red diamond is the mean. Grey = control; orange = Chilli Wax;
light green = magnet band; green = magnet leash; light blue = Rpela; blue = Shark Shield
(Ocean Guardian) Freedom+ Surf. Numbers indicate the number of trials during which shark
touched or bit the board or bait. .......................................................................................... 23
Figure 7. Number of passes during the 15-minute trials for the eight white sharksthat
interacted with the boards on 15 trials or more. Grey = control; orange = Chillax Wax; light
green = magnet band; green = magnet leash; light blue = Rpela; blue = Shark Shield (Ocean
Guardian) Freedom+ Surf. .................................................................................................. 24

                                                                                                                                            3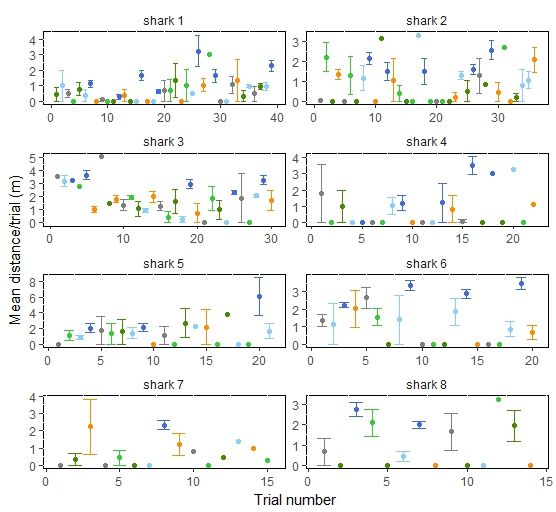
Figure 8. Mean distance between white shark and the bait for the eight sharks that interacted
with the boards on 15 trials or more. Error bars represent standard errors. Grey = control;
orange = Chillax Wax; light green = magnet band; green = magnet leash; light blue = Rpela;
blue = Shark Shield (Ocean Guardian) Freedom+ Surf. ...................................................... 25
Figure 9. Information-theoretic evidence ratio of model 3 (response ~ deterrent + shark ID
random effect) versus the intercept-only model (i.e., wAICc of model 3 ÷ wAICc of the
intercept-only model) for the five deterrent-control pairs and for the four responses of
proportion of bait taken (Pr(take bait) - far left column), distance to bait (left column), time to
feeding (right column), and number of passes (far right column), relative to a percentage
increase in the effect size relative to the control in increments of 5% from no increase (0) to
50%. The resampled (1000 times) 95% confidence limits for each percentage increment are
indicated by black error bars. Dashed horizontal black line shows the threshold evidence
ratio of 2 where model 3 is at least twice as likely to be the true model compared to the
intercept-only (i.e., no deterrent effect) model; this is indicated as a vertical horizontal
shaded area for each combination and response. Note that we detected a deterrent effect for
Surf+ (distance and number of passes), so the power analysis indicates an existing effect. 26

                                                                                                           4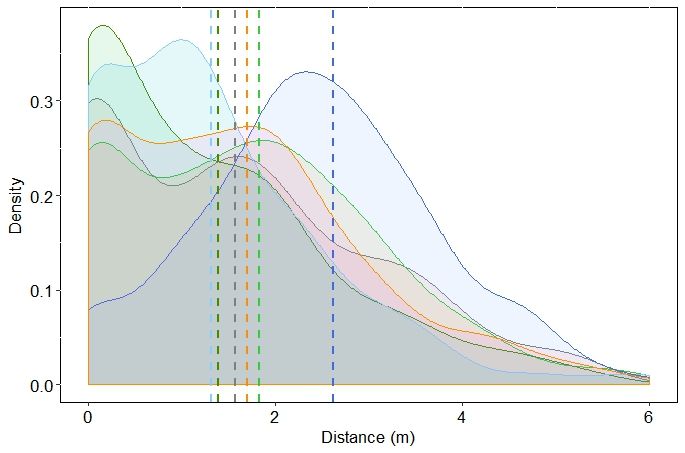
3. LIST OF TABLES
Table 1. Examples of shark deterrents commercially available and their cost (as of 19 April
2018). ................................................................................................................................. 10
Table 2. Five commercially available deterrents tested with their recommended use and the
dummy deterrent used in our study. .................................................................................... 12
Table 3. Summary of models estimating the effects of deterrents on the probability of the
board or bait being touched or bitten by white sharks. k = number of model parameters; AICc
= Akaike’s information criterion corrected for small sample size; ΔAICc = difference in AICc
between the current and the top-ranked model; wAICc = model probability; Rm = marginal
(fixed effects) R2. All models include shark ID as a random effect and a binomial error
distribution (logit link). ......................................................................................................... 19
Table 4. Estimated deterrent level coefficients (β) and their standard errors (SE), z-values of
factors included in the top-ranked model (bait ~ deterrent; Table 3), and the individual
coefficient Type I error estimate (P). ................................................................................... 19
Table 5. Summary of models estimating the effects of deterrents on the distance between
white shark and the board. k = number of model parameters; AICc = Akaike’s information
criterion corrected for small sample size; ΔAICc = difference in AICc between the current and
the top-ranked model; wAICc = model probability; Rm = marginal (fixed effects) R2. All models
include shark ID as a random effect a Gaussian error distribution (log link). ....................... 20
Table 6. Estimated deterrent level coefficients (β) and their standard errors (SE), z-values of
factors included in the top-ranked model (distance ~ deterrent; Table 5), and the individual
coefficient Type I error estimate (P). ................................................................................... 21
Table 7. Summary of models estimating the effects of deterrents on the number of passes by
white sharks towards the board. k = number of model parameters; AICc = Akaike’s
information criterion corrected for small sample size; ΔAICc = difference in AICc between the
current and the top-ranked model; wAICc = model probability; Rm = marginal (fixed effects)
R2. All models include shark ID as a random effect and a Gaussian error distribution (log
link). .................................................................................................................................... 22
Table 8. Estimated deterrent level coefficients (β) and their standard errors (SE), z-values of
factors included in the top-ranked model (passes ~ deterrent + trial; Table 7), and the
individual coefficient Type I error estimate (P). .................................................................... 22
Table 9. Summary of models estimating the effects of deterrents on the time it took white
sharks to touch or bite the board or bait. k = number of model parameters; AICc = Akaike’s
information criterion corrected for small sample size; ΔAICc = difference in AICc between the
current and the top-ranked model; wAICc = model probability; Rm = marginal (fixed effects)
R2. All models include shark ID as a random effect and a Gaussian error distribution (log
link). .................................................................................................................................... 23

                                                                                                                                            5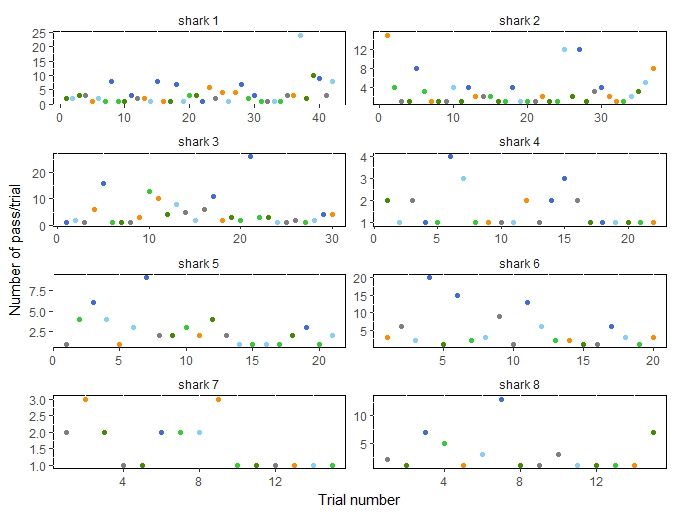
4.     ACKNOWLEDGEMENTS
This project was done under the Department of Environment, Water and Natural Resources
permit M26609 and Flinders University ethics approval E446. This project was funded by the
New South Wales Department of Primary Industries Shark Management Strategy (SMS)
Competitive Annual Grants Program, Government of South Australia, Ocean Guardian Pty
Ltd, and the Neiser Foundation. We openly and transparently declare that Ocean Guardian
contributed financially to the study, but that Ocean Guardian was not involved in the study
design or implementation, nor did they have access to the data post-collection. Nor did
Ocean Guardian provide input into data analysis, interpretation, writing of the report, or the
conclusions drawn. The study design followed a protocol developed for a previous study
(Huveneers et al. 2013b), which was not funded by Ocean Guardian. In summary, Ocean
Guardian had no opportunity to influence any aspect of the study or its conclusions, apart
from providing some financial support to realise the field project (e.g., boat hire, equipment
purchase, etc.) in the same manner as the other funding agencies. The South Australian
cage-diving industry provided logistical support during the testing of the deterrents. The
authors thank Jens Neiser, volunteers, and staff from Rodney Fox Shark Expeditions for
their help during testing of the deterrents, and René Campbell for illustrating the board set-
up (Figure 1).

                                                                                                 6
5.       EXECUTIVE SUMMARY

     •   In Australia, the number of shark-human interactions and shark bites per capita has
         increased, leading to a rise in shark-bite mitigation measures being developed. Yet,
         many of the products commercially available have not been scientifically tested,
         potentially providing an exaggerated sense of security to members of the public using
         them.

     •   We tested five shark deterrents developed for surfers (Shark Shield Pty Ltd [Ocean
         Guardian] Freedom+ Surf, Rpela, SharkBanz bracelet, SharkBanz surf leash
         [Modom], and Chillax Wax) by comparing the percentage of baits taken, time to take
         the bait, number of passes, distance to the bait, and whether a shark reaction could
         be observed.

     •   A total of 297 successful trials were done at the Neptune Islands Group Marine Park.
         During these trials, 44 different white sharks (Carcharodon carcharias) interacted
         with the bait, making a total of 1413 passes.

     •   The effectiveness of the deterrents was variable, with the Freedom+ Surf affecting
         shark behaviour the most (increased number of reactions) and reducing the
         percentage of bait taken from 96% (relative to the control board) to 40%. This led to
         an increase in the number of passes because exposed sharks continued to attempt
         taking the bait. Shark’s mean distance to the board increased from 1.6 ± 0.1 m
         (control board) to 2.6 ± 0.1 m when the Freedom Surf+ was active, but the time it
         took to interact with the bait remained indistinguishable. The other deterrents had
         limited or no measureable effect on white sharks.

     •   Based on our power analyses, the smallest effect size that could be reliably detected
         was ~ 15%. Although we did not find evidence that the magnet band and leash,
         Chillax Wax, and Rpela affected white sharks during the trials, it is possible that
         these deterrents have small effects that could not be detected by the 50 trials per
         deterrent we imposed. This does not infer that additional trials would have
         necessarily resulted in our models detecting an effects from these deterrents; rather
         it means that more than 50 trials would be required to detect changes of a magnitude
         < 15% greater than we observed if there were any effects.

     •   Manufacturers should consider these findings to assess the suitability of their product
         and gauge whether changes are required to ensure that their product performs as
         intended. Our results will allow private and government agencies to make informed
         decisions about the use of these devices for occupational activities and enable the
         public to make appropriate decisions about the use and suitability of these five
         products.

                                                                                                 7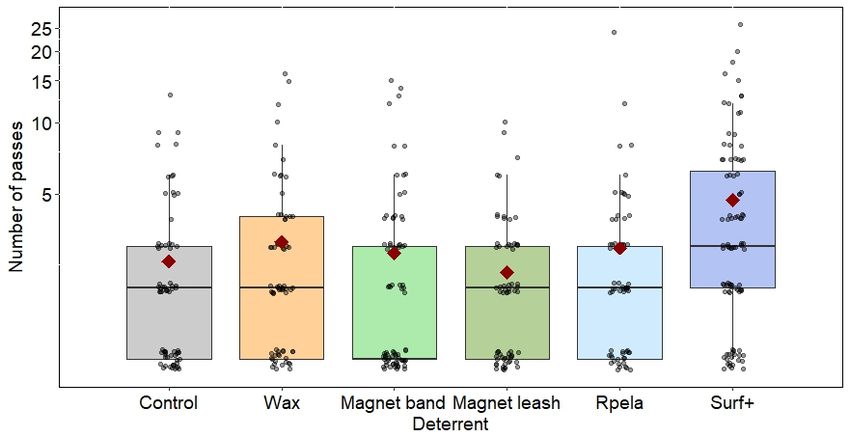
6.     INTRODUCTION
Although shark-human interactions remain rare and unlikely events, their frequency has
been increasing globally (Chapman and McPhee 2016, McPhee 2014). Growth in human
population, habitat modification and destruction, water quality, climate change and
anomalous weather patterns, and the distribution and abundance of prey have all been
proposed to explain this recent increase in the incidence of shark bites and shark bites per
capita (Afonso et al. 2017, Chapman and McPhee 2016, Lemahieu et al. 2017, McPhee
2012, Meyer et al. 2018). However, the infrequent occurrence of such events impedes our
ability to assess the relative importance of causal factors that might have contributed to the
rise in the global and regional number of shark bites (but see Afonso et al. 2017 and Meyer
et al. 2018). While the probability of being bitten by a shark is low, and most shark bites
result in minor injuries (West 2011, Woolgar et al. 2001), public perception of the risk of
shark bites and ensuing fatality is much higher than reality (Crossley et al. 2014, Myrick and
Evans 2014). The frequent negative framing by the mass media, social media, and user-
driven content sites (e.g., YouTube) might have contributed to exaggerating public anxiety
about the pervasive presence of sharks and risk that they pose to humans (Muter et al.
2013, Sabatier and Huveneers 2018). Such heightened public concern has pressured
managers and governments to develop and implement new measures that reduce the risk of
sharks bites, and provide information to the public to make more informed decisions about
using a specific area at a particular time.

Prevention and responses to shark bites have varied temporally and regionally, and have
included shark hunts, organised shark culling, beach meshing and drumlines, beach
closures, shark fences, land- and aerial-based shark spotting, and acoustic telemetry (for a
review, see Curtis et al. (2012)). While these measures aim to reduce the probability of
sharks and humans encountering each other, other measures aim to repel sharks directly
from approaching people in the water. These deterrents have been developed to elicit a
response by impacting one or more of the shark senses, including vision, smell, and electro-
reception (Table 1; and see Hart and Collin 2015). For example, various aposematic colour
configurations (i.e., use of colours as anti-predator tactics) have been proposed allegedly to
repel sharks. Using chemicals as shark repellents has also been proposed (Baldridge 1990,
Rasmussen and Schmidt 1992, Sisneros and Nelson 2001). However, the sensitivity of the
electro-receptive organ of sharks to strong electric fields and its potential ability to deter
sharks have been studied the most (e.g., Huveneers et al. 2013b, O'Connell et al. 2014b).

The rise in shark-human interactions has also led to the emergence of many new personal
shark deterrents. The rapid commercial availability of these deterrents has preceded

                                                                                                 8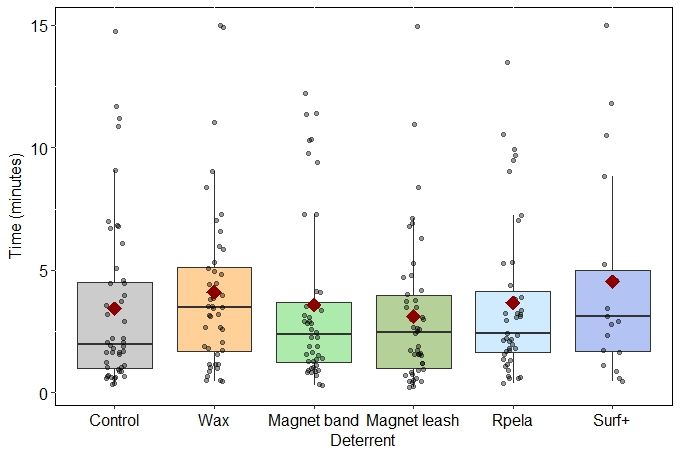
rigorous and peer-reviewed studies to test the effectiveness of these devices, meaning that
manufacturers are making claims about their products without rigorous scientific evidence to
back them up. If deterrents were not as effective as advertised, it could give users a false
sense of security, leading some people to put themselves at greater risk of shark interactions
than they normally would because of the reliance of these devices. For example, some
surfers and spearfishers ignore other mitigation measures, such as beach closures, because
they feel safe when wearing these products. Whether they are or not is what we aim to
demonstrate in this study.

Surfing has been suggested as an activity that exposes people to sharks more than others,
because many ideal surfing locations are regions that overlap with the habitats of potentially
dangerous sharks, the amount of time surfers spend in the water relative to most other
bathers, surfers’ distance from shore, isolation, possible resemblance to white sharks’
natural prey (i.e., seals, fur seals, and sea lions), and potentially enticing arm and leg
movements (Burgess et al. 2010). For example, most bites in Volusia County, USA (63%)
between 1982 and 2013 occurred during surfing activities, while surfing has also been
implicated in 53% of shark bites in Brazil since 1992 (Chapman and McPhee 2016) and two-
thirds of shark bites in Reunion Island (McPhee 2014). This has resulted in recent
development of personal deterrents to decrease the risk of shark bites to surfers.

Our aims were to test the effectiveness of surfing-specific personal shark deterrents and
quantify the behavioural response of sharks exposed to these deterrents. We tested the
effects of five deterrents (two electric, two magnetic, and one olfactory-based) on the
behaviour of white sharks (Carcharodon carcharias) and determined if these deterrents
reduce the likelihood of white sharks consuming an intended prey. Specifically, we assessed
and compared the effects of each deterrent on (1) the number of passes to a bait, (2) the
minimum distance between a bait and the sharks, (3) the percentage of bait taken, (4) the
amount of time sharks took to take the bait, and (5) whether shark behaviour changed with
increased exposure to the deterrent. We also assessed the effect size that the trials could
detect statistically (power analysis) to gauge the experiment’s ability to identify small
behavioural changes if present.

                                                                                               9
Table 1. Examples of shark deterrents commercially available and their cost (as of 19 April 2018).
Deterrent type Company Product Webpage Cost (AU$)
vision-based Sharkproof Mask Strap www.sharks-diving.com/Buy-now 25
Shark Attack SAMS 5' Vinyl shop.sharkmitigation.com/board-stickers-and-inlays/short-board-
104
Mitigation Systems Shortboard Sticker stickers/sams-5-vinyl-shortboard-sticker.html
Radiator Shark Deterrent Surf radiator.net/collections/shark-deterrent-surf-range 495
Shark Deterrent Dive radiator.net/collections/shark-deterrent-dive-1 528
Shark Shocker Beware thesharkshocker.com 96
acoustic-based Watercraft Shark
Shark Stopper www.sharkstopper.com unknown
Repellent
olfactory-based CommonSense
Chillax Wax www.facebook.com/commonsensesurf 18-20
Surf Company
Instant Release www.sharktecdefense.com/products/instant-release-shark-repellent-
SharkTec 50
Repellent Spray spray
Shark Deterrent
RepelSharks repelsharks.com/repel-sharks-shark-deterrent-canister-2 38
Canister
Best Glide BCB Shark Repellent www.bestglide.com/shark_repellent.html 34
electroreception-based Shark Shield
Freedom+ Surf sharkshield.com/shop/freedom-surf-bundle 599
(Ocean Guardian)
Scuba 7 sharkshield.com/shop/scuba7 799
Freedom7 sharkshield.com/shop/freedom7 749
Rpela Rpela www.Rpela.com/products 340
SharkBanz SharkBanz 2 www.sharkbanz.com/products/sharkbanz-2 90
Shark Leash www.sharkbanz.com/products/modom-shark-leash 167
Shark Shocker Lucky Leash thesharkshocker.com 50
Shark Shocker thesharkshocker.com 42
Bluvand NoShark – dive version bluvand.com/shop/bluvand/noshark-dive-version 514
107. METHODS
7.1 Study species and site
In Australia, the white shark is responsible for the most unprovoked bites (19.5% of all shark
bites) and the most fatalities (34%) (West 2011). Our study focused on white sharks because
interactions with this species are considered to be a worst-case scenario during which the
deterrent is subjected to the most dangerous species. We did all deterrent testing trials at the
Neptune Islands Group Marine Park (35°149 S, 136°049 E). This group of islands is ~ 30 km
off the southern coast of South Australia, supports the largest colony of fur seals in Australia
(Goldsworthy et al. 2014, Shaughnessy et al. 2005), and is considered an aggregation site for
white sharks (Huveneers and Lloyd 2017). Commercial shark-cage diving has taken place
here since the late 1970s and is the only location where such activity is permitted in Australia
(Huveneers et al. 2017).We chose this area because the high likelihood of shark interactions.
We did the deterrent testing over 18 days and five separate trips between September 2017
and January 2018.
7.2 Deterrent set-up
We tested five commercially available deterrents (Shark Shield Pty Ltd [Ocean Guardian]
Freedom+ Surf, Rpela, SharkBanz bracelet, SharkBanz surf leash [Modom], and Chillax Wax;
Table 2) using custom-built surfboard replicas (hereafter referred to as ‘boards’). In the case of
the Rpela, we did the trials first using the commercially available device. We made minor
modifications to the electrode size through the trials, but this did not affect shark responses
(see results). Boards were 120 × 30 cm and made of polystyrene foam covered with layers of
fibreglass cloth and epoxy resin, but were strengthened with wood on the sides where the bait
was attached. We used six boards, with each having one active deterrent and four replica or
dummy deterrents to act as a control (Fig. 1). One board had no active deterrents (i.e., it had
the five dummy deterrents) and was used as the control. For example, the Shark Shield
(Ocean Guardian) Freedom+ Surf (hereafter referred to as Surf+) board consisted of an active
Surf+, regular wax, a replica Rpela, and a dummy SharkBanz bracelet and leash. This
experimental set-up allowed us to test for each active deterrent type using a single control
board.
11Table 2. Five commercially available deterrents tested with their recommended use and the
dummy deterrent used in our study.
Deterrent Recommended attachment
Brand/product Dummy deterrent
type type
Wax applied to the top of
olfactory Chillax Wax Regular surfboard wax
surfboard
SharkBanz - Worn on ankle or wrist of Non-magnetised black
magnetic
bracelet surfer plastic bracelets
SharkBanz - Incorporated within surfboard Non-magnetised regular
magnetic
leash leash leashes
Electrode stickers placed on
Replica electrodes created
Ocean Guardian bottom of surfboard,
electric using silver permanent
Freedom+ Surf electronics incorporated within
marker and white tape
tail kick of back grip
Electrode and electronics built- Replica Rpela unit without
electric Rpela
in on bottom of surfboard active device
Rpela Chillax Wax Magnet band Magnet leash Surf+
Figure 1. Illustration of the board set-up with the five deterrents tested (illustration by René
Campbell, Flinders University).
7.3 Field sampling
Across the five sampling trips, we tested each deterrent a total of 50 times within a series of
trials. A series of trials consisted of testing each of the five deterrents and the control board
(total six trials) in a randomised sequence. This led to a total of 300 trials (50 trials for each of
the five deterrents and control).
12White sharks were attracted to the stern of an anchored vessel using an odour corridor, which
we established by disbursing into the water a mix of unrefined fish oil and minced southern
bluefin tuna Thunnus maccoyii. We attached sections of tuna with short lengths of natural fibre
to a float secured by a 15 m line. We allowed the tuna section to drift from the stern of the
vessel to attract white sharks. Trials commenced after a white shark was sighted near the
vessel at least twice within five minutes or when a shark showed consistent interest in the
tethered bait. We removed and replaced the tethered bait with the experimental equipment,
which we only deployed when the shark had left the proximity of the vessel and was no longer
visible. Each trial consisted of the deployment of a fresh tuna gill (~ 2 kg), referred to as the
‘bait’, which we attached ~ 30 cm beneath the board to replicate the typical distance between
a surfer’s foot and the board when surfers sit on their board to wait for a wave. We connected
the board to the stern of the anchored vessel using a rope, and left it to drift with the wind and
tide. The distance of the equipment from the vessel varied between 5 and 15 m depending on
the wind, swell, tide, and glare conditions, to ensure that observers on the vessel could
identify sharks and record their behaviour accurately. We ran trials for 15 minutes or until a
shark touched the bait or board with an intent to consume the bait. We repeated trials during
which a shark did not approach the board with an intent to take the bait to ensure that the
results were not biases by trials during which sharks did not attempt to consume the bait.
During each trial, we deployed a stereo-video unit from the stern of the boat ~ 50 cm below
the surface to film and enable coding of each trial. The stereo-video unit consisted of two
GoPro Hero4 Silver edition cameras mounted in secure custom-built housings (SeaGIS Pty
Ltd, Victoria, Australia) angled 8 degrees inward and set 76 cm distance apart along a metal
bar. We calibrated the cameras using an EventMeasure Stereo to take accurate length
measurements from the video footage. This software uses the 3-dimensional calibration
information to calculate distance.
7.4 Video processing and filtering
We processed and analysed the video footage using EventMeasure. We reviewed and
independently coded the digitally recorded video footage from each trial. The coders were
‘blind’ because they did not participate in all of the trials and had no prior knowledge of which
deterrent was being used when coding videos of each trial. We used the following terminology
to describe and code shark behaviour following Huveneers et al. (2013b):
• Pass: a directed swim towards the experimental set-up (each time a shark veered away
from the board and swam back we classified it as a new pass);
13• Shark identity: We individual white sharks based on markings on five morphological areas:
caudal fin, pelvic fins, first dorsal fin (hereafter dorsal fin), gills, and pectoral fins using
established white shark identification methods (Nasby-Lucas and Domeier 2012, Nazimi et
al. 2018). We could recognise most individuals through a combination of pigmentation
patterns (countershading, rosettes, islets, freckles, spots), notches or scoops,
amputations, scoliosis, and scars. As natural pigmentation patterns can gradually change
in some individuals (Domeier and Nasby-Lucas 2007, Robbins and Fox 2013), using
multiple morphological areas to identify and resight individuals reduces the likelihood of
misidentifications (Gubili et al. 2009, Towner et al. 2013). We applied side by side
comparisons of fin silhouettes (dorsal, caudal, or pectoral) and videos of sharks turning
and showing both sides to link left- and right-hand sides of shark images;
• Distance to bait: distance from the sharks’ nose, where the shark’s sensory organs
targeted by the deterrents (ampullae of Lorenzini, nostrils) are located, to the top of the
bait;
• Level of intent: this represented the shark’s motivation when approaching the bait; we
categorised this as high, medium, or low using a combination of factors including shark
swimming direction in relation to the bait, swimming speed, and acceleration amount. low
= shark moving slowly, not approaching in the direction of the bait and without
acceleration; medium = shark slowly moving towards the bait without acceleration; high =
shark approaching the bait at speed or accelerating;
• Approach type: we categorised the position of the shark in the water column when
approaching the bait as either surface (horizontal swimming near the surface), deep
(horizontal swimming 2 m), or vertical (shark comes up from below the bait and swims
vertically in a typical breach approach);
• Reaction: a behavioural reaction from an individual shark towards the experimental set-up
(e.g., tail flick, muscle spasm, head shake, fast direction change).
We determined sex based on clasper presence and measured total body length using
EventMeasure. We did not include the effect of shark sex or size in the analysis because
potential differences here were beyond the scope of our study. Instead, we included individual
shark (shark ID) as a random effect in the models (see below) to account statistically for
individual shark behaviour that was independent of deterrent effects (i.e., some sharks might
be more included to approach closer or more frequently than others). Prior to analysis, we
removed passes that had low intent or that were deep and not directed at the board to avoid
including behaviours where sharks were not attempting to consume the bait.
147.5 Data analysis
There were two potential analytical biases in the data we collected: (1) temporal correlation
(lack of temporal independence) due to the potential habituation of individual sharks or
changes in their motivation through time, and (2) pseudo-replication due to instances where
the same shark interacted with the bait within and across trials. Sharks might become
habituated to the deterrent, or sharks that consumed the bait might become less likely to
respond to the deterrent due to the positive reinforcement provided by the bait. We
investigated whether the effectiveness of the deterrents changed throughout the study (e.g.,
sharks becoming habituated to the deterrents) by including ‘trial’ as a fixed integer covariate in
the models (i.e., ignoring the real elapsed time between successive exposures but including
the information indicating relative serial time; e.g., 2 followed 1) and by plotting the mean
distance between the shark and the board, and the number of passes across trials for sharks
that interacted with the board for 15 trials or more.
We minimised potential pseudo-replication by testing the effects of deterrents on all response
variables using a generalised linear mixed-effects model (GLMM) with individual shark coded
as a random effect, and the deterrent used as the fixed effect. We also included trial as fixed-
integer effect and the interaction between trial and deterrent to account for potential temporal
effects. The error structure of GLMM corrects for non-independence of statistical units due to
shared temporal structure, and permits the random-effects variance explained at different
levels of clustering to be decomposed. Including individual shark as a random effect
accounted for the potential lack of independence in behaviour within each identified shark. We
excluded those passes for which we could not identify the shark from this analysis (117 out of
1,413 passes; 8.2%). We determined the most appropriate statistical family and error
distribution for each analysis by examining the distribution of the response variable and
visually inspecting the residuals for the saturated models. We ran all models for all possible
combinations of factors, and compared their relative probability using Akaike’s information
criterion corrected for small sample size (AICc) (Burnham and Anderson 2002). The bias-
corrected relative weight of evidence for each model, given the data and the suite of candidate
models considered, was the AICc weight; the smaller the weight, the lower its contribution to
parameter estimates (Burnham and Anderson 2002). We also calculated the marginal R2 of
each resampled GLMM (Rm) as a measure of goodness of fit and the contribution of the fixed
effects to explaining variance in the response variable (Nakagawa and Schielzeth 2013). We
also compared the proportion of time the board or baits were touched or taken by sharks
between deterrents using the minlike two-sided Poisson exact test from the exactci R package
(Fay 2010). We used this test because it is generally more powerful than the central two-sided
method (Fay 2010).
157.6 Power analysis
Using the variance structure of the observed datasets, we determined how much an increase
in the response was required to give statistical evidence for an effect of each deterrent. We
first separated each deterrent-control combination for each of three responses: proportion of
bait taken, distance to bait, time to take bait, and number of passes. For each subset, we
increased the response variable measured for the deterrent trials by 5% increments up to a
maximum of 150% of the observed values (i.e., multiplying by a scalar of 1, 1.05, 1.10, …,
1.5). Within each incremented set, we randomly resampled the entire subset with replacement
(i.e., all rows, including both control and treatment [deterrent type]) up to the same number of
samples, repeating this procedure 1000 times. For each iteration, we recorded the
information-theoretic evidence ratio of the model including only the deterrent fixed effect (i.e.,
model 3; response ~ deterrent + shark ID random effect) relative to the intercept-only model
(i.e., wAICc of model 3 ÷ wAICc of the intercept-only model). We then plotted the median (and
95% confidence bounds) of model 3 evidence ratio against the response increment. We
concluded that an effect could become statistically distinguishable from the control when the
most common top-ranked model started to include a deterrent effect, and when the evidence
ratio became >> 2 (i.e., the deterrent model was at least twice as likely to be the true model
relative to the intercept-only [no effect]).
8. RESULTS
Across the five trips, we did a total of 342 trials, from which we removed 42 from further
analysis because no sharks approached the board with an intent to take the bait during these
trials. We also removed two trials with the Surf+ and one trial with the Rpela due to
technological issues with the device at the time of deployment. Out of the remaining 297 trials,
we recorded 1413 passes from a total of 44 individual sharks. The mean (± standard error)
distance between sharks and baits was 2.30 ± 0.04 m (range: 0 – 10.8 m; n = 1217 passes),
which we measured with a precision of 46.5 ± 1.0 mm (2.3 – 325.4 mm). Passes for which we
could not measure distance (n = 196) were due to objects (e.g., bubbles from weather
conditions, other fish species such as silver trevally) obstructing the field of view or to the
framing of the video cutting off the board and bait or the shark. Individual sharks interacted
with the board for an average of 29.5 ± 5.3 passes (range: 1 – 152) and 8.9 ± 1.4 trials (range:
1 – 41). The mean number of sharks that approached the bait during a trial was 1.3 ± 0.03
(range 1 – 4). Most (68%) passes occurred at the surface, with only a few (4%) vertical
passes. Overall, the distribution of pass type was approximately evenly distributed among the
intent classes: 38, 40, and 23% high, medium, and low intent, respectively. However, this
16distribution reversed between surface and deep passes because most surface passes had
high intent and most deep passes had low intent (Fig. 2).
600
500
Number of passes
400
300
200
100
0
Surface Deep Vertical
Approach type
Figure 2. Number of passes of white sharks (Carcharodon carcharias) during the 297 trials
according to approach type and level of intent (white = low; grey = medium; black = high).
When no deterrents were active (i.e., on the control board), sharks touched or bit the board or
bait (hereafter referred to as an ‘interaction’) prior to the end of the trials 96% of the time. The
deterrents had various effects, with the percentage of times sharks interacted with the bait
ranging from 94% (magnet leash) to 40% (Surf+) (Fig. 3a). The Surf+ was the only deterrent
that had statistical evidence for reducing the percentage of times sharks interacted with the
bait (Poisson exact test: p < 0.001; p > 0.67 for all other deterrents). The wAICc top-ranked
model (wAICc = 0.73) included deterrent, with the deterrent factor explaining ~ 23% of the
variance (Table 3). The Surf+ had the largest effect on the percentage of time sharks
interacted with the bait (-4.9%) compared to the other deterrents (-0.3 to -1.9%) (Table 4).
We observed reactions 117 times at an average distance of 1.49 ± 0.05 m (range: 0 – 6.1 m)
from the board and they occurred most frequently with the Surf+ (68% of reactions). The Surf+
was the only deterrent that demonstrated statistical evidence for changing the percentage of
reaction (18%) compared to the control board (2%) (Poisson exact test: p = 0.046; p > 0.49 for
all other deterrents) (Fig. 3b). When the Surf+ was active, we observed reactions at an
average distance of 1.72 ± 0.05 m (range: 0 – 6.1 m) from the board (Fig. 3c).
17(a) 7/43 6/44 3/47 5/44 29/19
2/48
Proportion of bait taken 100%
80%
60%
40%
20%
0%
Control Wax Magnet band Magnet leash Rpela Surf+
(b) 3/178 6/212 7/209 5/155 17/182 79/360
100%
Proportion of reaction
80%
60%
40%
20%
0%
Control Wax Magnet band Magnet leash Rpela Surf+
(c)
18 Deterrent
15
Frequency (%)
12
9
6
3
0
0.0 0.5 1.0 1.5 2.0 2.5 3.0 3.5 4.0 4.5 5.0 5.5 6.0 6.5
Distance (m)
Figure 3. (a) Percentage of board or bait touched or taken and (b) reaction by white sharks
during 15-minute trials with a control board (grey) or one of five deterrents (coloured bar).
White bars represent trials when the board and bait were not touched or taken, or without any
reaction. Numbers above bars represent (a) the number of trials with board and bait
touched/taken or not touched/taken and (b) the number of pass with or without reaction. (c)
Frequency distribution of the distance at which white sharks (Carcharodon carcharias) reacted
to the Rpela (light blue; n = 17) and the Shark Shield (Ocean Guardian) Freedom+ Surf (dark
blue; n = 79). Only deterrents for which sharks reacted more than 15 times were included.
18Table 3. Summary of models estimating the effects of deterrents on the probability of the
board or bait being touched or bitten by white sharks. k = number of model parameters; AICc =
Akaike’s information criterion corrected for small sample size; ΔAICc = difference in AICc
between the current and the top-ranked model; wAICc = model probability; Rm = marginal
(fixed effects) R2. All models include shark ID as a random effect and a binomial error
distribution (logit link).
Model k AICc ΔAICc wAICc Rm
bait ~ deterrent 7 178.97 0.00 0.73 23.1
bait ~ deterrent + trial 8 180.96 1.99 0.27 23.1
bait ~ 1 (intercept-only) 2 234.48 55.51 < 0.01 -
bait ~ trial 3 236.09 57.12 < 0.01 0.6
Table 4. Estimated deterrent level coefficients (β) and their standard errors (SE), z-values of
factors included in the top-ranked model (bait ~ deterrent; Table 3), and the individual
coefficient Type I error estimate (P).
Level β SE z P
intercept 3.061 1.013 3.02 0.003
Chillax Wax -0.305 1.065 -0.29 0.775
Magnet band -1.855 1.036 -1.79 0.073
Magnet leash 0.628 1.236 0.51 0.612
Rpela -1.337 1.047 -1.28 0.202
Surf+ -4.906 1.088 -4.51 < 0.001
The distance between the shark and the bait, and the number of passes, increased when the
Surf+ was used compared to the control board, but these variables were not affected by the
other deterrents (Figs. 4, 5). The shark’s distance to the board increased to 2.6 ± 0.1 m when
the Surf+ was active compared to 1.6 ± 0.1 m with the control board and 1.3 ± 0.1 to 1.8 ± 0.1
m with the other deterrents. The top-ranked model (wAICc = 0.72) included deterrent and
explained ~ 6.7% of the variance (Table 5). Again, the Surf+ had the largest effect on the
number of passes (0.14) compared to the other deterrents (-0.005 – 0.003) (Table 6).
The mean number of passes per trial was highest when the Surf+ was active (4.7 ± 0.5), while
the number of passes with the other deterrents (2.3 ± 0.3 to 3.1 ± 0.4) was similar to the
control board (2.6 ± 0.3). The top-ranked model (wAICc = 0.53) included deterrent and trial,
with the deterrent and trial components together explaining ~ 5.5% of the variance (Table 7).
However, trial did not strongly affect the number of passes because the next-ranked model did
not include trial, had a slightly lower wAICc (0.36), a similar Rm, and the trial coefficient was
small (0.002). Again, the Surf+ had the largest effect on the number of passes (0.176)
compared to the other deterrents (-0.04 – 0.005) (Table 8).
19181 / 218 / 216 / 160 / 199 / 439 passes
Figure 4. Density distribution of the distance between white shark and the bait. Dash lines
represent means for each deterrent. Grey = control; orange = Chillax Wax; light green =
magnet band; green = magnet leash; light blue = Rpela; blue = Shark Shield (Ocean
Guardian) Freedom+ Surf. Coloured numbers indicate the number of passes from which the
density distributions were calculated and match the colours of the deterrents.
Table 5. Summary of models estimating the effects of deterrents on the distance between
white shark and the board. k = number of model parameters; AICc = Akaike’s information
criterion corrected for small sample size; ΔAICc = difference in AICc between the current and
the top-ranked model; wAICc = model probability; Rm = marginal (fixed effects) R2. All models
include shark ID as a random effect a Gaussian error distribution (log link).
Model k AICc ΔAICc wAICc Rm
distance ~ deterrent 8 109.48 0.00 0.72 6.68
distance ~ deterrent + trial 9 111.42 1.94 0.28 6.66
distance ~ 1 (intercept-only) 3 164.85 55.37 < 0.01 -
distance ~ trial 4 166.15 56.67 < 0.01 0.18
20Table 6. Estimated deterrent level coefficients (β) and their standard errors (SE), z-values of
factors included in the top-ranked model (distance ~ deterrent; Table 5), and the individual
coefficient Type I error estimate (P).
Level β SE z
intercept 3.181 0.032 98.34
Chillax Wax -0.005 0.036 -0.14
Magnet band 0.003 0.034 0.09
Magnet leash -0.014 0.039 -0.37
Rpela -0.046 0.034 -1.38
Surf+ 0.140 0.031 4.54
181 218 216 160 199 439
Figure 5. Number of passes per trial and shark during 15-minute trials (grey circles; with small
‘jittering’ to improve clarity). Median values are indicated by the horizontal bar; length of the
box is the inter-quartile range; whiskers represent quartiles; circles are data points; and red
diamond is the mean. Y-axis shown on the log10 scale. Grey = control; orange = Chillax Wax;
light green = magnet band; green = magnet leash; light blue = Rpela; blue = Shark Shield
(Ocean Guardian) Freedom+ Surf. Numbers indicate total number of passes.
21Table 7. Summary of models estimating the effects of deterrents on the number of passes by
white sharks towards the board. k = number of model parameters; AICc = Akaike’s information
criterion corrected for small sample size; ΔAICc = difference in AICc between the current and
the top-ranked model; wAICc = model probability; Rm = marginal (fixed effects) R2. All models
include shark ID as a random effect and a Gaussian error distribution (log link).
Model k AICc ΔAICc wAICc Rm
passes ~ deterrent + trial 9 201.93 0.00 0.53 5.48
passes ~ deterrent 8 202.69 0.77 0.36 4.43
passes ~ deterrent + trial + deterrent*trial 14 205.64 3.72 0.08 7.06
passes ~ trial 4 209.52 7.59 0.01 0.93
passes ~ 1 (intercept-only) 3 210.05 8.12 0.01 -
Table 8. Estimated deterrent level coefficients (β) and their standard errors (SE), z-values of
factors included in the top-ranked model (passes ~ deterrent + trial; Table 7), and the
individual coefficient Type I error estimate (P).
Level β SE z
intercept -0.408 0.056 -7.35
Chillax Wax 0.050 0.057 0.88
Magnet band 0.009 0.056 0.15
Magnet leash -0.034 0.057 -0.60
Rpela 0.032 0.058 0.55
Surf+ 0.176 0.056 3.16
Trial 0.002 0.001 1.64
The time it took to interact with the bait ranged from 3.11 ± 0.44 minutes (Magnet leash) to
4.64 ± 1.01 minutes (Surf+) and was not affected by the deterrents (Fig. 6), with only the third-
ranked model (wAICc = 0.03; Rm < 3%) including deterrent (Table 9).
2248 44 44 46 43 19
Figure 6. Time taken (minutes) for white sharks to touch or bite the board or bait (grey circles;
with small horizontal ‘jittering’ to improve clarity). Median values are indicated by the horizontal
bar; length of the box is the inter-quartile range; whiskers represent quartiles; circles are data
points; and red diamond is the mean. Grey = control; orange = Chilli Wax; light green =
magnet band; green = magnet leash; light blue = Rpela; blue = Shark Shield (Ocean
Guardian) Freedom+ Surf. Numbers indicate the number of trials during which shark touched
or bit the board or bait.
Table 9. Summary of models estimating the effects of deterrents on the time it took white
sharks to touch or bite the board or bait. k = number of model parameters; AICc = Akaike’s
information criterion corrected for small sample size; ΔAICc = difference in AICc between the
current and the top-ranked model; wAICc = model probability; Rm = marginal (fixed effects) R2.
All models include shark ID as a random effect and a Gaussian error distribution (log link).
Models k AICcAICc ΔAICc wAICc Rm
time ~ 1 (intercept-only) 3 626.95 0.00 0.48 -
time ~ trial 4 627.03 0.08 0.46 1.28
time ~ deterrent + trial 9 632.69 5.73 0.03 2.98
time ~ deterrent 8 632.77 5.82 0.03 1.73
time ~ deterrent + trial + deterrent*trial 14 637.41 10.46 < 0.01 5.20
23We observed no clear patterns of temporal variation through the trials from the top-ranked
models or from plotting the number of passes trial-1 or time to interact with the bait (Figs. 7, 8).
Only one model had trial included in the top-ranked model, but it was not strongly supported
compared to the second-ranked model and its goodness of fit was small. Behaviour of the
sharks that interacted with the bait in > 15 trials showed that the Surf+ typically led to more
passes and increased distance from the deterrent relative to controls. Neither of these
variables consistently increased or decreased across sharks, supporting the lack of temporal
effect.
Figure 7. Number of passes during the 15-minute trials for the eight white sharksthat
interacted with the boards on 15 trials or more. Grey = control; orange = Chillax Wax; light
green = magnet band; green = magnet leash; light blue = Rpela; blue = Shark Shield (Ocean
Guardian) Freedom+ Surf.
24Figure 8. Mean distance between white shark and the bait for the eight sharks that interacted
with the boards on 15 trials or more. Error bars represent standard errors. Grey = control;
orange = Chillax Wax; light green = magnet band; green = magnet leash; light blue = Rpela;
blue = Shark Shield (Ocean Guardian) Freedom+ Surf.
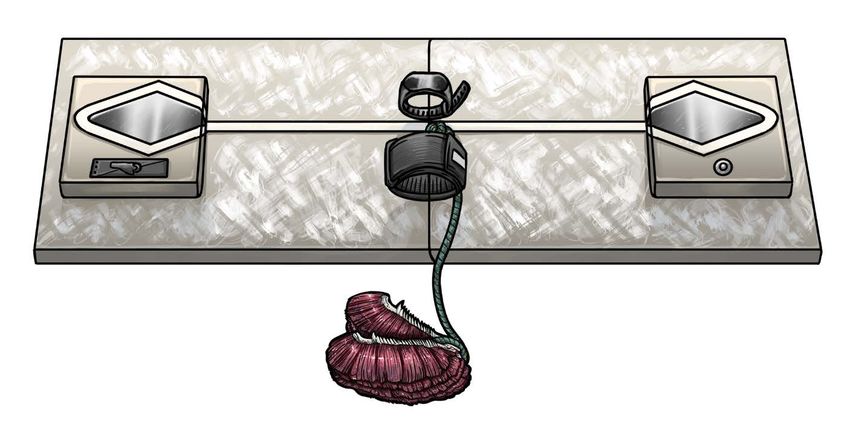
8.1 Power analysis
Based on the 297 successful trials (~ 50 per deterrent) and the variance structure of these, the
deterrent effect became detectable when we increased the effect size relative to the controls
by between 10 and > 50% (Fig. 9). For distance to the bait, the smallest detectable effect-size
increase was 15% for magnet band, and the largest was for Rpela at 35% (Fig. 9). For time to
feeding, the smallest increase required to detect a deterrent effect was 15% for Chillax Wax
and Surf+, whereas it was > 50% for magnet band (Fig. 9). Finally, for the number of passes,
the increase in effect size required was much larger (30% for Chillax Wax and Rpela, and
50% for magnet leash) (Fig. 9).
25Magnet band
Magnet leash
Rpela
Surf+
Chillax Wax
Figure 9. Information-theoretic evidence ratio of model 3 (response ~ deterrent + shark ID random effect) versus the intercept-
only model (i.e., wAICc of model 3 ÷ wAICc of the intercept-only model) for the five deterrent-control pairs and for the four
responses of proportion of bait taken (Pr(take bait) - far left column), distance to bait (left column), time to feeding (right
column), and number of passes (far right column), relative to a percentage increase in the effect size relative to the control in
increments of 5% from no increase (0) to 50%. The resampled (1000 times) 95% confidence limits for each percentage
increment are indicated by black error bars. Dashed horizontal black line shows the threshold evidence ratio of 2 where model
3 is at least twice as likely to be the true model compared to the intercept-only (i.e., no deterrent effect) model; this is indicated
as a vertical horizontal shaded area for each combination and response. Note that we detected a deterrent effect for Surf+
(distance and number of passes), so the power analysis indicates an existing effect.
269. DISCUSSION
Although previous studies have assessed the effectiveness of some personal deterrents, ours
is the first to investigate deterrents developed for surfers. We successfully quantified the
effectiveness of a combination of deterrents, including new products based on technology
thought to affect shark behaviour (Shark Shield [Ocean Guardian] Freedom+ Surf and Rpela),
devices that have never been scientifically tested (SharkBanz bracelet and leash), and novel
products (Chillax Wax). Our study reveals that while one of the deterrents reduces the
probability of white sharks consuming the bait (Surf+), the other four deterrents had limited
effects on white shark behaviour.
The Surf+ had the strongest effect, reducing the percentage of baits taken from 96% to 40%.
This increased the number of passes as sharks continued to attempt taking the bait. The other
deterrents had limited effects on either the distance to the bait or the number of passes. This
suggests that white sharks were not deterred from interacting with the board. Even the Surf+,
which was the most effective deterrent, did not have a substantial effect on sharks unless they
were near, as shown by the short distance from which sharks reacted to this deterrent (~ 1.7
m). Although the Surf+ affected shark behaviour and reduced the probability of the bait being
touched or taken, this deterrent failed to stop sharks on 40% of the trials. Several studies have
previously tested the effectiveness of electric deterrents on white sharks and shown various
success (Huveneers et al. 2013b, Kempster et al. 2016, Smit and Peddemors 2003). The first
study assessed SharkPOD (a product no longer available) and concluded that the probability
of an attack was reduced from 0.70 to 0.08 when the deterrent was active (88% decrease)
(Smit and Peddemors 1990). More recently, two studies tested the Freedom7 and highlighted
discrepancies in the effectiveness of the device that was related to the bait placement and
distance to the electrodes. When the bait was placed next to one electrode, there was an 83%
reduction in the proportion of sharks interacting with the bait, concurring with Smit and
Peddemors (2003). In Huveneers et al. (2013b), the bait was located ~ 2–3 m away from the
deterrent to reproduce the intended distance between the centre of the deterrent’s electric
field and the head of a user. In this situation and in contrast to Smit and Peddemors (2003)
and Kempster et al. (2016), the Freedom7 did not have a significant effect on the proportion of
times the bait was consumed (Huveneers et al. 2013b). However, a behavioural response was
observed with sharks staying farther away when the Freedom7 was active.
While the waveform and electric field produced by all Ocean Guardian products are not
different, electrode configuration varies. This results in differences in the maximum field
produced and in the distribution of the electric field relative to the body of the person using the
device and likely explains the contrasting results across previous studies. Combined,
27Huveneers et al. (2013b), Smit and Peddemors (2003), Kempster et al. (2016), and this study,
show that the effective deterrent range of the Ocean Guardian waveform depends on how far
the bait is from the electrodes, highlighting the importance of carefully considering the position
of the electrodes in relation to the object or person intended to be protected by the device. The
locations of the Surf+ electrodes underneath the surfboard ~ 1.2 m apart ensure that surfers
are contained by the electric field produced by the deterrent. This electrode configuration is
therefore more likely to be suitable than previous products where electrodes were located
behind the person wearing the device (e.g., Freedom7 and Surf7 — no longer available).
The positions of the Rpela electrodes are similar to the Surf+; however, the Rpela produces
an electric field at a higher voltage gradient than the Surf+ (200 V vs. 115 V). Therefore, we
expected that the Rpela would perform similarly or better than the Surf+. However, our
experimental observations did not support this and instead found limited effect when the Rpela
was active. The Rpela was the only other deterrent to which sharks reacted more than the
control board (9% vs. 2% of the passes), although this difference was not supported
statistically (i.e., we cannot differentiate the two). Mapping the electric field emitted by these
two products shows that the Rpela’s electric field does not reach as far as the Surf+’s despite
its stronger voltage gradient. The Surf+ had a higher maximum effective distance at 3 V m-1
than the Rpela (0.7 vs. < 0.5 m) (Hart and Ryan 2018), which might explain the differences in
behaviour we observed. The ability to further increase the voltage gradient of an electric
deterrent is limited because it can cause involuntary muscle spasms of the person wearing it
(Bikson 2004). Kempster et al. (2016) proposed that it could be possible to increase the
effectiveness of an electric deterrent by altering the frequency of the electric field discharge.
The Surf+ discharges at a frequency of ~ 1.6 Hz, while Rpela has a frequency of ~ 14.5 Hz.
As a result, the duration of the pulse is also much shorter in the Rpela (~ 0.2 ms) than the
Surf+ (~1.5 ms). Based on the observed difference in effectiveness between the Rpela and
Surf+, the short pulse duration might be less effective at deterring sharks. Alternatively, the
longer frequency of the Surf+ might be more likely to shock an approaching shark because the
animal is able to come closer to the deterrent between pulses, thus feeling the electric pulse
more strongly. The pulse duration and frequency are tightly linked, so it is not possible to
assess which contributed the most to the discrepancy in shark behaviour between the Rpela
and Surf+. The two deterrents also differ in the type of currents discharged (Rpela: direct
current; Surf+: alternative current), which might have also affected the extent of the sharks’
responses. Whether the lower effectiveness of the Rpela is due to the difference in field
propagation, pulse type, duration, or frequency is unknown, but the discrepancy between the
two products and differences within the Ocean Guardian products show the complexity of
28You can also read