The Spotlight: A General Method for Discovering Systematic Errors in Deep Learning Models
←
→
Page content transcription
If your browser does not render page correctly, please read the page content below
The Spotlight: A General Method for Discovering Systematic Errors in Deep
                                                                         Learning Models
                                                               Greg d’Eon1 , Jason d’Eon2,3 , James R. Wright4 , Kevin Leyton-Brown1
                                                          1
                                                              University of British Columbia 2 Vector Institute 3 Dalhousie University 4 University of Alberta
                                                                 gregdeon@cs.ubc.ca, jndeon@dal.ca, james.wright@ualberta.ca, kevinlb@cs.ubc.ca
arXiv:2107.00758v2 [cs.LG] 16 Oct 2021

                                                                      Abstract                                  plethora of methods for training more equitable or robust
                                                                                                                models. However, these methods require practitioners to rec-
                                           Supervised learning models often make systematic errors on
                                           rare subsets of the data. When these subsets correspond to           ognize and label well-defined groups in their dataset ahead
                                           explicit labels in the data (e.g., gender, race) such poor perfor-   of time, necessarily overlooking semantically related sets
                                           mance can be identified straightforwardly. This paper intro-         of inputs that the practitioner failed to identify in advance.
                                           duces a method for discovering systematic errors that do not         While practitioners should certainly continue to assess model
                                           correspond to such explicitly labelled subgroups. The key idea       performance on sensitive subpopulations, it is extremely diffi-
                                           is that similar inputs tend to have similar representations in the   cult to anticipate all of the sorts of inputs upon which models
                                           final hidden layer of a neural network. We leverage this struc-      might systematically fail: e.g., vision models could perform
                                           ture by “shining a spotlight” on this representation space to        poorly on a particular age group, pose, background, lighting
                                           find contiguous regions where the model performs poorly. We          condition, etc.
                                           show that the spotlight surfaces semantically meaningful areas
                                                                                                                   In this work, we introduce the spotlight, a method for
                                           of weakness in a wide variety of existing models spanning
                                           computer vision, NLP, and recommender systems.                       finding systematic errors in deep learning models even when
                                                                                                                the common feature linking these errors was not anticipated
                                                                                                                by the practitioner and hence was not surfaced in an explicit
                                                                   Introduction                                 label. The key idea is that similar inputs tend to have similar
                                         Despite their superhuman performance on an ever-growing                representations in the final hidden layer of a neural network.
                                         variety of problems, deep learning models that perform well            We leverage this similarity by “shining a spotlight” on this
                                         on average often make systematic errors, performing poorly             representation space, searching for contiguous regions in
                                         on semantically coherent subsets of the data. A landmark               which the model performs poorly. We show that the spotlight
                                         example is the Gender Shades study (Buolamwini and Gebru               surfaces semantically meaningful areas of weakness in a
                                         2018), which showed that vision models for gender recog-               surprisingly wide variety of otherwise dissimilar models and
                                         nition tend to exhibit abnormally high error rates when pre-           datasets, including image classifiers, language models, and
                                         sented with images of black women. AI systems have also                recommender systems.
                                         been shown to perform poorly for marginalized groups in                   Rather than replacing existing methods for measuring bi-
                                         object recognition (de Vries et al. 2019), speech recogni-             ases in trained models, we hope that practitioners will add
                                         tion (Koenecke et al. 2020), mortality prediction (Chen, Jo-           the spotlight to their model-auditing pipelines to identify
                                         hansson, and Sontag 2018), and recruiting tools (Chen, Jo-             failure modes that do not correspond to known labels. After
                                         hansson, and Sontag 2018). Other systematic errors can be              such problems are identified by the spotlight, developers can
                                         harder for practitioners to anticipate in advance. Medical             then mitigate them by augmenting their datasets, adjusting
                                         imaging classifiers can be sensitive to changes in the imaging         their model architectures, or leveraging robust optimization
                                         hardware (D’Amour et al. 2020); essay scoring software can             methods. We provide an open-source implementation of the
                                         give high scores to long, poorly-written essays (Perelman              spotlight at [URL withheld for anonymous review].
                                         2014); and visual question-answering systems can fail when
                                         questions are rephrased (Shah et al. 2019).                                                  Related Work
                                            Recognizing and mitigating such systematic errors is criti-         Systematic errors on known groups. A standard ap-
                                         cal to avoid designing systems that will exhibit discriminatory        proach for auditing a machine learning model is to cre-
                                         or unreliable behaviour. Identifying edge cases where sys-             ate a dataset partitioned by group information, (e.g., de-
                                         tems fail can also be useful for experts seeking to improve            mographics, lighting conditions, hospital ID, . . . ), and to
                                         their systems (Cai et al. 2019). These issues have led the             check whether the model exhibits poor performance on any
                                         community to develop better tools for testing model perfor-            of these groups. With one or two particularly sensitive group
                                         mance, clearer standards for reporting model biases, and a             variables, it is straightforward to check the model’s per-
                                         Copyright © 2022, Association for the Advancement of Artificial        formance on each group; e.g., the NLP community advo-
                                         Intelligence (www.aaai.org). All rights reserved.                      cates for including such disaggregated evaluations in model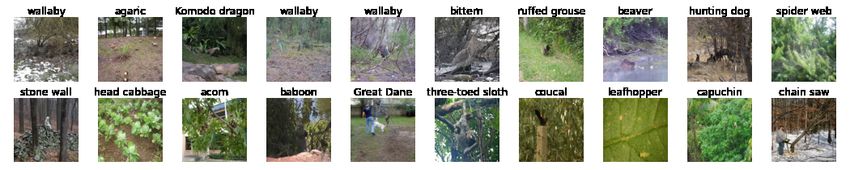
cards (Mitchell et al. 2019). When there are more group vari-
ables, inducing exponentially many intersectional groups,
there are a variety of computational methods to efficiently
identify groups for which performance is poor (Chung et al.
2018; Li, Moskovitch, and Jagadish 2021; Pastor, de Alfaro,
and Baralis 2021) and model dashboards for interactively
exploring groups (Cabrera et al. 2019; Ahn and Lin 2019;
Wexler et al. 2019).
   After identifying a systematic problem with a model, there
is a substantial literature proposing methods for making re-
pairs. Fair machine learning methods can incorporate group
information into shallow models, requiring that the model per-
form similarly on each group (see, e.g., Corbett-Davies and        Figure 1: An example of a spotlight in a model’s representa-
Goel 2018, for a review) or evaluating the model on its worst      tion space.
group (Martinez, Bertran, and Sapiro 2020). There also exist
generalizations to support many intersectional groups (Kim,
Ghorbani, and Zou 2019). Two recent robust training meth-
                                                                   superlinear-time clustering method limits its applicability to
ods exist to repair deep models that exhibit such biases. First,
                                                                   large datasets. The spotlight exploits the same underlying
distributionally robust language modelling (Oren et al. 2019)
                                                                   insight from GEORGE that semantic similarity is reflected
allows an adversary to change the distribution over groups
                                                                   by proximity in the embedding space. However, the spotlight
during training, requiring the model to do well on each group.
                                                                   focuses on auditing models rather than robust training; dra-
Second, invariant learning (Arjovsky et al. 2019) requires the
                                                                   matically lowers computational cost to linear time; avoids
model to learn a representation of the data that induces the
                                                                   partitioning the entire embedding space, searching only for
same classifier for each group, protecting against spurious
                                                                   contiguous, high-loss regions; and can identify issues that
correlations.
                                                                   involve examples from multiple classes.
   The spotlight differs from these approaches in that it aims        A final notable method is Errudite (Wu et al. 2019), an
to identify systematic failure modes that are not described by     interactive system for analyzing errors made by NLP models.
existing group labels. Our approach is thus complementary          It allows a user to query a subset of their dataset using a
to those just surveyed: after using the spotlight to uncover       domain-specific language, reporting the model’s performance
a new failure mode, practitioners can augment their dataset        on this query set and proposing related queries to help the user
with appropriate labels and turn to these existing methods to      dig deeper into their model. This interactive query system
monitor or repair their model’s performance.                       can help developers discover and confirm systematic issues
                                                                   in their models without the need for pre-existing group labels.
Systematic errors on unknown groups. One approach to
                                                                   However, Errudite is carefully designed to suit models for
avoiding systematic errors without group information is to
                                                                   NLP tasks; the spotlight is domain-agnostic, applying to a
train a model that performs well across the entire dataset;
                                                                   broad family of deep models on many different domains.
such a model is guaranteed to achieve good performance on
any semantically meaningful subset of the data. For exam-
ple, distributionally robust optimization (DRO) methods can                                The Spotlight
work without group information by allowing an adversary to         In order to identify systematic errors, we examine reweight-
select from a broader set of dataset reweightings (Hashimoto       ings of the dataset that emphasize poor performance of the
et al. 2018; Duchi, Hashimoto, and Namkoong 2020; Lahoti           model. The reweightings are computed by applying a param-
et al. 2020); invariant learning algorithms can infer groups       eterized kernel function to the final representation space of
during training (Creager, Jacobsen, and Zemel 2020). While         the model, concentrated on a contiguous region, without only
these methods sometimes leverage information from a trained        focusing on a few points. We refer to such a reweighting as a
model’s representation space, they differ from the spotlight       spotlight (Figure 1).
by attempting to mitigate systematic errors within the train-         Formally, we suppose that we have N data points with
ing loop. In contrast, the spotlight aims to surface any biases    representations x1 , . . . , xN ∈ Rd and losses `1 , . . . , `N ∈ R.
that remain after model training to a human expert.                We compute weights as ki = max(1 − τ (x − µ)2 , 0) where
   The existing method most similar to our own approach            µ ∈ Rd and τ ∈ R are the center and precision of the
is GEORGE (Sohoni et al. 2020), a method for applying              spotlight, respectively. Note that ki has a maximum of 1
DRO without group labels. GEORGE infers “subclasses”               when xi = µ and a minimum of 0 when xi is sufficiently far
within the dataset by clustering points within a trained neu-      from µ. Then, our objective is
ral network’s representation space, then allows an adversary                                                 !
to modify the distribution over subclasses. While Sohoni
                                                                                                 X      ki
                                                                                      max             P        `i                   (1)
et al. focused on training robust models, they observe that                                             j kj
                                                                                      µ,τ
                                                                                                  i
these clusters tend to correspond to semantically meaningful                                     X
subsets of the data (for instance, images of birds on land                              s.t.        ki ≥ S,                         (2)
vs. on water). They also observe that their reliance upon a                                     i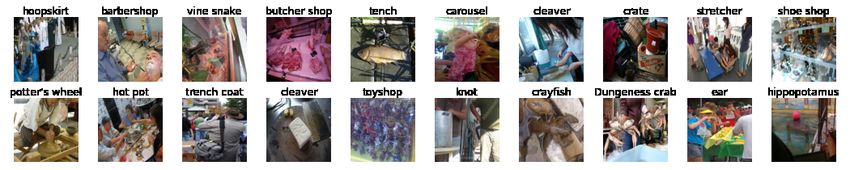
for some choice of the hyperparameter S. We interpret S as were run a single NVIDIA Tesla V100 GPU, with which
the “spotlight size,” as this setting ensures a lower bound on each spotlight presented in this section took under 1 minute
the total weight that the spotlight assigns across the dataset. to optimize, emphasizing the computational tractability of
To make
P optimization tractable, we replace the hard con- our approach even on very large datasets.
straint i ki ≥ S with the penalty term We also compare these spotlights with the clustering stage
of GEORGE’s pipeline. In particular, we use the publicly
( i ki − (S + w))2
P
b(k) = C · max , 0 (3) available implementation of GEORGE1 , which separately
w2 clusters the examples from each class, automatically selecting
the number of clusters using a Silhouette-based heuristic.
and optimize the unconstrained objective Wherever it is feasible, we identify the three highest-loss
! clusters, summarize the examples in each of these clusters,
X ki and compare them to the content within the spotlights. We
P `i − b(k). (4)
i j kj show that the content of the spotlights often differ from these
clusters, finding more granular problem areas within a class
This penalty acts as a “barrier,” penalizing reweightings that or systematic errors that span across multiple classes.
include less than S + w points. We fix C to be large relative
to typical losses in the dataset (i.e. C = 1 for binary classifi- FairFace
cation; C = 10 for problems with thousands of classes) and
gradually decrease w while optimizing. We first study FairFace (Karkkainen and Joo 2021), a collec-
To optimize Equation 4, we begin with a large, diffuse tion of 100,000 face images annotated with crowd-sourced
spotlight containing the entire dataset (in practice, initializing labels about the perceived age, race, and gender of each im-
to µ = 0 and τ = 10−4 ). Then, we run the Adam optimizer age. FairFace is notable for being approximately balanced
for 5000 steps with an adaptive learning rate, halving the across 7 races and 2 genders. In particular, we trained a model
learning rate each time the objective reaches a plateau, and to predict the perceived gender label as a proxy for the gen-
we gradually shrink the width of the barrier geometrically der prediction systems studied in prior work (Buolamwini
from w = N − S to w = 0.05S. and Gebru 2018). Our model was a ResNet-18, trained using
We additionally developed a method of optimizing multi- Adam with cross-entropy loss and a learning rate of 3e-4;
ple distinct spotlights on the same dataset without changing we stopped training after 2 epochs when we found that the
any hyperparameters. This method iteratively subtracts spot- validation loss began increasing. We ran the spotlight on the
light weight from its internal accounting of each example’s validation set, using the final 512-dimensional hidden layer
loss and then finds another spotlight. More formally, using for the representation space.
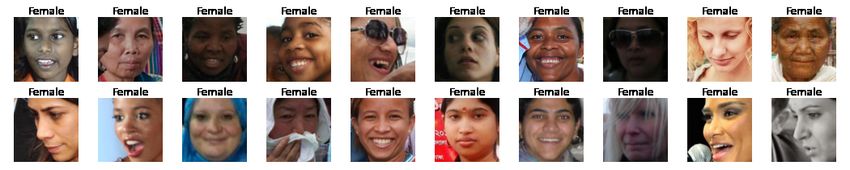
the weights provided by spotlight, ki , we update the losses as The spotlights and highest-loss examples are shown in
`0i := (1 − ki / maxj kj ) `i ; we then perform the same opti- Figures 2 and 7. We found that each of the spotlights discov-
mization as above and repeat as many times as desired. In all ered a strikingly different set of faces, each representing a
of our experiments, we present multiple spotlights obtained problem area for the model. The first shows a set of profile
in this way. (i.e., side) views, where it is difficult to see many of the facial
Since the sum of the weights, ki , has an upper bound of features; the second consists mostly of young children whose
N , we considered spotlight sizes ranging from S = 0.001N genders are relatively harder to discern; the third shows some
(0.1%) to S = 0.1N (10%). We found that spotlights on the faces that are shadowed or obscured. The fourth and fifth
smaller end of this spectrum were too selective to observe any spotlights consist of black faces in poor lighting and Asian
cohesion, whereas the largest spotlights were too inclusive. faces, respectively. (These demographic disparities are con-
Taking this into account, we settled on a spotlight size of 2% firmed in Figure 8, which shows the distribution of ages and
for vision models where images can be simply be scanned for races on each spotlight.) Overall, our spotlights identified
cohesion, and a spotlight size of 5% for non-vision models, both age and racial groups that the model performs poorly
where we found it necessary to describe spotlights using on—without access to these demographic labels—and se-
summary statistics. mantically meaningful groups for which labels did not exist.
In comparison, the high-loss images are an unstructured set
of examples that include occluded faces, poor lighting, blurry
Experiments shots, and out-of-frame faces.
The spotlight is relatively model-agnostic: it only requires GEORGE identified a total of six clusters. A random sam-
knowledge of the final layer representations and the losses ple of the images from the three clusters with the highest
for each input. We demonstrate this flexibility by using the average losses are shown in Figure 7. Notably, all of the
spotlight to evaluate a broad range of pre-trained models from images in each cluster have the same label, but share little
the literature, spanning image classification (faces; objects; in common beyond their labels. Like the high-loss images,
x-rays), NLP (sentiment analysis; question answering), and each of GEORGE’s clusters display a combination of camera
recommender systems (movies). In each case, we show that angles, lighting conditions, and occlusions that make the im-
the spotlight uncovers systematic issues that would have oth- ages difficult to classify (as opposed to the spotlights, which
erwise required group labels to uncover. Full results can be identify a single semantically meaningful issue).
found for every dataset we tested (most in the appendix),
1
showing the method’s surprising reliability. Experiments https://github.com/HazyResearch/hidden-stratification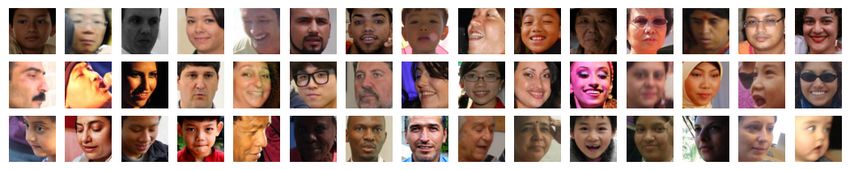
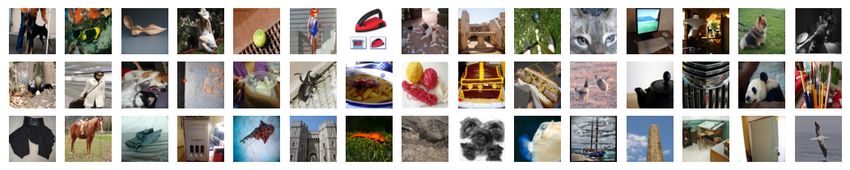
Random sample:

                                                      Highest losses: a diffuse set

                                             Spotlight 1: side profile views/poor framing

                                                      Spotlight 2: Asian children

                                                Spotlight 3: obscured/shadowed faces

                           Figure 2: Spotlights on FairFace validation set. Image captions list true label.

ImageNet                                                                Sentiment analysis: Amazon reviews
                                                                       Next, we turn to the Amazon polarity dataset (Zhang, Zhao,
For a second vision dataset, we study the pre-trained ResNet-          and Lecun 2015), a collection of 4 million plain-text Ama-
18 model from the PyTorch model zoo (PyTorch 2021), run-               zon reviews labelled as “positive” (4-5 stars) or “negative”
ning the spotlight on the 50,000 image validation set. As in           (1-2 stars). We used a popular pre-trained checkpoint of a
FairFace, we used the final 512-dimensional hidden layer of            DistilBERT model from Huggingface (HuggingFace 2021b),
the model as the representation space.                                 which was fine-tuned on SST-2. We ran the spotlight on a
   Our results are shown in Figures 3 and 9. Each spotlight            sample of 20,000 reviews from the validation set, using the fi-
found a set of images that have a clear “super-class”, but are         nal 768-dimensional hidden layer as the representation space.
difficult to classify beyond this super-class. The first spotlight        We found it more difficult to spot patterns in the spot-
contains a variety of images of people working, where it is            lights on this dataset by simply reading the highest-weight
difficult to tell whether the label should be about the person         reviews, so we instead summarized each spotlight by identify-
in the image, the task they’re performing, or another object;          ing the tokens that appeared most frequently in the spotlight
the second shows a variety of tools; the third shows a variety         distributions, relative to their frequencies in the validation
of green plants, where there is often an animal hiding in the          set. These results are shown in Figure 4. Remarkably, the
image; the fourth identifies some food and people posing; and          first spotlight surfaced reviews that were written in Spanish,
the fifth shows a variety of dogs. In contrast, the high-loss          which the model consistently classifies as negative: it was
images appear to have little structure, with many of them              only trained on English sentences, and its tokenizer appears
having unexpected labels, such as “pizza” for an image of a            to work poorly on Spanish sentences. The second spotlight
squirrel in a tree holding a piece of pizza.                           highlighted long-winded reviews of novels, which the model
   We did not run GEORGE on this model, as the clustering              has difficulty parsing; the third found reviews that mention
algorithm failed when attempting to split the 50 images in             aspects of customer service, such as product returns, which
each class into even smaller clusters. However, GEORGE’s               the model classifies as extremely negative.
clusters would be much different from the spotlights, as its              The highest-loss reviews in the dataset are quite different,
“subclass” clusters can only de-aggregate existing classes,            consisting almost entirely of mislabelled reviews. For exam-
whereas the spotlight tended to reveal semantically similar            ple, one review reads “The background music is not clear
groups of classes—“superclasses”—that the model had trou-              and the CD was a waste of money. One star is too high.”, but
ble distinguishing.                                                    has a 4-5 star rating; dozens of high-loss outliers follow this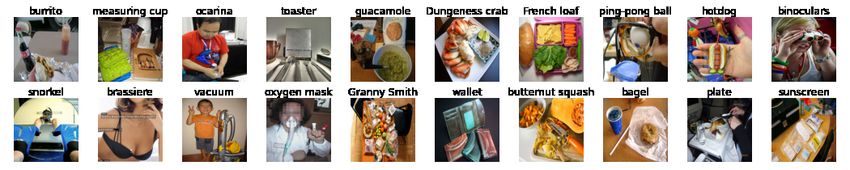
Random sample:

                                                  Highest losses: a diffuse set

                                                  Spotlight 1: people working

                                                   Spotlight 2: tools and toys

                                                 Spotlight 3: animals in foliage

                        Figure 3: Spotlights on ImageNet validation set. Image captions list true label.

pattern, where the rating clearly contradicts the review text.        The highest-weight movies in each spotlight are shown
We note that this type of label noise would pose a problem         in Figure 11. The first spotlight mostly identifies 3-4 star
for many robust optimization methods, which could insist           action and adventure films rated by prolific users, where the
that the model learn to memorize these outliers rather than        model is highly uncertain about which review they will give.
focusing on other important portions of the dataset.               The second finds reviews of highly rated drama films from a
   GEORGE found a total of 11 clusters; the three with the         small group of users with little reviewing history. The third
highest losses are also summarized in Figure 4. The first          shows unpopular action and comedy films, where the model
cluster is similar to the second spotlight, containing many        is nonetheless optimistic about the rating. In comparison, the
negative and wordy reviews for novels and movies that are          highest-loss predictions consist mostly of 1-star ratings on
misleading or difficult to parse. The second consists entirely     movies with high average scores.
of positive reviews, including many written in Spanish. The           GEORGE identified 21 clusters; we show the highest-loss
third is small, only containing 0.5% of the dataset, and we        predictions from three in Figure 12. The first two consist of a
found it difficult to summarize. Overall, several of the fea-      variety of 1- or 2-star ratings respectively, where the model
tures found by the spotlights also appear in GEORGE’s clus-        confidently makes 4- or 5-star predictions for both categories.
ters; a more in-depth analysis would help to understand how        Both clusters have similar genre distributions to the entire
the two methods differ on this model.                              dataset. The third cluster instead contains many 5-star ratings
                                                                   on comedy and drama films where the model is skeptical
MovieLens 100k                                                     about these high ratings. The GEORGE clusters differ from
We investigated a third domain, recommender sys-                   the spotlights, which tend to have more consistent movies or
tems. Specifically, we considered the MovieLens 100k               genres, but less consistent ratings.
dataset (Harper and Konstan 2015), a collection of 100,000
movie reviews of 1,000 movies from 1,700 different users. It        Additional Datasets: SQuAD and Chest X-rays
also includes basic information about each movie (titles, re-      We ran the spotlight on two additional datasets: SQuAD,
lease dates, genres) and user (age, gender, occupation), which     an NLP question-answering benchmark; and a chest x-ray
we use during the analysis, but did not make available to the      image dataset. Our results here were more ambiguous, but
model. For our model, we used a deep factorized autoen-            we describe these experiments regardless to emphasize the
coder (Hartford et al. 2018), using the final 600-dimensional      spotlight’s generality and to reassure the reader that we
hidden layer for our representation space.                         have presented all of our findings rather than cherry-picking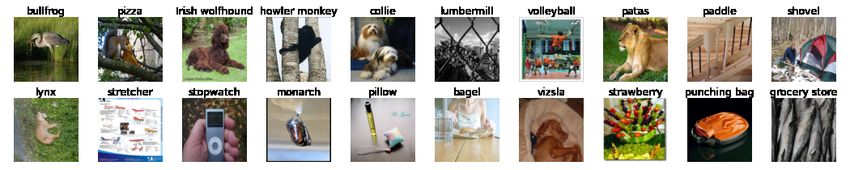
Subset                           Avg Length      Frequent words
       High loss                                 68.8   length, outdated, potter, bubble, contact, cinematography, adjust-
                                                        ing, functions, stock, versus
       Spotlight 1: Spanish                      79.1   que, est, como, y, las, tod, es, la, si, por
       Spotlight 2: novels                       88.7   super, wearing, job, prefer, bigger, hang, discover, killing, slip,
                                                        source
       Spotlight 3: customer service             80.7   problem, returned, que, hoping, ok, unfortunately, returning,
                                                        however, las, maybe
       GEORGE cluster 1                          77.6   ok, moore, fiction, okay, above, potter, thank, cinematography,
                                                        usa, jean
       GEORGE cluster 2                          75.9   que, para, y, est, como, es, tod, las, installation, la
       GEORGE cluster 3                          87.7   visuals, sugar, investment, score, study, surfer, dimensional, era,
                                                        dune, scarlet

                                            Figure 4: Spotlight on Amazon reviews.

favourable results. Full details can be found in the appendix.      two datasets for which we were unable to leverage an existing,
                                                                    pre-trained model.
SQuAD. The Stanford question answering dataset
(SQuAD) (Rajpurkar et al. 2016) is a benchmark of                   Quantitative Evaluation
question-answer pairs constructed from the content of 536
Wikipedia articles. We analyzed a pre-trained DistilBERT            Finally, we evaluated whether the spotlights were effective at
model (HuggingFace 2021a) fine-tuned on this dataset,               discovering high-loss regions in each model’s representation
running spotlights on the test set. We excluded long examples       space. To do this, we compared to a naive clustering baseline:
where the sum of the context and answer sequence lengths            we fit a Gaussian mixture model to each representation space
was greater than 384, leaving 10,386 question-answer pairs.         and compared the spotlight to the cluster with the highest
It was unclear which representation to use for the SQuAD            average loss. We fit 50 clusters on FairFace and ImageNet
spotlights, as the model has one output for each token in           and 20 clusters on Amazon and MovieLens, ensuring that a
the context rather than a single representation for the entire      typical cluster would be comparable in size to the spotlights.
example; we used the last-layer representations for the             Then, we compared the size and average loss of each cluster
[CLS] token in each example.                                        to the spotlights.
    The results are summarized in Figure 15. The spotlights             The results are shown in Figure 5. On FairFace, ImageNet,
particularly highlighted questions from the “packet switch-         and MovieLens, the first spotlight has a higher loss than
ing” and “civil disobedience” categories, which were the two        any of the clusters, showing that spotlight effectively iden-
categories with the highest loss, despite having no knowledge       tifies a high-loss region. On Amazon, two clusters have a
of these categories; the individual questions with the high-        higher average loss than the first spotlight, but they do so by
est losses identified the latter but not the former. We found       incorporating fewer points, finding a less widespread error.
little semantic structure beyond these high-level categories;       These results indicate that the spotlights reliably use informa-
a richer representation space is likely required to get more        tion about the model’s losses to identify a large systematic
insight into this dataset.                                          error, while a naive clustering method tends to split high-
                                                                    loss regions across several clusters or identify smaller failure
Chest x-rays. The chest x-ray dataset consists of 6,000             modes.
chest x-rays labelled as “pneumonia” or “healthy” (Kermany
et al. 2018). To summarize, the spotlight identified at least                            Future Directions
two semantically meaningful failure modes in this domain:           Our methods give rise to various promising directions for
images with a text label “R” on their sides, and images with        future work, many of which we have begun to investigate.
very high contrast. However, such images were also relatively       This section describes some of these ideas along with our
easy to identify in the set of high-loss inputs, so we were         initial findings.
unconvinced that the spotlight offered a decisive benefit in
this case. Due to our lack of expertise in radiology, we were       Using the spotlight for adversarial training. While this
unable to discover identifying attributes in the spotlighted        paper advocates for the spotlight as a method for auditing
clusters; it is quite possible that other spotlighted clusters      deep learning models, it also gives rise to a natural, adver-
were semantically related in more fundamental ways. It is           sarial objective that could be optimized during training in
also possible that the small training set size led to a less        the style of the distributionally robust methods surveyed ear-
meaningful embedding space; indeed, this was one of only            lier (Duchi, Hashimoto, and Namkoong 2020; Lahoti et al.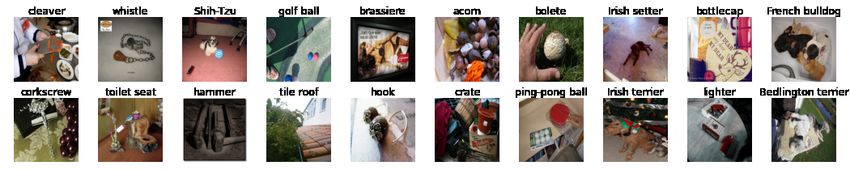
Figure 5: Sizes and average losses for clusters and spotlights. FairFace and ImageNet show spotlights containing 2% of the
dataset and 50 clusters; Amazon reviews and MovieLens show spotlights containing 5% of the dataset and 20 clusters.

2020). That is, model training could iterate between iden-        repeatedly observed that the spotlight was able to discover
tifying a spotlight distribution, reweighting the input data      meaningful groups of problematic inputs across a wide va-
accordingly, and minimizing loss on this reweighted input.        riety of models and datasets, including poorly modelled age
A model that performed well on this objective would have          groups and races, ImageNet classes that were difficult to
very balanced performance, distributing inputs with poor          distinguish, reviews written in Spanish, difficult question
performance diffusely across the representation space. Un-        categories, and specific movies with unpredictable reviews.
fortunately, our preliminary tests suggest that optimizing for    The spotlight found all of these sets without access to side
this objective is not simple. With large spotlights (10% of       information such as demographics, topics, or genres.
dataset), we found that this method made little difference,          The spotlight is not a direct solution to the problem of
with the model improving more slowly than in regular train-       systematic errors in deep learning models, instead fitting into
ing; with smaller spotlights (1%), the model struggled to         a broader feedback loop of developing, auditing, and miti-
learn anything, fluctuating wildly in performance between         gating models. The spotlight is useful in the auditing stage
epochs. We intend to continue investigating approaches for        of this loop, helping practitioners to discover semantically
training against this flexible adversary.                         meaningful areas of weakness that they can then test in more
Structure in representations. An important assumption             depth and address through changes to their pipeline. Such
that the spotlight makes is that nearby points in the represen-   a human-in-the-loop discovery process is critical to identify
tation space will tend to correspond to semantically similar      systematic failure modes in deep learning systems and miti-
inputs. While this assumption is empirically supported both       gate them before they are able to cause harmful consequences
by our results and by prior work (Sohoni et al. 2020), it is an   in deployed systems.
emergent property of deep learning models, and we do not
currently understand this property’s sensitivity to details of    Potential social impacts. The spotlight can be a useful ad-
the architecture and training method. For instance, does the      dition to machine learning practitioners’ toolboxes, augment-
choice of optimizer (SGD/Adam, weight decay, learning rate,       ing their existing robustness tests. However, the spotlight can
. . . ) affect the representation space in a way that interacts   only show the existence of a systematic error, not prove that
with the spotlight? Could we instead leverage representations     a model has none. It is possible that a practitioner could get a
learned by alternative models, such as autoencoders?              false sense of security if the spotlight turns up no significant
                                                                  issues – perhaps because their model’s biased representation
Spurious correlations. In particular, models that have            hides an important issue, or because they miss a systematic
learned spurious correlations could act quite differently from    error on visual inspection. On balance, the potential to un-
the models we studied in this work. For example, consider         cover new issues outweighs the risk of believing there are
a model trained on the Waterbirds dataset (Sagawa et al.          none, especially when the spotlight is used in concert with
2019), where it is possible to reach high training accuracy       other fairness or robustness methods.
by learning to recognize land/water backgrounds instead of           Additionally, it is conceivable that the spotlight could be
correctly identifying land/water birds. The model’s represen-     used for debugging harmful AI systems, such as surveillance
tation would then focus mostly on details of the backgrounds,     technology, to identify regimes under which these technolo-
and spotlights would be unable to substantially change the dis-   gies fail and to further improve their efficacy. This is unavoid-
tribution of bird types. Investigating a model’s representation   able: the spotlight is general enough to work on a wide range
spaces with tools like the spotlight could help to understand     of model architectures, including those that might cause neg-
why a model is failing on a particular distribution shift.        ative social impacts. Overall, though, we do not see this as
                                                                  a likely use case; the spotlight’s main likely effect would be
                       Conclusions                                helping practitioners to increase the fairness and robustness
The spotlight is an automatic and computationally efficient       of deployed deep learning systems and to gain confidence
method for surfacing semantically related inputs upon which       that their models to not systematically discriminate against
a deep learning model performs poorly. In experiments, we         coherent subpopulations of users.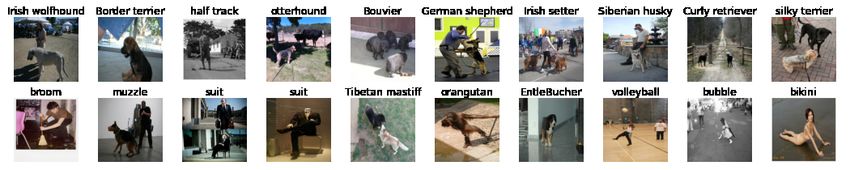
References                                HuggingFace. 2021a. DistilBERT base uncased distilled
Ahn, Y.; and Lin, Y.-R. 2019. FairSight: Visual analytics for     SQuAD. https://huggingface.co/distilbert-base-uncased-
fairness in decision making. IEEE transactions on visualiza-      distilled-squad. Accessed: 2021-05-28.
tion and computer graphics, 26(1): 1086–1095.                     HuggingFace. 2021b. DistilBERT base uncased fine-
Arjovsky, M.; Bottou, L.; Gulrajani, I.; and Lopez-Paz,           tuned SST-2. https://huggingface.co/distilbert-base-uncased-
D. 2019. Invariant risk minimization. arXiv preprint              finetuned-sst-2-english. Accessed: 2021-05-28.
arXiv:1907.02893.                                                 Karkkainen, K.; and Joo, J. 2021. FairFace: Face attribute
Buolamwini, J.; and Gebru, T. 2018. Gender shades: In-            dataset for balanced race, gender, and age for bias measure-
tersectional accuracy disparities in commercial gender clas-      ment and mitigation. In Proceedings of the IEEE/CVF Winter
sification. In Conference on fairness, accountability and         Conference on Applications of Computer Vision, 1548–1558.
transparency, 77–91. PMLR.                                        Kermany, D. S.; Goldbaum, M.; Cai, W.; Valentim, C. C.;
Cabrera, Á. A.; Epperson, W.; Hohman, F.; Kahng, M.; Mor-        Liang, H.; Baxter, S. L.; McKeown, A.; Yang, G.; Wu, X.;
genstern, J.; and Chau, D. H. 2019. FairVis: Visual analytics     Yan, F.; et al. 2018. Identifying medical diagnoses and treat-
for discovering intersectional bias in machine learning. In       able diseases by image-based deep learning. Cell, 172(5):
2019 IEEE Conference on Visual Analytics Science and Tech-        1122–1131.
nology (VAST), 46–56. IEEE.                                       Kim, M. P.; Ghorbani, A.; and Zou, J. 2019. Multiaccuracy:
Cai, C. J.; Winter, S.; Steiner, D.; Wilcox, L.; and Terry,       Black-box post-processing for fairness in classification. In
M. 2019. “Hello AI”: Uncovering the onboarding needs of           Proceedings of the 2019 AAAI/ACM Conference on AI, Ethics,
medical practitioners for human-AI collaborative decision-        and Society, AIES ’19, 247–254. New York, NY, USA: As-
making. Proc. ACM Hum.-Comput. Interact., 3(CSCW).                sociation for Computing Machinery. ISBN 9781450363242.
Chen, I. Y.; Johansson, F. D.; and Sontag, D. 2018. Why           Koenecke, A.; Nam, A.; Lake, E.; Nudell, J.; Quartey, M.;
is my classifier discriminatory? In Proceedings of the 32nd       Mengesha, Z.; Toups, C.; Rickford, J. R.; Jurafsky, D.; and
International Conference on Neural Information Processing         Goel, S. 2020. Racial disparities in automated speech recog-
Systems, 3543–3554.                                               nition. Proceedings of the National Academy of Sciences,
Chung, Y.; Kraska, T.; Polyzotis, N.; and Whang, S. E. 2018.      117(14): 7684–7689.
Slice finder: Automated data slicing for model validation.        Lahoti, P.; Beutel, A.; Chen, J.; Lee, K.; Prost, F.; Thain,
CoRR, abs/1807.06068.                                             N.; Wang, X.; and Chi, E. H. 2020. Fairness without demo-
Corbett-Davies, S.; and Goel, S. 2018. The measure and            graphics through adversarially reweighted learning. CoRR,
mismeasure of fairness: A critical review of fair machine         abs/2006.13114.
learning. arXiv preprint arXiv:1808.00023.                        Li, J.; Moskovitch, Y.; and Jagadish, H. V. 2021. DE-
Creager, E.; Jacobsen, J.; and Zemel, R. S. 2020. Exchanging      NOUNCER: Detection of unfairness in classifiers. Proc.
lessons between algorithmic fairness and domain generaliza-       VLDB Endow., 14: 2719–2722.
tion. CoRR, abs/2010.07249.                                       Martinez, N.; Bertran, M.; and Sapiro, G. 2020. Minimax
D’Amour, A.; Heller, K.; Moldovan, D.; Adlam, B.; Ali-            Pareto fairness: A multi objective perspective. In III, H. D.;
panahi, B.; Beutel, A.; Chen, C.; Deaton, J.; Eisenstein, J.;     and Singh, A., eds., Proceedings of the 37th International
and Hoffman, M. D. e. a. 2020. Underspecification presents        Conference on Machine Learning, volume 119 of Proceed-
challenges for credibility in modern machine learning. arXiv      ings of Machine Learning Research, 6755–6764. PMLR.
preprint arXiv:2011.03395.
                                                                  Mitchell, M.; Wu, S.; Zaldivar, A.; Barnes, P.; Vasserman,
de Vries, T.; Misra, I.; Wang, C.; and van der Maaten, L. 2019.   L.; Hutchinson, B.; Spitzer, E.; Raji, I. D.; and Gebru, T.
Does object recognition work for everyone? In Proceedings         2019. Model cards for model reporting. In Proceedings of
of the IEEE/CVF Conference on Computer Vision and Pattern         the conference on fairness, accountability, and transparency,
Recognition Workshops, 52–59.                                     220–229.
Duchi, J. C.; Hashimoto, T.; and Namkoong, H. 2020. Distri-       Oren, Y.; Sagawa, S.; Hashimoto, T. B.; and Liang, P. 2019.
butionally robust losses for latent covariate mixtures. CoRR,     Distributionally robust language modeling. arXiv preprint
abs/2007.13982.                                                   arXiv:1909.02060.
Harper, F. M.; and Konstan, J. A. 2015. The MovieLens
                                                                  Pastor, E.; de Alfaro, L.; and Baralis, E. 2021. Identify-
datasets: History and context. Acm transactions on interac-
                                                                  ing biased subgroups in ranking and classification. CoRR,
tive intelligent systems (tiis), 5(4): 1–19.
                                                                  abs/2108.07450.
Hartford, J.; Graham, D.; Leyton-Brown, K.; and Ravan-
bakhsh, S. 2018. Deep models of interactions across sets. In      Perelman, L. 2014. When “the state of the art” is counting
International Conference on Machine Learning, 1909–1918.          words. Assessing Writing, 21: 104–111.
PMLR.                                                             PyTorch. 2021. Torchvision models. https://pytorch.org/
Hashimoto, T.; Srivastava, M.; Namkoong, H.; and Liang, P.        vision/stable/models.html. Accessed: 2021-05-28.
2018. Fairness without demographics in repeated loss mini-        Rajpurkar, P.; Zhang, J.; Lopyrev, K.; and Liang, P. 2016.
mization. In International Conference on Machine Learning,        SQuAD: 100,000+ questions for machine comprehension of
1929–1938. PMLR.                                                  text. arXiv preprint arXiv:1606.05250.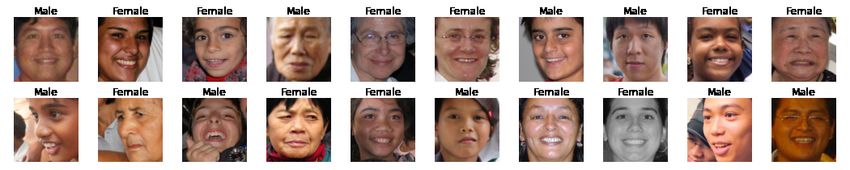
Sagawa, S.; Koh, P. W.; Hashimoto, T. B.; and Liang, P. 2019.
Distributionally robust neural networks. In International
Conference on Learning Representations.
Shah, M.; Chen, X.; Rohrbach, M.; and Parikh, D. 2019.
Cycle-consistency for robust visual question answering. In
Proceedings of the IEEE/CVF Conference on Computer Vi-
sion and Pattern Recognition, 6649–6658.
Sohoni, N.; Dunnmon, J.; Angus, G.; Gu, A.; and Ré, C.
2020. No subclass left behind: Fine-grained robustness in
coarse-grained classification problems. Advances in Neural
Information Processing Systems, 33.
Wexler, J.; Pushkarna, M.; Bolukbasi, T.; Wattenberg, M.;
Viégas, F.; and Wilson, J. 2019. The What-If Tool: Interactive
probing of machine learning models. IEEE transactions on
visualization and computer graphics, 26(1): 56–65.
Wu, T.; Ribeiro, M. T.; Heer, J.; and Weld, D. 2019. Errudite:
Scalable, reproducible, and testable error analysis. In Pro-
ceedings of the 57th Annual Meeting of the Association for
Computational Linguistics, 747–763. Florence, Italy: Associ-
ation for Computational Linguistics.
Zhang, X.; Zhao, J.; and Lecun, Y. 2015. Character-level
convolutional networks for text classification. Advances in
Neural Information Processing Systems, 28.
Dataset Details
In Figure 6, we summarize licensing and content considera-
tions for each of the datasets used in this work.

                  Additional Results
In this section, we include additional outputs from the spot-
lights on the image and MovieLens datasets that were de-
scribed in the text. In particular, we include:
 • FairFace: fourth and fifth spotlights and GEORGE clus-
   ters in Figure 7; demographic info in Figure 8
 • ImageNet: fourth and fifth spotlights in Figure 9
 • MovieLens: high loss ratings in Figure 10; spotlight ex-
   amples in Figure 11; GEORGE clusters in Figure 12.
 • Chest x-rays: random sample, high loss examples, and
   first three spotlights in Figure 13; final two spotlights in
   Figure 14
 • SQuAD: common words and topics from each spotlight
   in Figure 15
Dataset License PII Offensive content
FairFace CC BY 4.0 none none
ImageNet custom non-commercial none none
Amazon reviews Apache 2.0 none Offensive words in reviews are censored
SQuAD CC BY 4.0 none none
MovieLens 100K custom non-commercial none none
Chest x-rays CC BY 4.0 none none
Adult MIT none none
Wine quality MIT none none
Figure 6: Details for each of the datasets used in this paper.Spotlight 4: dark skin tones; poor lighting
Spotlight 5: Asian faces
GEORGE cluster 1
GEORGE cluster 2
GEORGE cluster 3
Figure 7: Additional spotlights and GEORGE clusters on FairFace.Figure 8: Demographics on FairFace.
Spotlight 4: food; people posing
Spotlight 5: outdoor dogs
Figure 9: Additional spotlights on ImageNet.Prediction Rating Loss Movie Genre Avg (# Reviews) User ID (# Reviews)
4 1 11.2 Pulp Fiction Crime 4.2 (82) 305 (97)
4 5 11.0 Princess Bride, The Action 4.1 (58) 419 (3)
5 1 10.9 Face/Off Action 3.9 (42) 296 (73)
4 1 10.5 Usual Suspects, The Crime 4.3 (56) 234 (202)
4 1 8.8 Fargo Crime 4.3 (113) 198 (75)
3 5 8.7 Wizard of Oz, The Adventure 4.2 (46) 358 (8)
5 1 8.1 Alien Action 4.2 (68) 295 (96)
3 1 8.0 Mother Comedy 3.2 (34) 100 (25)
4 1 7.9 Boot, Das Action 4.0 (35) 102 (104)
5 1 7.9 English Patient, The Drama 3.7 (93) 239 (73)
5 1 7.8 Shallow Grave Thriller 3.7 (14) 342 (73)
5 1 7.8 Face/Off Action 3.9 (42) 145 (131)
4 1 7.7 Devil’s Advocate, The Crime 3.7 (31) 15 (44)
3 5 7.6 Addams Family Values Comedy 3.1 (18) 326 (74)
5 1 7.5 Raiders of the Lost Ark Action 4.3 (76) 269 (156)
Figure 10: Rating predictions with highest losses from MovieLens 100k.Spotlight 1: 3-4 star action films; high model uncertainty
Prediction Rating Loss Movie Genre Avg (# Reviews) User ID (# Reviews)
4 2 1.7 Romeo and Juliet Drama 3.4 (27) 13 (263)
5 1 1.6 Lost Highway Mystery 2.8 (26) 347 (78)
1 3 1.6 Crow, The Action 3.4 (30) 217 (39)
4 3 1.4 True Lies Action 3.2 (40) 13 (263)
3 2 1.8 Crow, The Action 3.4 (30) 197 (66)
4 3 1.7 Jurassic Park Action 3.6 (53) 363 (102)
5 4 1.4 Happy Gilmore Comedy 3.2 (19) 145 (131)
3 3 1.2 Crow, The Action 3.4 (30) 109 (100)
4 1 1.3 Crash Drama 2.5 (35) 286 (130)
4 3 1.5 Happy Gilmore Comedy 3.2 (19) 223 (53)
5 5 1.0 Cook the Thief, The Drama 3.6 (13) 269 (156)
4 4 1.1 True Lies Action 3.2 (40) 347 (78)
2 2 1.1 Romeo and Juliet Drama 3.4 (27) 201 (171)
4 4 1.2 Gattaca Drama 3.2 (23) 13 (263)
4 5 1.5 Jurassic Park Action 3.6 (53) 217 (39)
Spotlight 2: highly rated drama films; users with few reviews
Prediction Rating Loss Movie Genre Avg (# Reviews) User ID (# Reviews)
3 4 1.2 Shine Drama 4.0 (23) 382 (20)
4 2 1.9 Big Night Drama 4.0 (30) 382 (20)
4 5 1.4 Madness of King George, The Drama 4.0 (22) 354 (81)
5 3 1.2 Godfather, The Action 4.4 (73) 382 (20)
4 3 1.3 Bound Crime 3.8 (30) 329 (28)
4 4 0.8 Shine Drama 4.0 (23) 214 (65)
5 2 3.4 Fish Called Wanda, A Comedy 4.0 (50) 370 (19)
3 3 0.7 People vs. Larry Flynt, The Drama 3.6 (49) 382 (20)
4 2 3.5 Pulp Fiction Crime 4.2 (82) 370 (19)
4 3 1.3 Singin’ in the Rain Musical 4.2 (38) 370 (19)
4 2 2.4 Shine Drama 4.0 (23) 116 (55)
3 3 1.0 Alien Action 4.2 (68) 382 (20)
3 4 1.1 Braveheart Action 4.2 (67) 370 (19)
4 4 0.6 Shine Drama 4.0 (23) 243 (36)
4 2 1.9 Shine Drama 4.0 (23) 201 (171)
Spotlight 3: unpopular action/comedy movies; users with many reviews
Prediction Rating Loss Movie Genre Avg (# Reviews) User ID (# Reviews)
4 4 0.4 Drop Zone Action 2.4 (9) 130 (175)
4 2 1.8 Mouse Hunt Childrens 2.6 (7) 29 (17)
4 4 0.9 Arrival, The Action 2.7 (14) 363 (102)
3 4 1.1 Father of the Bride Part II Comedy 2.7 (22) 222 (174)
4 1 1.8 Father of the Bride Part II Comedy 2.7 (22) 81 (28)
4 3 1.1 Drop Zone Action 2.4 (9) 393 (133)
3 3 0.8 Space Jam Adventure 2.6 (13) 303 (208)
4 3 1.3 Father of the Bride Part II Comedy 2.7 (22) 223 (53)
1 3 1.2 Disclosure Drama 2.7 (10) 303 (208)
4 3 1.2 Arrival, The Action 2.7 (14) 303 (208)
3 3 0.9 Space Jam Adventure 2.6 (13) 21 (84)
4 4 0.6 Casper Adventure 2.6 (12) 83 (77)
4 2 1.6 Last Man Standing Action 2.8 (14) 303 (208)
3 2 1.4 Drop Zone Action 2.4 (9) 197 (66)
3 1 1.6 Arrival, The Action 2.7 (14) 201 (171)
Figure 11: Spotlights on MovieLens 100k.GEORGE cluster 1
Prediction Rating Loss Movie Genre Avg (# Reviews) User reviews
4 1 11.2 Pulp Fiction Crime 4.2 (82) 97
5 1 10.9 Face/Off Action 3.9 (42) 73
4 1 10.5 Usual Suspects, The Crime 4.3 (56) 202
4 1 8.8 Fargo Crime 4.3 (113) 75
5 1 8.1 Alien Action 4.2 (68) 96
3 1 8.0 Mother Comedy 3.2 (34) 25
4 1 7.9 Boot, Das Action 4.0 (35) 104
5 1 7.9 English Patient, The Drama 3.7 (93) 73
5 1 7.8 Shallow Grave Thriller 3.7 (14) 73
5 1 7.8 Face/Off Action 3.9 (42) 131
4 1 7.7 Devil’s Advocate, The Crime 3.7 (31) 44
5 1 7.5 Raiders of the Lost Ark Action 4.3 (76) 156
4 1 7.3 Devil’s Own, The Action 2.9 (47) 175
5 1 6.4 Empire Strikes Back, The Action 4.2 (72) 108
4 1 6.2 Clueless Comedy 3.4 (24) 121
GEORGE cluster 2
Prediction Rating Loss Movie Genre Avg (# Reviews) User reviews
4 2 7.4 Grosse Pointe Blank Comedy 3.7 (29) 208
5 2 7.2 Citizen Kane Drama 4.3 (40) 102
5 2 6.0 Fargo Crime 4.3 (113) 22
4 2 5.9 Jaws Action 3.8 (62) 84
5 2 5.8 Schindler’s List Drama 4.4 (61) 184
5 2 5.8 Sense and Sensibility Drama 4.2 (51) 131
3 2 5.6 Peacemaker, The Action 3.4 (24) 12
4 2 5.4 Star Wars Action 4.4 (99) 78
5 2 5.4 Full Monty, The Comedy 4.0 (63) 263
4 2 5.3 Shawshank Redemption, The Drama 4.5 (60) 109
4 2 5.2 Groundhog Day Comedy 3.6 (56) 179
4 2 5.2 Sweet Hereafter, The Drama 3.3 (9) 12
4 2 5.2 Usual Suspects, The Crime 4.3 (56) 76
4 2 5.2 Bullets Over Broadway Comedy 3.7 (24) 78
4 2 5.2 Contact Drama 3.7 (107) 149
GEORGE cluster 3
Prediction Rating Loss Movie Genre Avg (# Reviews) User reviews
2 5 4.8 2001: A Space Odyssey Drama 4.1 (57) 155
4 5 4.2 Cool Hand Luke Comedy 4.1 (31) 143
2 5 4.2 Birdcage, The Comedy 3.4 (62) 217
3 5 2.8 Gandhi Drama 4.0 (38) 155
3 5 2.4 Schindler’s List Drama 4.4 (61) 155
4 5 2.2 Cape Fear Film-Noir 3.7 (20) 155
4 5 1.7 Blues Brothers, The Action 3.9 (45) 155
4 5 1.5 Cool Hand Luke Comedy 4.1 (31) 146
4 5 1.4 Cool Hand Luke Comedy 4.1 (31) 98
4 5 1.3 Cool Hand Luke Comedy 4.1 (31) 33
4 5 1.2 Cool Hand Luke Comedy 4.1 (31) 47
4 5 1.1 Cool Hand Luke Comedy 4.1 (31) 101
5 5 1.1 Grease Comedy 3.6 (32) 155
5 5 1.1 Empire Strikes Back, The Action 4.2 (72) 155
4 5 1.0 Cool Hand Luke Comedy 4.1 (31) 114
Figure 12: GEORGE clusters on MovieLens 100k.Random sample:
Highest losses:
Spotlight 1:
Spotlight 2:
Spotlight 3:
Figure 13: Chest xray sample images, high loss images, and spotlights.Spotlight 4:
Spotlight 5:
Figure 14: Additional chest xray spotlights.
Subset Frequent words Frequent topics
High loss sacks, tackles, confused, yards, behavior, civil disobedience, 1973 oil crisis,
touchdowns, defendants, protesters, cor- complexity theory
nerback, interceptions
Spotlight 1 packet, packets, switching, circuit, pad, packet switching, civil disobedience,
messages, dialogue, aim, networking, computational complexity theory
why,
Spotlight 2 touchdowns, passes, offense, yards, re- civil disobedience, ctenophora, yuan
ceptions, rating, anderson, receiver, punt, dynasty
selections
Spotlight 3 networking, alice, capacity, consequence, packet switching, teacher, force
combining, teach, views, protest, acceler-
ation, switching
Figure 15: Spotlights on SQuAD.You can also read


