Towards a functional - structural plant model of cut-rose: simulation of light environment, light absorption, photosynthesis and interference with ...
←
→
Page content transcription
If your browser does not render page correctly, please read the page content below
Annals of Botany 108: 1121– 1134, 2011
doi:10.1093/aob/mcr190, available online at www.aob.oxfordjournals.org

       PART OF A SPECIAL ISSUE ON FUNCTIONAL– STRUCTURAL PLANT MODELLING

        Towards a functional – structural plant model of cut-rose: simulation
    of light environment, light absorption, photosynthesis and interference with
                                 the plant structure
               Gerhard Buck-Sorlin 1,2,*, Pieter H. B. de Visser 2, Michael Henke 5, Vaia Sarlikioti 6,
                    Gerie W. A. M. van der Heijden 1, Leo F. M. Marcelis 2,3 and Jan Vos 4
1
 Biometris, 2Greenhouse Horticulture, 3Horticultural Production Chains, 4Centre for Crop Systems Analysis, Wageningen UR,
    Droevendaalsesteeg 1, 6708 PB Wageningen, the Netherlands, 5Georg-August-University of Göttingen, Department of
Ecoinformatics, Biometrics and Forest Growth, Büsgenweg 4, 37077 Göttingen, Germany and 6Institut National de la Recherche
Agronomique, Unité de Recherches en Ecophysiologie et Horticulture, Domaine St-Paul, Site Agroparc, 84914 Avignon Cedex 9,
                                                          France
                                * For correspondence. E-mail gerhard.buck-sorlin@wur.nl

                                                                                                                                         Downloaded from http://aob.oxfordjournals.org/ by guest on September 25, 2015
           Received: 3 March 2011 Revision requested: 7 April 2011 Accepted: 25 May 2011 Published electronically: 19 August 2011

             † Background and Aims The production system of cut-rose (Rosa × hybrida) involves a complex combination of
             plant material, management practice and environment. Plant structure is determined by bud break and shoot
             development while having an effect on local light climate. The aim of the present study is to cover selected
             aspects of the cut-rose system using functional –structural plant modelling (FSPM), in order to better understand
             processes contributing to produce quality and quantity.
             † Methods The model describes the production system in three dimensions, including a virtual greenhouse
             environment with the crop, light sources (diffuse and direct sun light and lamps) and photosynthetically active
             radiation (PAR) sensors. The crop model is designed as a multiscaled FSPM with plant organs (axillary buds,
             leaves, internodes, flowers) as basic units, and local light interception and photosynthesis within each leaf. A
             Monte-Carlo light model was used to compute the local light climate for leaf photosynthesis, the latter described
             using a biochemical rate model.
             † Key Results The model was able to reproduce PAR measurements taken at different canopy positions, different
             times of the day and different light regimes. Simulated incident and absorbed PAR as well as net assimilation rate
             in upright and bent shoots showed characteristic spatial and diurnal dynamics for different common cultivation
             scenarios.
             † Conclusions The model of cut-rose presented allowed the creation of a range of initial structures thanks to inter-
             active rules for pruning, cutting and bending. These static structures can be regarded as departure points for the
             dynamic simulation of production of flower canes. Furthermore, the model was able to predict local ( per leaf )
             light absorption and photosynthesis. It can be used to investigate the physiology of ornamental plants, and
             provide support for the decisions of growers and consultants.

              Key words: Cut-rose, Rosa × hybrida, bud break, light distribution, interactive modelling, functional –structural
              plant model, FSPM, L-system, virtual PAR sensor.

                     IN T RO DU C T IO N                                built with axillary buds in various positions which may
                                                                        break to produce new ‘upright shoots’ (altogether constituting
Cut-rose (Rosa × hybrida) is an important horticultural com-            the ‘upright canopy’). The latter are harvested once a flower
modity worldwide. Cut-roses are grown in greenhouses, in                bud has advanced to the appropriate developmental stage.
which most environmental factors are controlled (temperature,           Small shoots and shoots without a flower are bent down. The
CO2, supply of water and nutrients, relative humidity, light).          bent shoots branch, forming the ‘bent canopy’ that serves to
Roses are vegetatively propagated from cuttings, which                  produce assimilates for ‘upright shoots’. In contrast to the
consist of a piece of stem with a leaf and an axillary bud.             upright canopy, shoots in the bent canopy are prevented
The cutting is rooted and the bud grows out to form the                 from forming flowers by regular removal (‘pinching’) of
primary shoot. The primary shoot is usually prevented from              flower buds. One crop produces shoots continuously over a
flowering and bent down after 6 – 8 weeks. Secondary buds               period of 4 – 6 years.
located in the axils of scale leaves at the base of the bent               Growth and development also depend on management. The
primary shoot grow out to form a number of shoots, so-called            latter involves harvesting time, cutting height, pruning,
‘bottom breaks’. After several cuts of bottom breaks and of             bending and greenhouse climate control. In the face of con-
descendant shoots (each time leaving a ‘stump’ of the har-              tinuous change in technology and cultivar characteristics,
vested shoot) a ‘permanent basal structure’ of the plant is             there is a strong desire for an improved understanding of the

             # The Author 2011. Published by Oxford University Press on behalf of the Annals of Botany Company. All rights reserved.
                                                                        For Permissions, please email: journals.permissions@oup.com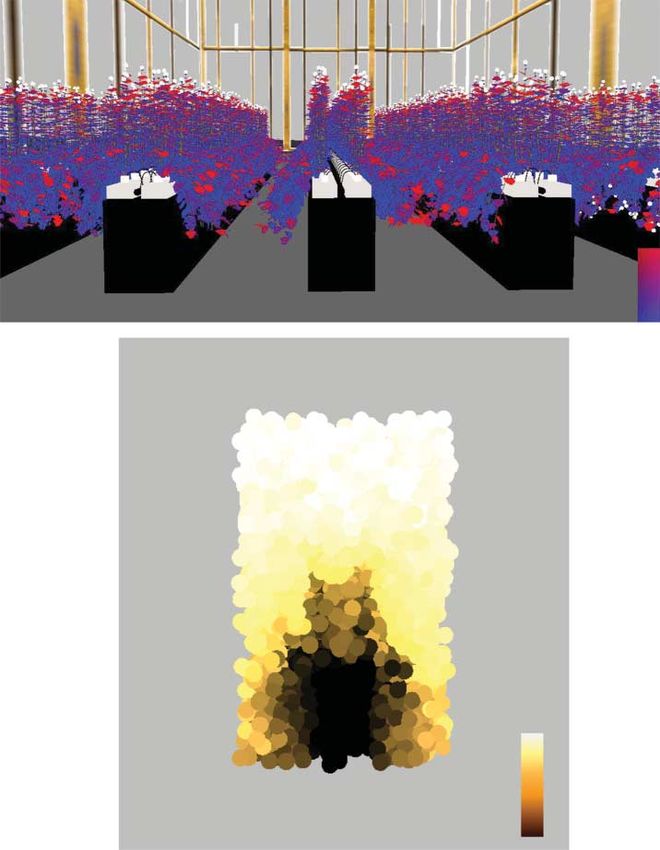
1122                                    Buck-Sorlin et al. — Towards a FSPM of cut-rose

relationships between the plant’s architecture, the distribution     is important that photosynthesis models are chosen that ade-
of buds (as determined by the architecture) and breaking of          quately quantify the effects of variable temperature and
axillary buds as well as the quality of shoots arising from          carbon dioxide concentration as these environmental variables
these buds, with a prerequisite for the presence of a perfect        are subject to management.
flower on the top of the stem.
   Functional – structural plant models (FSPMs, also known as
virtual plants) can be defined as models explicitly describing       Bud break. In principle a model needs to keep track of all buds
the development over time of the three-dimensional (3-D)             in the plant structure. At each time step it needs to evaluate the
architecture or structure of plants as governed by physiological     probability of breaking of a bud, given its position and
processes which, in turn, are driven by environmental factors        environmental parameters. Correct quantification of bud
(Kurth, 1994; Sievänen et al., 1997; Vos et al., 2010).             break is essential if the model is to be of value for the industry.
Commonly such models describe a plant as a set of intercon-          Bud break could simply be computed as a function of the topo-
nected phytomers. A phytomer is a growth unit resulting              logical distance of the bud to a cutting surface, as done by Pien
from the activity of an apical meristem and usually consisting       (2007). However, such a model can only be applied to axillary
of an internode, a leaf and an axillary bud. The organs of each      buds positioned on the stumps of harvested upright shoots
phytomer have attributes such as weight, shape, orientation in       (‘stump buds’), as only for these are sufficient data available.
space and optical properties that affect the amount of light         There is, to our knowledge, no quantitative information about

                                                                                                                                           Downloaded from http://aob.oxfordjournals.org/ by guest on September 25, 2015
intercepted, e.g. for photosynthesis. This modelling approach        the breaking of axillary buds within the bent canopy.
is particularly suited to integrate and apply knowledge on
plant architecture and bud break. In particular, feedback
between structure and function can be implemented and veri-          Dynamics of growth and development of individual organs.
fied at various levels, e.g. locally at the organ scale and glob-    Meristems produce new phytomers. The organs of a phytomer
ally at the plant or canopy scale.                                   (internode, petiole, leaf blade, axillary bud) exhibit character-
   When designing an FSPM of a glasshouse cut-rose crop a            istic dynamics with respect to their time of initiation, their
number of elements need to be considered, including: (1)             increase in weight and volume, shape and orientation in
light distribution and light interception, (2) photosynthesis,       space (Fournier and Andrieu, 2000).
(3) bud break, (4) the dynamics of growth and development
of individual organs, (5) manipulation of the plant structure
by cutting and bending, and (6) plant architecture.                  Plant manipulation. The fate of a rose plant is characterized by
                                                                     continuous human interference: bending of shoots, harvesting
                                                                     flower canes, pruning and ‘pinching’ (removal of flower-
                                                                     bearing branches). Each of these interferences has conse-
Light distribution and light interception. Light received by indi-   quences for the functioning of the plant. For instance, taking
vidual leaves in the canopy comes from several sources: direct       away a flower branch also entails removal of its mature
sunlight and diffuse sky light penetrating the cover of the          leaves, which are a source, but also alters the hormonal bal-
glasshouse, and light from additional lamps [e.g. high-pressure      ances governing bud break. Hence, it is essential to develop
sodium (SON-T) lamps] mounted in a particular configuration          provisions to allow interruption of the model run, to execute
at some height above the canopy. Modelling entails defining          the type of interferences mentioned. Such interferences can
the directions and flux densities from each source as these          be phrased as rules, which are applied either automatically
change over the course of the day. Depending on the                  and then linked to conditions, e.g. ‘remove all mature shoots
purpose of the study a distinction can be made between               at a specified cutting height’, or manually, executing a particu-
receipt of total energy or only photosynthetically active radi-      lar interference with an organ chosen interactively by the user.
ation (PAR), while for an understanding of photomorphoge-            The properties of removed material such as leaf area, weight,
netic effects separate simulation of red and far-red radiation       length and diameter of harvested shoots need to be retrievable.
is required (Evers et al., 2006; Kahlen and Stützel, 2011).
Optical properties of the plant and glasshouse material deter-
mine the scattering of light in the canopy and the receipt of        Plant architecture. The recurrent application of the processes
energy at each position in the 3-D structure. Buck-Sorlin            described above, mainly bud break and growth and develop-
et al. (2010) have made first steps towards the adequate mod-        ment of organs, in combination with plant manipulation,
elling of these complex light regimes.                               results in the architecture of the plant. This 3-D structure mod-
                                                                     ifies the local light climate, thus having an influence on local
Simulation of the (daily) carbon assimilate production rate.         light interception and photosynthesis, and ultimately on
Calculation of the production rate of carbon assimilates, or         growth and development of further structures.
gross photosynthesis, depends on simulating the position and            The objective of the present paper is to describe a static
orientation in space of leaves, their area, photosynthetic prop-     FSPM of cut-rose focusing on simulation of the local light
erties and light absorption. There are various models available      climate and photosynthesis rate in connection with plant
that calculate the leaf photosynthesis rate in rose (e.g. Lieth      manipulation. We show, under different scenarios, the influ-
and Pasian, 1990; Kim and Lieth, 2003). These models can             ence of initial plant set-up ( plant density) and the history of
be applied at every time step to every single leaf unit that is      structure management (size of the bent canopy) on light inter-
distinguished in the 3-D model. In glasshouse production it          ception and canopy photosynthesis.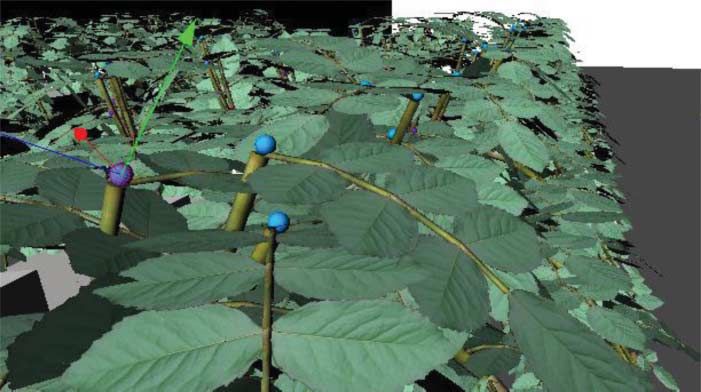
Buck-Sorlin et al. — Towards a FSPM of cut-rose                                               1123

                       Diffuse sky light      Lamp light

                                                                     LIGHT CLIMATE

                       Direct sun light
                     Day 183

                                                                                                                 Leaf
                               Green house construction                                                          photosynthesis

                                                                                                                 Product: cut-flower

                                                                                                                                                      Downloaded from http://aob.oxfordjournals.org/ by guest on September 25, 2015
                      Crop management                                                 Sink behaviour
                                              Crop arrangement

                                                                                 Length [cm]

                                                                                                   Time [h]

F I G . 1. Principal elements of the cut-rose FSPM, with an emphasis on light climate.

               M AT E R I A L S A N D M E T H O D S                              The sun object is another directional light, which dynamically
                                                                                 changes its output like the sky object, but also its position. The
Scope of the model
                                                                                 position of the sun in normalized coordinates was computed as
The model is based on the reconstruction of the structure of a                   a function of day of year and time of day, following Goudriaan
mature cut-rose production system within a virtual greenhouse                    and van Laar (1994). Inside the greenhouse, 10 000 randomly
(Fig. 1). The model was written in the modelling language XL                     arranged virtual spherical PAR sensors (radius 5 cm) were
(Kniemeyer, 2008) using the open-source GroIMP platform                          placed inside an invisible bounding volume (a rectangular
(www.sourceforge.net/projects/groimp).                                           cuboid of length 4 m, height 2 m and width 1.2 or 0.65 m in
   Each simulated rose plant consists of a bent shoot canopy, a                  the high-density scenario) around the interior double-row of
framework of stumps (the ‘permanent basal structure’) and a                      the simulated rose canopy to measure incident downward
number of upright flower shoots, formed from axillary                            PAR in the bent and upright canopy up to a height of 2 m
‘stump buds’. The root system is neglected in our model.                         above the greenhouse floor. The virtual sensors are a feature
                                                                                 of the GroIMP radiation model. They are invisible, i.e. do
                                                                                 not interfere with the path of the rays but only measure the irra-
Light regime in the virtual greenhouse
                                                                                 diance at their surface. Furthermore, only the upper hemi-
   Details of the light model used can be found in Buck-Sorlin                   sphere of a sensor is used and incoming radiation is
et al. (2010). Essentially, an instance of the GroIMP radiation                  cosine-corrected, thus making the sensor a fairly correct
model (Hemmerling et al., 2008) is invoked and carried out at                    model of the widely used photosynthetic photon flux density
each model step, computing the local PAR perception of                           (PPFD) quantum sensor. Such virtual sensors within the simu-
virtual sensor objects and PAR-absorbing leaf objects in a                       lated crop allow us to establish an accurate 3-D map of the
3-D scene. The 3-D scene consists of the virtual greenhouse                      spatial light distribution. The bounding volume of virtual
with the crop and assimilation lamps (see above) inside, sur-                    sensors was divided into 200 horizontal layers of 1 cm
rounded by sky and sun, providing diffuse and direct light,                      height, and the mean value of about 50 virtual sensors per
respectively. Output of both the sky and the sun are dynamic                     layer was sampled. In addition, the amount of PAR [PPFD
functions of the day of the year and time of the day (h). The                    (mmol photons m22 s21)] absorbed was computed by the
sky is modelled as an array of 72 directional lights arranged                    light model at every step in each leaf. The radiation model
in a hemisphere (six concentric rings each consisting of                         itself (Hemmerling et al., 2008) is an inversed Monte-Carlo
12 lights; cf. Evers et al., 2010, for a similar arrangement).                   raytracer (Veach, 1998). Put simply, it produces light transport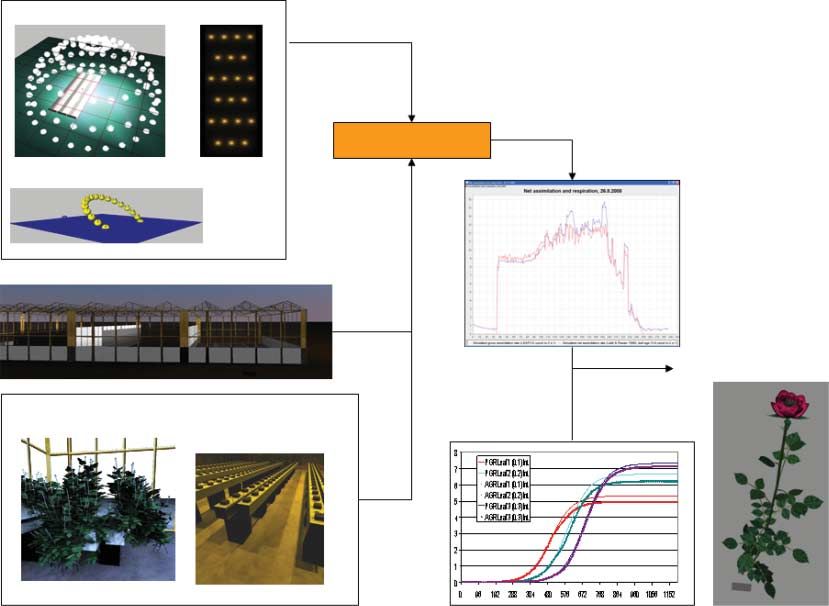
1124                                          Buck-Sorlin et al. — Towards a FSPM of cut-rose

                                                             TA B L E 1. Model parameters

Description                                                                                    Value (range*)                          Unit

Greenhouse (set-up and climate)
Dimensions of greenhouse compartment (L, W, H)                                              12, 12, 5                            m
Distance between gutter rows                                                                1.2                                  m
Total width of double-row                                                                   0.2                                  m
Length of a slab                                                                            1                                    m
Number of plants per slab                                                                   5                                    –
Number of double-rows                                                                       5                                    –
Number of slabs per double-row                                                              8                                    –
Total number of simulated plants                                                            400                                  –
Height of assimilation lamps (from ground)                                                  3.6                                  m
Conversion factor daylight [PAR (W) to PPFD]                                                4.55                                 mmol J21
Conversion factor SON-T lamp [PAR (W) to PPFD]                                              4.79                                 mmol J21
Spacing between lamps within the same row                                                   2                                    m
Spacing between lamps in different rows                                                     3.5                                  m
Daylight threshold below which assimilation lamps are switched on                           200                                  mmol PAR m2 s21
CO2 concentration in air                                                                    460                                  mmol mol21
Relative humidity of air                                                                    84                                   %

                                                                                                                                                    Downloaded from http://aob.oxfordjournals.org/ by guest on September 25, 2015
Daily mean temperature                                                                      20.5                                 8C
Plant architecture parameters
LAI of bent canopy                                                                          3.0                                  m2 m22
Default cutting height (above base of cutting)                                              0.1                                  m
Maximum phytomer rank                                                                       (19– 22)                             –
Leaf divergence angle                                                                       54.1 + 16.2                          8
Length of terminal leaflets                                                                 (0.0185–0.0541)                      m
Width of terminal leaflets                                                                  (0.013– 0.038)                       m
Length of lateral leaflets                                                                  (0.02–0.044)                         m
Width of lateral leaflets                                                                   (0.014– 0.03)                        m
Divergence angle of lateral leaflets                                                        (55– 65)                             8
Form factor for leaflet area (¼ area/(length*width))                                        0.7038                               –
Number of leaflets per leaf2                                                                {1,3,5,7}                            –
Plastochron                                                                                 1.5                                  d
Internode length†                                                                           (0.000012– 0.0596)                   m
Internode diameter                                                                          0.004– 0.00015*rank                  m
Phyllotactic angle                                                                          124. + 39.3                          8

  * A range of values is understood to follow a uniform distribution.
  †
    Number of leaflets and internode length are a function of the relative acropetal rank rr ¼ rank/maximum rank.

paths (‘rays’), thereby connecting light sources with scene                     AlgorithmSwitchShader was used (Kniemeyer, 2008), a
objects. The number of rays emitted by all light sources as                     shader with two options. For the realistic visualization of leaf-
well as the number of times a ray is followed on reflection                     lets, textures were used (Figs 2 and 3). For computation of
or transmission after encountering a scene object can be deter-                 light absorption, a simple RGB shader (Kniemeyer, 2008)
mined by the user. A combination of 20 million rays and ten                     was employed, in which the measured diffuse reflection and
reflections per ray turned out to be sufficient for our purposes.               transmission for the red, green and blue wavebands (600 –
Note that during one run of the radiation model, the entire                     700, 500 – 600 and 400– 500 nm, respectively) were specified
scene is bombarded with rays, including the greenhouse (see                     (diffuse reflection for R, G, B: 6.6, 15.2 and 1.5 %, respect-
Table 1 for dimensions). On average, the different elements                     ively; diffuse transmission for R, G, B: 5.4, 8.6 and 4.7 %,
of the greenhouse (floor, glass walls, roof ) absorbed around                   respectively, cf. Paradiso et al., 2011). The amount of PAR
140 mmol m22 s21 of daylight (with lamps switched off ),                        absorbed by a leaf, Ia, as computed by the radiation model is:
which represented about 45 % of the total light emitted by
all light sources at a given moment.                                                                         Ia = Ii − It − Ir                (1)
   The path of a ray in the scene and the likelihood with which
it will be absorbed, reflected or transmitted depends on the                    where Ii is the incident PAR reaching the leaf, and It and Ir are
geometry and distribution of objects in the scene as well as                    the amounts of transmitted and reflected PAR, respectively.
on their optical properties. The latter were modelled using                       For greenhouse crops such as cut-rose, the path of the direct
shaders that are mapped onto the geometrical objects repre-                     and diffuse light coming from the sky is further modified by
senting organs. In the case of leaves these were composed of                    the geometry and optical properties of the greenhouse
a terminal leaflet and a variable number of lateral leaflet                     (Buck-Sorlin et al., 2010). The light climate inside the green-
pairs, connected to each other by a midrib. For each leaflet,                   house was modelled by reconstructing a 3-D geometrical
a parallelogram object was used, with length and width,                         model of a greenhouse compartment consisting of side walls,
times a form factor (Table 1), representing measured leaflet                    roof and shading screens; for all of these the measured optical
length and width, respectively. As a texture a so-called                        properties were set and the transmissivity of the textures were
Buck-Sorlin et al. — Towards a FSPM of cut-rose 1125
Downloaded from http://aob.oxfordjournals.org/ by guest on September 25, 2015
F I G . 2. Close-up of a simulated stump after flush harvest. Buds below a cut surface are marked and the first three of them are visualized as coloured spheres.
Buds are assigned a proximity number ( pn) and their probability for breaking is determined as a function of that number. A bud with pn ¼ 1 has been selected.
A B
C D
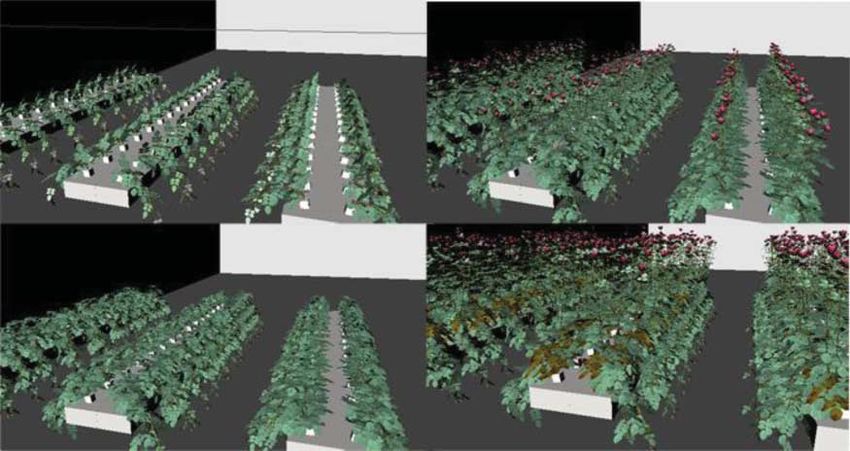
F I G . 3. Illustration of the rapid mock-up technique, showing different states of the canopy: (A) after bending of the primary shoot, (B) after creation of instant
first flush, plus growth of bent canopy (branching of bent shoot, plus rebending of upright shoots), (C) after harvest of first flush and (D) second flush (note
senescence of stump leaves).
calibrated to achieve an overall transmissivity of about 63 % distributions, thereby imitating the characteristic intensity of
using a simulated empty greenhouse and a comparison of light emitted by the lamp in a particular direction.
output of virtual light sensors placed inside and outside the
greenhouse. The interior of the greenhouse compartment was
reconstructed to represent the experimental set-up (see below). Photosynthesis
The virtual assimilation lamps are described in detail in Leaf photosynthesis was modelled according to the model
Buck-Sorlin et al. (2010). For the lamp model, the point light of Kim and Lieth (2003), which is based on those of
object of GroIMP was extended by using measured light Farquhar et al. (1980) and Ball et al. (1987).1126 Buck-Sorlin et al. — Towards a FSPM of cut-rose
Bud break model the condition (im[rank]==3) on the left-hand side of the
rule is replaced by another condition (isSelected(im))
In the model, by default, all axillary bud objects are ranked
which checks whether the internode im belonging to the sub-
acropetally along the shoot (i.e. numbered from rank 1 at the
graph specified on the left-hand side has been selected by
base to rank rmax at the flower peduncle), and initially have
the user.
a breaking probability of zero. Based on our observation that
Harvest and pruning of shoots as well as removal of unde-
normally after a cutting event (harvest or pruning) on an
sired flowers in the bent canopy constitute cutting, i.e. an
upright shoot only the three uppermost axillary buds below
event in which part of the structure is removed. Consider the
the cut are breaking, with the most proximal one having the
following simplified rule:
highest breaking probability and the two following buds a
much lower probability, we implemented a model in which x:Internode, (* x (, 2 2)+ : (rt:Root) *),
after interactive removal of shoots (see next section) the
buds below the cut are marked as ‘cut’ and given a ‘proximity (x.getIndiID()==rt.getIndiID() &&
number’ ( pn) which thus reflects the topological proximity to x.getBent()==false &&
the cut surface (e.g. the bud below the cut has pn 1, the one distance(x,rt).=CH) ==. . cut;
below it pn 2, etc.). Breaking probability PBB is then computed
as an exponential function of pn, conditional on Q: On the left-hand side of this rule an internode x is searched
for, with a context [within symbols (* *)] of a root rt at its
Downloaded from http://aob.oxfordjournals.org/ by guest on September 25, 2015
PBB = a · e pn·b |Q (2) base, fulfilling the following criteria: internode and root
should belong to the same plant, the internode should not
where a and b are factors and Q is a cutting event that needs to belong to a bent shoot, and the distance between x and rt
have taken place above the bud (Fig. 2). This probabilistic bud should be bigger than a parameter CH. The effect of this
break model is currently applied only to axillary buds on query is that all upright shoots above a specified cutting
stumps, as there are no data on bud break in the bent height CH will be cut. This rule also marks buds below the
canopy. Typical values for a and b are 4.433 and – 1.564 cut (not shown) so that they can break with a specified prob-
(derived from observations in the experiment, data not ability (see above).
shown). This resulted in bud break probabilities of 92.8, 19.4
and 4.1 % for the first three buds on the stump below the
cut, and much less than 1 % for all further (i.e. lower) buds.
Simulation of the initial production system
For many applications it is important to explore future
Interaction with the plant structure developments given an initial architecture. Therefore, we
Growers’ interactions with the plant structure is manifold developed provisions allowing for the creation of an ‘instant
but can be broken down into two main activities, namely canopy’. The number of previous flushes, the frequency,
cutting and bending. The targeted structure is generally a sequence, and height of harvest and pruning events will all
whole shoot ( pruning and harvesting), sometimes a single contribute to this architecture and will equally have an influ-
organ (‘pinching’). Bending is the singular or repeated appli- ence on the following generation of harvestable shoots. By
cation of force to the base of a shoot with the result that the employing a ‘rapid mock-up’ technique, a specific initial pro-
shoot will grow horizontally for a while until the tip of the duction situation can be recreated. In the frame of this method
shoot bends upwards again (following the natural orthotropic an instant canopy consisting of upright shoots is produced, in
tendency of all rose shoots). We modelled bending in two which each upright shoot is created from a basal bud within
main ways, automatic or interactive. For automatic bending a one step, and consisting of the proper organs (leaves, inter-
basal internode within a ( primary) shoot is identified via a nodes, flowers). Organ dimensions are set using stochastic
rule in XL, i.e.: variables derived from detailed measurements (Table 1)
Bud (, 2 2)+ im:Internode, rv1:RV (,2 2)+ carried out in another experiment in May – July 2009, which
im1:Internode,rl:RL,rh:RH,(,2 2){4} will be described in detail in a subsequent paper. For bud
rv2:RV, (im[rank]==3) ::. break the same probabilities are applied as described above.
{ In addition to the formation of the instant upright canopy
rl[angle]=50; (essentially a flush of harvest-ripe shoots) the bent canopy
can be enhanced by instantly forming more lateral shoots
rv1[argument]=BS; until a user-specified leaf area index is obtained. More specifi-
rv2[argument]=BS/2; cally, the uppermost ten axillary buds of the bent primary
} shoot break to form second-order side shoots with up to ten
phytomers, which are also instantly bent down.
The rule identifies a sub-graph ( part of the data represen- Alternatively, the bent canopy can be reduced in size by apply-
tation of the simulated structure), consisting of an Internode ing a specific cutting rule. Note that these rules are simply
named im which is accompanied by other organs (Bud, a pre- there to design an initial structure as a departure point for sub-
ceding internode im1), with the condition that the rank of im sequent simulation of shoot production but are themselves not
should be 3 (i.e. the basal internode which is usually in the the outcome of the feedback of photosynthesis with simulated
zone chosen for bending). In the case of interactive bending sink functions.Buck-Sorlin et al. — Towards a FSPM of cut-rose 1127
Formation of an instant canopy can be achieved by combin- TA B L E 2. Model parameters defining net photosynthesis rate
ing structure formation rules in one method ‘initialCanopy()’, (Farquhar – von Caemmerer –Berry model) of leaves at different
with automatic application of a specified sequence of the inter- positions in the canopy
action methods described above. Thus, if it were desired to
simulate the third flush of a production system, the Jmax (mmol Vcmax (mmol a (mmol e2
Position e m22 s21) CO2 m22 s21) Vcmax/J ( – ) mmol21) u (–)
initialCanopy() method could consist of the following
sequence of commands: Top 178.7 78.8 0.44 0.53 0.49
buildCanopy(); pickBentFlower(); Middle 126.7 54.0 0.43 0.46 0.82
flushHarvest(); buildCanopy(); Base 106.5 44.9 0.42 0.43 0.83
increaseCH(0.03); flushHarvest(); Light bent 102.4 45.4 0.44 0.50 0.77
buildCanopy(); Shade bent 67.0 30.5 0.46 0.38 0.56
Figure 3 illustrates the principle of the rapid mock-up Parameters are based on measurements made in a developed ‘Akito’ rose
technique. canopy in October 2008.
Model implementation was below a threshold value (200 W m22). The set temperature
was 19 8C at night and 23 8C during the day, relative air
The model consists of several modules: the main module (1)
Downloaded from http://aob.oxfordjournals.org/ by guest on September 25, 2015
humidity was approx. 75 %, and pCO2 was approx.
loads and initializes global parameters from external files (e.g. 450 mmol mol21 at night and 500 mmol mol21 during the day.
species- and management-specific parameters, as well as Leaf photosynthesis measurements were made with an
greenhouse and general climate data, see Table 1); (2) initia- LCpro+ Advanced Photosynthesis System (ADC
lizes environment, plant individuals and canopy; (3) controls BioScientific Ltd, Great Amwell, UK) between 6 and
information flow (simulates processes at different temporal 15 October 2008. Light response curves were obtained for
resolutions for light model, photosynthesis and morphology); different leaf positions in the upright and bent canopy
(4) provides interactive harvest and pruning functions (con- (Table 2) at three CO2 concentrations (400, 600 and
tinuous or flush, Buck-Sorlin et al., 2011) that allow the user 800 mmol mol21) and a leaf temperature of 25 8C.
to interact with the structure at any time during the simulation; Light response curves at three external CO2 concentrations,
and (5) creates output files and charts. All plant organs are for different leaf positions in the canopy, were determined on
implemented in a Modules file. Objects are defined for differ- plants with almost harvest-ready upright shoots from exper-
ent hierarchical scales, from aggregated organs such as iment 1. Details about the measurements and the key param-
Canopy, Individual or Shoot down to basic organs such as eters can be found in Table 2. The photosynthesis model
FlowerMeristem, Root, Leaf, Bud, Internode (including was calibrated with the measured values, by tuning the follow-
flower peduncle) and Flower, and on an even lower level ing photosynthetic parameters using a genetic algorithm
Leaflet and Petiole. All basic organs, e.g. leaf, internode, (Fogel, 1998; Goldberg, 1989): maximal rate of electron trans-
root and flower, implement the same organ interface, thereby port [Jmax (mmol e2 m22 s21)], curvature of the light response
ensuring that all organ types are equipped with the same func- curve [u ( – )], quantum efficiency [a (mmol e2 mmol21)] and
tionality and can be handled in the same straightforward way. maximum carboxylation rate [Vcmax (mmol CO2 m22 s21)].
Measurements of radiation distribution in the glasshouse
Experimental set-up and measurements were made 26 Septemner and 2 October 2008, between 1200
and 1630 h under different direct and diffuse light conditions,
Experiments to collect certain parameters (including light with or without assimilation lamps switched on, in the exper-
distribution and photosynthesis rate) and data for model imental compartment in the presence of a fully grown flower
testing were conducted in the glasshouse compartments of crop, using a LI-190 quantum sensor (LI-COR, Lincoln, NB,
Wageningen University and Research Center, Wageningen, USA), which measures PAR (400– 700 nm waveband).
the Netherlands (51858′ N, 5840′ E). The cultivar used in the
research was a white rose, Rosa × hybrida ‘Akito’ (Tantau).
The crop was planted in one glasshouse compartment (12 ×
12 m, wall height 5 m) on 25 February 2008 in double rows
Scenarios
at a plant density of 6.5 m22. Each row consisted of ten
1-m-long rockwool slabs (width 15 cm, height 7.5 cm) with We designed three different simulation scenarios for plant
a total of 50 plants. The distance between the centres of two arrangement to test the influence of a static structure on the
adjacent double-rows was 0.2 m, and the path width was spatial distribution of PAR and photosynthesis. We wished
1.2 m (from edge to edge of two bordering slabs). to test the hypothesis put forward by rose growers that redu-
Supplementary lighting was provided in the form of 24 cing leaf biomass increases light-use efficiency by improving
Hortilux HS2000 Green Power (Hortilux, Pijnacker, the light penetration. In rose production part of the greenhouse
Netherlands) high-pressure sodium lamps (600 W, leading to area is wasted either by keeping the path open or by maintain-
a PPFD of approx. 171 mmol m22 s21 at a distance of 1.2 m ing too much biomass to sustain enough assimilate production,
below the lamps, with a spacing of 3.5 × 2 m. These lamps the latter leading to an increase in respiratory costs. Some
were switched on during the day and part of the night growers are using a production system in which the roses are
(except between 2000 and 0300 h) when the solar PAR level grown on rolling gutters, thereby eliminating walking paths1128 Buck-Sorlin et al. — Towards a FSPM of cut-rose
altogether, while in other companies the bent canopy is height. Generally, the simulated incident PAR values within
allowed to grow out to cover the entire path. the upright canopy matched the measurements rather well
Simulation scenario 1 (control) was the reconstruction of the (Fig. 5).
original measured canopy structure (Table 1), i.e. with a path The simulated percentage absorbed PAR exhibited particu-
width of 1.2 m, and a standard bent canopy [leaf area index lar dynamics during the day in the three scenarios (Fig. 6).
(LAI) about 3.0]. In scenario 2 the control structure was In the control, PAR absorption ranged between 84 and 92 %,
used but the path between the rows was reduced from 1.2 to with two clear peaks at 1000 and 1500 h, and lowest absorp-
0.6 m, thereby creating a completely closed simulated bent tion was observed in the early morning and evening when
canopy with bent shoots intertwining. Plant density was thus light was provided by SON-T lamps only. Similar dynamics
increased from 7.14 to 12.5 m22 as the number of plants per can be seen in scenario 3, where the bent canopy was
slab was kept the same. In scenario 3 again the plant architec- reduced by 50 %, except that the PAR range was wider
ture of the control was used but with the leaf area of the bent (80 – 91 %) and there was a clear difference in absorption
canopy reduced in the simulation by 50 % compared with the between the control and scenario 3 during times when the
control. This was achieved by invoking a model rule that SON-T lamps were the only light source. In contrast to this,
removes part of the bent shoot above rank 7 with a probability in scenario 2, in which the bent canopy was completely
of 85 %. The LAI of the entire simulated canopies was 4.7, 4.7 closed due to the narrow paths, almost no PAR reached the
and 3.2 m2 m22, respectively, for scenarios 1 –3. Simulated ground, and there was no diurnal dynamics, i.e. more than
Downloaded from http://aob.oxfordjournals.org/ by guest on September 25, 2015
plant age was 70 d at the moment that PAR absorption and 99 % of the PAR was intercepted by the canopy at all times.
photosynthesis were determined. All scenarios were carried According to the model, PAR levels (absorbed and trans-
out employing the initialCanopy() method, i.e. an initial struc- mitted) were higher in the upright than in the bent canopy
ture was simply reconstructed in silico (based on the measure- (Fig. 7). In all scenarios, incident PAR above the canopy
ments). Hourly mean values of measured climate data (PAR, was computed at approx. 170 mmol m22 s21 in the morning
temperature; from 10-min averages) for 2 October 2008 were and evening when the only light sources were the assimilation
used, an overcast day (daily total global radiation 19.5 MJ lamps, fluctuating strongly during the day, with two peaks at
m22, daily total radiation measured on the ground 7.5 MJ 0900 and 1400 h, and two dips at 1100 and 1500 h. In all scen-
m22, average atmospheric transmissivity 0.39, total comp- arios, PAR levels increased in the following order: transmitted
lementary radiation by lamps 4.8 MJ m22, average PPFD PAR below the bent canopy , PAR absorbed by bent
216.4 mmol m22 s21), to compute instantaneous light inter- canopy , transmitted PAR at the bottom of the upright
ception and photosynthesis rate. The amount of PAR inter- canopy , PAR absorbed by upright canopy , incident PAR
cepted by the entire canopy was estimated as the level of above upright canopy. Also, the sum of absorbed PAR (bent
PAR incident above the canopy (1.80 m above the greenhouse canopy and upright leaves) matched the difference between
floor) minus the level of PAR transmitted below the bent incident PAR level above the canopy and transmitted PAR
canopy (0.30 m above the greenhouse floor). The time level below the bent canopy, showing that there was no signifi-
scheme for the simulated assimilation lamps was the same as cant loss of PAR to other structures (e.g. benches and irriga-
in the experimental compartment (see above), i.e. in the tion pipes, which have black surfaces). In scenario 2 the
model the SON-T lamps were switched on when the reading upright canopy was absorbing nearly the entire PAR available
of a virtual sensor array on top of the roof of the greenhouse leaving almost nothing for the bent canopy (Fig. 7B). In the
fell below a threshold value of 200 W m22. control scenario levels of PAR absorbed in the bent canopy
were at all times about 20 mmol m22 s21 below that of the
upright canopy, whereas this difference was greater (50 –
RES ULT S 100 mmol m22 s21) and more variable in scenario 3
(Fig. 7C), due to the reduced leaf area in this scenario. In scen-
Spatial distribution of PAR in the canopy
ario 3 the amount of PAR absorbed by the bent canopy quite
A simulated rose canopy with false colours indicating the closely followed the level of transmitted PAR in the upright
amount of PAR absorbed per m2 leaf area is shown in canopy. By contrast, in the control the level of transmitted
Fig. 4(A). The amount and distribution of PAR transmitted PAR in the upright canopy deviated strongly (by up to
and incident in the same scene is represented with 10 000 ran- 50 mmol m22 s21) from the amount of PAR absorbed by the
domly distributed virtual sensors (Fig. 4B). The simulated bent canopy (Fig. 7A).
PAR levels at different heights above the ground exhibited Profiles of transmitted and incident sensed PAR at three
some variation, which was due both to the stochasticity of different times of the day (0600, 1200 and 1800 h) are
the radiation model and the heterogeneity of the simulated shown for the three simulation scenarios in Fig. 8. PAR
canopy. Figure 5 shows a comparison of measured and simu- levels were highest and the gradient steepest at noon,
lated incident PAR values, for different heights and light peaking at about 320 mmol m22 s21, with diffuse daylight
regimes. The simulated canopy (age 70 d) represented prevalent, whereas it was lowest and shallowest at 1800 h
the mature ( pre-harvest) first flush, produced using the when the lamps were the only light sources. As expected,
instantCanopy method (see Materials and methods), the the incident PAR levels below the bent canopy were lowest
latter using stochastic parameters based on the measured archi- in simulation scenario 2, in which the path was completely
tecture. Simulated incident downward PAR values were covered with leaves of the bent canopy. Also, along the
sampled as an average of about 50 sensor readings (as entire profile (0 – 2 m above the ground) the level of trans-
described before) from a horizontal layer of the measured mitted PAR was about 50 mmol m22 s21 lower than in theBuck-Sorlin et al. — Towards a FSPM of cut-rose 1129
A
400
200
0
B
Downloaded from http://aob.oxfordjournals.org/ by guest on September 25, 2015
400
200
0
F I G . 4. Simulated rose canopy, with (A) colour gradient (blue to red) indicating increasing amount of PAR (mmol photons m22 leaf area s21) absorbed per leaf,
and (B) randomly distributed virtual sensors indicating the amount of incident PAR sensed within the sensor radius (5 cm), as well as colour of incident PAR
(mmol photons m22 sensor area). The snapshot shows a canopy at 1200 h, with a mixture of ambient daylight and lamp light from SON-T lamps emitting pre-
dominantly orange light.
other two simulation scenarios, due to the higher density of upright shoots values in the control, in scenario 2 and in scen-
plants and therefore of flower canes, whereas the slopes of ario 3 were in the range 6 – 14, 10– 16 and 8 – 14 mmol CO2
all gradients were equal for a given time of the day. The differ- m22 s21, respectively, whereas in the bent canopy rates were
ences between the simulated levels of transmitted PAR in the 4 –10, 2 – 4 and 4 – 8 mmol CO2 m22 s21, respectively. This
bent canopy were rather small in the control and scenario 3 was due to the relatively low levels of absorbed radiation.
with reduced bent canopy (only about 20 mmol m22 s21 at The simulated diurnal dynamics of photosynthesis closely fol-
noon and 10 mmol m22 s21 at the other times), with differ- lowed that of simulated absorbed PAR, because of the linearity
ences tending to decrease in the upper bent canopy (0.5 – of the light response at these PAR levels (results not shown). In
0.7 m above the floor). all simulation scenarios photosynthesis rates of bent shoot
leaves were lower than those of leaves from upright shoots,
reaching about 70 % in the control, 50– 60 % in scenario 3
Photosynthesis and only about 20 % in scenario 2, with ratios tending to
Overall, simulated net assimilation rates of leaves of the increase and decrease again during the day (Fig. 9), thereby
bent and upright canopies were rather low. For leaves of mirroring the dynamics of the PAR transmission rate in the1130 Buck-Sorlin et al. — Towards a FSPM of cut-rose
200 A
115 Transmitted PAR BC Transmitted PAR UR
Measured PAR (mmol m–2 s–1)
450 Absorbed PAR BC Absorbed PAR UR
Incident PAR above canopy
150 105
PAR (mmol m–2 s–1)
70
115 300
100
70
50 Direct light 150
70 Diffuse light
70 Diffuse light plus SON-T light
0
0 50 100 150 200 0
Simulated PAR (mmol m–2 s–1)
F I G . 5. Measured versus simulated incident PAR in a rose canopy. 450 B
Measurements were carried out using a LI-190 quantum sensor, on
26 September (direct light) and 2 October 2008 (diffuse light) at different
Downloaded from http://aob.oxfordjournals.org/ by guest on September 25, 2015
PAR (mmol m–2 s–1)
heights in the canopy, and at various times between 1200 and 1630 h, with
varying light regimes: direct light, diffuse light, diffuse light plus SON-T 300
light, as indicated. Numbers near the data points indicate height above the
greenhouse floor at which the measurement was taken. Unlabelled data
points indicate a measuring height of 130 cm ( just above the canopy).
Simulations are mean values from 100 randomly distributed virtual sensors,
s.d. of the simulations varied between 28.7 (70 cm) and 33.0 (115 cm) 150
mmol m22 s21.
0
100
450 C
Control
PAR absorbed by canopy (%)
PAR (mmol m–2 s–1)
Reduced LAI of bent canopy
95 Reduced path width 300
90
150
85
0
0 4 8 12 16 20 24
80
Time of the day (h)
0 5 10 15 20
Time of day (h) F I G . 7. Simulation of incident, absorbed and transmitted PAR levels at differ-
ent heights above, inside and below a bent and upright rose canopy during the
F I G . 6. Diurnal course of simulated PAR absorbed by the entire canopy, com- course of the day (2 October 2008). The PAR levels incident were sampled
puted as (PARabove canopy – PARtransmitted below BC)/PARabove canopy. from readings of randomly distributed virtual sensors at specified heights
Management scenarios were: control, reduced path width, and reduced LAI above the floor (level incident above canopy: 1.8 –1.82 m; bent canopy:
of bent canopy, as indicated (for more details see text). 0.38– 0.4 m; upright shoots: 0.7 –0.72 m). Management scenarios were: (A)
control, (B) reduced path width, (C) reduced LAI of bent canopy (for more
details see text). BC, bent canopy; UR, upright canopy.
upright canopy (Fig. 7). The very low ratio observed in scen-
ario 2 was due to the low PAR level transmitted to the bent D IS C US S IO N
canopy from above through a much denser upright canopy,
Light interception and photosynthesis
whereas the low ratio in scenario 3 can be explained by the
reduced LAI of the bent canopy. Also, leaves in the bent We chose to verify and test the plausibility of the present
canopy and the lower upright canopy exhibited a lower light FSPM under local light climate, interception of PAR by
response of photosynthetic rate (Table 2) than leaves from leaves and local photosynthesis. Simulated local light
the higher upright canopy, which is another contributing climate, apart from being determined by greenhouse construc-
factor to be taken into account when comparing photosynthetic tion (e.g. transmissivity of glass), was influenced by diffuse
rates of the bent and upright canopy. and direct daylight as well as light coming from assimilationBuck-Sorlin et al. — Towards a FSPM of cut-rose 1131
lamps, all of which more or less strongly fluctuated during the 1·00 Control
course of a day. Our model was able to reproduce these Reduced LAI of bent canopy
photosynthesis rates BC/UR
dynamics in a virtual greenhouse set-up. It was equally suit-
Ratio of average canopy
Reduced path width
able for visualizing parameters such as local PAR interception 0·75
per leaf on a square-metre basis (Fig. 4A) or for generating a
3-D view of downward PAR distribution in and around a simu-
lated canopy with the help of randomly distributed virtual 0·50
sensors (Fig. 4B). Local and global light interception ( per
individual plant or per square metre) and subsequently local
0·25
assimilate production are important drivers for shoot pro-
duction (apart from the availability of buds ready to break
and thus to act as sinks), and there is always potential for an 0·00
0 5 10 15 20
Time of day (h)
350 A F I G . 9. Ratio between simulated net assimilation rate of leaves from upright
0600 h and bent shoots during the course of one day (2 October 2008) as a function of
300 Control different management scenarios: control, reduced path width, and reduced LAI
Downloaded from http://aob.oxfordjournals.org/ by guest on September 25, 2015
of bent canopy, as indicated.
PAR (mmol m–2 s–1)
Reduced path width
250
Reduced LAI of bent canopy
200 increase of source strength by optimizing management. We
150 have shown here that the initial set-up of the producing
canopy ( plant density as well as extent of the bent canopy)
100 has an effect on local light interception (with potential reper-
50 cussions for photosynthesis and shoot production). The stron-
gest effect was observed in scenario 2, in which plant density
0 was increased from 7.14 to 12.5 m22. Light absorption of the
canopy was nearly 100 %, which might mean that the density
350 B chosen for this scenario was too high. At such a rather high
1200 h density one could expect feedback by the plant in the form
300
of an altered bud break and shoot development pattern in
PAR (mmol m–2 s–1)
250 both the bent and the upright canopy. However, such feedback
is currently not implemented in our model.
200
A normal path width in combination with a reduced bent
150 canopy (scenario 3) only slightly increased the level of trans-
mitted PAR by the bent canopy (Fig. 8). This means that the
100 amount of PAR lost to the floor (transmitted PAR below the
50 bent canopy) was not much higher when the bent canopy
was reduced, probably because the structure of the upright
0 canopy was the same as in the control and thus the levels of
transmitted PAR in the upright canopies of both control and
350 C scenario 3 were very similar. This was the impression that
1800 h could be gained by analysing the sensor output only (Fig. 8).
300
However, when comparing this with the amount of simulated
PAR (mmol m–2 s–1)
250 PAR absorbed by the leaves of the different canopy types
200
(bent and upright), it appears that there was a bigger difference
between the control and scenario 3 with the reduced bent
150 canopy (Fig. 7). In scenario 3 less PAR was absorbed in
total, as expected, also having repercussions on the average
100
net assimilation rate of the bent leaves (results not shown)
50 and the ratio of assimilation rates between upright and bent
shoots (Fig. 9).
0
0 0·5 1·0 1·5 2·0 The simulated diurnal curves of the incident and absorbed
PAR (Fig. 7) reflected the dynamics of the light environment
Height above ground (m)
in the greenhouse quite accurately: during the early morning
F I G . 8. Simulated PAR level at different heights and three different times of hours light came exclusively from assimilation lamps. From
the day (0600, 1200 and 1800 h) perceived by randomly distributed virtual about 0700 h onwards the amount of (diffuse and direct) day-
sensors in a simulated rose canopy, as a function of different management light was increasing, and lamps were eventually switched off
scenarios: control, reduced path width, and reduced LAI of bent canopy, as once a specified threshold of external daylight was reached
indicated. Arrows indicate the height of the slab and the tip of the upright
canopy. (as measured by virtual sensors on the roof of the greenhouse).1132 Buck-Sorlin et al. — Towards a FSPM of cut-rose
The rather drastic dips in simulated light levels at 1100 and consider the computational cost to run the scenarios presented
1500 h were probably due to the hourly time resolution, here. For most of the computations, we used a Dell Precision
which did not take into account fast changes in PPFD WorkStation T7500, running an Ubuntu Linux operating
around the threshold level, to which the lamps would react system, which supported symmetric multi-processing. This
within minutes by switching on or off. The day chosen for workstation had a total of eight CPUs (four cores per CPU,
the simulations was very overcast and therefore SON-T assim- two threads per core), a clocking rate of 2.4 GHz and 12 GB
ilation lamps were switched on for about 6 h, resulting in a RAM. The GroIMP platform was running on a 64-bit server
rather typical PAR curve with a slight dip whenever lamps Java Virtual Machine. In all three scenarios, the scene com-
were switched off. Typical base values (measured and simu- prised approx. 145 000 plant objects (48 900 leaves and inter-
lated in our study) were approx. 140 – 170 mmol m21 s21. nodes each and 45 600 buds) and 97 light sources (24 lamps,
Our measurements (Table 2) clearly showed that the 72 diffuse and one direct). One model step involved the
maximum photosynthesis rate increased with increasing rank built-up of the entire canopy consisting of 400 plants and
in upright shoots and from bent to upright shoots, with a one run of the light model. Per scenario, 18 hourly steps
clear difference between lit and shaded bent shoot leaves. were computed. All scenarios were computed using the
Such differences in light response curves for different so-called headless mode of GroIMP, which allowed the plat-
canopy positions were also found by Gonzales-Real and form to be run without a graphical user interface from a
Baille (2000) and were ascribed by these authors to a decrease batch file. Computation times varied among the scenarios,
Downloaded from http://aob.oxfordjournals.org/ by guest on September 25, 2015
in leaf nitrogen content, i.e. the bottom leaves of the plant had 1 h for the control and for scenario 2 and 50 min for scenario
35 % less nitrogen than the top leaves. The simulated canopy 3 (reduced bent canopy), or on average 2.8 and 3.5 min per
photosynthesis rates obtained with our model (approx 10– step, respectively.
12 mmol CO2 m22 s21 for leaves of upright shoots, and 3 –
5 mmol CO2 m22 s21 for leaves of bent shoots) appeared to
Further applications of the model
be within the range observed by other authors (Kim and
Lieth, 2001, 2002). Kim and Lieth (2001) found maximum We also tested the influence of cutting height in another set
rates of 13 mmol CO2 m21 s21 for whole-plant net photosyn- of simulation runs (results not shown), taking the control
thesis in the cut-rose cultivar ‘Kardinal’, whereas Kim and set-up (scenario 1) as a starting point and varying the height
Lieth (2002), who determined the diurnal response of at which the first flush of upright shoots was cut. This
canopy gross photosynthesis in the same cultivar, found cutting height was defined as the distance of a point on the
maximum rates of 29 mmol CO2 m22 s21 for leaves of stump to the base of the stump (see Materials and methods).
upright shoots and 24 mmol CO2 m22 s21 for leaves of bent Four cutting heights were tested, 0.15, 0.2, 0.25 and 0.3 m,
shoots on a spring day in California, with an LAI of the and an entire canopy was simulated with a mature second
entire canopy of 7.6 m2 m22. However, a direct comparison flush of upright shoots present (simulated plant age about
with our results is difficult, given the differences in climate, 110 d). Both PAR absorbed and net assimilation rates tended
cultivar and management. The model by Kim and Lieth to be highest at a cutting height of 0.2 m (results not
(2002) is, to our knowledge, also the only one which con- shown), but the effect was not significant. It remains to be
sidered – in a simplified way and still in the frame of a further investigated by modelling and experimentation if
process-based model – the structure of the upright and bent canopy management in terms of varying the cutting height
canopy and their influence on the distribution of incident of harvested shoots does noticeably influence light
PAR, thereby also distinguishing between north – south and interception.
east– west row directions. Sarlikioti et al. (2011) modelled
plant architecture traits and row structure, light interception
Bud break
and canopy photosynthesis in an FSPM of tomato and found
that, in particular, the explicit description of leaf divergence Bud break in cut-rose is due to a complex variety of external
angles significantly improved the prediction of canopy photo- and internal factors, such as: apical dominance and modifying
synthesis compared with an unstructured process-based model factors, e.g. light [directly or through its effect on source
considering the Beer – Lambert law of light absorption as a strength (Marcelis-van Acker, 1994a)]; the position of the
function of cumulative LAI alone. buds along the shoot (Marcelis-van Acker, 1994b) in one of
the three zones, namely basal, median or subapical (Khayat
and Zieslin, 1982; Zamski et al., 1985); and manipulation
Computational cost of running the light model
( pruning, ‘pinching’) and initial crop management ( planting
To compute the local light environment around the rose density: Kool and Lenssen, 1997; Burema et al., 2010). The
canopy in the virtual greenhouse we used the built-in radiation two basic mechanisms underlying bud break are essentially
model of GroIMP. This model is based on a unidirectional developmental ‘readiness’ of the bud and lack of correlative
Monte-Carlo raytracer, i.e rays are traced from a light source inhibition (Zieslin and Halevy, 1978; Khayat and Zieslin,
in one direction to an object in a scene. Such models are sto- 1982; Marcelis-van Acker, 1994b). In our model we used
chastic and computationally expensive, because a large the general observations (Pien, 2007) that (1) bud break of
number of rays (several millions) and their fate ( paths of axillary buds on stumps of harvested upright shoots was
reflection and transmission until final absorption by a induced by cutting (harvest or pruning) of (flowering)
medium) have to be traced in order to gain a reliable estimate upright shoots, probably by lifting the correlative inhibition
of locally absorbed and available light. As an example, exerted by the terminal bud or growing shoot that wasBuck-Sorlin et al. — Towards a FSPM of cut-rose 1133
removed, and (2) that after lifting of correlative inhibition the of the Ministry of Economic Affairs, Product Board for
first bud below the cut broke with a high probability and the Horticulture ( project PT 13098) and TTI Green Genetics.
following with much lower probability, suggesting that the
shoot emerging from the uppermost bud rapidly inhibits its
subjacent neighbours. L I T E R AT U R E CI T E D
Cultivars clearly differ in frequency of bud break, i.e. the Ball JT, Woodrow IE, Berry JA. 1987. A model predicting stomatal conduc-
probabilities of the top, second or third bud below a cut tance and its contribution to the control of photosynthesis under different
surface breaking. One of the future promises of this model is environmental conditions. In: Biggins J, ed. Progress in photosynthesis
research, Vol. 4. Dordrecht: Nijhoff Publishers, 221 –224.
to explore the consequences of bud break behaviour in terms Buck-Sorlin GH, Hemmerling R, Vos J, de Visser PHB. 2010. Modelling of
of numbers of flower shoots produced and their quality spatial light distribution in the greenhouse: description of the model. In:
(length, diameter of stem and flower bud). Li B, Jaeger M, Guo Y, eds. Plant growth modeling, simulation, visual-
Once a bud is broken and a shoot begins to develop, this will ization and applications, Proceedings – PMA09. IEEE Computer
Society Conference Publishing Services, 79–86.
not only change the local light climate but also shift the Buck-Sorlin GH, Burema B, Vos J, Heuvelink E, Lieth JH, de Visser PHB,
source/sink balance, by increasing demand. Results from our Marcelis LFM. 2011. A Functional-structural plant model for cut-roses –
own experiments (data not shown) suggest that the local new techniques for modelling manipulation of plant structure. In: Dorias
level of incident PAR perceived by an unbroken bud, in com- M. ed. Proceedings of the International Symposium on High Technology
bination with the number of competing sinks, influences the for Greenhouse Systems: GreenSys2009. Acta Horticulturae 893:
705–711.
Downloaded from http://aob.oxfordjournals.org/ by guest on September 25, 2015
total number of buds breaking per shoot stump, per plant or Burema BS, Buck-Sorlin GH, Damen T, Vos J, Heuvelink E, Marcelis
per square metre. As the present model is completely LFM. 2010. Cut-rose production in response to planting density in two
object-oriented and modular it will be very straightforward contrasting cultivars. Acta Horticulturae 870: 47–54.
to incorporate new processes reflecting mechanisms of bud Evers JB, Vos J, Andrieu B, Struik PC. 2006. Cessation of tillering in spring
wheat in relation to light interception and red : far-red ratio. Annals of
break. Botany 97: 649– 658.
Evers JB, Vos J, Yin X, Romero P, van der Putten PEL, Struik PC. 2010.
Simulation of wheat growth and development based on organ-level photo-
Conclusions and outlook synthesis and assimilate allocation. Journal of Experimental Botany 61:
The model of cut-rose presented here allowed the creation of 2203– 2216.
Farquhar GD, von Caemmerer S, Berry JA. 1980. A biochemical model of
a wide range of initial structures thanks to simple interactive photosynthetic CO2 assimilation in leaves of C3 species. Planta 149:
rules for pruning, cutting and bending. We used the structures 78–90.
generated to show that we can model the distribution in the Fogel DB. 1998. Evolutionary computation: the fossil record. New York:
canopy of light from a complex radiation environment, consist- IEEE Press.
Fournier C, Andrieu B. 2000. Dynamics of the elongation of internodes in
ing of the solar track and the virtual glasshouse with a particu- maize (Zea mays L.): analysis of phases of elongation and their relation-
lar configuration of lamps. Our simulation results showed that, ships to phytomer development. Annals of Botany 86: 551–563.
with respect to light interception, the bent canopy appeared to Goldberg DE. 1989. Genetic algorithms in search optimization and machine
play a less important role than had been expected. Carbon learning. Addison Wesley.
assimilation per leaf, using a biochemical photosynthesis rate Gonzales-Real MM, Baille A. 2000. Changes in leaf photosynthetic
parameters with leaf position and nitrogen content within a rose plant
model, followed from local light distribution. canopy (Rosa hybrida). Scientia Horticulturae 46: 109– 128.
The implementation of dynamic concepts for source –sink Goudriaan J, van Laar HH. 1994. Modelling potential crop growth pro-
relationships, bud break and phytomer growth to predict cesses. Dordrecht: Kluwer Academic Publishers.
shoot production will contribute to gaining new insight into Hemmerling R, Kniemeyer O, Lanwert D, Kurth W, Buck-Sorlin GH.
2008. The rule-based language XL and the modelling environment
mechanisms of cut-rose physiology and in particular bud GroIMP illustrated with simulated tree competition. Functional Plant
break and thus lead to a better comprehension of these Biology 35: 739–750.
mechanisms. Kahlen K, Stützel H. 2011. Modelling photo-modulated internode elongation
in growing glasshouse cucumber canopies. New Phytologist 190:
697–708.
ACK N OW L E DG E M E N T S Khayat E, Zieslin N. 1982. Environmental factors involved in the regulation
of sprouting of basal buds in rose plants. Journal of Experimental Botany
We thank Heiner Lieth for highly fruitful discussions about all 33: 1286–1292.
aspects of cut-rose modelling and cultivation. We further thank Kim S-H, Lieth JH. 2001. Modeling diurnal variation of whole-plant photo-
the members of the users’ panel for helpful discussions, in par- synthesis of greenhouse roses. Acta Horticulturae (ISHS) 547: 111– 119.
Kim S-H, Lieth JH. 2002. Modeling photosynthesis of heterogeneous rose
ticular Ep Heuvelink, Dick van der Sar, Sjaak van der Hulst crop canopies in the greenhouse. Acta Horticulturae (ISHS) 593:
and Joop van den Nouweland. Anonymous reviewers made 121–128.
very valuable comments to a previous version of the manu- Kim S-H, Lieth JH. 2003. A coupled model of photosynthesis, stomatal con-
script. Hortilux (Pijnacker, the Netherlands) provided technical ductance and transpiration for a rose leaf (Rosa hybrida L.). Annals of
Botany 91: 771– 781.
information on SON-T GreenPower lamps. Margreet Bruins, Kniemeyer O. 2008. Design and implementation of a graph grammar based
Gerard Brouwer, Jos Kanne, Johan Steenhuizen and Theo language for functional –structural plant modelling. PhD thesis, BTU
Damen provided excellent technical assistance. Benno Cottbus, Germany. Available at http://opus.kobv.de/btu/volltexte/2009/
Burema, Robert C. Okello Ongom, Alena Senkyrikova, Alisa 593/
Shlyuykova and Yanru Song helped with the experimental Kool MTN, Lenssen EFA. 1997. Basal shoot formation in young rose plants.
Effects of bending practices and plant density. Journal of Horticultural
work. This work was supported by the Dutch Technology Science 72: 635 –644.
Foundation STW ( project 07435), which is the applied Kurth W. 1994. Morphological models of plant growth. Possibilities and eco-
science division of NWO, and the Technology Programme logical relevance. Ecological Modelling 75/76: 299– 308.You can also read