Expected clinical utility of automatable prediction models for improving palliative and end-of-life care outcomes: Toward routine decision ...
←
→
Page content transcription
If your browser does not render page correctly, please read the page content below
Journal of the American Medical Informatics Association, 28(11), 2021, 2366–2378
                                                                                 doi: 10.1093/jamia/ocab140
                                                         Advance Access Publication Date: 2 September 2021
                                                                                      Research and Applications

Research and Applications

Expected clinical utility of automatable prediction models
for improving palliative and end-of-life care outcomes:

                                                                                                                                                                             Downloaded from https://academic.oup.com/jamia/article/28/11/2366/6362565 by guest on 03 November 2021
Toward routine decision analysis before implementation
                             1,2,3
Ryeyan Taseen                        and Jean-François Ethier2,3,4

1
 Respiratory Division, Department of Medicine, Faculty of Medicine and Health Sciences, University of Sherbrooke, Sherbrooke,
Quebec, Canada, 2Centre Interdisciplinaire de Recherche en Informatique de la Sant  e, University of Sherbrooke, Sherbrooke,
Quebec, Canada, 3Groupe de Recherche Interdisciplinaire en Informatique de la Sant  e, University of Sherbrooke, Sherbrooke,
Quebec, Canada, 4General Internal Medicine Division, Department of Medicine, Faculty of Medicine and Health Sciences, Univer-
sity of Sherbrooke, Sherbrooke, Quebec, Canada

Corresponding Author: Ryeyan Taseen, MD, MSc, Service de Pneumologie, Centre Hospitalier Universitaire de Sher-
brooke; 3001 12e Avenue Nord, Bureau 2616; Sherbrooke QC J1H 5N4, Canada; Ryeyan.Taseen@USherbrooke.ca
Received 16 March 2021; Revised 15 June 2021; Editorial Decision 20 June 2021; Accepted 21 June 2021

ABSTRACT

Objective: The study sought to evaluate the expected clinical utility of automatable prediction models for in-
creasing goals-of-care discussions (GOCDs) among hospitalized patients at the end of life (EOL).
Materials and Methods: We built a decision model from the perspective of clinicians who aim to increase
GOCDs at the EOL using an automated alert system. The alternative strategies were 4 prediction models—3 ran-
dom forest models and the Modified Hospital One-year Mortality Risk model—to generate alerts for patients at
a high risk of 1-year mortality. They were trained on admissions from 2011 to 2016 (70 788 patients) and tested
with admissions from 2017-2018 (16 490 patients). GOCDs occurring in usual care were measured with code sta-
tus orders. We calculated the expected risk difference (beneficial outcomes with alerts minus beneficial out-
comes without alerts among those at the EOL), the number needed to benefit (number of alerts needed to in-
crease benefit over usual care by 1 outcome), and the net benefit (benefit minus cost) of each strategy.
Results: Models had a C-statistic between 0.79 and 0.86. A code status order occurred during 2599 of 3773
(69%) hospitalizations at the EOL. At a risk threshold corresponding to an alert prevalence of 10%, the expected
risk difference ranged from 5.4% to 10.7% and the number needed to benefit ranged from 5.4 to 10.9 alerts. Us-
ing revealed preferences, only 2 models improved net benefit over usual care. A random forest model with di-
agnostic predictors had the highest expected value, including in sensitivity analyses.
Discussion: Prediction models with acceptable predictive validity differed meaningfully in their ability to im-
prove over usual decision making.
Conclusions: An evaluation of clinical utility, such as by using decision curve analysis, is recommended after
validating a prediction model because metrics of model predictiveness, such as the C-statistic, are not informa-
tive of clinical value.

Key words: machine learning, decision support techniques, advance care planning, clinical utility, quality improvement

C The Author(s) 2021. Published by Oxford University Press on behalf of the American Medical Informatics Association.
V
This is an Open Access article distributed under the terms of the Creative Commons Attribution License (http://creativecommons.org/licenses/by/4.0/), which permits unre-
stricted reuse, distribution, and reproduction in any medium, provided the original work is properly cited.                                                           2366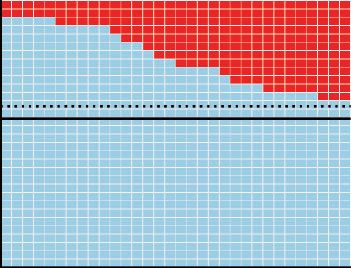
Journal of the American Medical Informatics Association, 2021, Vol. 28, No. 11                                                                 2367

INTRODUCTION                                                                  adult hospitalizations admitted to a nonpsychiatric service between
                                                                              July 1, 2011, and June 30, 2018, were included in the overall cohort,
End-of-life (EOL) conversations and shared decision making between
                                                                              except for admissions to rarely admitting specialties (eg, genetics) or
clinical staff and hospitalized patients can improve the quality of EOL
                                                                              admissions with a legal context (eg, court ordered). Mortality
care.1,2 In the hospital setting, these conversations inform goals-of-care
                                                                              records were sourced from the Quebec vital statistics registry and
(GOC) documentation, particularly code status orders (CSOs), which
                                                                              considered complete until June 30, 2019 (additional details in the
encode the essential preferences for life-supporting therapy.3 Hospitaliza-
                                                                              Supplementary Appendix).
tions are frequent at the EOL, and in which the need to plan for future
                                                                                  The overall cohort was split temporally, with a training cohort
care is matched by the opportunity to do so.4 However, hospitalized
                                                                              defined as admissions occurring between July 1, 2011, and June 30,
patients with a poor prognosis do not benefit from EOL conversations
                                                                              2016, inclusively, and a testing cohort defined as hospital admis-
or GOC documentation as often as they should.5 Closing this gap is
                                                                              sions occurring between July 1, 2017, and June 30, 2018, inclu-
challenged by workload constraints and difficulty in prognostication.6
                                                                              sively. This split was designed to simulate the prospective evaluation
     Clinical decision support systems (CDSSs) that integrate automated
                                                                              of a given model had it been trained with all available data just be-

                                                                                                                                                        Downloaded from https://academic.oup.com/jamia/article/28/11/2366/6362565 by guest on 03 November 2021
prediction models may help increase the prevalence of GOC discussions
                                                                              fore midnight on June 30, 2017, and then applied prospectively for
by generating computerized alerts for patients with a high risk of mortal-
                                                                              1 year at our institution. Hospitalizations that occurred between
ity.2,7 The rationale is that physicians, when explicitly alerted to the
                                                                              July 1, 2016, and June 30, 2017, inclusively, were excluded to pre-
poor prognosis of a patient in their care, will initiate a discussion about
                                                                              vent any unrealistic leakage of outcome information between the
GOC if one is appropriate and has not already occurred.
                                                                              training and testing cohort.
     In the translational pathway of prediction models, an increas-
                                                                                  For the evaluation of clinical utility, our population of interest
ingly recognized step is the assessment of clinical utility,8 which
                                                                              was all hospitalizations in which there was enough time for a GOC
should occur before a prospective evaluation of clinical impact.9,10
                                                                              discussion to occur and in which it was not inappropriate or unnec-
CDSSs, particularly those with machine learning (ML) models, are
                                                                              essary given the information available to a CDSS at the point of
potentially costly to implement11,12 and their impact highly subject
                                                                              care. We defined a CDSS-eligible cohort by excluding hospitaliza-
to local factors,13 giving reason to assess clinical value before inves-
                                                                              tions from the testing cohort that did not have overnight stay or that
ting in application. Decision-analytic methods for this assessment
                                                                              were admissions in obstetrics or palliative care.
using observational data are accessible10,14–16 but are rarely used for
prediction models prompting palliative and EOL care (PEOLC)
interventions, resulting in poor evidence of value.17,18 A few deci-          Prediction models
sion analyses in this area of research have assessed system-                  We developed a ML model using the random forest (RF) algorithm
perspective monetary value19,20; a decision-analytic evaluation of            that includes administrative, demographic, and diagnostic predictors
clinical benefits and harms from the perspective of patient-centered          accessible at the time of hospital admission to predict 1-year mortal-
quality improvement has remained elusive.                                     ity (RF-AdminDemoDx, 244 predictors). As an alternative strategy,
     In this study, we evaluated the clinical utility of locally applica-     we updated the Modified Hospital One-year Mortality Risk
ble prediction models using a routinely collected measure of GOC              (mHOMR) model21 for local application (9 predictors). In addition,
discussions, CSOs in the electronic health record (EHR). Our pri-             we specified 2 simplified versions of the RF-AdminDemoDx model:
mary objective was to compare the expected clinical value of a novel          one in which no diagnostic variables were included (RF-Admin-
ML model with that of a published model21 and models requiring                Demo, 12 predictors) and one in which only 4 variables—age, sex,
fewer types of predictors. In the process, we demonstrate innovative          admission service, and admission type—were included (RF-Mini-
strategies to increase the applicability of simple decision-analytic          mal). All 4 prediction models were feasible to operationalize with
techniques for assessing the utility of automatable prediction models         the existing informatics infrastructure, though had different require-
before implementation.                                                        ments in terms of data access and implementation (Table 1). Data
                                                                              generation processes were investigated to align retrospectively
                                                                              extracted variables with what would be available within a few
MATERIALS AND METHODS                                                         minutes of hospital admission. The models were trained with the
This retrospective study comparing prediction models includes                 training cohort, their temporal validity evaluated with the testing co-
methods for the development, validation, and decision-analytic eval-          hort, and their clinical utility evaluated with the CDSS-eligible co-
uation of prediction models. We conform to the TRIPOD (Trans-                 hort. Model development, specification, and validation is fully
parent Reporting of a Multivariable Prediction Model for Individual           described in the Supplementary Appendix.
Prognosis or Diagnosis) guidelines22 for reporting prognostic model-
ling methods, and to the relevant aspects of the CHEERS (Consoli-             Perspective
dated Health Economic Evaluation Reporting Standards)
                                                                              The evaluation of clinical utility was conducted from the perspective
guidelines23 for reporting decision-analytic methods. The study took
                                                                              of a clinician-led quality improvement team that aims to implement
place at an integrated university hospital network with 2 sites and
                                                                              a CDSS to increase the prevalence of GOC discussions for patients
about 700 acute care beds in the city of Sherbrooke, Quebec, Can-
                                                                              with a poor prognosis: a promising initiative3 for a well-established
ada (details in the Supplementary Appendix). Institutional Review
                                                                              problem.5 A necessary component of GOC discussions for hospital-
Board approval was obtained prior to data collection (Institutional
                                                                              ized patients are discussions about code status, the documentation
Review Board of the CIUSSS de l’Estrie—CHUS #2018-2478 ).
                                                                              of which had been standardized as CSOs in the institutional EHR
                                                                              since 2015. The documentation of resuscitation preferences for a
Source of data and participants                                               hospitalized patient with a poor prognosis is a positively valued,
All predictor data in the study was collected from the institutional          patient-centered outcome in the context of EOL communication,24
data warehouse, which combines EHR and administrative data. All               and its absence for the same population is considered a potentially
2368 Journal of the American Medical Informatics Association, 2021, Vol. 28, No. 11
Table 1. Predictors included in automatable prediction models
Variablea Type Description
Ageb,c,d Integer Age at admission in full years since birth
ED visitsb,d Integer Visits to the emergency department in the year before admission
Ambulance admissionsb,d Integer Admissions to the hospital by ambulance in the year before admission
Weeks recently hospitalizedb Integer Full weeks hospitalized in the 90 d before admission
Sexb,c,d Categorical Female or male
Living statusb,d Categorical Chronic care hospital, nursing home, home, or unknowne
Admission typeb,c Categorical Urgent, semi-urgent, elective, or obstetric
Admission serviceb,c,d Categorical Cardiac surgery, cardiology, critical care, endocrinology, family medicine, gastroenter-
ology, general surgery, gynecology, hematology-oncology, internal medicine, maxillo-
facial surgery, nephrology, neurosurgery, neurology, obstetrics, ophthalmology,
orthopedic surgery, otorhinolaryngology, palliative care, plastic surgery, respirology,
Downloaded from https://academic.oup.com/jamia/article/28/11/2366/6362565 by guest on 03 November 2021
rheumatology, thoracic surgery, trauma, urology, or vascular surgery
Admission diagnosis Binary set Free-text diagnosis on admission order form mapped to 147 binary variables using regu-
lar expressions (see Supplementary Appendix)
Comorbidity groups Binary set ICD-10 codes from hospital discharge abstracts and ED information systems mapped to
84 binary variables (see Supplementary Appendix)
Visible comorbidities Binary If a previous hospitalization occurred between 5 y and 6 mo before admission or if a pre-
vious ED visit occurred between 6 mo and 2 wk before admission
Flu seasonb,f Binary If the current admission is in the month of December, January, or February
ICU admissionb,d Binary If the current admission is a direct admission to the ICU
Urgent 30-d readmissionb,d Binary If the current admission is an urgent readmission within 30 d of a previous discharge
Ambulance admissionb,d Binary If the current admission is via ambulance
ED admissiond Binary If the current admission is via the ED
See Supplementary Appendix for additional details.
ED: emergency department; ICD-10: International Classification of Diseases–Tenth Revision; ICU: intensive care unit.
a
All variables except ED admission included in the RF-AdminDemoDx model.
b
Included in the RF-AdminDemo model.
c
Included in the RF-Minimal model.
d
Included in the Modified Hospital One-year Mortality Risk model. For variable transformations and interaction terms, see original specification by
Wegier et al.21
e
Unknown if no previous hospitalization between 5 years and 6 months before admission.
f
Models were developed prior to the COVID-19 (coronavirus disease 2019) pandemic; future revisions will likely exclude this variable.
harmful medical error.2,25 The main objective of decision analysis Outcome definitions
was to identify the prediction model that maximized this quality in- Electronic CSOs were linked to hospitalizations in the testing cohort
dicator. The secondary objective was evaluating the net benefit after model development and did not have any role in predictive val-
(NB)14,15 of prediction models. idation. These orders could convey 1 of 3 resuscitation preferences:
wants all resuscitation measures (Full code), does not want CPR but
Alternative strategies wants endotracheal intubation if necessary (do not resuscitate
We simulated the operation of a CDSS that uses alternative predic- [DNR]/Intubation-OK), and does not want CPR or intubation
tion models for triggering an alert. Conceptually, alerts would sug- (DNR/DNI [do not intubate]). We considered a CSO to have oc-
gest discussing GOC, including cardiopulmonary resuscitation curred during a hospitalization if at least 1 was documented between
(CPR) preferences, if appropriate,7 and remind physicians to docu- 1 week before the admission date and the discharge date, inclusively.
ment CPR preferences in a CSO. The system would generate alerts The extra week was added to associate a hospitalization with any
after midnight for eligible patients admitted the previous day having CSOs documented during observation in the emergency department
a predicted risk greater or equal to a certain risk threshold. Because prior to hospital admission. The main outcome was a hospitaliza-
intervention harm was minimal and time constraints were known to tion with a CSO among those for patients at the EOL, which we de-
limit GOC discussions,2,6 we considered the proportion of admis- fined as death within 1 year of admission.
sions with an alert, or alert prevalence, to be the most appropriate
criteria for determining risk thresholds. For example, if it was pref- Decision trees
erable for alert prevalence to be 10%, then we would set the risk We modeled 2 decision trees in which alerts led to the desired action
threshold of each prediction model to be the 90th percentile of pre- (Figure 1). The first was based on the conventional assumptions of deci-
dicted risk: 10% of cases would have a risk higher than the thresh- sion analysis for prediction models,26,27 in which alerts lead to action
old, leading to an alert. We set an alert prevalence of 10% as a point and the absence of an alert leads to inaction. The second was a scenario-
of reference and expected 5% to 20% to be an appropriate range appropriate adaptation that allowed assessing expected utility relative to
for sensitivity analyses. a strategy of usual care, in which alerts lead to action and the absence of
The alternative strategies under consideration were the 4 mortal- an alert leads to usual care: either action or inaction depending on what
ity alert rules that resulted from applying to each prediction model had factually occurred for the alert-negative case. For both trees, the ben-
an alert prevalence–fixed risk threshold. efit to patients of discussing and documenting GOC2 was attributed toJournal of the American Medical Informatics Association, 2021, Vol. 28, No. 11 2369
true positives (TPs). The cost of this action is spending clinical time,2 Our primary measure of expected clinical utility was the
which was attributed to false positives (FPs). Our valuation procedure expected risk difference (eRD) compared with usual care of the
and assumptions are further explained in the Supplementary Appendix. main outcome, calculated for each rule as
To distinguish the effect of model-based predictions from the ef- eRD¼P(Alert or CSO j EOL)-P(CSO j EOL)
fect of simply generating alerts, we included a fifth model of uni- This metric is based on the intention-to-treat estimator10 and
formly random numbers between 0 and 1. We did not expect alerts answers the hypothetical question: if every alert based on rule R had
from such a model to cause physicians to act in the same way as the led to the desired action (a CSO), how many more hospitalizations
validated prediction models, but it would serve to make explicit a at the EOL (as a proportion of all hospitalizations at the EOL)
side effect of the assumption that all alerts would cause the desired would have had a CSO?
action of a CSO. For contextualizing the eRD, we calculated the number needed
to benefit (NNB):
Statistical analysis NNB¼P(Alert)PAlert & EOL-P(Alert & EOL & CSO)
We described cohort characteristics stratified by EOL and CSO sta- The NNB is the number of alerts needed to increase benefit by
Downloaded from https://academic.oup.com/jamia/article/28/11/2366/6362565 by guest on 03 November 2021
tus. We assessed model discrimination using the C-statistic and its one outcome over usual care, assuming that every alert leads to ac-
calibration using a calibration plot.8 To assess construct validity of tion. It is the reciprocal of the difference in risk of benefiting with a
predictions, we regressed DNR preference against predicted risk in model-based strategy minus the risk of benefiting with usual care
the CDSS-eligible cohort. (among those identified by an alert): P(EOL j Alert) – P(EOL &
EOL
TP: P(Alert & EOL | R)
Alert → CSO
not EOL
FP: P(Alert & not EOL | R)
Strategy=R
EOL
FN: P(no Alert & EOL | R)
no Alert → no CSO
not EOL
TN: P(no Alert & not EOL | R)
Decision tree 1
EOL
TP: P(CSO & EOL | UC)
CSO
not EOL
FP: P(CSO & not EOL | UC)
Strategy=UC
EOL
FN: P(no CSO & EOL | UC)
no CSO
not EOL
TN: P(no CSO & not EOL | UC)
EOL
TPR: P(Alert & EOL | R)
Alert → CSO
TP: (TPR or TPUC) =
not EOL
FPR: P(Alert & not EOL | R) P([Alert or CSO] & EOL | R)
Strategy=R
EOL TPUC: P(no Alert & CSO & EOL | R) FP: (FPR or FPUC) =
CSO P([Alert or CSO] & not EOL | R)
not EOL FPUC: P(no Alert & CSO & not EOL | R)
no Alert → UC
EOL FN: P(no Alert & no CSO & EOL | R)
no CSO
Decision tree 2 not EOL TN: P(no Alert & no CSO & not EOL | R)
EOL
TP: P(CSO & EOL | UC)
CSO
not EOL FP: P(CSO & not EOL | UC)
Strategy=UC
EOL
FN: P(no CSO & EOL | UC)
no CSO
not EOL
TN: P(no CSO & not EOL | UC)
Figure 1. Strategic decision tree models. Two decision trees modelling the potential outcomes of each hospitalization in the clinical decision support system
(CDSS)–eligible cohort under alternative strategies. The strategy of an alert rule, R, implies that a CDSS is implemented and uses R to generate alerts. In the strat-
egy of usual care (UC), code status orders (CSOs) occur as they factually did between July 2017 and July 2018 in the 2 hospitals of Sherbrooke, Quebec, Canada.
In both trees, an alert always implies a CSO (Alert ! CSO; the arrow notation expresses a strategy: if Alert, then do CSO). The difference between the 2 trees is
how outcomes unfold in the absence of an alert. In decision tree 1, no alert results in no action (no Alert ! no CSO: if no alert, then do no CSO). In decision tree 2,
no alert results in the action that occurred retrospectively in usual care (no Alert ! UC: if no alert, then do usual care). The first tree models the conventional sce-
nario of decision curve analysis in which a prediction rule aims to reduce intervention-related harm, while the second models the scenario of a CDSS that aims to
increase a routine good practice that is constrained by time. A true positive (TP) outcome occurs when a CSO is documented during a hospitalization for a patient
who died within 1 year of admission (end-of-life [EOL] status). A false positive (FP) outcome occurs when a CSO is documented during a hospitalization for a pa-
tient who survives more than a year (“not EOL” status). A false negative (FN) outcome occurs when no CSO is documented during an EOL hospitalization. A true
negative (TN) occurs when no CSO is documented for a “not EOL” hospitalization. The formulas to calculate the expected probability of each outcome for a given
strategy are provided to the right of each terminal node.2370 Journal of the American Medical Informatics Association, 2021, Vol. 28, No. 11
CSO j Alert). Conceptually, it incorporates both the number needed expected relative risk (the ratio of the terms in the eRD) in relevant
to screen, 1/P(EOL j Alert), and the number needed to treat, 1/P(no inpatient populations.
CSO j EOL), as originally described,16 but it was calculated without Consistent with the decision-analytic design, no P-valued signifi-
assuming conditional independence: the subset of patients at the cance tests were performed between the alternative strategies.28 We
EOL successfully screened with an alert would not necessarily have bootstrapped 95% confidence intervals (CIs) for estimates of predic-
the same chance of beneficial treatment (the counterfactual outcome tive accuracy.8,29 To verify the potential influence of including all
in the event of “no CSO”) as the set of all patients at the EOL. hospitalizations in the CDSS-eligible cohort, rather than sampling
Our secondary measure of expected clinical utility was the NB, unique patients, we repeated analyses using the first, last, and a ran-
calculated for each strategy, S, as dom hospitalization per patient. All statistical analyses were per-
NBS¼PTP S)-PFP S)Exchange Rate formed with R version 3.6.3 (R Foundation for Statistical
In our scenario, the risk threshold was based on estimated avail- Computing, Vienna, Austria) (relevant extensions and details in the
ability of clinical time, not necessarily patient-provider preference Supplementary Appendix).30
for CSO. This made the risk threshold potentially unsuitable to in-
Downloaded from https://academic.oup.com/jamia/article/28/11/2366/6362565 by guest on 03 November 2021
form the exchange rate, calculated in conventional decision curve
analysis as Risk Threshold/(1-Risk Threshold).15,27 The exchange
RESULTS
rate represents the theoretical ratio between the harm of inappropri-
ate inaction (false negative [FN]) and the harm of inappropriate ac- Sample and model description
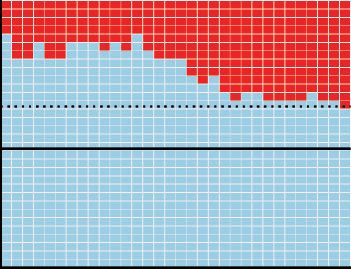
tion (FP), which can be obtained by various means14; the threshold The participant flow diagram is presented in Figure 2. Between July
method is a convenient simplification in the absence of other utility 1, 2011, and June 30, 2018, there were 175 041 hospitalizations for
estimates in the validation set.27 We calculated a model-independent adults in a nonpsychiatric service at our institution (93 295
exchange rate using observed actions of clinicians (ie, using their patients). After excluding 76 hospitalizations with rare circumstan-
revealed preferences)14 who implicitly decide under uncertainty be- ces, the training cohort included 122 860 hospitalizations between
tween the harm of inaction and the time cost of action: July 1, 2011, and June 30, 2016 (70 788 patients), and the testing
Observed Exchange Rate¼P(TP j Usual care)P(FP j Usual care) cohort included 26 291 hospitalizations between July 1, 2017, and
Substituting equation 4 in equation 3 results in a NB of zero for June 30, 2018 (20 012 patients). There were 22 034 hospitalizations
the default strategy S ¼ Usual care. We plotted decision curves for (16 490 patients) in the CDSS-eligible cohort. Patient-
both decision trees and for both a threshold-based and observed ex- hospitalization characteristics are presented for the CDSS-eligible
change rate. A visual guide to interpreting the eRD, NNB, and ob- cohort in Table 2 (description of other cohorts in the Supplementary
served exchange rate is provided in the Supplementary Appendix Appendix). Prediction models had acceptable temporal validity (Ta-
(Supplementary Figure S1 ). ble 3; Supplementary Figure S2). When sampling over unique
We performed a 2-way sensitivity analysis14 between alert preva- patients, the C-statistic ranged from 0.84 to 0.89 in the testing co-
lence and the exchange rate in subgroups of service type and hospital hort and lowered to 0.79 to 0.86 in the CDSS-eligible cohort. Fig-
site. We assessed subgroup heterogeneity using a forest plot of the ure 3 describes EOL process indicators as a function of model-
175014 hospitalizations assessed for eligibility
July 1st 2011 to June 30th 2018
93295 patients
76 excluded due to special circumstances
43 with legal context
34 with rare admission service
25787 excluded to prevent outcome leakage
July 1st 2016 to June 30th 2017
122860 included in training cohort 26291 included in testing cohort
July 1st 2011 to June 30th 2016 July 1st 2017 to June 30th 2018
70788 patients 20012 patients
4257 ineligible for CDSS
3191 obstetric admissions
101 palliative care admissions
1014 admissions with same-day discharge
22034 included in CDSS-eligible cohort
16490 patients
Figure 2. Participant flow diagram. CDSS: clinical decision support system.Journal of the American Medical Informatics Association, 2021, Vol. 28, No. 11 2371
Table 2. CDSS-eligible cohort characteristics
Overall (N ¼ 22 034) With CSO (n ¼ 7648) Hospitalizations at EOL (n ¼ 3773)
With CSO (n ¼ 2599) Without CSO (n ¼ 1174)
Age, y 68 (57-78) 77 (67-85) 78 (69-87) 69 (60-78)
Female 10 473 (48) 3817 (50) 1212 (47) 509 (43)
Hospital site
A 13 350 (61) 3867 (51) 1455 (56) 909 (77)
B 8684 (39) 3781 (49) 1144 (44) 265 (23)
Service type
Medical 12 187 (55) 6246 (82) 2135 (82) 658 (56)
Surgical 9266 (42) 1023 (13) 312 (12) 484 (41)
Critical carea 581 (3) 379 (5) 152 (6) 32 (3)
Downloaded from https://academic.oup.com/jamia/article/28/11/2366/6362565 by guest on 03 November 2021
Admission type
Nonelective 16 780 (76) 7298 (95) 2525 (97) 917 (78)
Elective 5254 (24) 350 (5) 74 (3) 257 (22)
Living status at dischargeb
Home 11 205 (51) 2663 (35) 467 (18) 507 (43)
Home with health center (CLSC) liaison 6115 (28) 1656 (22) 482 (19) 404 (34)
Short-term transitional care 1354 (6) 717 (9) 201 (8) 99 (8)
Nursing home 1612 (7) 1143 (15) 296 (11) 57 (5)
Chronic care hospital 528 (2) 454 (6) 200 (8) 24 (2)
Otherc 291 (1) 151 (2) 89 (3) 18 (2)
Death in hospital 929 (4) 864 (11) 864 (33) 65 (6)
ED visitsd
0 12 786 (58) 3 457 (45) 956 (37) 608 (52)
1-2 6476 (29) 2620 (34) 941 (36) 383 (33)
3 or more 2772 (13) 1571 (21) 702 (27) 183 (16)
Admissions by ambulanced
0 18 547 (84) 5432 (71) 1644 (63) 964 (82)
1-2 2891 (13) 1760 (23) 738 (28) 180 (15)
3 or more 596 (3) 456 (6) 217 (8) 30 (3)
Weeks recently hospitalizede
0 18 601 (84) 5925 (77) 1774 (68) 815 (69)
1-2 2617 (12) 1237 (16) 571 (22) 281 (24)
3 or more 816 (4) 486 (6) 254 (10) 78 (7)
ED admission 12 711 (58) 6329 (83) 2155 (83) 566 (48)
Ambulance admission 7418 (34) 4536 (59) 1628 (63) 297 (25)
Urgent 30-d readmission 2396 (11) 1205 (16) 596 (23) 210 (18)
ICU admission 1036 (5) 454 (6) 171 (7) 51 (4)
ICU stay during hospitalization 3512 (16) 1616 (21) 538 (21) 152 (13)
Hospital length of stay, d 4 (2-8) 7 (4-15) 9 (4-17) 4 (2-8)
Code status preferencef
Full code 2323 (11) 2323 (30) 285 (11) 0 (0)
DNR/Intubation-OK 928 (4) 928 (12) 254 (10) 0 (0)
DNR/DNI 4397 (20) 4397 (57) 2060 (79) 0 (0)
Not documented 14 386 (65) 0 (0) 0 (0) 1174 (100)
Major comorbiditiesg
Congestive heart failure 2758 (13) 1728 (23) 745 (29) 194 (17)
Chronic pulmonary disease 4626 (21) 2516 (33) 922 (35) 265 (23)
Dementia 1815 (8) 1447 (19) 570 (22) 77 (7)
Metastatic cancer 1787 (8) 848 (11) 634 (24) 304 (26)
Values are n (%) or median (interquartile range). Percentages may not add to 100 due to rounding.
CDSS: clinical decision support system; CLSC: Centre local de services communautaires; CSO: code status order; DNI: do not intubate; DNR: do not resusci-
tate; ED: emergency department; EOL: end of life; ICU: intensive care unit.
a
Represent direct admissions to the ICU before a primary non–critical care service could be specified (ie, the responsible service upon ICU discharge). ICU expo-
sure is more precisely measured with the variables “ICU admission” and “ICU stay during hospitalization.”
b
See Supplementary Appendix for characteristics of real-time–accessible living status (used for prediction models).
c
Includes transfer to another hospital, rehabilitation center, palliative care center, or discharge against medical advice.
d
In the year before admission.
e
In the 90 days before admission.
f
Last preference documented during hospitalization if one was documented.
g
Charlson comorbidities using International Classification of Diseases–Tenth Revision codes by Quan et al31 and ascertained using the discharge abstract of in-
dex hospitalization and of those in the year before discharge.2372 Journal of the American Medical Informatics Association, 2021, Vol. 28, No. 11
Table 3. Predictive performance of automatable prediction models for the outcome of 1-year mortality
RF-AdminDemoDx RF-AdminDemo RF-Minimal mHOMR
Internal validationa
C-statistic (range) 0.90 (0.90-0.91) 0.86 (0.85-0.87) 0.85 (0.84-0.86) 0.86 (0.85-0.86)
Brier score (range) 0.068 (0.065-0.073) 0.079 (0.077-0.083) 0.082 (0.078-0.084) 0.081 (0.078-0.085)
External validationb,c
C-statistic (95% CI) 0.89 (0.88-0.89) 0.85 (0.84-0.86) 0.84 (0.83-0.84) 0.84 (0.83-0.85)
Brier score (95% CI) 0.074 (0.072-0.076) 0.084 (0.081-0.086) 0.086 (0.084-0.089) 0.086 (0.083-0.088)
CDSS-eligible validationb,d
C-statistic (95% CI) 0.86 (0.85-0.87) 0.81 (0.80-0.82) 0.79 (0.78-0.80) 0.80 (0.79-0.81)
Brier score (95% CI) 0.088 (0.085-0.091) 0.10 (0.097-0.10) 0.10 (0.10-0.11) 0.10 (0.099-0.11)
CDSS: clinical decision support system; CI: confidence interval; mHOMR: Modified Hospital One-year Mortality Risk.
Downloaded from https://academic.oup.com/jamia/article/28/11/2366/6362565 by guest on 03 November 2021
a
Internal validity estimated using 10-fold cross-validation in the training cohort (12 069-12 521 hospitalizations and 7078-7079 patients in each fold). Metrics
calculated for each fold after sampling 1 random hospitalization per patient. Data given as median estimate (range [ie, minimum-maximum]) across the 10 folds.
b
Metrics calculated on 1000 two-stage bootstrapped samples as detailed in the Supplementary Appendix. Data given as median estimate (95% CI).
c
Temporal validity estimated in testing cohort (26 291 hospitalizations, 20 012 patients).
d
Temporal validity estimated in CDSS-eligible cohort (22 034 hospitalizations, 16 490 patients).
A 1−year mortality B CSO documentation C DNR preference
1.00 1.00 1.00
0.75 0.75 0.75
Proportion
Proportion
Proportion
0.50 0.50 0.50
Prediction model
RF−AdminDemoDx
mHOMR
0.25 0.25 0.25 RF−AdminDemo
RF−Minimal
0.00 0.00 0.00
0.00 0.25 0.50 0.75 1.00 0.00 0.25 0.50 0.75 1.00 0.00 0.25 0.50 0.75 1.00
Predicted risk Predicted risk Predicted risk
Figure 3. Regression of end-of-life outcome and communication indicators against model-predicted risk. Binary variables regressed against predicted risk of a
given model then plotted along with 95% confidence interval bands using the LOESS algorithm. One random hospitalization per patient sampled from the clinical
decision support system–eligible cohort before applying regression. (A, B) Showing 16 490 patients, in which 2248 died within 1 year of hospitalization and 5241
had code status order (CSO) documentation during that hospitalization. (C) Showing 5241 patient hospitalizations with CSO documentation, in which 3552 pre-
ferred a do not resuscitate (DNR) status in the last CSO documented before discharge. Among the 5241 patients with a CSO, a predicted risk of mortality exceed-
ing 10% to 15% was associated with a majority preference for DNR—either “DNR/Intubation-OK,” or “DNR/DNI (do not resuscitate).” mHOMR: Modified Hospital
One-year Mortality Risk.
predicted risk; all models had good construct validity for DNR pref- 76.9 years; 95% CI, -9.5 to -7.6]), and of shorter duration (mean
erences. length of stay 6.5 days vs 12.9 days; 95% CI, -7.1 to -5.7]).
CSOs at the EOL Expected clinical utility
There were 7648 hospitalizations associated with a CSO in the Simulated at an alert prevalence of 10%, each model would have
CDSS-eligible cohort (35%). Among these, 2599 (34%) were associ- generated on average 6 alerts per day over 1 year (Figure 4). At
ated with death within 1 year of admission; clinicians were observed this same level of resource use, the eRD varied between 5.4% and
to document a CSO during 1 hospitalization at the EOL for every 10.7%, and the NNB between 5.4 and 10.9 alerts (Table 4). The RF-
1.9 hospitalizations not at the EOL (observed exchange rate of AdminDemoDx model had the highest expected benefit by either met-
2599 TPs to 5049 FPs). On average, clinicians acted as though the ric. This model also maximized NB in the decision curves regardless
harm of FNs was 1.9 times as harmful as a FP. of the decision tree or exchange rate used (Figure 5). When routine
There were 3773 (17%) hospitalizations at the EOL in the clinical actions were considered, only the RF-AdminDemoDx and
CDSS-eligible cohort. Among these, a CSO was not documented in RF-AdminDemo models could increase value above usual care in the
1174 cases, meaning a minimal GOC discussion had not been docu- range of reasonable alert prevalence (Figure 5D).
mented for 31% of applicable hospitalizations with overnight stays
at the EOL. Compared with hospitalizations at the EOL that did Sensitivity analysis
have a CSO, these cases were more likely to be elective (odds ratio, The net benefit of the RF-AdminDemoDx model remained the
9.6; 95% CI, 7.3 to 12.5), in surgical specialties (odds ratio, 5.1; highest among models in the 2-way sensitivity analysis (Figure 6).
95% CI, 4.4 to 6.1), for younger patients (mean age 68.3 years vs Subgroup analysis indicated heterogeneity that could influence im-Journal of the American Medical Informatics Association, 2021, Vol. 28, No. 11 2373
A 100 B 25
Prediction model
RF−AdminDemoDx
20 mHOMR
75 RF−AdminDemo
Alert prevalence (%)
Alert prevalence (%)
RF−Minimal
Random
15
50
10
Downloaded from https://academic.oup.com/jamia/article/28/11/2366/6362565 by guest on 03 November 2021
25
5
0 0
0.00 0.25 0.50 0.75 1.00 0.25 0.50 0.75
Risk threshold Risk threshold
C CHUS−Fleurimont D CHUS−Hôtel−Dieu
50 50
Admissions
40 40
All
CDSS−eligible
Events per day
Events per day
With CSO
30 30
At EOL
CDSS alerts
20 20 (10% prevalence)
RF−AdminDemoDx
mHOMR
10 10
RF−AdminDemo
RF−Minimal
0 0
Jul Oct Jan Apr Jul Oct Jan Apr
Date Date
Figure 4. Association between risk threshold and alert prevalence. (A) Alert prevalence is plotted as a function of risk threshold in the clinical decision support
system (CDSS)–eligible cohort; Alert prevalence ¼ f(Risk Threshold) ¼ P(Predicted risk Risk threshold). A region of interest is outlined in which risk thresholds
satisfy reasonable workload demands (Alert prevalence of 5-20%). (B) The region of interest in panel A is magnified. (C, D) Time series between July 1, 2017, and
June 30, 2018, of daily events stratified by hospital site (CHUS-Fleurimont refers to site A and CHUS-Hôtel-Dieu refers to site B in the main text). The frequency of
actual admissions is compared with the frequency of simulated alerts at risk thresholds corresponding to an overall alert prevalence of 10%. “All” refers to all
admissions in the testing cohort (excluding pediatric and psychiatric admissions). The loess algorithm was used to smooth day-to-day variations using a span of
0.2 for all curves. Non–CDSS-eligible cases at site A include mostly obstetrical admissions. CHUS: Centre Hospitalier Universitaire de Sherbrooke; CSO: code sta-
tus order; EOL: end of life; mHOMR: Modified Hospital One-year Mortality Risk.
plementation, including a smaller benefit for all models at site B dation studies in this area of research and provide both a narrative
(Supplementary Figures S3-S7). Estimates of clinical utility using dif- and tabular synthesis of related studies in the Supplementary Appen-
ferent sampling strategies did not change the direction or interpreta- dix. In recent years, there has been a shift from manual screening
tion of results (Supplementary Tables S7-S9, Supplementary Figures tools33 toward automated trigger tools,34 with the latter shifting
S8-S10). from query-based algorithms35 toward increasingly flexible, but in-
frastructure-dependent, prediction models.21,36–39 A challenge with
such models is that their usual learning objective, minimizing the er-
DISCUSSION ror of mortality prediction, is only indirectly related to the clinical
Improving patient identification for routine PEOLC interventions is objective of maximizing benefit for a resource-limited PEOLC inter-
a priority for healthcare stakeholders aiming to reconcile the default vention. In this setting of mismatched expectations, predictiveness
policies of life-sustaining therapy with the static truth that all life does not mean usefulness, making it essential to assess clinical utility
comes to an end. We performed an up-to-date review of model vali- and not just predictive accuracy.8–10,162374 Journal of the American Medical Informatics Association, 2021, Vol. 28, No. 11
Table 4. Expected clinical utility of prediction models in the CDSS-eligible cohort
RF-AdminDemoDx mHOMR RF-AdminDemo RF-minimal
Parameters
Alert prevalence, % (no. alerts) 10 (2204) 10 (2204) 10 (2204) 10 (2205)
Risk threshold 0.478 0.461 0.465 0.422
Clinical utility
eRD, % 10.7 5.5 6.9 5.4
NNB, alerts 5.4 10.7 8.4 10.9
Benefit 0.1363 0.1273 0.1298 0.1272
Harm 0.1264 0.1284 0.1278 0.1297
Net benefit 0.0099 0.0011 0.0020 0.0025
Predictive accuracy
PPV, % 63 48 50 44
Downloaded from https://academic.oup.com/jamia/article/28/11/2366/6362565 by guest on 03 November 2021
NPV, % 88 86 87 86
Sensitivity, % 37 28 29 26
Specificity, % 95 94 94 93
C-statistica 0.85 0.79 0.80 0.77
Brier scorea 0.11 0.12 0.12 0.12
Risk threshold set as the 90th percentile of predicted risk in the sample, which results in an alert prevalence of 10%. Sample size ¼ 22 034 hospitalizations;
true positive code status orders in usual care ¼ 2599; false positive code status orders in usual care ¼ 5049; observed exchange rate ¼ 0.515. The expected clinical
utility of completely random alerts provided for reference in the Supplementary Appendix (Supplementary Table S6).
CDSS: clinical decision support system; eRD: expected risk difference; mHOMR: Modified Hospital One-year Mortality Risk; NNB: number needed to benefit;
NPV: negative predictive value; PPV: positive predictive value.
a
Threshold independent. These metrics differ for the CDSS-eligible cohort in Table 3 due to the different sampling unit (1 hospitalization per patient is sampled
for the results of Table 3; all hospitalizations are included here).
While the most accurate model ended up having the highest expected (not necessarily target population), all models in our study had simi-
value, relying on an association between predictiveness and value can be lar C-statistics as published models (ie, above 0.8). However, the
misleading. In Table 4, the RF-AdminDemo and mHOMR model have eRD and NNB for a patient-centered outcome ranged almost 2-fold,
similar indicators of accuracy (eg, Brier score 0.12 for both; C-statistic and only 2 models had a higher NB than usual care with our
0.80 vs 0.79), but only one would be more beneficial than usual care un- scenario-appropriate decision tree.
der the assumptions of decision analysis (net benefit above zero vs net Others have validated the predictive performance of a model,
benefit below zero). The unreliability of the C-statistic to discriminate then described physician opinion about the appropriateness of high-
value is even more apparent when comparing a given model’s expected risk predictions for intervening.36,39,40 While informative of con-
benefit across the 2 hospital sites (Supplementary Figures S3-S6). For the struct validity, appropriateness does not represent a model’s useful-
RF-AdminDemoDx model, the C-statistic at both site A and site B was ness over alternatives. If a mortality alert rule resulted in alerts for
0.85. The NNB, however, was 4.4 and 11.0, respectively, reflecting a every hospitalization—and only hospitalizations—with a DNR in
greater usual tendency to document CSOs at site B. The difference be- the CDSS-eligible cohort, its positive predictive value for 1-year
tween sites was most dramatic for the RF-Minimal model, which had an mortality would be 43.5% (n ¼ 2314 of 5325) and all cases would
NNB of 8.8 vs 114: only 4 alerts of 456 simulated during 1 year at site B be appropriate for hypothetical CSO documentation; yet, this rule is
identified an individual at the EOL that did not already have a CSO useless for improving this outcome because it tells clinicians what
documented. The C-statistic was entirely uninformative of this differ- they already act upon. A similar situation could result from using a
ence, being 0.77 at both sites. model that is highly influenced by terms like “palliative” and
In our review of the literature, we did not find any retrospective “DNR,”41 or a model that uses historical palliative care consults to
study evaluating the clinical utility—both benefits and harms—of predict future consults.37 Even if alerts correctly predict mortality or
automatable prediction models for prompting PEOLC interventions. benefit, those who would benefit from usual care anyway might be
In contrast, almost all studies reported the C-statistic for mortality, disproportionately identified. More concerningly, those who do not
and these were generally above 0.8. The context insensitivity of the usually benefit may be further marginalized.7
C-statistic makes it practical for research but uninformative for Prediction models are often evaluated in biased conditions42 and
practice: more value-based metrics are required to guide decision rarely compared against routine clinical decision making.43 Clinical
makers.14,17 Prediction models for prompting a PEOLC intervention utility metrics—like an intention-to-treat estimator,10 the NB,15 or
had varying use cases for decision support, including GOC discus- the NNB16—allow for patient-centered comparisons of prediction
sion, palliative care referral, outpatient follow-up for advance care models with more appropriate assumptions. They can also detect
planning, or hospice referral. The benefits, harms, and resources as- unexpected differences in potential impact, like the difference in
sociated with these actions differ between each other and between expected value between our 2 sites, before any health system invest-
health systems; one curve does not fit all. ment and exposure to patients. We demonstrated 3 innovative strat-
Strengths of our study included ensuring that retrospectively egies to increase the applicability of decision analysis for assessing
accessed data represented real-time data and the use of temporal the utility of automatable prediction models.
rather than random splitting for validation: simulating prospective First, we did not rely on a link between risk threshold and clini-
application at the point of care. When validated in similar cohorts cal preference for net benefit analysis.27,44 Instead, we linked theJournal of the American Medical Informatics Association, 2021, Vol. 28, No. 11 2375
A 0.15 B 0.15 Comparison strategy
Decision tree 1 Decision tree 2
Exchange rate = Odds(Risk Threshold) Exchange rate = Odds(Risk Threshold) Usual care
Alerts for all
Alerts for none
0.10 0.10
Net benefit
Net benefit
Prediction−based strategy
RF−AdminDemoDx
mHOMR
0.05 0.05 RF−AdminDemo
RF−Minimal
Random
0.00 0.00
0.1 0.2 0.3 0.4 0.5 0.1 0.2 0.3 0.4 0.5
(1:9) (1:4) (3:7) (2:3) (1:1) (1:9) (1:4) (3:7) (2:3) (1:1)
Risk threshold Risk threshold
Downloaded from https://academic.oup.com/jamia/article/28/11/2366/6362565 by guest on 03 November 2021
(Odds) (Odds)
C 0.075 D 0.075
Decision tree 1 Decision tree 2
Exchange rate = 2599:5049 Exchange rate = 2599:5049
0.050 0.050
Net benefit
Net benefit
0.025 0.025
0.000 0.000
5 10 15 20 5 10 15 20
Alert prevalence (%) Alert prevalence (%)
Figure 5. Decision curve analysis. Decision curves to assess net benefit as a function of either desired risk threshold (top) or desired alert prevalence (bottom),
and using either decision tree 1 (left) or decision tree 2 (right). In all scenarios, the RF-AdminDemoDx model had a higher net benefit than alternative prediction
models. (A) The decision curves use the original methodology of Vickers et al.27,32 (B) Decision tree 2 is assumed instead of the original tree. (C) The exchange
rate is assumed to equal the observed exchange rate, rather than the odds at the risk threshold. (D) Combination of the assumptions in panels B and C: decision
tree 2 is assumed and the exchange rate is assumed to equal the observed exchange rate. Only the RF-AdminDemoDx and RF-AdminDemo model exceed the net
benefit of usual care under these combined assumptions. With decision tree 1, “Alerts for none” and “Alerts for all” implies “CSO for none” and “CSO for all,”
respectively. With decision tree 2, “Alerts for all” still implies “CSO for all,” but “Alerts for none” implies “Usual care.” The strategy of “Alerts for all” is a distant
outlier in the bottom panels, corresponding to a constant net benefit of around -0.25. The strategy of “Alerts for none” overlaps “Usual care” in panels B to D.
CSO: code status order; mHOMR: Modified Hospital One-year Mortality Risk.
risk threshold to the desired alert prevalence, representing resource mortality was above 10% to 15%, but such a risk threshold would
use, and used other procedures to value outcomes. In doing so, we result in an alert prevalence over 50%. While likely acceptable for
overcome a limitation of threshold-based NB analysis, which has patients, who have little to lose and much to gain from a routine
been remarked as inappropriate for prediction model use cases that GOC discussion, this low risk threshold could imply unreasonable
require considering resource availability in addition to patient bene- workloads for clinicians and cause alert fatigue.12 The observed ex-
fits and harms.16 Note that the intent behind NB analysis—if not change rate is a simple measure of the benefit-for-time trade-off that
most decision-analytic methods14—is that it be adapted and ex- limits a good practice with minimal intervention-related harm. It is
tended to specific scenarios,27,45 the motivating principle being pre- readily reproducible if practice patterns change over time and we be-
cisely that off-the-shelf metrics are not necessarily appropriate for lieve it is insightful about clinical decision making, noting that
all scenarios and stakeholders.17 physicians may be influenced by an inflated perception of GOC-
Second, we extended the original decision tree used for decision related cost.46 This technique could facilitate the clinical utility as-
curve analysis to allow simulating model-augmented outcomes (eg, sessment of other models for improving good practices in time-
that no alert can still lead to CSO if clinically appropriate), rather constrained environments, in which utilities cannot be inferred from
than model-determined outcomes (eg, that no alert will lead to no the desired risk threshold. We used CSOs because they were the only
CSO). We would not want or expect the latter for our use case. By electronic indicator of GOC documentation at our institution, but
design, the adapted decision tree results in a more modest estimation the same technique could be applied for other standardized indica-
of utility, one that accounts for the expected value of routine care: tors of the EOL communication process, like Physician Orders for
models can only increase benefit if it is there to be increased after ap- Life-Sustaining Treatment.47
plying usual clinical decision making. Our reproduction of the mHOMR model did not discriminate 1-
Third, we used empiric rates of TP and FP actions to inform an year mortality as well as in Ontario (C-statistic 0.84 vs 0.89),21 but it
observed exchange rate. This enabled decision curve analysis while was relatively simple to generalize to our institution. We cannot say the
comparing models at the same alert prevalence, which was not nec- same of our ML model, which relies on admission diagnoses in Quebec-
essarily at the same risk threshold across models. Among those with local French and would need another free-text mapping to be transport-
a CSO, most patients preferred a DNR when the predicted risk of able beyond provincial borders (we report all variable definitions to en-2376 Journal of the American Medical Informatics Association, 2021, Vol. 28, No. 11
Medical : Site A Medical : Site B
3:1 3:1
5:3 5:3
1:1 1:1
Exchange rate
Exchange rate
3:5 3:5
1:3 1:3
1:7 1:7
Downloaded from https://academic.oup.com/jamia/article/28/11/2366/6362565 by guest on 03 November 2021
5 10 15 20 5 10 15 20
Alert prevalence (%) Alert prevalence (%)
Surgical : Site A Surgical : Site B
3:1 3:1
5:3 5:3
1:1 1:1
Exchange rate
3:5 Exchange rate 3:5
1:3 1:3
1:7 1:7
5 10 15 20 5 10 15 20
Alert prevalence (%) Alert prevalence (%)
Observed exchange rate Overall Subgroup
Strategy with highest NB RF−AdminDemoDx Usual care
Figure 6. Two-way sensitivity analysis between resource availability and clinical preference. The net benefit (NB) was calculated for each strategy, for each tile,
and for each plot; the strategy with the highest NB is indicated for the corresponding combination of alert prevalence and exchange rate in each hospital site (col-
umn) and service type (row). For example, if an alert prevalence around 15% was desirable for medical services at site B, and the cost of a false negative (FN) in
this group was considered equal to the cost of a false positive (FP) (exchange rate 1:1), then the most beneficial strategy would be usual care. In the same setting,
the RF-AdminDemoDx model would be a better strategy if either a lower alert prevalence was acceptable (eg, around 11%, implying a higher risk threshold), or if
the cost of FP alerts were relatively lower (eg, exchange rate of 3:5, in which 3 FNs are as costly as 5 FPs). A higher exchange rate indicates a greater preference
for avoiding the time cost of a goals-of-care discussion when one is unnecessary (worried about FPs), while a lower exchange rate indicates a greater preference
for avoiding the harm of omitting a goals-of-care discussion when one is necessary (worried about FNs). The overall exchange rate (dotted line) was calculated
using equation 4 in the full cohort, and the subgroup exchange rate (solid line) corresponds to the result of equation 4 among a given subgroup. The Modified
Hospital One-year Mortality Risk, RF-AdminDemo, and RF-Minimal models are not referenced because they were never a strategy with the highest net benefit.
able this). However, while the local instance of our ML model is less practical, like assuming that alerts would deterministically lead to ac-
geographically transportable than mHOMR, it is convincingly more use- tion.10,27 To increase the transparency of these assumptions, we repeated
ful for future application at our institution. This finding adds evidence to analyses with a random model. In practice, some alert fatigue should be
the recommendation that the pursuit of model generalizability should expected and addressed during pilot implementation (eg, by tailoring
not be at the expense of local clinical utility.13 alerts to service needs).12 Third, owing to the COVID-19 pandemic, a re-
Our study has several limitations. First, resuscitation preference doc- peat validation is likely warranted before local application because mod-
umentation is an essential but limited measure of EOL communica- els rely on noncausal associations, such as between admission service
tion.24 We did not measure the quality of the GOC discussions that and death, that may have unexpectedly shifted after systemic reorganiza-
preceded a CSO, nor the concordance of preferences with care received.5 tion. Finally, although evaluating clinical utility of a prediction model is
However, the role of this study was to inform implementation and not recommended and provides more value-based metrics than evaluating
substitute a prospective evaluation of clinical impact, in which these just predictive performance,8–10,14–17 more research is required to investi-
higher-value patient outcomes should be assessed before long-term adop- gate how well these metrics predict the actual impact of a model-based
tion.8 Second, decision analysis requires simplifying assumptions to be CDSS. Future studies can refine on decision analysis based on this retro-Journal of the American Medical Informatics Association, 2021, Vol. 28, No. 11 2377
active feedback, like including model-independent effects from behav- COMPETING INTERESTS
ioral economics–inspired cointerventions.48 None.
CONCLUSION REFERENCES
An evaluation of clinical utility, such as by using decision curve 1. Detering KM, Hancock AD, Reade MC, et al. The impact of advance care
analysis, is recommended after validating a prediction model be- planning on end of life care in elderly patients: randomised controlled
cause metrics of model predictiveness, such as the C-statistic, are not trial. BMJ 2010; 340: c1345. doi:10.1136/bmj.c1345
informative of clinical value. This is particularly important for mor- 2. Bernacki RE, Block SD; American College of Physicians High Value
tality prediction models having the use case of automatically Care Task Force. Communication about serious illness care goals: a re-
prompting a PEOLC intervention, like a GOC discussion. Decision- view and synthesis of best practices. JAMA Intern Med 2014; 174 (12):
analytic techniques to assess utility along patient-centered outcomes 1994–2003.
3. Huber MT, Highland JD, Krishnamoorthi VR, et al. Utilizing the elec-
are feasible for quality improvement teams. They can help discrimi-
Downloaded from https://academic.oup.com/jamia/article/28/11/2366/6362565 by guest on 03 November 2021
tronic health record to improve advance care planning: a systematic re-
nate value from hype, calibrate expectations, and provide valuable
view. Am J Hosp Palliat Care 2018; 35 (3): 532–41.
information before CDSS implementation. As an adjunct to model 4. Gill TM, Gahbauer EA, Han L, et al. The role of intervening hospital
validation, the routine evaluation of clinical utility could increase admissions on trajectories of disability in the last year of life: prospective
the value of automated predictive analytics implemented at the point cohort study of older people. BMJ 2015; 350: h2361.
of care. 5. Heyland DK, Barwich D, Pichora D, et al.; Canadian Researchers at the
End of Life Network (CARENET). Failure to engage hospitalized elderly
patients and their families in advance care planning. JAMA Intern Med
FUNDING 2013; 173 (9): 778–87.
6. Lund S, Richardson A, May C. Barriers to advance care planning at the
This study was supported by a clinician-investigator training grant (MR1-
end of life: an explanatory systematic review of implementation studies.
291226) funded jointly by the Fonds de Recherche du Quebec—Sante and the
PloS One 2015; 10 (2): e0116629.
Ministère de la Sante et des Services Sociaux (to RT) and a clinician-
7. Porter AS, Harman S, Lakin JR. Power and perils of prediction in pallia-
investigator grant (CC-253453) from the Fonds de Recherche du Quebec—
tive care. Lancet 2020; 395 (10225): 680–1.
Sante (to J-FE). The Fonds de Recherche du Quebec—Sante and the Ministère
8. Steyerberg E. Clinical Prediction Models: A Practical Approach to Develop-
de la Sante et des Services Sociaux had no role in the design and conduct of
ment, Validation, and Updating. 2nd ed. Cham, Switzerland: Springer;
the study; collection, management, analysis, and interpretation of the data;
2019.
preparation, review, or approval of the manuscript; and decision to submit
9. Kappen TH, van Klei WA, van Wolfswinkel L, et al. Evaluating the impact
the manuscript for publication .
of prediction models: lessons learned, challenges, and recommendations.
Diagn Progn Res 2018; 2: 11.
10. Sachs MC, Sjölander A, Gabriel EE. Aim for clinical utility, not just pre-
AUTHOR CONTRIBUTIONS
dictive accuracy. Epidemiology 2020; 31 (3): 359–64.
RT and J-FE were involved in conceptualization, funding acquisition, meth- 11. Sendak MP, Balu S, Schulman KA. Barriers to achieving economies of
odology, resources, validation, and writing (review and editing). RT was in- scale in analysis of EHR data. A cautionary tale. Appl Clin Inform 2017;
volved in data curation, formal analysis, software, visualization, and writing 8 (3): 826–31.
(original draft). 12. Sutton RT, Pincock D, Baumgart DC, et al. An overview of clinical deci-
sion support systems: benefits, risks, and strategies for success. NPJ Digit
Med 2020; 3: 114.
SUPPLEMENTARY MATERIAL 13. Futoma J, Simons M, Panch T, et al. The myth of generalisability in clini-
Supplementary material is available at Journal of the American Medical Infor- cal research and machine learning in health care. Lancet Digit Health
matics Association online. 2020; 2 (9): e489–92.
14. Hunink MGM, Weinstein MC, Wittenberg E, et al. Decision Making in
Health and Medicine: Integrating Evidence and Values. 2nd ed. Cam-
ACKNOWLEDGMENTS bridge: Cambridge University Press; 2014.
15. Vickers AJ, Calster BV, Steyerberg EW. Net benefit approaches to the
We thank Luc Lavoie, associate professor of computer science at the Uni-
evaluation of prediction models, molecular markers, and diagnostic tests.
versite de Sherbrooke, for guidance on data management. We thank Paul Far-
BMJ 2016; 352: i6.
and, MD, MSc, for having led the quality improvement effort that resulted in
16. Liu VX, Bates DW, Wiens J, et al. The number needed to benefit: estimat-
the migration of paper to electronic code status orders at the Centre Hospital-
ing the value of predictive analytics in healthcare. J Am Med Inform Assoc
ier Universitaire de Sherbrooke and initially suggesting the idea to investigate
2019; 26 (12): 1655–9.
automated mortality alerts to prompt GOC discussions.
17. Vickers AJ, Cronin AM. Traditional statistical methods for evaluating
prediction models are uninformative as to clinical value: towards a deci-
sion analytic framework. Semin Oncol 2010; 37 (1): 31–8.
DATA AVAILABILITY STATEMENT 18. Shah NH, Milstein A, Bagley PSC. Making machine learning models clini-
The hospitalization data underlying this article cannot be shared publicly due cally useful. JAMA 2019; 322 (14): 1351–2.
to regulations to protect patient privacy that are overseen by the Institutional 19. Adelson K, Lee DKK, Velji S, et al. Development of Imminent Mortality
Review Board. All prediction model specifications, decision-analytic model Predictor for Advanced Cancer (IMPAC), a tool to predict short-term
specifications and the observed exchange rate estimates with various sampling mortality in hospitalized patients with advanced cancer. J Oncol Pract
procedures are included in the article and the Supplementary Appendix. The 2018; 14 (3): e168–75.
source code for specific aspects of the study, like the data analysis or visualiza- 20. Jung K, Kashyap S, Avati A, et al. A framework for making predictive
tion source code in R or the 2-stage bootstrap source code in Cþþ, is available models useful in practice. J Am Med Inform Assoc 2020; 22 (6): 1149–58.
upon request to the corresponding author: ryeyan.taseen@usherbrooke.ca doi:10.1093/jamia/ocaa318.You can also read