Pervasive Label Errors in Test Sets Destabilize Machine Learning Benchmarks
←
→
Page content transcription
If your browser does not render page correctly, please read the page content below
Pervasive Label Errors in Test Sets
                                                       Destabilize Machine Learning Benchmarks

                                                         Curtis G. Northcutt∗                 Anish Athalye              Jonas Mueller
                                                       ChipBrain, MIT, Cleanlab               MIT, Cleanlab                  AWS
arXiv:2103.14749v4 [stat.ML] 7 Nov 2021

                                                                                          Abstract

                                                      We identify label errors in the test sets of 10 of the most commonly-used com-
                                                      puter vision, natural language, and audio datasets, and subsequently study the
                                                      potential for these label errors to affect benchmark results. Errors in test sets
                                                      are numerous and widespread: we estimate an average of at least 3.3% errors
                                                      across the 10 datasets, where for example label errors comprise at least 6% of
                                                      the ImageNet validation set. Putative label errors are identified using confident
                                                      learning algorithms and then human-validated via crowdsourcing (51% of the
                                                      algorithmically-flagged candidates are indeed erroneously labeled, on average
                                                      across the datasets). Traditionally, machine learning practitioners choose which
                                                      model to deploy based on test accuracy — our findings advise caution here, propos-
                                                      ing that judging models over correctly labeled test sets may be more useful, es-
                                                      pecially for noisy real-world datasets. Surprisingly, we find that lower capacity
                                                      models may be practically more useful than higher capacity models in real-world
                                                      datasets with high proportions of erroneously labeled data. For example, on Ima-
                                                      geNet with corrected labels: ResNet-18 outperforms ResNet-50 if the prevalence
                                                      of originally mislabeled test examples increases by just 6%. On CIFAR-10 with
                                                      corrected labels: VGG-11 outperforms VGG-19 if the prevalence of originally
                                                      mislabeled test examples increases by just 5%. Test set errors across the 10 datasets
                                                      can be viewed at https://labelerrors.com and all label errors can be reproduced
                                                      by https://github.com/cleanlab/label-errors.

                                          1       Introduction

                                          Large labeled datasets have been critical to the success of supervised machine learning across
                                          the board in domains such as image classification, sentiment analysis, and audio classification.
                                          Yet, the processes used to construct datasets often involve some degree of automatic labeling or
                                          crowd-sourcing, techniques which are inherently error-prone [39]. Even with controls for error
                                          correction [20, 49], errors can slip through. Prior work has considered the consequences of noisy
                                          labels, usually in the context of learning with noisy labels, and usually focused on noise in the train
                                          set. Some past research has concluded that label noise is not a major concern, because of techniques
                                          to learn with noisy labels [31, 35], and also because deep learning is believed to be naturally robust
                                          to label noise [17, 28, 38, 43].
                                          However, label errors in test sets are less-studied and have a different set of potential consequences.
                                          Whereas train set labels in a small number of machine learning datasets, e.g. in the ImageNet dataset,
                                          are well-known to contain errors [16, 33, 40], labeled data in test sets is often considered “correct” as
                                          long as it is drawn from the same distribution as the train set. This is a fallacy: machine learning test
                                          sets can, and do, contain errors, and these errors can destabilize ML benchmarks.
                                              ∗
                                                  Correspondence to: curtis@cleanlab.ai or cgn@csail.mit.edu.

                                          35th Conference on Neural Information Processing Systems (NeurIPS 2021) Track on Datasets and Benchmarks.
MNIST CIFAR-10 CIFAR-100 Caltech-256 ImageNet QuickDraw
correctable
given: 8 given: cat given: lobster given: dolphin given: white stork given: tiger
corrected: 9 corrected: frog corrected: crab corrected: kayak corrected: black stork corrected: eye
multi-label (N/A) (N/A)
given: hamster given: laptop given: mantis given: wristwatch
also: cup also: people also: fence also: hand
neither
given: 6 given: deer given: rose given: house-fly given: polar bear given: pineapple
alt: 1 alt: bird alt: apple alt: ladder alt: elephant alt: raccoon
non-agreement
given: 4 given: automobile given: dolphin given: yo-yo given: eel given: bandage
alt: 9 alt: airplane alt: ray alt: frisbee alt: flatworm alt: roller coaster
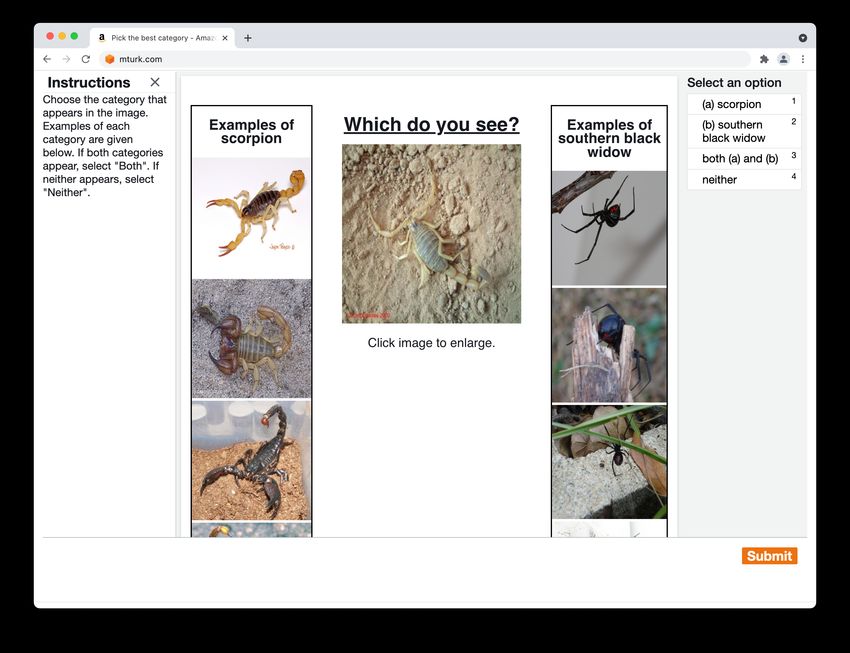
Figure 1: An example label error from each category (Section 4) for image datasets. The figure shows
given labels, human-validated corrected labels, also the second label for multi-class data points, and
CL-guessed alternatives. A gallery of label errors across all 10 datasets, including text and audio
datasets, is available at https://labelerrors.com.
Researchers rely on benchmark test datasets to evaluate and measure progress in the state-of-the-
art and to validate theoretical findings. If label errors occurred profusely, they could potentially
undermine the framework by which we measure progress in machine learning. Practitioners rely on
their own real-world datasets which are often more noisy than carefully-curated benchmark datasets.
Label errors in these test sets could potentially lead practitioners to incorrect conclusions about which
models actually perform best in the real world.
We present the first study that systematically characterizes label errors across 10 datasets commonly
used for benchmarking models in computer vision, natural language processing, and audio processing.
Unlike prior work on noisy labels, we do not experiment with synthetic noise but with naturally-
occurring errors. Rather than exploring a novel methodology for dealing with label errors, which has
been extensively studied in the literature [4], this paper aims to characterize the prevalence of label
errors in the test data of popular benchmarks used to measure ML progress and subsequently analyze
practical consequences of these errors, and in particular, their effects on model selection. Using
confident learning [33], we algorithmically identify putative label errors in test sets at scale, and we
validate these label errors through human evaluation, estimating a lower-bound of 3.3% errors on
average across the 10 datasets. We identify, for example, 2916 (6%) errors in the ImageNet validation
set (which is commonly used as a test set), and estimate over 5 million (10%) errors in QuickDraw.
Figure 1 shows examples of validated label errors for the image datasets in our study.
We use ImageNet and CIFAR-10 as case studies to understand the consequences of test set label errors
on benchmark stability. While there are numerous erroneous labels in these benchmarks’ test data, we
find that relative rankings of models in benchmarks are unaffected after removing or correcting these
label errors. However, we find that these benchmark results are unstable: higher-capacity models
(like NASNet) undesirably reflect the distribution of systematic label errors in their predictions to a
greater degree than models with fewer parameters (like ResNet-18), and this effect increases with
the prevalence of mislabeled test data. This is not traditional overfitting. Larger models are able to
2
generalize better to the given noisy labels in the test data, but this is problematic because these models
produce worse predictions than their lower-capacity counterparts when evaluated on the corrected
labels for originally-mislabeled test examples.
In real-world settings with high proportions of erroneously labeled data, lower capacity models may
thus be practically more useful than their higher capacity counterparts. For example, it may appear
NASNet is superior to ResNet-18 based on the test accuracy over originally given labels, but NASNet
is in fact worse than ResNet-18 based on the test accuracy over corrected labels. Since the latter form
of accuracy is what matters in practice, ResNet-18 should actually be deployed instead of NASNet
here — but this is unknowable without correcting the test data labels.
To evaluate how benchmarks of popular pre-trained models change, we incrementally increase the
noise prevalence by controlling for the proportion of correctable (but originally mislabeled) data
within the test dataset. This procedure allows us to determine, for a particular dataset, at what noise
prevalence benchmark rankings change. For example, on ImageNet with corrected labels: ResNet-18
outperforms ResNet-50 if the prevalence of originally mislabeled test examples increases by just 6%.
In summary, our contributions include:

      1. The discovery of pervasive label errors in test sets of 10 standard ML benchmarks
      2. Open-sourced resources to clean and correct each test set, in which a large fraction of the
         label errors have been corrected by humans
      3. An analysis of the implications of test set label errors on benchmarks, and the finding that
         higher-capacity models perform better on the subset of incorrectly-labeled test data in terms
         of their accuracy on the original labels (i.e., what one traditionally measures), but perform
         worse on this subset in terms of their accuracy on corrected labels (i.e., what one cares about
         in practice, but cannot measure without the corrected test data we provide)
      4. The discovery that merely slight increases in the test label error prevalence would cause
         model selection to favor the wrong model based on standard test accuracy benchmarks

Our findings imply ML practitioners might benefit from correcting test set labels to benchmark
how their models will perform in real-world deployment, and by using simpler/smaller models
in applications where labels for their datasets tend to be noisier than the labels in gold-standard
benchmark datasets. One way to ascertain whether a dataset is noisy enough to suffer from this effect
is to correct at least the test set labels, e.g. using our straightforward approach.

2   Background and related work
Experiments in learning with noisy labels [19, 31, 34, 42, 45] suffer a double-edged sword: either
synthetic noise must be added to clean training data to measure performance on a clean test set (at
the expense of modeling actual real-world label noise [18]), or a naturally noisy dataset is used
and accuracy is measured on a noisy test set. In the noisy WebVision dataset [24], accuracy on the
ImageNet validation data is often reported as a “clean” test set, but several studies [16, 33, 37, 44]
have shown the existence of label issues in ImageNet. Unlike these works, we focus exclusively on
existence and implications of label errors in the test set, and we extend our analysis to many types of
datasets. Although extensive prior work deals with label errors in the training set [4, 7], much less
work has been done to understand the implications of label errors in the test set.
Crowd-sourced curation of labels via multiple human workers [5, 36, 49] is a common method for
validating/correcting label issues in datasets, but it can be exorbitantly expensive for large datasets.
To circumvent this issue, we only validate subsets of datasets by first estimating which examples are
most likely to be mislabeled. To achieve this, we lean on a number of contributions in uncertainty
quantification for finding label errors based on prediction/label agreement via confusion matrices
[3, 15, 25, 48]; however, these approaches lack either robustness to class imbalance or theoretical
support for realistic settings with asymmetric, non-uniform noise (for instance, an image of a dog
might be more likely to be mislabeled a coyote than a car). For robustness to class imbalance and
theoretical support for exact uncertainty quantification, we use a model-agnostic framework, confident
learning (CL) [33], to estimate which labels are erroneous across diverse datasets. We choose the
CL framework for finding putative label errors because it was empirically found to outperform
several recent alternative label error identification methods [23, 33, 46]. Unlike prior work that only

                                                    3
models symmetric label noise [45], we quantify class-conditional label noise with CL, validating the
correctable nature of the label errors via crowdsourced workers. Human validation confirms the noise
in common benchmark datasets is indeed primarily systematic mislabeling, not just random noise or
lack of signal (e.g. images with fingers blocking the camera).

3          Identifying label errors in benchmark datasets

Here we summarize our algorithmic label error identification performed prior to crowd-sourced human
verification. An overview of each dataset and any modifications is detailed in Appendix A. Step-by-
step instructions to obtain each dataset and reproduce the label errors for each dataset are provided at
https://github.com/cleanlab/label-errors. Our code relies on the implementation of confident
learning open-sourced at https://github.com/cleanlab/cleanlab. The primary contribution of
this section is not in the methodology, which is covered extensively in Northcutt et al. [33], but in
its utilization as a filtering process to significantly (often as much as 90%) reduce the number of
examples requiring human validation in the next step.
To identify label errors in a test dataset with n examples and m classes, we first characterize label
noise in the dataset using the confident learning (CL) framework [33] to estimate Qỹ,y∗ , the m × m
discrete joint distribution of observed, noisy labels, ỹ, and unknown, true labels, y ∗ . Inherent in
Qỹ,y∗ is the assumption that noise is class-conditional [1], depending only on the latent true class,
not the data. This assumption is commonly used [9, 32, 42] because it is reasonable. For example, in
ImageNet, a tiger is more likely to be mislabeled cheetah than CD player.
The diagonal entry p̂(ỹ =i, y ∗ =i) of matrix Qỹ,y∗ P
                                                      is the probability that examples in class i are
correctly labeled. If the dataset is error-free, then i∈[m] p̂(ỹ =i, y ∗ =i) = 1. The fraction of label
errors is ρ = 1 − i∈[m] p̂(ỹ =i, y ∗ =i) and the number of label errors is ρ · n. To find label errors, we
                  P

choose the top ρ · n examples ordered by the normalized margin: p̂(ỹ =i; x) − maxj6=i p̂(ỹ =j; x) [47].
Table 1 shows the number of CL-guessed label errors for each test set in our study. CL estimation of
Qỹ,y∗ is summarized in Appendix C.
Computing out-of-sample predicted probabilities Estimating Qỹ,y∗ for CL noise characterization
requires two inputs for each dataset: (1) out-of-sample predicted probabilities P̂k,i (n×m matrix) and
(2) the test set labels ỹk . We observe the best results computing P̂k,i by pre-training on the train set,
then fine-tuning (all layers) on the test set using cross-validation to ensure P̂k,i is out-of-sample. If
pre-trained models are open-sourced (e.g. ImageNet), we use them instead of pre-training ourselves.
If the dataset did not have an explicit test set (e.g. QuickDraw and Amazon Reviews), we skip
pre-training and compute P̂k,i using cross-validation on the entire dataset. For all datasets, we try
common models that achieve reasonable accuracy with minimal hyper-parameter tuning and use the
model yielding the highest cross-validation accuracy, reported in Table 1.
Using this approach allows us to find label errors without manually checking the entire test set,
because CL identifies potential label errors automatically.

Table 1: Test set errors are prominent across common benchmark datasets. We observe that error rates
vary across datasets, from 0.15% (MNIST) to 10.12% (QuickDraw); unsurprisingly, simpler datasets,
datasets with more carefully designed labeling methodologies, and datasets with more careful human
curation generally had less error than datasets that used more automated data collection procedures.
                                                                                                                 Test Set Errors
            Dataset             Modality          Size                Model
                                                                                         CL guessed      MTurk checked validated    estimated   % error
    MNIST                       image             10,000       2-conv CNN                       100           100 (100%)       15           -     0.15
    CIFAR-10                    image             10,000       VGG                              275           275 (100%)       54           -     0.54
    CIFAR-100                   image             10,000       VGG                            2,235         2,235 (100%)      585           -     5.85
    Caltech-256†                image             29,780       Wide ResNet-50-2               2,360        2,360 (100%)       458           -     1.54
    ImageNet*                   image             50,000       ResNet-50                      5,440         5,440 (100%)    2,916           -     5.83
    QuickDraw†                  image         50,426,266       VGG                        6,825,383        2,500 (0.04%)    1870    5,105,386    10.12
    20news                      text               7,532       TFIDF + SGD                       93            93 (100%)       82           -     1.09
    IMDB                        text              25,000       FastText                       1,310         1,310 (100%)      725           -     2.90
    Amazon Reviews†             text           9,996,437       FastText                     533,249         1,000 (0.2%)      732     390,338     3.90
    AudioSet                    audio             20,371       VGG                              307           307 (100%)      275           -     1.35
    *
        Because the ImageNet test set labels are not publicly available, the ILSVRC 2012 validation set is used.
    †
        Because no explicit test set is provided, we study the entire dataset to ensure coverage of any train/test split.

                                                                                     4
Table 2: Mechanical Turk validation of CL-flagged errors and categorization of label issues.
                                                     Test Set Errors Categorization
                        Dataset
                                     non-errors errors non-agreement correctable multi-label neither
                    MNIST                   85   15                2         10           -       3
                    CIFAR-10               221   54               32         18           0       4
                    CIFAR-100             1650 585               210        318          20      37
                    Caltech-256           1902 458                99        221         115      23
                    ImageNet              2524 2916              598       1428         597     293
                    QuickDraw              630 1870              563       1047          20     240
                    20news                  11   82               43         22          12       5
                    IMDB                   585 725               552        173           -       -
                    Amazon Reviews         268 732               430        302           -       -
                    AudioSet                32 275                 -          -           -       -

4     Validating label errors with Mechanical Turk
We validated the algorithmically identified label errors with a Mechanical Turk (MTurk) study. For
two large datasets with a large number of errors (QuickDraw and Amazon Reviews), we checked a
random sample; for the rest, we checked all identified errors.
We presented workers with hypothesized errors and asked them whether they saw the (1) given
label, (2) the top CL-predicted label, (3) both labels, or (4) neither label in the example. To aid the
worker, the interface included high-confidence examples of the given class and the CL-predicted
class. Figure S1 in Appendix B shows a screenshot of the MTurk worker interface.
Each CL-flagged label error was independently presented to five workers. We consider the example
validated (an “error”) if fewer than three of the workers agree that the data point has the given label
(agreement threshold = 3 of 5) , otherwise we consider it to be a “non-error” (i.e. the original label
was correct). We further categorize the label errors, breaking them down into (1) “correctable”, where
a majority agree on the CL-predicted label; (2) “multi-label”, where a majority agree on both labels
appearing; (3) “neither”, where a majority agree on neither label appearing; and (4) “non-agreement”,
a catch-all category for when there is no majority. Table 2 summarizes the results, and Figure 1 shows
examples of validated label errors from image datasets.

4.1    Failure modes of confident learning

Figure 2: Difficult examples from various datasets where confident learning finds a potential label
error but human validation shows that there actually is no error. Example (a) is a cropped image of
part of an antiquated sewing machine; (b) is a viewpoint from inside an airplane, looking out at the
runway and grass with a partial view of the nose of the plane; (c) is an ambiguous shape which could
be a potato; (d) is likely a badly drawn “5”; (e) is a male whose exact age cannot be determined; and
(f) is a straw used as a pole within a miniature replica of a village.

Confident learning sometimes flags data points that are not actually erroneous. By visually inspecting
putative label errors, we identified certain previously unexamined failure modes of confident learning
[33]. Appendix D provides a mathematical description of the conditions under which these failure
modes occur. Figure 2 shows uniquely challenging examples, with excessively erroneous p̂(ỹ =j; x),
where failure mode cases potentially occur. The sewing machine in Figure 2(a), for example, exhibits
a “part versus whole” issue where the image has been cropped to only show a small portion of the
object. The airplane in Figure 2(b) is an unusual example of the class, showing the plane from the
perspective of the pilot looking out of the front cockpit window.

                                                          5
Figure 2 clarifies that our corrected test set labels are not 100% perfect. Even with a stringent 5
of 5 agreement threshold where all human reviewers agreed on a label correction, the “corrected”
label is not always actually correct. Fortunately, these failure mode cases are rare. Inspection of
https://labelerrors.com shows that the majority of the labels we corrected are reasonable. Our
corrected test sets, while imperfect in these cases, are improved from the original test sets.

5     Implications of label errors in test data
Finally, we consider how pervasive test set label errors may affect ML practitioners in real-world
applications. To clarify the discussion, we first introduce some useful terminology.
Definition 1 (original accuracy, Ã). The accuracy of a model’s predicted labels over a given dataset,
computed with respect to the original labels present in the dataset. Measuring à over the test set is
the standard way practitioners evaluate their models today.
Definition 2 (corrected accuracy, A∗ ). The accuracy of a model’s predicted labels, computed over a
modified dataset in which previously identified erroneous labels have been corrected by humans to
the true class when possible and removed when not. Measuring A∗ over the test set is preferable to
à for evaluating models because A∗ better reflects performance in real-world applications.

The human labelers referenced throughout this section are the workers from our MTurk study in
Section 4. In the following definitions, \ denotes a set difference and D denotes the full test dataset.
Definition 3 (benign set, B). The subset of benign test examples, comprising data that CL did not
flag as likely label errors and data that was flagged but for which human reviewers agreed that the
original label should be kept. (B ⊂ D)
Definition 4 (unknown-label set, U). The subset of CL-flagged test examples for which human
labelers could not agree on a single correct label. This includes examples where human reviewers
agreed that multiple classes or none of the classes are appropriate. (U ⊂ D\B)
Definition 5 (pruned set, P). The remaining test data after removing U from D. (P = D\U)
Definition 6 (correctable set, C). The subset of CL-flagged examples for which human-validation
reached consensus on a different label than the originally given label. (C = P\B)
Definition 7 (noise prevalence, N ). The percentage of the pruned set comprised of the correctable
set, i.e. what fraction of data received the wrong label in the original benchmark when a clear
alternative ground-truth label should have been assigned (disregarding any data for which humans
                                                                                    |C|
failed to find a clear alternative). Here we operationalize noise prevalence as N = |P| .

These definitions imply B, C, U are disjoint with D = B ∪ C ∪ U and also P = B ∪ C. In subsequent
experiments, we report corrected test accuracy over P after correcting all of the labels in C ⊂ P.
We ignore the unknown-label set U (and do not include those examples in our estimate of noise
prevalence) because it is unclear how to measure corrected accuracy for examples whose true
underlying label remains ambiguous. Thus the noise prevalence reported throughout this section
differs from the fraction of label errors originally found in each of the test sets.
A major issue in ML today is that one only sees the original test accuracy in practice, whereas one
would prefer to base modeling decisions on the corrected test accuracy instead. Our subsequent
discussion highlights the potential implications of this mismatch. What are the consequences of test
set label errors? Figure 3 compares performance on the ImageNet validation set, commonly used in
place of the test set, of 34 pre-trained models from the PyTorch and Keras repositories (throughout,
we use provided checkpoints of models that have been fit to the original training set). Figure 3a
confirms the observations of Recht et al. [37]; benchmark conclusions are largely unchanged by using
a corrected test set, i.e. in our case by removing errors.

5.1   Benchmarking on the correctable set

However, we find a surprising result upon closer examination of the models’ performance on the
correctable set C. When evaluating models only on these originally-mislabeled test data, models
which perform best on the original (incorrect) labels perform the worst on the corrected labels. For
example, ResNet-18 [14] significantly outperforms NASNet [50] in terms of corrected accuracy

                                                   6
Top-1 Acc on original labels
Top-1 Acc on Correctable Set
Top-1 Acc on Correctable Set
ResNet-18 VGG-11
Nasnet Agreement
Agreement Threshold 60%
(corrected labels)
(corrected labels)
(errors removed)
Threshold
80% 5 of 5 ResNet-34 ResNet-18
5 of 5 80% DenseNet121
ResNet-18 VGG-13 DenseNet-169
ResNet-50 VGG-16
70% Nasnet GoogleNet
40% Agreement VGG-19
Threshold Inception-v3
70%
60% 3 of 5 MobileNet-v2
AlexNet
60% 70% 80% 5% 10% 15% 30% 40% 50%
Top-1 Acc on original labels Top-1 Acc on Correctable Set (original labels) Top-1 Acc on Correctable Set (original labels)
(a) ImageNet val set acc. (b) ImageNet correctable set acc. (c) CIFAR-10 correctable set acc.
Figure 3: Benchmark ranking comparison of 34 pre-trained ImageNet models and 13 pre-trained
CIFAR-10 models (details in Tables S2 and S1 and Figure S3 in the Appendix). Benchmarks are
unchanged by removing label errors (a), but change drastically (b) on the Correctable set with original
(erroneous) labels versus corrected labels, e.g. NASNet: 1/34 → 29/34, ResNet-18: 34/34 → 1/34.
over C, despite exhibiting far worse original test accuracy. The change in ranking can be dramatic:
NASNet-large drops from ranking 1/34 → 29/34, Xception drops from ranking 2/34 → 24/34,
ResNet-18 increases from ranking 34/34 → 1/34, and ResNet-50 increases from ranking 20/24 →
2/24 (see Table S1 in the Appendix). We verified that the same trend occurs independently across
13 pre-trained CIFAR-10 models (Figure 3c), e.g. VGG-11 significantly outperforms VGG-19 [41]
in terms of corrected accuracy over C. Note that all numbers reported here are over subsets of the
held-out test data, so this is not overfitting in the classical sense.
This phenomenon, depicted in Figures 3b and 3c, may indicate two key insights: (1) lower-capacity
models provide unexpected regularization benefits and are more resistant to learning the asym-
metric distribution of noisy labels, (2) over time, the more recent (larger) models have architec-
ture/hyperparameter decisions that were made on the basis of the (original) test accuracy. Learning
to capture systematic patterns of label error in their predictions allows these models to improve
their original test accuracy, but this is not the sort of progress ML research should aim to achieve.
Harutyunyan et al. [13] and Arpit et al. [2] have previously analyzed phenomena similar to (1), and
here we demonstrate that this issue really does occur for the models/datasets widely used in current
practice. (2) is an undesirable form of overfitting, albeit not in the classical sense (as the original test
accuracy can further improve through better modeling of label errors), but rather overfitting to the
specific benchmark (and quirks of the original label annotators) such that accuracy improvements for
erroneous labels may not translate to superior performance in a deployed ML system.
This phenomenon has important practical implications for real-world datasets with greater noise
prevalence than the highly curated benchmark data studied here. In these relatively clean benchmark
datasets, the noise prevalence is an underestimate as we could only verify a subset of our candidate
label errors rather than all test labels, and thus the potential gap between original vs. corrected test
accuracy over P is limited for these particular benchmarks. However, this gap increases proportionally
for data with more (correctable) label errors in the test set, i.e. as N increases.
5.2 Benchmark instability
To investigate how benchmarks of popular models change with varying proportions of label errors in
test sets, we randomly and incrementally remove correctly-labeled examples, one at a time, until only
the original set of mislabeled test data (with corrected labels) is left. We create alternate versions
(subsets) of the pruned benchmark test data P, in which we additionally randomly omit some fraction,
x, of B (the non-CL-flagged test examples). This effectively increases the proportion of the resulting
test dataset comprised of the correctable set C, and reflects how test sets function in applications with
greater prevalence of label errors. If we remove a fraction x of benign test examples (in B) from P,
|C|
we estimate the noise prevalence in the new (reduced) test dataset to be N = |P|−x|B| . By varying
x from 0 to 1, we can simulate any noise prevalence ranging from |C|/|P| to 1. We operationalize
averaging over all choices of removal by linearly interpolating from accuracies over the corrected test
set (P, with corrected labels for the subset C) to accuracies over the erroneously labeled subset (C,
with corrected labels). Over these corrected test sets, we evaluate popular pre-trained models (again
using provided checkpoints of models that have been fit to the original training set).
7Imagenet Top-1 Test Accuracy Imagenet Top-1 Test Accuracy
80%
(original labels)
60%
Platform & Model
————————
Keras 2.2.4 densenet169
40% Keras 2.2.4 nasnetlarge
13%
Keras 2.2.4 resnet50
2.9% 25.0% 50.0% PyTorch 1.0 alexnet
PyTorch 1.0 resnet18
(corrected labels)
80% PyTorch 1.0 resnet50
PyTorch 1.0 vgg11
70%
31%
43%
60%
9%
2.9% 25.0% 50.0%
Noise Prevalence (% of test set with correctable labels)
* Noise prevalance of 50% indicates the correctable set comprises half of the test set.
Figure 4: ImageNet top-1 original accuracy (top) and corrected accuracy (bottom) vs noise prevalence
(agreement threshold = 3). Vertical lines indicate noise levels at which the ranking of two models
changes (in terms of original/corrected accuracy). The left-most point (N = 2.9%) on the x-axis is
|C|/|P|, i.e. the (rounded) estimated noise prevalence of the pruned set, P. The leftmost vertical
dotted line in the bottom panel is read, “The ResNet-50 and ResNet-18 benchmarks cross at noise
prevalence N = 9%,” implying ResNet-18 outperforms ResNet-50 when N increases by around 6%
relative to the original pruned test data (N = 2.9% originally, c.f. Table 2).
CIFAR-10 Top-1 Test Accuracy CIFAR-10 Top-1 Test Accuracy
90%
(original labels)
80%
70% Platform & Model
————————
PyTorch 1.0 vgg11
2%
60%
0.2% 25.0% 50.0% PyTorch 1.0 vgg13
PyTorch 1.0 vgg16
PyTorch 1.0 vgg19
(corrected labels)
90%
80%
70%
12%
6%
7%
0.2% 25.0% 50.0%
Noise Prevalence (% of test set with corrected labels)
* Noise prevalance of 50% indicates the correctable set comprises half of the test set.
Figure 5: CIFAR-10 top-1 original accuracy (top panel) and corrected accuracy (bottom panel) vs
Noise Prevalence (agreement threshold = 3). For additional details, see the caption of Figure 4.
For a given model M, its resulting accuracy (as a function of x) over the reduced test data is given
by A(x; M) = AC (M)·|C|+(1−x)·A
|C|+(1−x)·|B|
B (M)·|B|
, where AC (M) and AB (M) denote the (original or
corrected) accuracy over the correctable set and benign set, respectively (accuracy before removing
any examples). Here AB = A∗B = ÃB because no erroneous labels were identified in B. The
expectation is taken over which fraction x of examples are randomly removed from B to produce the
reduced test set: the resulting expected accuracy, A(x; M), is depicted on the y-axis of Figures 4-5.
As our removal of test examples was random from the non-mislabeled set, we expect this reduced test
data is representative of test sets that would be used in applications with a similarly greater prevalence
8of label errors. Note that we ignore non-correctable data with unknown labels (U) throughout this
analysis, as it is unclear how to report a better version of the accuracy for such ill-specified examples.
Over alternative (reduced) test sets created by imposing increasing degrees of noise prevalence in
ImageNet/CIFAR-10, Figures 4-5 depict the resulting original (erroneous) test set accuracy and
corrected accuracy of the models, expected on each alternative test set. For a given test set (i.e. point
along the x-axis of these plots), the vertical ordering of the lines indicates how models would be
favored based on original accuracy or corrected accuracy over this test set. Unsurprisingly, we see that
more flexible/recent architectures tend to be favored on the basis of original accuracy, regardless of
which test set (of varying noise prevalence) is considered. This aligns with conventional expectations
that powerful models like NASNet will outperform simpler models like ResNet-18. However, if we
shift our focus to the corrected accuracy (i.e. what actually matters in practice), it is no longer the
case that more powerful models are reliably better than their simpler counterparts: the performance
strongly depends on the degree of noise prevalence in the test data. For datasets where label errors
are common, a practitioner is more likely to select a model (based on original accuracy) that is not
actually the best model (in terms of corrected accuracy) to deploy.
Finally, we note that this analysis only presents a loose lower bound on the magnitude of these issues
due to unaccounted for label errors in the non-CL-flagged data (see Section 6). We only identified
a subset of the actual correctable set as we are limited to human-verifiable label corrections for a
subset of data candidates (algorithmically prioritized via confident learning). Because the actual
correctable sets are likely larger, our noise prevalence estimates are optimistic in favor of higher
capacity models. Thus, the true gap between corrected vs. original accuracy may be larger and of
greater practical significance, even for the gold-standard benchmark datasets considered here. For
many application-specific datasets collected by ML practitioners, the noise prevalence will be greater
than the numbers presented here: thus, it is imperative to be cognizant of the distinction between
corrected vs. original accuracy, and to utilize careful data curation practices, perhaps by allocating
more of an annotation budget to ensure higher quality labels in the test data.
6 Expert review of CL-flagged and non-CL-flagged label errors in ImageNet
Up to this point, we have only evaluated the subsets of the datasets flagged by CL: how do we
know that CL-flagged examples are indeed more erroneous than a random subset of a dataset? How
many label errors are missed in the non-CL-flagged data? And how reliable are MTurk workers
in comparison to expert reviewers? In this section, we address these questions by conducting an
additional expert review of both CL-flagged and non-CL-flagged examples in the ImageNet val set.
The expert review was conducted in two phases (details in Appendix G). In the first phase, experts
reviewed 1 randomly-selected CL-flagged example and 1 randomly-selected non-CL-flagged example
from each of the 1,000 ImageNet classes (66 classes had no CL-flagged example, i.e. 934 + 1,000
= 1934 images were evaluated in total). Given a similar interface as MTurk workers, the expert
reviewers selected one choice from: (1) the given label, (2) the top-most predicted label that differs
from the given label, (3) “both”, and (4) “neither”. Experts researched any unfamiliar classes by
looking up related images and taxonomy information online, spending on average 13x more time per
label than MTurk workers. Each image was reviewed by at least two experts, and experts agreed on
decisions for 77% of the images. In the second phase, all experts jointly revisited the remaining 23%
where there was disagreement and came to a consensus on a single choice.
Table 3 reveals that the set of CL-flagged examples has significantly higher proportions of every type
of label issue than the set of non-CL-flagged examples. An image flagged by CL was 2.6x as likely
to be erroneously labeled than an non-CL-flagged image. Given a limited budget for human review,
we thus recommend using CL to prioritize examples when verifying the labels in a large dataset.
Comparing CL (expert) to CL (MTurk) in Table 3 indicates that for CL-flagged examples, MTurk
workers favored correcting labels in cases where experts agreed neither label was appropriate. For
this analysis, we only consider the subset of MTurk reviewed images that overlaps with the 1,934
expert reviewed images. This may be attributed to experts knowing a better choice than the two
label choices presented in the task (c.f. Figure S2). Nonetheless the MTurk results overall agree with
those from our expert review. This validates our overall approach of using CL followed by MTurk
to characterize label errors, and demonstrates that a well-designed interface (Figure S1) suffices for
non-expert workers to provide high-quality label verification of datasets.
9Table 3: Percentages of label errors identified by experts vs. MTurk workers in CL-flagged examples
and random non-CL-flagged examples from ImageNet. Only experts reviewed non-CL examples.
The first two rows are computed over the same subset of images. The last column lists average time
spent reviewing each image. Percentages are row-normalized, with raw counts provided in Table S3.
non-errors errors correctable multi-label neither Avg. time spent
CL (MTurk) 57.9% 42.2% 24.7% 11.1% 6.4% 5 seconds
CL (expert) 58.7% 41.4% 17.7% 13.1% 10.6% 67 seconds
non-CL (expert) 84.0% 16.0% 3.2% 9.1% 3.7% 67 seconds
We further estimate that the analysis in previous sections missed around 14% of the label errors
in ImageNet because 89% of images were not flagged by CL and Table 3 indicates around 16%
of these were mislabeled. By including the additional 14% error found from the 9x larger set of
non-CL-flagged examples, we can more accurately estimate that the ImageNet validation set contains
closer to 20% label errors (up from the 6% reported in Table 1). This roughly indicates how much
more severe the issue of label errors actually is compared to what we reported in Sections 4 and 5.
7 Discussion
This paper demonstrates that label errors are ubiquitous in the test sets of many popular benchmarks
used to gauge progress in machine learning. We hypothesize that this has not been previously
discovered and publicized at such scale due to various challenges. Firstly, human verification of all
labels can be quite costly, which we circumvented here by using CL algorithms to filter automatically
for likely label errors prior to human verification. Secondly, working with 10 differently formatted
datasets was nontrivial, with some exhibiting peculiar issues upon close inspection (despite being
standard benchmarks). For example, IMDB, QuickDraw, and Caltech-256 lack a global index making
it difficult to map model outputs to corrected test examples on different systems. We provide index
files in our repository1 to address this. Furthermore, Caltech-256 contains several duplicate images,
of which which we found no previous mention. Lastly, ImageNet contains duplicate class labels, e.g.
“maillot” (638 & 639) and “crane” (134 & 517) [33, 44].
Traditionally, ML practitioners choose which model to deploy based on test accuracy — our findings
advise caution here. Instead, judging models over correctly labeled test sets may be important,
especially for real-world datasets that are likely noisier than these popular benchmarks. Small
increases in the prevalence of mislabeled test data can destabilize ML benchmarks, indicating that low-
capacity models may actually outperform high-capacity models in noisy real-world applications, even
if their measured performance on the original test data appears worse. We recommend considering the
distinction between corrected vs. original test accuracy and curating datasets to maximize high-quality
test labels, even if budget constraints only allow for lower-quality training labels. This paper shares
new findings about pervasive label errors in test sets and their effects on benchmark stability, but it
does not address whether the apparent overfitting of high-capacity models versus low-capacity models
is due to overfitting to train set noise, overfitting to validation set noise during hyper-parameter
tuning, or heightened sensitivity to train/test label distribution shift that occurs when test labels are
corrected. An intuitive hypothesis is that high-capacity models more closely fit all statistical patterns
present in the data, including those patterns related to systematic label errors that models with more
limited capacity are less capable of closely approximating. A rigorous analysis to disambiguate
and understand the contribution of each of these causes and their effects on benchmarking stability
is a natural next step, which we leave for future work. How to best allocate a given human label
verification budget between training and test data also remains an open question.
Acknowledgments
This work was supported in part by funding from the MIT-IBM Watson AI Lab. We thank Jessy Lin
for her contributions to early stages of this research, and we thank Wei Jing Lok for his contributions
to the ImageNet expert labeling experiments.
1
https://github.com/cleanlab/label-errors#how-to-download-prepare-and-index-the-datasets
10References
[1] D. Angluin and P. Laird. Learning from noisy examples. Machine Learning, 2(4):343–370,
1988.
[2] D. Arpit, S. Jastrz˛ebski, N. Ballas, D. Krueger, E. Bengio, M. S. Kanwal, T. Maharaj, A. Fischer,
A. Courville, Y. Bengio, et al. A closer look at memorization in deep networks. In International
Conference on Machine Learning, pages 233–242. Proceedings of Machine Learning Research
(PMLR), 2017.
[3] P. Chen, B. B. Liao, G. Chen, and S. Zhang. Understanding and utilizing deep neural networks
trained with noisy labels. In International Conference on Machine Learning (ICML), 2019.
[4] F. R. Cordeiro and G. Carneiro. A survey on deep learning with noisy labels: How to train your
model when you cannot trust on the annotations? In Conference on Graphics, Patterns and
Images (SIBGRAPI), pages 9–16, 2020.
[5] A. P. Dawid and A. M. Skene. Maximum likelihood estimation of observer error-rates using
the em algorithm. Journal of the Royal Statistical Society: Series C (Applied Statistics), 28(1):
20–28, 1979.
[6] J. Deng, W. Dong, R. Socher, L.-J. Li, K. Li, and L. Fei-Fei. ImageNet: A Large-Scale
Hierarchical Image Database. In Conference on Computer Vision and Pattern Recognition
(CVPR), 2009.
[7] B. Frénay and M. Verleysen. Classification in the presence of label noise: A survey. IEEE
Transactions on Neural Networks and Learning Systems, 25(5):845–869, 2014. ISSN 21622388.
doi: 10.1109/TNNLS.2013.2292894.
[8] J. F. Gemmeke, D. P. W. Ellis, D. Freedman, A. Jansen, W. Lawrence, R. C. Moore, M. Plakal,
and M. Ritter. Audio set: An ontology and human-labeled dataset for audio events. In IEEE
International Conference on Acoustics, Speech, and Signal Processing (ICASSP), New Orleans,
LA, 2017.
[9] J. Goldberger and E. Ben-Reuven. Training deep neural-networks using a noise adaptation layer.
In International Conference on Learning Representations (ICLR), 2017.
[10] G. Griffin, A. Holub, and P. Perona. Caltech-256 object category dataset. Technical Report 7694,
California Institute of Technology, 2007. URL http://authors.library.caltech.edu/7694.
[11] P. J. Grother. Nist special database 19 handprinted forms and characters database. National
Institute of Standards and Technology, 1995.
[12] D. Ha and D. Eck. A neural representation of sketch drawings. arXiv preprint arXiv:1704.03477,
2017.
[13] H. Harutyunyan, K. Reing, G. Ver Steeg, and A. Galstyan. Improving generalization by
controlling label-noise information in neural network weights. In International Conference
on Machine Learning (ICML), pages 4071–4081. Proceedings of Machine Learning Research
(PMLR), 2020.
[14] K. He, X. Zhang, S. Ren, and J. Sun. Deep residual learning for image recognition. In
Conference on Computer Vision and Pattern Recognition (CVPR), pages 770–778, 2016.
[15] D. Hendrycks, M. Mazeika, D. Wilson, and K. Gimpel. Using trusted data to train deep networks
on labels corrupted by severe noise. In Conference on Neural Information Processing Systems
(NeurIPS), 2018.
[16] S. Hooker, A. Courville, Y. Dauphin, and A. Frome. Selective brain damage: Measuring the
disparate impact of model pruning. arXiv preprint arXiv:1911.05248, 2019.
[17] W. R. Huang, Z. Emam, M. Goldblum, L. Fowl, J. K. Terry, F. Huang, and T. Goldstein.
Understanding generalization through visualizations. arXiv preprint arXiv:1906.03291, 2019.
11[18] L. Jiang, D. Huang, M. Liu, and W. Yang. Beyond synthetic noise: Deep learning on controlled
noisy labels. In International Conference on Machine Learning (ICML), volume 119 of
Proceedings of Machine Learning Research (PMLR), pages 4804–4815. Proceedings of Machine
Learning Research (PMLR), 13–18 Jul 2020. URL http://proceedings.mlr.press/v119/
jiang20c.html.
[19] I. Jindal, M. Nokleby, and X. Chen. Learning deep networks from noisy labels with dropout
regularization. In International Conference on Data Mining (ICDM), pages 967–972, Dec.
2016. doi: 10.1109/ICDM.2016.0121.
[20] J. Kremer, F. Sha, and C. Igel. Robust active label correction. In Proceedings of Machine
Learning Research (PMLR), volume 84 of Proceedings of Machine Learning Research, pages
308–316, Playa Blanca, Lanzarote, Canary Islands, 09–11 Apr 2018. Proceedings of Machine
Learning Research (PMLR). URL http://proceedings.mlr.press/v84/kremer18a.html.
[21] A. Krizhevsky and G. Hinton. Learning multiple layers of features from tiny images. Master’s
thesis, Department of Computer Science, University of Toronto, 2009. URL http://www.cs.
toronto.edu/~kriz/cifar.html.
[22] Y. Lecun, L. Bottou, Y. Bengio, and P. Haffner. Gradient-based learning applied to document
recognition. In Proceedings of the IEEE, pages 2278–2324, 1998.
[23] P. Li, X. Rao, J. Blase, Y. Zhang, X. Chu, and C. Zhang. CleanML: a study for evaluating the
impact of data cleaning on ml classification tasks. In IEEE International Conference on Data
Engineering, 2021.
[24] W. Li, L. Wang, W. Li, E. Agustsson, and L. Van Gool. Webvision database: Visual learning
and understanding from web data. arXiv preprint arXiv:1708.02862, 2017.
[25] Z. Lipton, Y.-X. Wang, and A. Smola. Detecting and correcting for label shift with black box
predictors. In International Conference on Machine Learning (ICML), 2018.
[26] List of Datasets for Machine Learning Research. List of datasets for machine learning research
— Wikipedia, the free encyclopedia. https://en.wikipedia.org/wiki/List_of_datasets_
for_machine-learning_research, 2018. [Online; accessed 22-October-2018].
[27] A. L. Maas, R. E. Daly, P. T. Pham, D. Huang, A. Y. Ng, and C. Potts. Learning word
vectors for sentiment analysis. In Annual Conference of the Association for Computational
Linguistics (ACL), pages 142–150, Portland, Oregon, USA, June 2011. Annual Conference of the
Association for Computational Linguistics (ACL). URL http://www.aclweb.org/anthology/
P11-1015.
[28] D. Mahajan, R. Girshick, V. Ramanathan, K. He, M. Paluri, Y. Li, A. Bharambe, and L. Van
Der Maaten. Exploring the limits of weakly supervised pretraining. European Conference on
Computer Vision (ECCV), pages 181–196, 2018.
[29] J. McAuley, C. Targett, Q. Shi, and A. van den Hengel. Image-based recommendations on
styles and substitutes. In Special Interest Group on Information Retrieval (SIGIR), pages
43–52. ACM, 2015. ISBN 978-1-4503-3621-5. doi: 10.1145/2766462.2767755. URL http:
//doi.acm.org/10.1145/2766462.2767755.
[30] T. Mitchell. Twenty newsgroups dataset. https://archive.ics.uci.edu/ml/datasets/
Twenty+Newsgroups, 1999.
[31] N. Natarajan, I. S. Dhillon, P. K. Ravikumar, and A. Tewari. Learning with noisy labels. In
Conference on Neural Information Processing Systems (NeurIPS), pages 1196–1204, 2013.
URL http://papers.nips.cc/paper/5073-learning-with-noisy-labels.pdf.
[32] C. G. Northcutt, T. Wu, and I. L. Chuang. Learning with confident examples: Rank pruning for
robust classification with noisy labels. In Conference on Uncertainty in Artificial Intelligence
(UAI), 2017.
[33] C. G. Northcutt, L. Jiang, and I. Chuang. Confident learning: Estimating uncertainty in dataset
labels. Journal of Artificial Intelligence Research, 70:1373–1411, 2021.
12[34] G. Patrini, F. Nielsen, R. Nock, and M. Carioni. Loss factorization, weakly supervised learning
and label noise robustness. In International Conference on Machine Learning (ICML), pages
708–717, 2016.
[35] G. Patrini, A. Rozza, A. Krishna Menon, R. Nock, and L. Qu. Making deep neural networks
robust to label noise: A loss correction approach. In Conference on Computer Vision and
Pattern Recognition (CVPR), 2017.
[36] A. J. Ratner, C. M. De Sa, S. Wu, D. Selsam, and C. Ré. Data programming:
Creating large training sets, quickly. In Conference on Neural Information Process-
ing Systems (NeurIPS), pages 3567–3575, 2016. URL http://papers.nips.cc/paper/
6523-data-programming-creating-large-training-sets-quickly.pdf.
[37] B. Recht, R. Roelofs, L. Schmidt, and V. Shankar. Do imagenet classifiers generalize to
imagenet? In International Conference on Machine Learning (ICML), pages 5389–5400, 2019.
[38] D. Rolnick, A. Veit, S. Belongie, and N. Shavit. Deep learning is robust to massive label noise.
arXiv preprint arXiv:1705.10694, 2017.
[39] N. Sambasivan, S. Kapania, H. Highfill, D. Akrong, P. Paritosh, and L. M. Aroyo. "Everyone
wants to do the model work, not the data work": Data cascades in high-stakes ai. In Human
Factors in Computing Systems (CHI), 2021.
[40] V. Shankar, R. Roelofs, H. Mania, A. Fang, B. Recht, and L. Schmidt. Evaluating machine
accuracy on ImageNet. In International Conference on Machine Learning (ICML), volume
119 of Proceedings of Machine Learning Research, pages 8634–8644. Proceedings of Machine
Learning Research (PMLR), 13–18 Jul 2020.
[41] K. Simonyan and A. Zisserman. Very deep convolutional networks for large-scale image
recognition. arXiv preprint arXiv:1409.1556, 2014.
[42] S. Sukhbaatar, J. Bruna, M. Paluri, L. Bourdev, and R. Fergus. Training convolutional networks
with noisy labels. In International Conference on Learning Representations (ICLR), pages
1–11, 2015. ISBN 9781611970685. doi: 10.1051/0004-6361/201527329. URL http://arxiv.
org/abs/1406.2080.
[43] C. Sun, A. Shrivastava, S. Singh, and A. Gupta. Revisiting unreasonable effectiveness of data in
deep learning era. In International Conference on Computer Vision (ICCV), Oct 2017.
[44] D. Tsipras, S. Santurkar, L. Engstrom, A. Ilyas, and A. Madry. From imagenet to image classi-
fication: Contextualizing progress on benchmarks. In International Conference on Machine
Learning, pages 9625–9635. Proceedings of Machine Learning Research (PMLR), 2020.
[45] B. Van Rooyen, A. Menon, and R. C. Williamson. Learning with symmetric label
noise: The importance of being unhinged. In Conference on Neural Information Pro-
cessing Systems (NeurIPS), pages 10–18, 2015. URL http://papers.nips.cc/paper/
5941-learning-with-symmetric-label-noise-the-importance-of-being-unhinged.
[46] J. Wang, Y. Liu, and C. Levy. Fair classification with group-dependent label noise. In Proceed-
ings of the ACM Conference on Fairness, Accountability, and Transparency, 2021.
[47] C. Wei, J. D. Lee, Q. Liu, and T. Ma. On the margin theory of feedforward neural networks.
Computing Research Repository (CoRR), 2018. URL http://arxiv.org/abs/1810.05369.
[48] Y. Xu, P. Cao, Y. Kong, and Y. Wang. L_dmi: A novel information-theoretic loss function
for training deep nets robust to label noise. In Conference on Neural Information Processing
Systems (NeurIPS), pages 6225–6236, 2019.
[49] J. Zhang, V. S. Sheng, T. Li, and X. Wu. Improving crowdsourced label quality using noise
correction. IEEE Transactions on Neural Networks and Learning Systems, 29(5):1675–1688,
2017.
[50] B. Zoph, V. Vasudevan, J. Shlens, and Q. V. Le. Learning transferable architectures for scalable
image recognition. In Conference on Computer Vision and Pattern Recognition (CVPR), pages
8697–8710, 2018.
13Appendix: Pervasive Label Errors in Test Sets
Destabilize Machine Learning Benchmarks
A Datasets
For our study, we select 10 of the most-cited, open-source datasets created in the last 20 years from the
Wikipedia List of ML Research Datasets [26], with preference for diversity across computer vision,
NLP, sentiment analysis, and audio modalities. Citation counts were obtained via the Microsoft
Cognitive API. In total, we evaluate six visual datasets: MNIST, CIFAR-10, CIFAR-100, Caltech-256,
ImageNet, and QuickDraw; three text datasets: 20news, IMDB, and Amazon Reviews; and one audio
dataset: AudioSet.
A.1 Dataset details
For each of the datasets we investigate, we summarize the original data collection and labeling
procedure as they pertain to potential label errors.
MNIST [22]. MNIST is a database of binary images of handwritten digits. The dataset was
constructed from Handwriting Sample Forms distributed to Census Bureau employees and high
school students; the ground-truth labels were determined by matching digits to the instructions of the
task to copy a particular set of digits [11]. Label errors may arise from failure to follow instructions
or from handwriting ambiguities.
CIFAR-10 / CIFAR-100 [21]. The CIFAR-10 and CIFAR-100 datasets are collections of small
32 × 32 images and labels from a set of 10 or 100 classes, respectively. The images were collected
by searching the internet for the class label. Human labelers were instructed to select images that
matched their class label (query term) by filtering out mislabeled images. Images were intended to
only have one prominent instance of the object, but could be partially occluded as long as it was
identifiable to the labeler.
Caltech-256 [10]. Caltech-256 is a database of images sorted into 256 classes, plus an extra class
called “clutter”. Images were scraped from image search engines. Four human labelers were
instructed to rate the images into “good,” “bad,” and “not applicable,” eliminating the images that
were confusing, occluded, cluttered, artistic, or not an example of the object category from the dataset.
Because no explicit test set is provided, we study label errors in the entire dataset to ensure coverage
of any test set split used by practitioners. Modifications: In our study, we ignore data with the
ambiguous “clutter” label (class 257) and consider only the images labeled class 1 to class 256.
ImageNet [6]. ImageNet is a database of images belonging to one of 1,000 classes. Images were
scraped by querying words from WordNet “synonym sets” (synsets) on several image search engines.
The images were labeled by Amazon Mechanical Turk workers who were asked whether each image
contains objects of a particular given synset. Workers were instructed to select images that contain
objects of a given subset regardless of occlusions, number of objects, and clutter to “ensure diversity”
in the dataset’s images.
QuickDraw [12]. The Quick, Draw! dataset contains more than 1 billion doodles collected from
users of an experimental game to benchmark image classification models. Users were instructed to
draw pictures corresponding to a given label, but the drawings may be “incomplete or may not match
the label.” Because no explicit test set is provided, we study label errors in the entire dataset to ensure
coverage of any test set split used by practitioners.
20news [30]. The 20 Newsgroups dataset is a collection of articles posted to Usenet newsgroups used
to benchmark text classification and clustering models. The label for each example is the newsgroup
it was originally posted in (e.g. “misc.forsale”), so it is obtained during the overall data collection
procedure.
IMDB [27]. The IMDB Large Movie Review Dataset is a collection of movie reviews to benchmark
binary sentiment classification. The labels were determined by the user’s review: a score ≤ 4 out of
10 is considered negative; ≥ 7 out of 10 is considered positive.
14Amazon Reviews [29]. The Amazon Reviews dataset is a collection of textual reviews and 5-star
ratings from Amazon customers used to benchmark sentiment analysis models. We use the 5-core
(9.9 GB) variant of the dataset. Modifications: In our study, 2-star and 4-star reviews are removed
due to ambiguity with 1-star and 5-star reviews, respectively. If these reviews were left in the dataset,
they could inflate error counts. Because no explicit test set is provided, we study label errors in the
entire dataset to ensure coverage of any test set split used by practitioners.
AudioSet [8]. AudioSet is a collection of 10-second sound clips drawn from YouTube videos and
multiple labels describing the sounds that are present in the clip. Three human labelers independently
rated the presence of one or more labels (as “present,” “not present,” and “unsure”), and majority
agreement was required to assign a label. The authors note that spot checking revealed some label
errors due to “confusing labels, human error, and difference in detection of faint/non-salient audio
events.”
15You can also read