Towards a predictive model for opal exploration using a spatio-temporal data mining approach
←
→
Page content transcription
If your browser does not render page correctly, please read the page content below
TAJE_A_754793.3d (TAJE)   02-05-2013 23:56

                                                                                 Australian Journal of Earth Sciences (2013)
                                                                                 60, 217–229, http://dx.doi.org/10.1080/08120099.2012.754793

                                                                                 Towards a predictive model for opal exploration using
                                                                                 a spatio-temporal data mining approach
                                                                                                                                              €
                                                                                 A. S. MERDITH, T. C. W. LANDGREBE, A. DUTKIEWICZ* AND R. D. MULLER

                                                                                 EarthByte Group, School of Geosciences, The University of Sydney, NSW 2006, Australia.

                                                                                              Australia produces over 90% of the world’s precious opal from highly weathered Cretaceous sedimen-
                                                                                              tary rocks within the Great Artesian Basin. Since opal was first discovered around 1870 until the present
                                                                                              day, opal mining has been carried out by private operators working a claim no larger than 50  50 m,
                                                                                              usually in the direct vicinity of areas that have yielded precious opal in the past. Currently there is no
                                                                                              formal exploration model for opal and its formation in the geological environment is poorly understood.
                                                                                              Here we make the first systematic attempt to formulate a predictive model for opal exploration using a
Downloaded by [University of Sydney] at 15:42 05 September 2013

                                                                                              powerful data mining approach, which considers almost the entire Great Artesian Basin as a potential
                                                                                              reservoir for precious opal. Our methodology uses all known locations where opal has been mined to
                                                                                              date. Its formation and preservation in weathered Cretaceous host rocks is evaluated by a joint analysis
                                                                                              of large digital data sets that include topography, regional geology, regolith and soil type, radiometric
                                                                                              data and depositional environments through time. By combining these data sets as layers enabling spa-
                                                                                              tio-temporal data mining using the GPlates PaleoGIS software, we produce the first opal prospectivity
                                                                                              map for the Great Artesian Basin. Our approach reduces the entire area of the Great Artesian Basin to a
                                                                                              mere 6% that is deemed to be prospective for opal exploration. It successfully identifies two known major
                                                                                              opal fields (Mintabie and Lambina) that were not included as part of the classification dataset owing to
                                                                                              lack of documentation regarding opal mine locations, and it significantly expands the prospective
                                                                                              areas around known opal fields particularly in the vicinity of Coober Pedy in South Australia and in the
                                                                                              northern and southern sectors of the Eromanga Basin in Queensland. The combined characteristics of
                                                                                              these areas also provide a basis for future work aimed at improving our understanding of opal formation.
                                                                                              KEY WORDS: opal, Great Artesian Basin, data mining, data layering, prospectivity, mineral exploration,
                                                                                              Cretaceous sedimentary rocks, Australian regolith.

                                                                                 INTRODUCTION                                                        tematic approach involving the investigation of
                                                                                                                                                     associations between known opal localities in the Great
                                                                                 Although Australia accounts for over 90% of the world’s             Artesian Basin and particular features in a variety of
                                                                                 production of precious opal that is almost exclusively              open-access spatial geological and geophysical datasets,
                                                                                 found within the Great Artesian Basin (Smallwood 1997),             such as regolith and soil type and radiometric data that
                                                                                 the mining community has been struggling over the past              have a relationship with the occurrence of opal. By using
                                                                                 20 years. This is, in part, the result of an aging and dwin-        data layering and feature extraction (Tan et al. 2006)
                                                                                 dling mining population comprising individual miners                from these digital datasets we have been able to tease out
                                                                                 working on single 50  50 m or smaller claims under                 pertinent associations between opal locations and the
                                                                                 harsh conditions, the rising cost of mining necessities             data sets, and have translated them into an opal prospec-
                                                                                 such as fuel and equipment imposed by the global econ-              tivity map of the Great Artesian Basin, thus providing
                                                                                 omy and the fact that demand for precious opal is driven            the first step towards predictive, systematic opal
                                                                                 exclusively by its use as a decorative gem (opal is Aus-            exploration.
                                                                                 tralia’s national gemstone) with no known industrial
                                                                                 applications. Additionally, a critical factor in contribut-
                                                                                 ing to the decline in opal production is that no new sig-           GEOLOGICAL SETTING
                                                                                 nificant opal discoveries have been made since the early
                                                                                 1900s (Barnes & Townsend 1990). As opal mining in Aus-              Opal consists of amorphous SiO2.nH2O comprising a net-
                                                                                 tralia is largely a cottage industry, the majority of opal          work of silica spheres, which in precious opal are of sim-
                                                                                 exploration simply occurs in the immediate vicinity of              ilar size and form an ordered network allowing light to
                                                                                 locations that have already yielded precious opal using             diffract into a spectacular array of colours (Sanders
                                                                                 traditional exploration techniques such as machine ex-              1964). Precious opal is found in sedimentary and volcanic
                                                                                 cavation and hand-held tools. Here we have used a sys-              environments and is commonly referred to as

                                                                                 *Corresponding author. adriana.dutkiewicz@sydney.edu.au
                                                                                 Ó 2013 Geological Society of Australia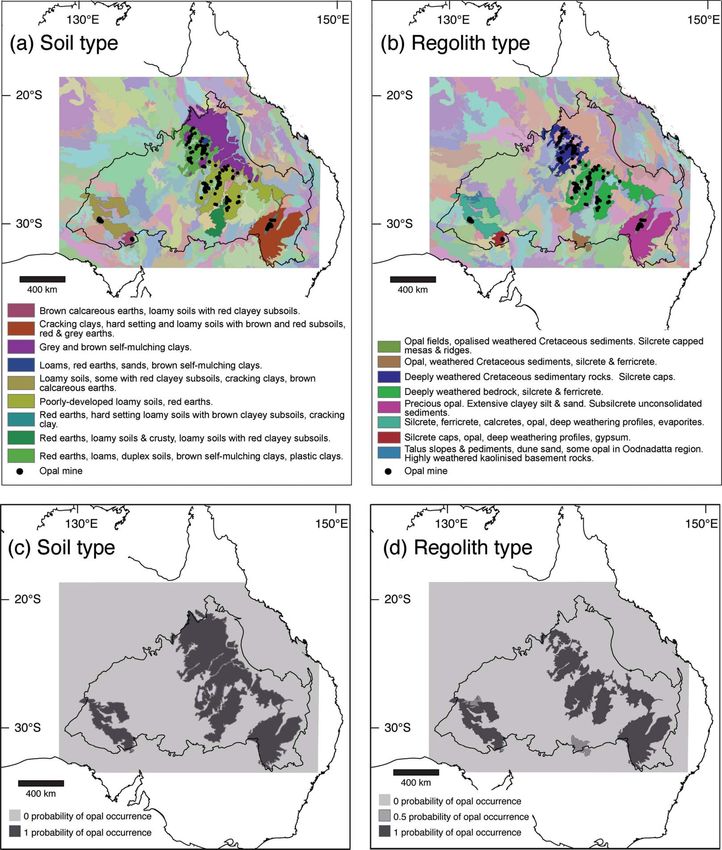
TAJE_A_754793.3d (TAJE) 02-05-2013 23:56
218 A. S. Merdith et al.
Cretaceous sedimentary rocks within the Eromanga and
Surat basins that together comprise a significant portion
of the Great Artesian Basin (Figure 1). The stratigraphy
of Eromanga and Surat basins is dominated by alternat-
ing layers of sandstones, claystones and siltstones that
were deposited ca 125 Ma to 95 Ma as a consequence of a
sequence of regressions and transgressions (Frakes et al.
1987; Campbell & Haig 1999). The Jurassic formations are
consistent with a non-marine, fluvial-lacustrine deposi-
tional environment while the Cretaceous formations are
consistent with a cyclical marine environment (Senior
et al. 1977; Krieg et al. 1995). Precious opal has been
found within three formations (Figure 2): (1) the early
Cretaceous kaolinite-rich, marine Bulldog Shale in the
Eromanga Basin (Coober Pedy opal fields) where the
opal layer is typically found within cracks and joints
proximal to the interface between heavily weathered
and partially weathered shale (Barnes & Townsend 1990;
Figure 1 Map of Australia showing the extent of the Ero- Robertson & Scott 1990), (2) the late Albian to Cenoma-
Downloaded by [University of Sydney] at 15:42 05 September 2013
manga and Surat basins and the location of the major opal- nian volcaniclastic Winton Formation (Exon & Senior
producing townships. The Eromanga and Surat basins rep- 1976) in the Eromanga Basin (Queensland opal fields)
resent the southern eastern and western extents of the Great where it is typically found within the upper 1–2 m of a
Artesian Basin.
claystone layer underlying a sandstone layer, and (3)
within the late Albian kaolinite-rich flood-plain Finch
Claystone (Griman Creek Formation) in the Surat Basin
(Lightning Ridge opal fields) where it typically occurs in
‘sedimentary opal’ and ‘volcanic opal.’ Sedimentary opal fractures. The Mintabie opal field on the edge of the Ero-
is classified as opal-A and volcanic opal is classified as manga Basin of South Australia (Figure 1) is exceptional
opal-CT based on X-ray diffraction analysis although as the opal is found within Ordovician fluviodeltatic
other major differences include the degree of crystallin- sandstones of the Mintabie Beds (Barnes & Townsend
ity, water content and density (Smallwood et al. 2008). 1990) and thus the oldest opal host rocks in central
Virtually all opal mined in Australia is sedimentary Australia. The sedimentary succession of the Eromanga
opal-A, which is thought to have formed from enriched and Surat basins has experienced intense weathering
silica solutions derived from the chemical weathering of that has resulted in extensive silicification throughout
feldspars in the host sequence (Smallwood et al. 2008). In the Tertiary regolith (Thiry et al. 2006) with the wide-
Australia, sedimentary opal is found within fractures spread development of silcrete caps (shin crackers) that
and primary and secondary pore spaces in the top 30 m are characteristic of the outback landscape (Senior &
(Barnes & Townsend 1990) of heavily weathered Mabbutt 1979). A major period of uplift between 100
Figure 2 Summary of Cretaceous stratigraphic units and their depositional environments in the Surat Basin at Lightning
Ridge, the Eromanga Basin in Queensland (NE) and the Eromanga Basin in South Australia (SW). In the South Australian
part of the Eromanga Basins, the Oodnadatta, Mackundra and Winton formations have been completely eroded. Formations
known to be opal-bearing are shown in bold. Adapted from Exon & Senior (1976) and Alexander & Sansome (2006).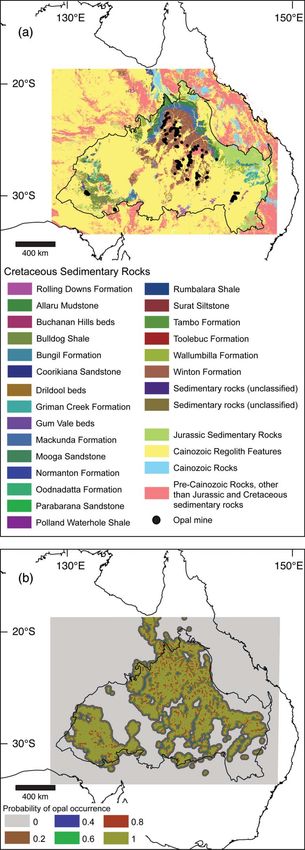
TAJE_A_754793.3d (TAJE) 02-05-2013 23:56
Opal exploration 219
and 65 Ma resulted in erosion and removal of up to 3 km- for determining or constraining where else they are
thick sequence of sedimentary rock (e.g. Raza et al. 2009) likely to have formed. Gardoll et al. (2000) describe the
that was eventually deposited within the Ceduna Basin broad methodology and underlying principles used in
(Norvick & Smith 2001). Due to its low uranium content prospectivity analysis of mineral deposits, using gold
Australian sedimentary opal has not been dated radio- within the Yilgarn Craton in Western Australia as a
metrically (Gaillou et al. 2008a) so its age is potentially case study. This concept is typically used in the eco-
anywhere between 130 Ma to 1 kyr B.P. based on the age nomic geological community as a tool for classifying
of the host rocks in the major opal fields (Exon & Senior and for predicting potential prospective orogenic gold
1976; Thiry et al. 2006), associated minerals (Newberry deposits. The maturity of orogenic gold deposit
2004), silcrete genesis (Senior & Mabbutt 1979; Thiry exploration pertains to long-term investments in explo-
et al. 2006) and carbonaceous material inside cracks in ration and data acquisition owing to the attractive
opal (Dowell et al. 2002). commercial opportunity. This is predominantly as a
Although there has been considerable research on consequence of the global economic significance and
the geochemistry and microstructure of opal (e.g. cultural importance that gold possesses but is also due
Smallwood et al. 1997; Erel et al. 2003; Brown et al. 2004; to the wealth of data (e.g. Groves et al. 1998) that are
Gaillou et al. 2008a, b) its formation in the geological available concerning the geology of orogenic gold
environment is still poorly understood. However, its oc- deposits.
currence close to the surface in association with a Groves et al. (2000) used stress mapping of the Yilgarn
strongly altered kaolinite-rich profile suggests that Block in Western Australia to statistically confirm asso-
Downloaded by [University of Sydney] at 15:42 05 September 2013
weathering is the main process driving the local supply ciations between structural features and orogenic gold
of vast volumes of silica-rich fluids and the subsequent deposits. The prospectivity map that was developed as a
formation of opal (Darragh et al. 1966; Thiry & Milnes result of these associations classified 80% of produced
1991; Gaillou et al. 2008a). It typically forms in regions gold from the Yilgarn Block into the zone of highest pro-
of high porosity and permeability enhanced through spectivity (Groves et al. 2000). Similarly, Bierlein et al.
localised faulting and fracturing and dissolution of (2006) used fault zone and gravity gradient data, to deter-
unstable mineral phases in volcanogenic sedimentary mine that a preferential distribution for orogenic gold in
rocks. Darragh et al. (1966) suggest that concentration the Yilgarn Block occurs in small faults that are influ-
of silica spheres would have been facilitated through enced by longer, more deeply penetrating faults in their
evaporation during episodes of aridity with the proximity. In an alternative approach, Holden et al.
formation, growth and settling of silica spheres in a (2008) used only regional aeromagnetic data over the
confined space ultimately resulting in a prospective same area to identify zones of high prospectivity based
opal deposit. on the degree of magnetic complexity in close proximity
to magnetic discontinuities representing large shear
zones. Their study identified the location of 76% known
orogenic gold deposits based on the single aeromagnetic
SPATIAL DATA MINING dataset.
Outside Australia, there have been similar studies fo-
Background cussing on associations between Carlin-type gold depos-
Over the past decade, extensive high-resolution geologi- its and deep-seated crustal structures in North America
cal datasets for eastern Australia have been compiled (Crafford & Grauch 2002), as well as between shear zones
and published. Complementing this are significant and gold deposits in Canadian Archean greenstone belts
increases in computational power and the ability of (Harris et al. 2001). A fuzzy logic approach has been used
computers to rapidly analyse and synthesise vast to combine incomplete or uncertain datasets in order to
amounts of data. Geographical Information Systems constrain and develop prospectivity maps for gold depos-
(GIS) provide a platform for the simultaneous visualisa- its based on proximity to geological features in the Phil-
tion, assessment and integration of multiple datasets, ippines (Carranza & Hale 2001) and in prospectivity
having found extensive use in analysing the wide varie- modelling for iron-oxide copper gold (IOCG) deposits in
ties of spatial datasets typically required for mineral Finland (Nyka €nen et al. 2008). The approach taken by
exploration in general. Bonham-Carter (1995) outlines Nyka €nen et al. (2008) is similar to this study, in that vari-
two primary approaches to building a predictive explor- ous data layers are prepared separately and then amal-
ative model using GIS software: knowledge-driven mod- gamated together using GIS software to highlight areas
els and data-driven models. The former approach is of high and low prospectivity. An important difference,
based on human expertise in assigning weightings to however, between Australian opal and the more thor-
various associations and is generally used when the for- oughly analysed gold deposits, is that Australian opal is
mation of the mineral deposit is well understood and associated with surficial sedimentary processes, specifi-
constrained. The latter is based on empirical, explor- cally weathering, rather than deeper, large-scale meso-
atory data analysis and statistics, and an extrapolation thermal fluid movement (Groves et al. 1998).
of associations or correlations that are determined Consequently, there is greater dependence on small
within given data sets. (1–10 m) microfaults, surficial geology of the study area
The basic principle involved in both approaches is to and the development and preservation of the regolith
use known or pre-determined geological associations associated with the opal-bearing Cretaceous sedimen-
and correlations between mineral deposits as a proxy tary rocks.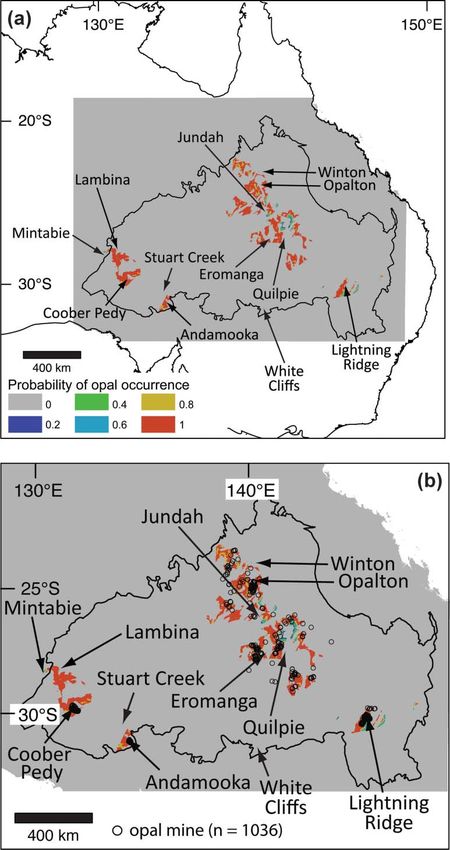
TAJE_A_754793.3d (TAJE) 02-05-2013 23:56
220 A. S. Merdith et al.
Application to opal exploration Methodology
In this study, we adapt the basic methodologies and Our prospectivity mapping approach is based on estab-
principles described above to evaluating the prospectiv- lishing associations between particular features in indi-
ity of opal within the Great Artesian Basin. Our method vidual map data layers with known opal mining sites.
involves a hybrid approach in which known informa- We assume that different layers represent independent
tion about the nature of the opal host sequences is used data sets, thus allowing a succession of these layers to be
to steer and optimise the selection of spatial datasets combined in order to reduce an overall integrated layer
and relationships of interest, but also involving the ex- comprising a combination of the base layers. The final
traction of several proxy-features from spatial and spa- layer is produced via a weighted sum of base layers,
tio-temporal datasets that demonstrate significant allowing a degree of confidence/uncertainty to be
associations. In this way, a limited conceptual under- encoded. The datasets used in creating the layers each
standing is complemented by a data-mining approach, have their own accuracies and shortcomings, and have
with the potential to develop a predictive targeting in some cases involved interpretations and extrapola-
model and to expose associations that may ultimately tions leading to a non-uniform spatial accuracy. Thus,
lead to better overall understanding of the underlying the layer combining method proposed in this paper takes
physical processes. This is the first systematic attempt a flexible approach where data layers can be added/re-
at linking multi-layered data to known distributions of moved/weighted at ease during the experimentation
opal, thus providing a map of potential areas for future phase.
Downloaded by [University of Sydney] at 15:42 05 September 2013
opal mining. Several informal attempts have been made In this study, a training set comprising all known
to associate opal occurrence with particular features opal localities (1036 opal mines) was assembled using
such as mesas and localised fracture networks for published maps from state geological surveys (Carr
small-scale exploration. D. Horton (pers. comm. 2011) 1979; Robertson & Scott 1989; Carter 2005; Geological
identified large (100 km) topographic domes present Survey of Queensland 2012). The location of each opal
at most of the major opal localities (e.g., Lightning mine was digitised and geo-referenced using GIS soft-
Ridge, Quilpie, Winton) and suggested that further ex- ware. Opal mines from Mintabie, Lambina and the
ploration could focus on identifying other domes smaller opal mining districts in the vicinity of Stuart
throughout the Great Artesian Basin as prospective Creek and White Cliffs were omitted as their locations
locations for opal. Smaller scale opal exploration (of the were missing from published maps and reports. A
order of 10 km) has previously been approached in necessary assumption made for the data-derived
many different ways. Pecover (1996) outlined a scenario generation of prospectivity maps is that this dataset
of opal formation based on fluid concentrations and represents an unbiased and representative sample of
pressure gradients through fissures and microfaults, an underlying population. There are, however, some
suggesting that opal exploration should focus on areas limitations. Australian state laws limit extensive opal
of the Great Artesian Basin that have experienced mining in many locations. For example, opal mines
high degrees of stress and that exhibit significant brec- around Lighting Ridge tend to have a large cluster of in-
ciation. Similarly, J. J. Watkins (pers. comm. 2011) dividual mines within a relatively small area. However,
suggested that opal exploration should focus predomi- the potential sample bias resulting from this local clus-
nantly on identifying structural lineaments as targets tering of mines is alleviated by the large set of spatially
for potential opal deposits. D. Robson (pers. comm. 2011) well-separated mine site clusters across the Great Arte-
proposed that exploration efforts (of the order of 1 km) sian Basin, sampling a wide range of formations
could use local, airborne, high resolution magnetic sur- (Figure 3).
veying to determine the location of faults existing
within the upper 30 m of the weathered profile. This is
similar to the models proposed by J. J. Watkins (pers. Data layers
comm. 2011) and Pecover (1996), in that the fluid move-
Six data layers have been used in the opal data mining
ment along faults is treated as a primary criterion in
analysis: regional geology (Figure 3a), soil type
opal formation, and therefore a useful tool in opal explo-
(Figure 4a) regolith type (Figure 4b), topography
ration. Finally, Senior & Chadderton (2007) outline how
(Figure 5a), radiometric data (Figure 5b) and paleoge-
gamma ray logging of drill holes can be used for precise
ography (Figures 6, 7a). Faults were not included be-
opal exploration (on a 1 m scale) by locating the contact
cause there is no dataset available at the small scale
between a sandstone and claystone layer where opal is
associated with opal deposits. Each layer has been
typically found (Senior et al. 1977; Barnes & Townsend
clipped to a bounding box [(131.5106 E, 17.8604 S),
1990).
(151.8217 E, 32.6709 S)] that encompasses the extent of
The approach that is being used here is to provide
Cretaceous sedimentary rock (the predominant
a ‘greenfield’ exploration methodology for opal
chronostratigraphic opal host; Figure 2) within the
exploration to assist in finding new potential opal lo-
Eromanga and Surat basins, thus minimising computa-
calities in an efficient fashion over a large area. Impor-
tional time. The base layer of the prospectivity map is a
tantly, the methodology proposed here is flexible in
1:1 000 000 digital geological map of Eastern Australia
that it allows different combinations of base map
(Figure 3a). Each subsequent layer was then added on
layers to be integrated. This is an important feature
top of this layer in order to minimise the targeting area
for such a new study based on data of relatively low
(Table 1). For each layer the probability of opal occur-
resolution.
rence was determined using the associations and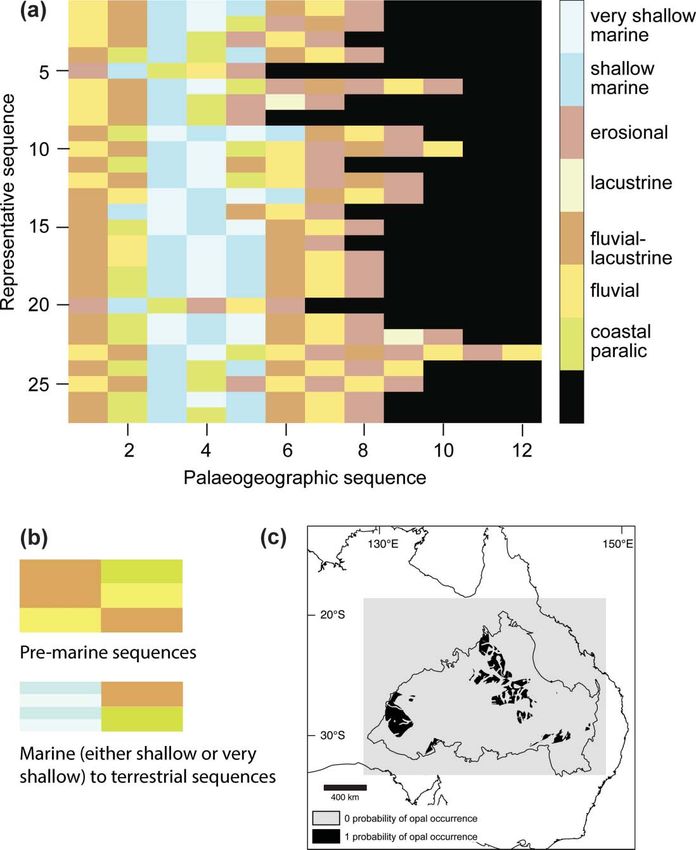
TAJE_A_754793.3d (TAJE) 02-05-2013 23:56
Opal exploration 221
attributed a probability value between 0 and 1. For the Basin. However, it should be noted that the Great Arte-
purpose of brevity, the combination of Surat and Ero- sian Basin also includes the Carpentaria Basin to the
manga basins will be referred to as the Great Artesian north, which is not known to contain opal.
LAYER 1: GEOLOGY OF EASTERN AUSTRALIA
The digital 1:1 000 000 geological map of Australia
(Raymond & Retter 2010) used for this study was
acquired from Geoscience Australia. The dataset covers
the geological units throughout the entire continent,
and the metadata include relative and absolute ages of
most formations, a brief lithological description and the
sub-group, group name and super-group (where appro-
priate) of the formations. This dataset was created by
the amalgamation of the pre-existing 1:250 000 geological
maps of Australia. In generating the layer used for the
prospectivity map, the geological map was clipped to the
bounding box. The Cretaceous sedimentary rock forma-
tions that have a minimum age ranging from the Albian
Downloaded by [University of Sydney] at 15:42 05 September 2013
to Cenomanian were attributed a probability value of 1.
All formations/units older than Cretaceous were given a
probability value of 0. Areas characterised by patches of
thin Cenozoic cover were assigned probabilities between
0.8 and 0.2 depending on their distance from the nearest
Cretaceous surface outcrop (Figure 3).
LAYERS 2 AND 3: REGOLITH AND SOIL TYPES
The regolith dataset used in the analyses is the digital
compilation of the Regolith Site Classification Map
(Kilgour & Pain 2000). The dataset contains a qualitative
classification of the Australian landscape based on dif-
fering regolith features such as major and minor land-
forms, soil types and a description of the regolith. Two
data layers were created based on qualitative associa-
tions between opal and the regolith type/soil classifica-
tion. The first layer is based on a description of the
regolith and the second is a classification of the soil
(Figure 4). Using the data-mining suite (Landgrebe &
Mu € ller 2011) incorporated as part of the GPlates Paleo-
GIS software (Boyden et al. 2011), six regolith features
and nine types of soil (see Figure 4) were determined to
be associated with the presence of opal, and all were sub-
sequently attributed probability values of 1. Note that
our original opal dataset excluded two additional rego-
lith classifications that are associated with precious opal
as described by Kilgour & Pain (2000) but for which we
do not have exact locations of opal mines (White Cliffs).
These two areas were attributed probability values of
0.5. All other classifications of both regolith and soil
were given probability values of 0 (Figure 4c, d).
J
Figure 3 Association between opal occurrences and regional
geology within the Great Artesian Basin. Note the black out-
line of combined Eromanga and Surat basins. (a) Known
locations of opal mines superimposed over major sedimen-
tary Cretaceous units. Geological data from Raymond &
Retter (2010). (b) Probability of opal occurrence (from 0 to 1)
in relation to regional geology. The grey rectangle defines
the bounding box that was use to clip the continent-wide
data set. Because the opal is strongly associated with Creta-
ceous sedimentary rocks, a very large area of opal prospec-
tivity is identified.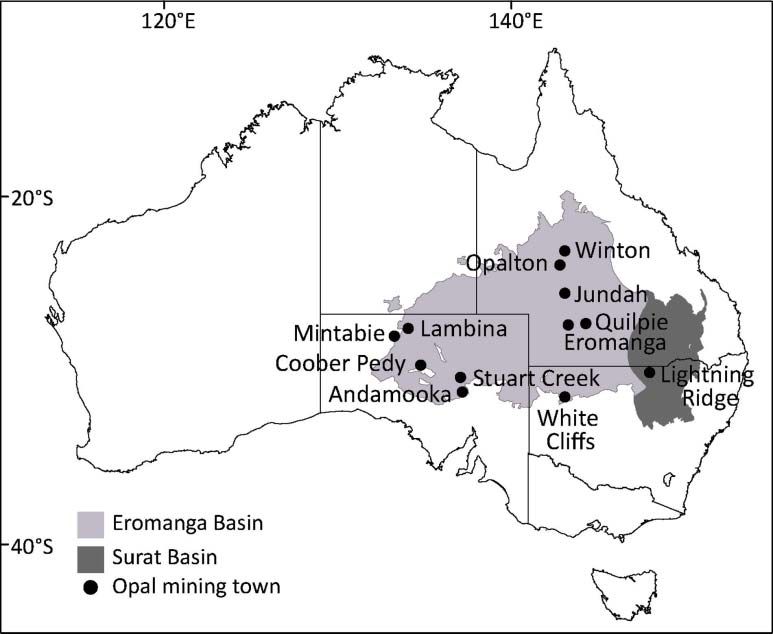
TAJE_A_754793.3d (TAJE)   02-05-2013 23:56

                                                                                 222        A. S. Merdith et al.
Downloaded by [University of Sydney] at 15:42 05 September 2013

                                                                                 Figure 4 Association between opal occurrences and soil type and regolith type within the Great Artesian Basin. Note the black
                                                                                 outline of combined Eromanga and Surat basins. (a) Known locations of opal mines superimposed over soil types, predomi-
                                                                                 nantly loamy soils and red earths. (b) Known locations of opal mines superimposed over regolith type. Opal shows a strong as-
                                                                                 sociation with weathered Cretaceous profiles, silcrete and ferricrete. (c) Probability of opal occurrence (from 0 or 1) in
                                                                                 relation to soil type. The grey rectangle defines the bounding box that was use to clip the continent-wide data set with high-
                                                                                 probability areas centred around 9 soils types. (d) Probability of opal occurrence in relation to regolith type. Soil and regolith
                                                                                 data sets from Kilgour & Pain (2000).

                                                                                    An additional quantitative layer developed for this             regolith type, which indicates that the average distance
                                                                                 dataset is based on proximity of opal to a regolith                from any opal location to a regolith boundary is 11 km,
                                                                                 boundary. This association was determined through                  with a standard deviation of 7 km. To reflect this associ-
                                                                                 data mining of the opal locations relative to a change in          ation, an internal multiple ring buffer of five
TAJE_A_754793.3d (TAJE) 02-05-2013 23:56
Opal exploration 223
Downloaded by [University of Sydney] at 15:42 05 September 2013
Figure 5 Association between opal occurrences and topography with a resolution of 250 m (a) and radiometric data with a res-
olution of 80 m (b) within the Great Artesian Basin. Probability of opal occurrence in relation to topography (c) and radiomet-
ric data (d). Topography data set from Hutchinson et al. (2006); radiometric data set from Minty et al. (2010).
increments up to a maximum distance of the computed composite grid of the potassium component, has a reso-
mean added to two standard deviations (m þ 2s) was lution of 80 m with three large areas without data (Minty
computed, resulting in the generation of 0.05 (roughly 2011) mostly affecting our analysis of the opal regions in
5 km) buffers. The zones closest to a regolith boundary the vicinity of Quilpie in southern Queensland
were attributed a probability value of 1 with the proba- (Figure 5). The potassium radiometric component was
bility assigned to the 5 km wide buffer regions progres- selected for this analysis after investigating the correla-
sively decreasing in increments of 0.2 away from a tion of local gradients in potassium, uranium and tho-
given regolith boundary. rium radiometric grids with opal deposits, which
revealed the strongest correlation with the potassium
data set. For both the topography and radiometric data-
LAYERS 4 AND 5: GEOPHYSICAL DATASETS
sets we calculated the contrast ratio for each pixel by tak-
The topography dataset used in the analysis has a resolu- ing an 8 km square around each pixel and dividing the
tion of 250 m (Hutchinson et al. 2006), while the radio- 80th percentile pixel by the 20th percentile pixel. The
metric dataset, representing a levelled and merged resulting map was binarised using a 50% threshold toTAJE_A_754793.3d (TAJE) 02-05-2013 23:57
224 A. S. Merdith et al.
Downloaded by [University of Sydney] at 15:42 05 September 2013
Figure 6 Depositional and erosional environments from 145 Ma to the present day showing flooding of Eromanga and Surat
basins (thin black outline within the Australian continent with black dots representing opal mine localities) from about
131 Ma to 100 Ma followed by progressive uplift and extensive erosion linked to the cessation of subduction east of Australia
(Matthews et al. 2011) until the present day. Depositional environments within the opal mining regions have been domi-
nated by marine and fluvial processes. Adapted from Langford et al. (1996). Note that 18 out of a total of 19 time slices are
shown here.
outline areas of the Great Artesian Basin with high and LAYER 6: PALEOGEOGRAPHY
low contrast ratios. The association suggests that opal
The paleogeography dataset (Langford et al. 1996) is a
occurs at locations where there is a gradient change,
digital version of a compilation of maps based on recon-
from a high to low contrast ratio. We used the mean plus
structions of the depositional/erosional environment, of
one standard deviation (which in total is 18 km) of the
the Australian continent through time from 542 Ma to
computed distance from an opal location to a regolith
present day, comprising 70 time slices. As opal is found
boundary to create a buffer zone around the boundaries
predominantly in Cretaceous sedimentary rocks, the
of the high- and low-contrast areas. Areas within the
analysis of the dataset and generation of the data layer
buffer zones were attributed probability values of 1, and
was constrained from 145 Ma to the present day, compris-
areas outside the buffer zones were attributed values of 0
ing 19 time slices that include shallow marine, coastal,
(Figure 5).TAJE_A_754793.3d (TAJE) 02-05-2013 23:57
Opal exploration 225
Table 1 Effect of various input layers on the area of opal pro- prospectivity map does not predict the location of opal at
spectivity for the Great Artesian Basin. White Cliffs (Figure 8).
The White Cliffs opal mining region is absent from
Area of the Great Artesian our set of known locations of opal mines, as its exact lo-
Data layer Basin (km2) 104 cation has not been recorded on published maps, but it
Great Artesian Basin 135.5 (100%)
is represented by a large patch on the regolith type map
Geology buffer 104.1 (76.8%) of Kilgour & Pain (2000) (Figure 4b). The White Cliffs pa-
Regolith soil 49.5 (36.5%) leogeographic sequence has alternated between an ero-
Regolith type 35.4 (26.1%) sional and fluvial environment three times since the
Palaeogeography 14.5 (10.7%) regression of the inland sea ca 90 Ma (Figure 6), while
Radiometric data 126.5 (93.4%) other opal mining regions experienced only one marine–
Topography 106.6 (78.7%) fluvial–erosional transition (Figure 6). In addition, al-
Prospectivitya 8.1 (6%) though there are similarities between the soil in the
a
All data sets (layers) combined. White Cliffs area and in other locations, such as the pres-
In the initial analysis, the entire Great Artesian Basin is consid- ence of red earths and red clayey subsoils (Figure 4a), its
ered to be prospective for opal exploration. This area is reduced absence from the classification based on the soil type
to 6% with the combination of all data sets. data layer arises from it being primarily associated with
crusty, loamy soils. The White Cliffs region is located
near the southern edge of the Great Artesian Basin
Downloaded by [University of Sydney] at 15:42 05 September 2013
lacustrine and fluvial depositional environments and a (Figure 1) and, being one of the most proximal areas to
period of intense erosion from at least 65 Ma until the the paleo-coastline, would have experienced more com-
present day (Figure 6). A concept related to the forma- plex and more frequent shifts in depositional environ-
tion of opal is that only a particular sequence of deposi- ments. As a consequence, the paleogeographic
tional/erosional environments will lead to conditions transitions and hence the soil types are different from
suitable for opal formation. We test this idea by extract- the other opal mine locations that are used to train our
ing paleogeographic time sequences from the paleogeo- classification algorithm.
graphic dataset at each opal locality. These time series The paleogeographic sequences assist greatly in min-
consist of the time-varying geographic environment imising the exploration area, highlighting areas of
properties extracted from the paleogeographic time-sli- higher prospectivity, owing to the similarity of paleogeo-
ces. This first step resulted in a total of 1036 time-series, graphic histories between most areas where opal has al-
one for each opal mine with 19 time slices spanning the ready been found. However, there are areas in the Great
period of interest (Figure 6). In this analysis, we are con- Artesian Basin that may contain opal whose prospectiv-
cerned with the transition of environments, rather than ity clearly cannot be determined using paleogeographic
the duration of each period, following the assumption sequences alone.
that it is the sequence of transitions that ultimately cre- The regolith type layer is the next most effective layer
ate geological conditions favourable for opal formation. at reducing the targeting area (74%; Table 1) followed by
Therefore, we map the depositional environment time the soil type layer (64%; Table 1). The large area reduc-
series to ‘ordinal’ event sequences, consisting of ordered tion achieved using the regolith/soil dataset may be due
lists of events in chronological order (Figure 7). to the detailed regolith type and soil-type classifications
available for the Great Artesian Basin resulting in a rel-
atively high degree of specificity for the opal-bearing
regions. More importantly, however, it confirms that
RESULTS opal occurrence is strongly associated with weathering
history and the parent rock type, which together are crit-
The combination of the six data layers effectively ical in supplying vast amounts of silica required for the
reduces the baseline targeting area (the Great Artesian formation opal deposits. Each opal field is characterised
Basin) to a mere 6% (8 104 km2) representing the final by a single regolith feature (Figure 4). In general, regions
opal prospectivity map (Table 1; Figure 8). The greatest of high opal prospectivity are associated with red earth
reduction of 89% in the target area is achieved with the and loamy soils and deeply weathered profiles that fre-
paleogeography data set, thus highlighting the impor- quently contain ferricrete and silcrete horizons
tance of the depositional/erosional sequence on the for- (Figure 4).
mation and preservation of opal (Figure 7). The lowest area reduction of 7% (i.e., 93% of the target
Amalgamating the various ordinal event sequences area remains prospective) is achieved with the radiomet-
(Figure 7) illustrates that there is considerable similar- ric dataset (Table 1), which contains large areas without
ity between paleogeographic sequences across all opal lo- data (Figure 5), although in general opal deposits appear
calities. Of the 1036 opal mine localities, 52 independent to be associated with geochemical gradients, reflected by
ordinal sequences are identified, and of these, 27 sequen- variations in radiometric data that mimic topographic
ces describe 95% of all independent ordinal paleogeo- gradients (Figure 5) and regolith type changes (Figure 4).
graphic sequences. It follows that these 27 sequences Typically, the change in regolith is from deeply weath-
(Figure 7) comprising fluvial and shallow marine deposi- ered sedimentary rock within which opal is found, to un-
tional sequences followed by a prolonged phase of ero- consolidated colluvium and alluvium, and aeolian sand
sion are representative of the depositional/erosional or silicified Paleogene/Neogene sedimentary rocks.
sequences underpinning for opal formation. The Likewise, the geological layer reduced the area ofTAJE_A_754793.3d (TAJE) 02-05-2013 23:57
226 A. S. Merdith et al.
Downloaded by [University of Sydney] at 15:42 05 September 2013
Figure 7 Association between opal occurrences and particular sequences of depositional/erosion events through time.
(a) Graphical representation of the 27 chronological paleogeographic sequences that represent 95% of opal localities based on
the maps of depositional environments shown in Figure 6. Each row depicts a sequence of depositional environments (colour-
coded and corresponding to the scheme used in Figure 6), with columns representing their superposition through time at any
given opal mine locality. The sequences show that the overall paleogeographic evolution can be characterised by an initial
fluvial/lacustrine environment, followed by a marine inundation with a subsequent return to fluvial/lacustrine conditions
followed by a regression leading to an erosional environment. These ordinal sequences disregard the duration of each deposi-
tional/erosional period, and instead reflect the sequence of events that marks the change from one sedimentary/
erosional regime to another. All sequences start at 145 Ma and end at 0 Ma. The fewer events have occurred at a given locality
the shorter the total sequence of events is (i.e., total length of horizontal coloured bars). (b) Representative set of environments
(legend as for Figure 7a) associated with known opal occurrences. Pre-marine sequences refer to terrestrial sequences that
pre-date the main transgression phase in the Great Artesian Basin. Marine to terrestrial sequences refer to the main trans-
gressive phase and subsequent regression, respectively. For the pre-marine transition, 24 out of the 27 unique temporal signa-
tures of the opal localities are characterised by three transitions: fluvial to fluvial-lacustrine (10 out of 27 signatures), fluvial-
lacustrine to coastal-paralic (11 out of 27 signatures), and fluvial-lacustrine to fluvial (3 out of 27 signatures). For the marine to
terrestrial transitions, the opal localities are characterised by only two different transitions: marine to fluvial-lacustrine
(13 out of 27 signatures), and marine to coastal-paralic (14 out of 27 signatures). In contrast, areas not associated with known
opal occurrence are characterised by large variability in environmental transitions. (c) Probability of opal occurrence based
on the 27 chronological paleogeographic sequences that represent 95% of opal localities vs paleogeographic sequences that are
associated with non-opal-bearing region.
prospectivity by a relatively moderate amount (23%, entire extent of Cretaceous sedimentary rock in the Great
Table 1). Artesian Basin. The addition of the paleogeographic data
Interestingly, the combination of the geology, regolith significantly reduces the total prospective area (Table 1),
and soil layers only minimally reduces the targeting indicating the importance of specific sequences of sedi-
area. This indicates that opal formation as a consequence mentary/erosional environments in giving rise to rego-
of weathering could have occurred throughout nearly the lith conditions conducive to opal formation.TAJE_A_754793.3d (TAJE) 02-05-2013 23:57
Opal exploration 227
Opalton area extending towards Quilpie (Figure 8). Geo-
logically, the Lightning Ridge opal mining region is dis-
tinct from the surrounding plains of Quaternary
colluvium material (Burton 2011), resulting in a very
small area of potential prospectivity for opal.
CONCLUSIONS
We have generated an opal prospectivity map through
the combination of large digital geological and geophys-
ical data sets, including space–time sequences of deposi-
tional environments, with a novel data mining workflow.
The weighted combination of all data layers reduces the
total area prospective for opal to 6% of the Eromanga
and Surat basins combined. The highest degree of opal
prospectivity, and the most likely location for new opal
fields, occurs along the southwestern extent of the Great
Artesian Basin in South Australia, specifically between
Downloaded by [University of Sydney] at 15:42 05 September 2013
the Coober Pedy and Lambina and Mintabie fields. The
maps also suggest that further exploration for opal may
be prospective in a northwest–southeast corridor
throughout central Queensland. Our data-layering meth-
odology is flexible and allows for the generation of multi-
ple prospectivity maps through the compilation of
different data layers, determined by personal interpreta-
tion of the strength of each association. To date, opal ex-
ploration has been entirely focused on the local scale of
the deposits based on local features such as faulting, to-
pography, shallow stratigraphy or proximity to known
opal deposits. Our approach places opal exploration in a
spatio-temporal context by considering basin evolution
and basin-wide geological and geophysical datasets. Al-
though still rudimentary, our methodology has the po-
tential to diversify current approaches towards opal
exploration, identifying new greenfield targets and,
hence, optimising subsequent, higher cost, detailed
investigations.
ACKNOWLEDGEMENTS
Figure 8 (a) Opal prospectivity map based on assimilation of
geological, soil type, regolith type, topographic, radiometric We would like to thank opal miners and opal miners
and paleographic datasets. For clarity, opal mine locations associations in Coober Pedy, Lightning Ridge and Win-
have been omitted. (b) Same map as in (a) also showing ton for their generosity in sharing information and for
known locations of opal mines. The major mining centres showing us around key opal mines. We are especially
around Lambina and Mintabie have been correctly identi- grateful to Colin Duff and Maxine O’Brien. We would
fied. They were omitted from the input dataset as the accu- -Long
also like to thank Anya Reading and Jon Claoue
rate location of opal mines was not known from existing
for their constructive and thorough reviews, which have
maps and reports. A large region northeast of Coober Pedy
appears to be highly prospective as do several large areas improved the paper significantly. This project was
proximal to known opal fields within the eastern part of the funded by the Australian Research Council (ARC) Dis-
Eromanga Basin in Queensland. covery Grant DP0987604.
REFERENCES
In the southwestern Eromanga Basin in South Aus- Alexander E. M. & Sansome A. (Editors) 2006. Lithostratigraphy and
environments of deposition (Eromanga Basin). (Petroleum Geol-
tralia, the prospectivity map correctly predicts the loca- ogy of South Australia, Vol. 4). Department of Primary Industries
tion of opal occurring at both Lambina and Mintabie and Resources, South Australia.
(Figure 8). In addition, the map indicates a northwest– Barnes L. C. & Townsend I. J. (Editors) 1990. Opal deposits in Aus-
southeast-oriented corridor stretching from Coober tralia. (Geology of the Mineral Deposits of Australia and Papua
New Guinea., Vol. 1). The Australian Institute of Mining and Met-
Pedy to the Mintabie/Lambina area that is highly pro-
allurgy, Victoria.
spective for opal. Similarly, there is a northwest–south- BIERLEIN F. P., MURPHY F. C., WEINBERG R. F. & LEES T. 2006.
east-oriented corridor of prospectivity from the Winton/ Distribution of orogenic gold deposits in relation to fault zonesTAJE_A_754793.3d (TAJE) 02-05-2013 23:57
228 A. S. Merdith et al.
and gravity gradients: targeting tools applied to the Eastern mesothermal Au in the Swayze Greenstone Belt, Ontario, Can-
Goldfields, Yilgarn Craton, Western Australia. Mineralium ada. Natural Resources Research 10, 91–124.
Deposita 41, 107–126. HOLDEN E-J., DENTITH M. & KOVESI P. 2008. Towards the automated anal-
BONHAM-CARTER G. F. 1995. Geographic information systems for geo- ysis of regional aeromagnetic aata to identify regions prospective
scientists: modelling with GIS. Computer Methods in the Geoscien- for gold deposits. Computers and Geosciences 34, 1505–1513.
ces Volume 13. Pergamon, New York. HUTCHINSON M. F., STEIN J. A. & STEIN J. L. 2006. GEODATA 9 second dig-
BOYDEN J. A., Mu € LLER R. D., GURNIS M., TORSVIK T. H., CLARK J. A., ital elevation model (DEM-9S) version 3. Geoscience Australia,
TURNER M., IVEY-LAW H., WATSON R. J. & CANNON J. S. 2011. Next-gen- Canberra.
eration plate-tectonic reconstructions using GPlates. In: Keller KILGOUR B. & PAIN C. 2000. Regolith terrains of Australia (National Geo-
G. R. & Baru C. eds., Geoinformatics: Cyberinfrastructure for the science Dataset). Geoscience Australia, Canberra.
Solid Earth Sciences, pp. 95–114. Cambridge University Press, KRIEG G. W., ALEXANDER E. M. & ROGERS P. A. 1995. Eromanga Basin. In:
Cambridge. Drexel J. F. & Preiss W. V. eds., The geology of South Australia. Vol.
BROWN L. D., RAY A. S. & THOMAS P. S. 2004. Elemental analysis of Aus- 2, The Phanerozoic. South Australia. Vol. 54, pp. 101–124, Geologi-
tralian amorphous banded opals by laser-ablation ICP-MS. Neues cal Survey Bulletin.
Jahrbuch fu € r Mineralogie—Monatshefte 2004, 411–424. LANDGREBE T. C. W. & Mu € LLER R. D. 2011. A spatio-temporal knowledge-
BURTON G. R. 2011. Explanatory notes. Angledool 1:250 000 geological discovery platform for Earth-Science data. Digital Image Comput-
sheet SH/55-7 (2nd edition). Geological Survey of New South ing Techniques and Applications (DICTA). pp. 394–399. IEEE.
Wales, Maitland, NSW. LANGFORD R. P., WILFORD G. E., TRUSWELL E. M., TOTTERDELL J. M., YEUNG
CAMPBELL R. J. & HAIG D. W. 1999. Bathymetric change during Early M., ISEM A. R., YEATES A. N., BRADSHAW M., BRAKEL A. T., OLISSOFF S.,
Cretaceous intracratonic marine transgression across the COOK P. J. & STRUSZ D. L. 1996. Palaeogeographic atlas of Australia:
northeastern Eromanga Basin, Australia. Cretaceous Research time dependent summarisation of sedimentological data based on
20, 403–446. several datasets, between 550 Ma to present date. Geoscience Aus-
CARR S. G. 1979. Andamooka precious stone fields [map]. Geological tralia, Canberra.
Downloaded by [University of Sydney] at 15:42 05 September 2013
Survery of South Australia, Adelaide. MATTHEWS K. J., HALE A. J., GURNIS M., Mu € LLER R. D. & DICAPRIO L. 2011.
CARRANZA E. J. M. & HALE M. 2001. Geologically constrained fuzzy Dynamic subsidence of Eastern Australia during the Cretaceous.
mapping of gold mineralization potential, Baguio district, Philip- Gondwana Research 19, 372–383.
pines. Natural Resources Research 10, 125–136. MINTY B. R. S. 2011. Airborne geophysical mapping of the Australian
CARTER P. 2005. Opal Fields—Lightning Ridge region [map]. Geological continent. Geophysics 76, A27–A30.
Survey of New South Wales, Maitland. MINTY B. R. S., FRANKLIN R., MILLIGAN P. R., RICHARDSON L. M. & WILFORD
CRAFFORD A. E. J. & GRAUCH V. J. S. 2002. Geologic and geophysical evi- J. 2010. Radiometric map of Australia, 2nd edition. Geoscience
dence for the influence of deep crustal structures on Paleozoic Australia, Canberra.
tectonics and the alignment of world-class gold deposits, north- NEWBERRY T. L. 2004. 40Ar/39Ar Geochronology constraints on weath-
central Nevada, USA. Ore Geology Reviews 21, 157–184. ering profile evolution in Australian opal fields. Australian Geo-
DARRAGH P. J., GASKIN A. J., TERRELL B. C. & SANDERS J. V. 1966. Origin of logical Convention, pp. 34–34.
precious opal. Nature 209, 13–16. NORVICK M. & SMITH M. 2001. Southeast Australia–Mapping the plate
DOWELL K., MAVROGENES J., MCPHAIL D. C. & WATKINS J. 2002. Origin and tectonic reconstruction of southern and southeastern Australia
timing of formation of precious black opal nobbies at Lightning and implications for petroleum systems. APPEA Journal—
Ridge. Regolith and Landscapes in Eastern Australia (unpubl.). Australian Petroleum Production and Exploration Association 41,
EREL E., AUBRIET F., FINQUENEISEL G. & MULLER J. F. 2003. Capabilities 15–36.
of laser ablation mass spectrometry in the differentiation of NYKa€NEN V., GROVES D. I., OJALA V. J., EILU P. & GARDOLL S. J. 2008. Recon-
natural and artificial opal gemstones. Analytical Chemistry 75, naissance-scale conceptual fuzzy-logic prospectivity modelling
6422–6429. for iron oxide copper–gold deposits in the northern
EXON N. F. & SENIOR B. R. 1976. The Cretaceous of the Eromanga and Fennoscandian Shield, Finland. Australian Journal of Earth Sci-
Surat Basins. BMR Journal of Australian Geology and Geophysics ences 55, 25–38.
1, 33–50. PECOVER S. R. 1996. A new genetic model for the origin of opal in Cre-
FRAKES L. A., BURGER D., APTHORPE M., WISEMAN J., DETTMANN M., ALLEY taceous sediments of the Great Australian Basin. Geological Soci-
N., FLINT R., GRAVESTOCK D., LUDBROOK N. & BACKHOUSE J. 1987. Aus- ety of Australia Abstracts pp. 450–454.
tralian Cretaceous shorelines, stage by stage. Palaeogeography, RAYMOND O. L. & RETTER A. J. 2010. Surface geology of Australia
Palaeoclimatology, Palaeoecology 59, 31–48. 1:1,000,000 scale, 2010 edition (digital dataset). Geoscience Aus-
GAILLOU E., DELAUNAY A., RONDEAU B., BOUHNIK-LE-COZ M., FRITSCH E., tralia, Canberra.
CORNEN G. & MONNIER C. 2008a. The geochemistry of gem opals as RAZA A., HILL K. C. & KORSCH R. J. 2009. Mid-Cretaceous uplift and de-
evidence of their origin. Ore Geology Reviews 34, 113–126. nudation of the Bowen and Surat Basins, eastern Australia: rela-
GAILLOU E., FRITSCH E., AGUILAR-REYES B., RONDEAU B., POST J., BARREAU tionship to Tasman Sea rifting from apatite fission-track and
A. & OSTROUMOV M. 2008b. Common gem opal: An investigation of vitrinite-reflectance data. Australian Journal of Earth Sciences
micro-to nano-structure. American Mineralogist 93, 1865. 56, 501–531.
GARDOLL S. J., GROVES D. I., KNOX-ROBINSON C. M., YUN G. Y. & ELLIOTT N. ROBERTSON R. S. & SCOTT D. C. 1989. Coober Pedy Precious Stone Field
2000. Developing the tools for geological shape analysis, with [map]. Department of Mines and Energy, South Australia,
regional- to local-scale examples from the Kalgoorlie Terrane Adelaide.
of Western Australia. Australian Journal of Earth Sciences 47, ROBERTSON R. S. & SCOTT D. C. 1990. Geology of the Coober Pedy Precious
943–953. Stones Field, results of investigations, 1981–86. Energy D. o. M. a.
GEOLOGICAL SURVEY OF QUEENSLAND 2012. Interactive resource and tenure Geological Survey of South Australia, Adelaide.
maps [digital dataset]. Department of Mines and Energy, SANDERS J. V. 1964. Colour of precious opal. Nature 204, 1151–1153.
Queensland. SENIOR B. R. & CHADDERTON L. T. 2007. Natural gamma radioactivity
GROVES D. I., GOLDFARB R. J., GEBRE-MARIAM M., HAGEMANN S. G. & and exploration for precious opal in Australia. The Australian
ROBERT F. 1998. Orogenic gold deposits: A proposed classification Gemmologist 23, 160–176.
in the context of their crustal distribution and relationship to SENIOR B. R. & MABBUTT J. A. 1979. A proposed method of defining
other gold deposit types. Ore Geology Reviews 13, 7–27. deeply weathered rock units based on regional geological map-
GROVES D. I., GOLDFARB R. J., KNOX-ROBINSON C. M., OJALA J., GARDOLL S., ping in southwest Queensland. Journal of the Geological Society
YUN G. Y. & HOLYLAND P. 2000. Late-kinematic timing of orogenic of Australia 26, 237–254.
gold deposits and significance for computer-based exploration SENIOR B. R., MCCOLL D. H., LONG B. E. & WHITELEY R. J. 1977. The geol-
techniques with emphasis on the Yilgarn Block, Western Aus- ogy and magnetic characteristics of precious opal deposits, south-
tralia. Ore Geology Reviews 17, 1–38. west Queensland. BMR Journal of Australian Geology &
HARRIS J. R., WILKINSON L., HEATHER K., FUMERTON S., BERNIER M. A., AYER Geophysics 2, 241–251.
J. & DAHN R. 2001. Application of GIS processing techniques for SMALLWOOD A. 1997. A new era for opal nomenclature. The Australian
producing mineral prospectivity maps—a case study: Gemmologist 19.TAJE_A_754793.3d (TAJE) 02-05-2013 23:57
Opal exploration 229
SMALLWOOD A. G., THOMAS P. S. & RAY A. S. 1997. Characterisation of THIRY M. & MILNES A. R. 1991. Pedogenic and groundwater silcretes at
sedimentary opals by Fourier transform Raman spectroscopy. Stuart Creek opal field, South Australia. Journal of Sedimentary
Spectrochimica Acta Part A: Molecular and Biomolecular Spectros- Research 61, 111–127.
copy 53, 2341–2345. THIRY M., MILNES A. R., RAYOT V. & SIMON-COINçON R. 2006. Interpreta-
SMALLWOOD A. G., THOMAS P. S. & RAY A. S. 2008. Characterisation of the tion of palaeoweathering features and successive silicifications
dehydration of Australian sedimentary and volcanic precious in the Tertiary regolith of inland Australia. Journal of the Geolog-
opal by thermal methods. Journal of Thermal Analysis and Calo- ical Society 163, 723–736.
rimetry 92, 91–95.
TAN P., STEINBACH M. & KUMAR V. 2006. Introduction to data mining.
Addison-Wesley, Boston, MA.
Received 24 July 2012; accepted 11 November 2012
Downloaded by [University of Sydney] at 15:42 05 September 2013You can also read