South African Telecommunications Sentiment Index 2020 - Deloitte
←
→
Page content transcription
If your browser does not render page correctly, please read the page content below
BrandsEye

South African
Telecommunications
Sentiment Index
2020
Data analysis     Diana Miguel
Editorial team    Stacey Frank, Patrick Gordon, Melanie Malherbe, Nic Ray, Liska Kloppers,
		Shannon Temple
Contributors      Mark Joseph, Jacques Compaan, Ica van Eeden, Theo Kotzé,
		                Stefanus van der Merwe
Design            Anton Boshoff

The data presented in this report has been subject to quality assurance on 18 February 2021.
Possible subsequent changes in figures are in line with data suppliers’ terms and conditions.

  BrandsEye
SOUTH AFRICAN TELECOMMUNICATIONS SENTIMENT INDEX 2020

Contents

Key insights                                             1

Foreword                                                2

Introduction                                             4

Industry Net Sentiment analysis                         6

Industry risk analysis                                  11

Customer perceptions of value                           12

      Service                                           13

      Network                                           21

      Pricing                                           25

Market Conduct                                          29

Methodology                                             36

Conclusion                                              39

  BrandsEye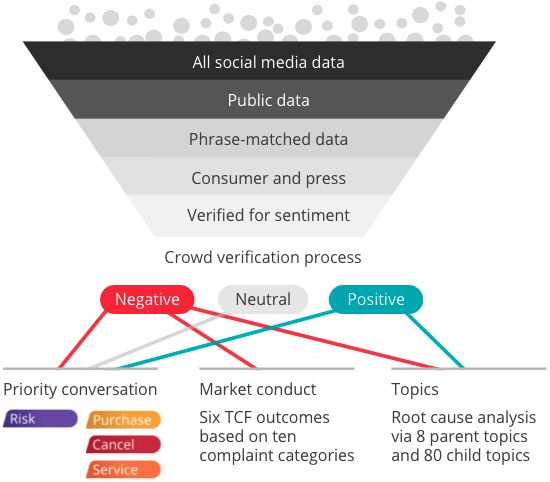
SOUTH AFRICAN TELECOMMUNICATIONS SENTIMENT INDEX 2020

      Key insights
      2 091 904 social media      303 475 mentions         157 580 mentions            40 151 mentions
      posts about telcos          analysed for sentiment   evaluated for topics        verified for market
                                  by BrandsEye’s Crowd                                 conduct

Telecoms is SA’s most negative industry                                       Insurance is SA’s most positive industry
                               -34.6%                                         4%

    Highest Net Sentiment         Lowest Net Sentiment        Best reputation          Best operational sentiment

              -21.6%                      -58.3%                   -0.3%                        -47.2%

               MTN                         rain                     MTN                          Cell C

                 1/3                                          Best response rate             Worst response rate
                 online mentions require a response

                 65.3%                                           64.7%                            25%
                 purchase-related conversation missed                Cell C                        Telkom

                                 Most negative network         Most positive for
  Most positive network
                                                                network speed

      -71.4%                        -88.2%                      -29.8%
           MTN                          Telkom                       MTN

                                                             Most positive pricing           Most negative pricing
                 30-50%
                 data price reduction for MTN &
                 Vodacom as a result of Competition             -19.2%                          -60.8%
                 Commission inquiry
                                                                     Cell C                       Vodacom

         Highest proportion of TCF complaints
                                                                                               9/10
                     92.5%                                   complaints requiring response were
                                                                                  relevant to TCF
                          rain

        BrandsEye                                                                        1
SOUTH AFRICAN TELECOMMUNICATIONS SENTIMENT INDEX 2020

Foreword

In a tumultuous year for the South African telecommunications sector, 2020 saw
network providers grapple with the ongoing pressure of decreasing margins in
the face of a disproportionately higher demand for connectivity and customer
interactions. Connectivity, for many people, moved from a normal category of
service into the same essential service type category as water and electricity.

For context, the year began off the back of the Competition Commission’s
conclusion of a two-year inquiry into data services, which found prices charged
by the country’s top two operators, MTN and Vodacom, to be higher than in other
African markets they operate in.

While responding to calls by the Competition Commission to reduce their data
pricing, however, local network providers were faced with their second and
arguably most significant hurdle of 2020 – an unprecedented spike in data traffic
caused by the national lockdown instated on 26 March. With many South Africans
relying on some form of connectivity to earn a living and remain informed, some
operators reported almost 50% growth in mobile data traffic and more than 200%
growth in fixed data traffic over this period.

As a result of this exponential rise in data traffic, investment was triggered to
implement network upgrades and shift capacity towards the newly created
hotspots in residential areas. This sudden need for investment, however, came
about amid very tough economic conditions and put immense pressure on telco
margins and cashflows, especially considering their recent efforts to bring down
data prices.

Acknowledging this, South Africa’s telecoms regulator – the Independent
Communications Authority of South Africa (ICASA) – temporarily released
additional spectrum to assist telcos in dealing with the surge. Despite extending
this temporary spectrum to March 2021, ICASA insisted that all licensees which
had been assigned temporary spectrum and wished to continue using it for the
extended period would be required to pay prescribed spectrum licence fees.

What all this means is that the South African telecoms sector has faced – and
continues to face – multiple challenges. While the immediate focus will be to
survive, there is a need to lift heads from the woods, think beyond the crisis and
use it to position for success beyond it.

  BrandsEye                                                                       2
SOUTH AFRICAN TELECOMMUNICATIONS SENTIMENT INDEX 2020

Our analysis of the South African market indicates that reduced purchasing
power and downwards pressure on prices will continue to create a low margin
environment going forward. In response, telcos will focus on core products and
drive digital transformation to become lower-cost operators that are as digitised
as possible – prioritising customer facing processes and interactions in order to
differentiate through customer experience while maintaining spend.

Many companies, however, have struggled to maintain meaningful customer
relationships under lockdown conditions. This is where BrandsEye’s findings
will prove particularly valuable to network providers. Digital channels offer an
affordable, lockdown-proof and effective touch point with customers. Self-service
capabilities need to be expanded on to permanently convert walk-in customers
to more digital, asynchronous channels that deliver faster and better outcomes.

Some consumers that were reluctant to embrace digital interactions were forced
to use digital channels, and providing them with a user-friendly, proactive and
personalised experience means that many of them will opt for digital channels
even after the lockdown.

Mark Joseph,
Africa TMT Industry Leader

  BrandsEye                                                                       3
SOUTH AFRICAN TELECOMMUNICATIONS SENTIMENT INDEX 2020

Introduction

The telecommunications industry in South Africa is a highly competitive
environment in which players vie to attract and retain consumers who typically
show little brand loyalty and, instead, are looking to maximise the value they get
out of network providers.

In 2020, South Africans were considerably more negative towards telcos than banks,
insurers or retailers. While this could partly reflect the country’s high percentage
of mobile penetration, the difference in Net Sentiment for the telecoms industry
in comparison to these other industries is large enough to suggest dissatisfaction
among telecoms customers to be more pervasive.

Cross-industry Net Sentiment comparison

                                                                 4.0%

                                                                                       -1.0%
Net Sentiment %

                                      -16.3%

                          -34.6%

                         Telecoms     Banking                  Insurance               Retail

In our second South African Telecommunications Sentiment Index, having
tracked over two million social media posts, we continue to analyse consumer
sentiment towards the country’s four major network providers, namely
Vodacom; MTN; Telkom; and Cell C. This year, however, we also included the new
data-exclusive network, rain, into our analysis, in order to see how it compares
with the more established and traditional local players.

There are three major aspects through which network providers can offer value
to consumers: pricing; network quality; and customer service. The goal of this
study is to measure how South African network providers compare in terms of
these three aspects and ascertain who provides the most value in the eyes of the
consumer. Furthermore, it aims to determine how these aspects impact consumer
sentiment, as well as what drives sentiment towards each of them.

                  BrandsEye                                                        4
SOUTH AFRICAN TELECOMMUNICATIONS SENTIMENT INDEX 2020 When analysing the aspect of service, special focus is applied to the market conduct performance of South African telcos, particularly their adherence to the Treating Customers Fairly (TCF) framework. This focus area comes as a result of network providers increasingly delving into the financial services space, offering products ranging from cell phone insurance and funeral cover, to e-wallets and personal loans. BrandsEye 5
SOUTH AFRICAN TELECOMMUNICATIONS SENTIMENT INDEX 2020

Industry Net Sentiment analysis

In 2020, all five network providers saw considerably more negative than positive
conversation on social media. Nevertheless, some did significantly worse in Net
Sentiment than others.

Net Sentiment ranking

                                                                        -21.6%                                            MTN

                                                              -26.9%                                                      Cell C

                                                       -30.7%                                                             Vodacom

                                   -41.5%                                                                                 Telkom

     -58.3%                                                                                                               rain

              2020 Industry Net Sentiment average
                                           -34.6%

MTN claims top spot while rain lags behind
Having recorded the lowest negative sentiment and highest positive sentiment,
MTN ranked first in terms of Net Sentiment. Unexpectedly, Cell C – whose survival
came into question in 2020 – placed second. Newcomer rain lagged behind,
sitting over 20 percentage points below the overall Net Sentiment for the industry
(-34.6%) which aggregates all five telcos.

While rain went from approximately 100 000 customers in 2019 to about 800 000
in 2020, its share of the market remained marginal, as can be seen in the below
graph, which overlays Net Sentiment, share of voice (limited to Twitter) and the
most recent publicly available mobile subscriber numbers 1.

1.     Vodacom: https://www.vodacom.com/pdf/investor/quarterly-results/2021/vodacom-announcement-3Q21-final.pdf

       MTN: https://www.mtn.com/wp-content/uploads/2020/10/MTN-Group-Q3-results.pdf

       Cell C - Subscriber numbers estimated from: https://www.bluelabeltelecoms.co.za/online_results/interim-results-2021/
       pdf/interim-results-presentation.pdf; https://www.cellc.co.za/cellc/static-content/PDF/investorRelations/Interim_Financial_
       Results_2020.pdf

       Telkom: https://www.moneyweb.co.za/mny_sens/telkom-sa-soc-limited-market-update-for-the-nine-months-ended-31-
       december-2020/

       rain - Subscriber numbers estimated from: https://www.businesslive.co.za/bd/companies/telecoms-and-technology/2019-10-
       07-rain-takes-on-fibre-companies-with-5g-to-the-home/ ; https://mybroadband.co.za/news/cellular/367456-impressive-rain-
       numbers-released.html

      BrandsEye                                                                                                                      6
SOUTH AFRICAN TELECOMMUNICATIONS SENTIMENT INDEX 2020
Telco industry landscape
0%
-10%
-20%
MTN
Cell C 2020 Industry Net Sentiment average
-30% Vodacom -34.6%
Net Sentiment %
-40% Telkom
-50%
-60%
rain
-70%
0% 10% 20% 30% 40% 50% 60%
Share of voice in online conversation
The size of the bubbles indicate each network provider’s mobile subscriber base according to latest results
reported in 2020.
Despite overtaking Cell C as SA’s third largest network provider in 2020 in terms
of mobile customers, after seeing the most year-on-year customer growth in
the industry, Telkom placed second-last in Net Sentiment. Data complaints were
the network provider’s leading source of negative sentiment, as users grew
discontented with data prices and often noted not being able to use their data
due to network issues.
This serves as a good reminder that while growth is important, it must be seen
alongside customer satisfaction if telcos want to build the sort of loyalty that will
see their customers not just sticking with them, but hopefully also trusting them
as their financial service providers.
Dissecting conversation into operational and reputational issues provided a telling
look at what drove each telco’s overall Net Sentiment performance.
Reputational and Operational Net Sentiment comparison
-0.3%
-5.7%
-12.1% -12.1%
-16.2%
Net Sentiment %
-21.6%
-26.9%
-30.7%
-41.5
-47.2%
-54.3%
-58.3% -57.3%
-61.8%
-67.7%
Overall Reputational Operational
Cell C MTN rain Telkom Vodacom
BrandsEye 7SOUTH AFRICAN TELECOMMUNICATIONS SENTIMENT INDEX 2020
Across the board, operational conversation – from consumers who are in
the customer journey – was considerably more negative than reputational
conversation, which pertains to marketing content, press coverage, sponsorships
or general remarks about the brand’s reputation overall.
MTN, who topped the overall Net Sentiment ranking, was aided by its reputational
efforts, which accounted for 46.9% of overall positive conversation. Meanwhile,
Cell C, who placed second in overall Net Sentiment had its approach to customer
experience to thank for this. While operational complaints accounted for 61.4% of
Cell C’s overall negative conversation, this was the smallest proportion out of the
telcos in review.
Net Sentiment trends
In terms of monthly Net Sentiment, Cell C, rain, and Vodacom all saw a downward
trend over 2020, whereas MTN and Telkom’s Net Sentiment followed an upward
path.
Monthly Net Sentiment
0%
#WeGoodTogether #ExtraGigsForLess
campaign & free NSFAS
-10%
application
-20% Sponsored
#MTN1GB
Net Sentiment %
content
-30%
-40%
-50%
Turnaround, response,
-60% & network complaints
System outage & backlash
-70% over compensatory data
Turnaround, response,
& network complaints
-80%
Jan Feb Mar Apr May Jun Jul Aug Sep Oct Nov Dec
Cell C MTN rain Telkom Vodacom Lockdown level 5 Lockdown level 1
Cell C’s monthly Net Sentiment trends downward for 2020
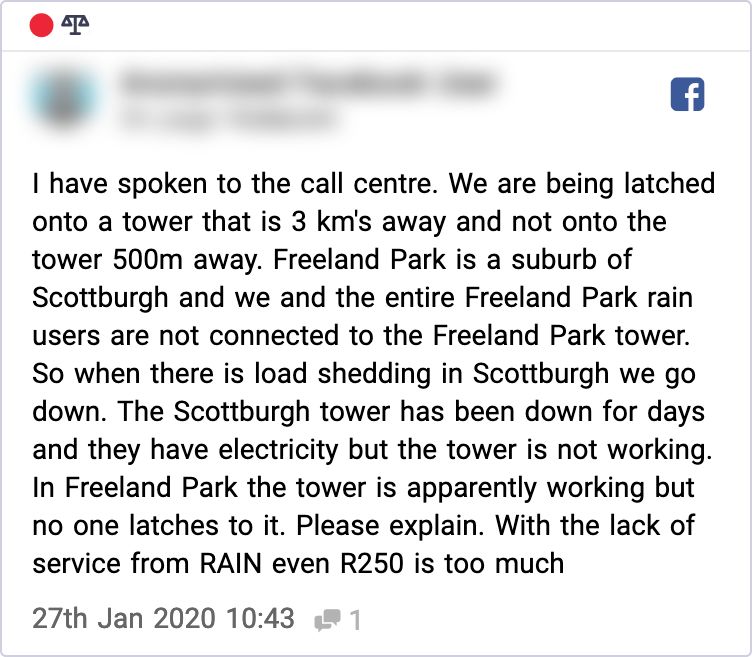
The first dip seen in Cell C’s Net Sentiment in June resulted from news of plans
to retrench 40% of its workforce. A post by @AdvoBarryRoux claiming Cell C had
failed to inform staff of a COVID-19 case in its head office, resulting in further
infections, which fuelled this negativity.
Cell C’s Net Sentiment peaked in August thanks to sponsored influencer content
which highlighted the network provider’s #ExtraGigsForLess deals. The deals
included a free GB when purchasing a 30-day 1 GB bundle, as well the extension
of five-day bundles into seven-day bundles. Engagement with a consumer post
BrandsEye 8SOUTH AFRICAN TELECOMMUNICATIONS SENTIMENT INDEX 2020 highlighting that students could apply for the National Student Financial Aid Scheme for free with Cell C added to the positivity seen in August. Retrenchment plans led to an even more pronounced dip in October and November, as consumers accused Cell C of planning to carry out retrenchments without audited finances and of intending to replace retrenched employees with outsourced staff. Consumers reached out to the EFF for support, and encouraged others to boycott Cell C. MTN records the steepest upward trend MTN recorded its lowest Net Sentiment for 2020 in May, when some users reported having been double debited, while system and network downtime drove further consumer unhappiness. Additionally, UNISA students reported delays in receiving data promised to them to assist with their May/June examinations. However, the neutral engagement – social conversation that was neither overtly negative, nor positive – derived from MTN’s recognition of everyday pandemic heroes through its #WeGoodTogether campaign, offset complaints and boosted Net Sentiment in June. MTN’s Net Sentiment was at its highest in December, during which the network provider relied on affiliated content to promote its offer of a free GB when downloading its mobile app and festive season data deals. rain records the steepest downward trend At the start of 2020, rain users shared positive experiences with the network provider, particularly around its unlimited data deals and 5G offering, boosting Net Sentiment over the January and February period. Purchase interest further contributed to the high Net Sentiment during this period. In April, coinciding with the beginning of lockdown, rain saw its largest month-on- month Net Sentiment decline. Customers reported delays in service turnaround; lack of response from the network provider; and poor network quality. These issues continued to drive the most negative sentiment for the remainder of the year. BrandsEye 9
SOUTH AFRICAN TELECOMMUNICATIONS SENTIMENT INDEX 2020

Telkom one of two providers to see an upward monthly trend

Telkom’s Net Sentiment took a tumble in February, due to a major network outage
and subsequent complaints about the compensatory data offered to users in
retribution for the inconvenience – users felt cheated after reportedly not receiving
or being unable to use the free data. Complaints around poor customer service
turnaround and response, and engagement with a consumer post poking fun at
the Telkom’s network quality, drove a second dip in August.

Net Sentiment for Telkom peaked in October. While no unusual levels of positive
sentiment were recorded during this month, the network provider drove significant
neutral engagement through various giveaways as part of its #LiveYourMonate
anniversary campaign.

Vodacom’s Net Sentiment relatively stable throughout 2020

Vodacom drove positive sentiment in August through affiliated content on its
NXT LVL career expo and youth-exclusive data deals. Meanwhile, data giveaways
in partnership with its sponsored soccer teams drove neutral engagement in
September, which in turn improved Net Sentiment.

Net Sentiment was at its lowest over November and December. This is because
Vodacom users were hit by widespread network downtime twice in November,
while poor service responsiveness and vanishing data complaints impacted Net
Sentiment in December. Consumers also complained about Vodacom’s ShakeOff
puzzles, claiming they were impossible to complete.

  BrandsEye                                                                       10
SOUTH AFRICAN TELECOMMUNICATIONS SENTIMENT INDEX 2020

Industry risk analysis

Downtime and accusations of unethical behaviour
drove similar levels of risk across the industry
Across the telecoms industry, downtime and accusations of unethical behaviour
were the two largest sources of risk, having seen largely the same volume of
conversation. Risk here refers to mentions that pose an immediate reputational
or operational risk and, as such, require urgent attention.

Biggest risk drivers across the industry

             Downtime          Accusations of unethical   Protests or boycotts   Threatening legal or        Discrimination
                               behaviour                                         regulatory action

Industry     47.2%             46.9%                       3.6%                   2.6%                        1.2%

Cell C       39.8%             43.5%                      16.5%                   2.4%                        1.5%

MTN          30.7%             58.9%          `            5.4%                   3.0%                        2.5%

rain         64.5%             32.9%                       1.5%                   3.8%                        0.3%

Telkom       55.7%             40.0%                       1.9%                   2.4%                        1.2%

Vodacom      40.0%             56.8%                       1.5%                   1.6%                        1.0%

rain faced a considerably higher prevalence of risk conversation due to downtime
– further evidencing network quality as one of its major weaknesses – while both
MTN and Vodacom saw above-industry levels of risk related to accusations of
unethical behaviour. Reports of data vanishing, or depleting abnormally, were the
main source of these accusations for both operators.

As previously highlighted, Cell C staff’s response to their employer’s retrenchment
plans was reflected in the operator’s high prevalence of boycott-related risk.

   BrandsEye                                                                                            11
SOUTH AFRICAN TELECOMMUNICATIONS SENTIMENT INDEX 2020
Customer perceptions of value
Customer service is an industry-wide issue, and an
opportunity for differentiation
When comparing the three aspects of customer value; namely, pricing, network
quality, and customer service; service emerged as the area that most negatively
impacted sentiment towards the South African telecoms industry in 2020. While
network also played a significant role in the negativity seen online towards the
industry, pricing had a relatively marginal impact on industry Net Sentiment.
Considering the telcos’ poor Net Sentiment performance in relation to other local
industries, this points at customer service as the area that could most hinder
network providers’ ability to compete in a market that is increasingly seeing brands
adopt a cross-industry strategy. Examples of this can be seen in FNB Connect and
PnP Mobile.
Net Sentiment for the topics of customer service, network coverage/quality
and pricing
SERVICE NETWORK PRICING CUSTOMER VALUE
NET SENTIMENT NET SENTIMENT NET SENTIMENT SCORE
Cell C -86.9% -83.3% -19.2% -13.9%
MTN -90.1% -71.4% -28.3% -18.2%
rain -91.8% -85.4% -42.0% -32.9%
Telkom -92.8% -88.2% -49.8% -40.8%
Vodacom -87.1% -85.2% -60.8% -45.1%
This table summarises each network provider’s Net Sentiment for the topics of customer service, network
coverage or quality and pricing. It then multiplies these scores to obtain a combined customer value score.
In terms of customer value, Cell C offered the best value in the eyes of South African
consumers, holding a marginal lead in service; placing second in network; and
leading strongly in pricing. MTN who did relatively well in network and was middle
of the pack in service, placed second in customer value perception. Vodacom,
Telkom and rain were all ranked lower in terms of customer value, having placed
among the bottom two in at least one of the three customer value components.
BrandsEye 12SOUTH AFRICAN TELECOMMUNICATIONS SENTIMENT INDEX 2020
Service
A month into lockdown, service complaints saw a steep increase, remaining
consistently above pre-lockdown levels for the rest of the year. While this could
indicate that increased reliance on connectivity upped expectations and demand
for service, it could also suggest network providers were unable to maintain the
same level of pre-pandemic service during lockdown.
Service complaints as a percentage of industry-wide negative conversation
Contribution to overall negative conversation
40%
35%
30%
25%
20%
15%
10%
5%
0%
Jan Feb Mar Apr May Jun Jul Aug Sep Oct Nov Dec
Monthly trend in service complaints Lockdown level 5 Lockdown level 1
The industry’s leading drivers of service complaints spoke to a need for improved
customer service responsiveness. Turnaround time was discussed in the bulk
of these complaints and largely drove reports of lack of response from network
providers and of having to contact them multiple times in order to get assistance.
Top drivers of service complaints for telcos
Turnaround time No response received Multiple contacts Feedback given by a Placed on hold/call
brand representative dropped/not answered
Industry 81.9% 37.8% 31.2% 17.5% 11.7%
Cell C 74.4% 26.5% 30.3% 27.2% 10.8%
MTN 82.1% 31.8% 31.1% 19.7% 17.3%
rain 91.4% 55.6% 35.1% 9.5% 7.9%
Telkom 81.2% 29.7% 28.6% 20.3% 14.9%
Vodacom 68.2% 23.1% 26.8% 23.7% 11.2%
BrandsEye 13SOUTH AFRICAN TELECOMMUNICATIONS SENTIMENT INDEX 2020
rain received the highest proportion of complaints for the industry’s top three
service-related categories, suggesting their affordability approach came at the
expense of customer experience.
An analysis on response rates highlighted Cell C as the most responsive network
provider on Twitter. This suggests Cell C’s service agents are engaging more
actively with customers and could explain why its customers cited feedback given
by brand representatives in their service complaints more often than other telcos.
MTN customers appeared to struggle the most when trying to contact their
network provider telephonically. These complaints increased steadily from April
to June, suggesting the initial stages of lockdown impaired MTN’s call centre.
Network providers should take note of their sources of service complaints, as
these often lead to cancellation risk.
The top drivers of cancellation risk in the telco industry largely mirrored the
leading sources of service complaints, highlighting the close relationship between
service quality and customer retention.
Top drivers of cancellation threats for telcos
Turnaround time 45.1%
Multiple contacts 22.3%
Data 18.9%
No response received 17.7%
Brand comparisons 15.7%
Percentage of total cancellation conversation
BrandsEye 14SOUTH AFRICAN TELECOMMUNICATIONS SENTIMENT INDEX 2020
Difficulties in cancellation were an industry-wide issue, also driving turnaround
time complaints. Users reporting vanishing data and looking for more affordable
data were other major sources of cancellation threats.
Cancellation risk outweighed purchase interest
Across the industry, the percentage of authors at risk of cancellation was 3.0%
versus those expressing purchase interest at 2.0%.
Purchase interest vs cancellation risk
6.2%
4.7%
3.7%
% of unique authors
2.9% 3.0%
1.8% 2.0%
1.5% 1.7%
1.0%
-0.2 pp -0.3 pp
-1.0 pp
-1.5 pp
-1.9 pp
Cell C MTN rain Telkom Vodacom
Purchase Cancel Potential net churn
Out of the five operators, Telkom recorded the highest potential net churn, with its
high cancellation risk likely reflecting its shrinking fixed subscriber base.
rain, who saw its subscriber base grow from around 100 000 to approximately 800
000 in the span of a year, recorded both the highest proportion of purchase and
cancel conversation. This suggests the newcomer could see its growth slow down
or even reverse if it fails to address the issues driving its high cancellation risk,
namely poor customer service and network quality.
Notably, the country’s two largest providers – MTN and Vodacom – recorded
the lowest levels of both purchase interest and cancellation risk. With regards
to purchase interest, this is mostly due to people seeking more affordable deals
at the smaller providers. However, the relatively low percentage of conversation
around cancelation suggests that MTN and Vodacom are doing well in terms of
customer retention, in comparison to the smaller telcos.
BrandsEye 15SOUTH AFRICAN TELECOMMUNICATIONS SENTIMENT INDEX 2020
Traditional touchpoints generate bulk of social media
complaints
Volume of social media complaints generated by traditional vs digital
channels
76.0% 73.7%
71.5%
Contribution to negative channel
65.3% 67.5%
conversation
32.5% 34.7%
28.5% 26.3%
24.0%
Traditional Digital
Cell C MTN rain Telkom Vodacom
Complaints about traditional channels outweighed negative conversation towards
digital channels in the telecoms industry, indicating a higher reliance on traditional
touchpoints among telco customers. The bulk of these complaints are related to
call centres.
With telcos likely to face a contracted economy and further regulation on prices,
digitising the customer experience could ease pressure on margins. However, the
reliance of telco customers on traditional channels could prove a hurdle in this
shift towards digitised customer service.
While rain has struggled with teething problems in terms of customer service,
their experience with digital channels could give them a competitive advantage
when the rest of the industry is forced to accelerate their digital transformation
CX efforts.
Priority conversation comparison across telcos
62.1%
Industry priority conversation
Volume %
33.7%
29.8% 31.6%
25.8% 28.2%
Cell C MTN rain Telkom Vodacom
n = 55 371 n = 108 856 n = 59 189 n = 205 824 n = 208 131
BrandsEye 16SOUTH AFRICAN TELECOMMUNICATIONS SENTIMENT INDEX 2020
One in every three online mentions in the telecoms industry posed a risk or
consisted of a service request; an acquisition opportunity; or a cancellation threat
– all of which are seen as priority conversation and require a response from
network providers.
This means that two-thirds of online conversation about network providers was
noise to social customer service teams, hindering their ability to prioritise the
mentions which did warrant a reply.
Notably, the proportion of rain’s conversation that required a response was nearly
double the industry average.
Twitter response rate and time comparison
Twitter response rate comparison Twitter response time comparison
Cell C 64.7% Cell C 1.7
MTN 50.5% MTN 18.2
rain 46.7% rain 15.0
Telkom 25.0% Telkom 66.4
Vodacom 60.4% Vodacom 3.9
Percentage of priority mentions replied to Average time to first reply in hours
Cell C replied to the largest portion of its priority conversation while also responding
to customers in the shortest time out of the telcos in review.
Telkom, the only state-owned enterprise (SOE) in the mix, appeared unable to
compete with its private rivals when it came to online responsiveness.
Monthly response rate and priority conversation in the telecoms industry
70%
Priority conversation volume % and % of
60%
56.9%
priority mentions replied to
50%
40%
30%
20%
Jan Feb Mar Apr May Jun Jul Aug Sep Oct Nov Dec
Priority conversation Response rate Lockdown level 5 Lockdown level 1
BrandsEye 17SOUTH AFRICAN TELECOMMUNICATIONS SENTIMENT INDEX 2020
Unlike what BrandsEye observed in the retail banking industry, where the
implementation of lockdown resulted in an immediate surge in priority
conversation, the telecoms industry saw a delayed increase in customer queries,
which only began in May. It’s likely that, as restrictions were eased to level 4 at
the start of May – allowing the purchase of more than just groceries and with the
prospect of a long lockdown ahead – consumers looked for ways to stay connected
at home. May also brought about the lift of the ban on mobile porting.
Telcos fail to keep up with customer queries on social
media
In contrast, the introduction of the lockdown resulted in an initial drop in
online responsiveness in the telecoms industry, which was promptly followed
by a recovery rally. Nonetheless, despite network providers’ efforts to improve
response, more than half of all mentions requiring a response from network
providers did not receive one in 2020.
This evidences the telecoms industry has yet to put the adequate systems in place
to deal with the volumes of customers reaching out through social media.
Industry response rate by priority category
48.0%
45.7%
42.4%
Percentage of mentions replied to
34.7%
Risk Purchase Cancel Service
Counterintuitively, mentions expressing purchase interest saw the lowest
response rate out of all categories of mentions warranting a response, with two
thirds of these going unanswered. Authors expressing purchase interest, however,
accounted for only 2% of consumers speaking about telcos, making it particularly
challenging for network providers to surface them.
BrandsEye 18SOUTH AFRICAN TELECOMMUNICATIONS SENTIMENT INDEX 2020 Service - Deloitte Commentary As technology is advancing and new developments continue to enhance our lives, consumer behaviour has evolved, and customer service expectations have risen. Although a service is intangible, it is the experience that makes the lasting impact, and modern-day consumers expect better, faster, and more personalised service at all levels. In 2020, downtime of networks was a pervasive challenge for telcos, which would directly impact customer service. One of the biggest influences on customer experience is reliability to ensure an “always on” experience. This means that regardless of the circumstances, the network will continue to perform its intended function. As the country went into lockdown, we saw that the incidence of service complaints dramatically jumped from just under 25% to close to 40%. There are many factors that likely contributed to this spike, but none more than the surge in demand placed on the infrastructure. This could also have had a direct impact on the increase in downtime which led to the increase in service complaints. It is evident that the spike in service complaints is not a unique occurrence as all five providers experienced this since the country went into lockdown, with only a few recovering close to “pre-lockdown” percentages. Today, however, the network capacity – using data from previous years – would be able to better determine an accurate forecast for capacity given the past year, which could be a good indication for future capacity requirements while the country continues to work through the lockdown. The majority of complaints are classified under turnaround time. It is that responsiveness that a customer is so desperately looking for to have the assurance that their issue was acknowledged and that the service will be restored in an acceptable timeframe. BrandsEye 19
SOUTH AFRICAN TELECOMMUNICATIONS SENTIMENT INDEX 2020

As increasingly more customers are utilising social media platforms to stress their
frustrations, it is important to have a great response on these platforms and to
use the channel to inform customers of possible downtime. Not only will this
ensure that customers are informed, but with customers looking to social media
platforms to create more visibility of their issues, it is vital for network providers to
respond quickly, and with accurate information to stop possible future complaints.

Service quality is and will remain critical going forward. It is the act or deed that
is performed continuously that is reliable and consistent, and will create powerful
human experiences to help providers understand throughout the service lifecycle
where customers have good or bad experiences.

Jacques Compaan,
Business for Tech Transformation Lead,
Deloitte Africa

  BrandsEye                                                                           20
SOUTH AFRICAN TELECOMMUNICATIONS SENTIMENT INDEX 2020

Network
Network complaints were at their highest in February, as Vodacom and Telkom
clients were hit by network outages due to load shedding.

Network complaints as a percentage of industry-wide negative
conversation
% of overall negative conversation

                                       40%
                                                                                      ICASA issues
                                       35%
                                                                                   emergency spectrum
                                       30%
                                                   Telkom and Vodacom
                                       25%           network outages
                                                   due to load shedding
                                       20%

                                       15%

                                       10%

                                        5%

                                        0%
                                             Jan            Feb        Mar           Apr            May            Jun         Jul            Aug    Sep           Oct           Nov             Dec

                                                                          Monthly trend in network complaints              Lockdown level 5                      Lockdown level 1

As many consumers were forced to work and study from home during the
lockdown, network operators faced a surge in traffic. However, this did not
translate into an increase in network-related complaints, suggesting providers
largely were able to meet the rising demand for connectivity. Network providers
were aided in this effort by ICASA, who assigned emergency temporary spectrum
to telecommunications operators to deal with network demand during the
COVID-19 crisis.

While Net Sentiment for network was very negative across all providers, MTN
led in terms of network quality. Vodacom – who is at the very top of the pricing
spectrum and from whom most would expect premium connectivity – recorded
virtually the same network Net Sentiment as rain, who despite sharing a roaming
agreement, has a price per GB that is half that of Vodacom’s.

Quality, speed and coverage Net Sentiment comparison
Net Sentiment %

                                                                                                          -29.8%
                                                                                                                                                             -41.0%
                                                                                                                                                                      -47.0%
                                                                                                                                                                                        -57.8%
                                                                                                                                     -69.6%         -68.8%
                                                                                              -76.7%
                                                                                                                                                                               -80.2%
                                                   -85.8%                                                          -84.7% -84.9%
                                        -92.6%              -94.8% -94.5% -93.1%

                                                            Quality                                                Speed                                           Coverage

                                                                                           Cell C     MTN          rain    Telkom       Vodacom

                                     BrandsEye                                                                                                                21
SOUTH AFRICAN TELECOMMUNICATIONS SENTIMENT INDEX 2020
MTN outperformed every provider in all three of the drivers of network
conversation. While it saw only a small advantage in quality, it was speed and
coverage with which consumers were most satisfied. Consumers praised MTN for
its 5G speeds and engaged with news it had once more been named ‘best mobile
network’ in SA for data speeds by MyBroadband. Positive coverage conversation
came from Telkom users, who noted their roaming experience was better before
Telkom switched from MTN to Vodacom as its roaming partner.
rain’s relatively high Net Sentiment for coverage resulted from purchase interest
rather than customer experience, with customers looking to join the network and
querying about or requesting coverage in their area.
Net Sentiment in load shedding conversation
Net Sentiment %
-53.1% -51.5%
-67.9%
-71.7% -69.9%
Cell C MTN rain Telkom Vodacom
Both Cell C and MTN saw considerably higher Net Sentiment in load shedding
conversation when compared to other network providers, suggesting their users
were the least affected by power outages and further explaining why these
operators did the best in overall network Net Sentiment.
A common theme behind MTN’s relatively high Net Sentiment in load shedding
conversation was that its network was the most reliable during load shedding.
This conversation came from both MTN and their competitors’ customers.
BrandsEye 22SOUTH AFRICAN TELECOMMUNICATIONS SENTIMENT INDEX 2020 Network - Deloitte Commentary The majority of mobile network customers expect speed as a priority when it comes to network quality. The network, however, is often blamed for service interruptions, without realising that “the network” is a complex construct where mathematics, physics and hundreds of protocols dance in harmony together with thousands of variables – each of which can potentially cause a service interruption. The good news from the report is that network complaints were on the decline over most of 2020. This might be linked to the mass migration of customers to Fibre to the Home (FTTH) networks. On paper, a fixed-line network outperforms the mobile equivalent in terms of speed and quality delivered. With the majority of the workforce adapting to a work-from-home environment in 2020 (where fibre is available), and the new FTTH connection numbers on a very steep rise, this might explain the reduced number of network complaints. Another possible explanation might be the additional spectrum that was made available by ICASA for the mobile operators to use. More spectrum means more transport capacity, which in turn means higher throughput – in the end, this translates to higher quality of service delivered to the end user. We are also seeing a lot of artificial intelligence (AI) and machine learning algorithms being applied to the telco networks for multiple purposes. Are these algorithms starting to return positive results by helping telcos predict and fix network quality automatically without human intervention, resulting in fewer network-related outages and thus less network-related complaints? We would not be surprised. A major concern is the volume of network-related complaints about rain, whose 5G offering has driven much consumer interest. Could this high number of network complaints be related to the fact that telco operators are overpromising and underdelivering on the true capabilities of 5G? If consumers are unable to enjoy the network speeds promised due to slow, poor-quality networks, they will naturally be dissatisfied. BrandsEye 23
SOUTH AFRICAN TELECOMMUNICATIONS SENTIMENT INDEX 2020

Another major concern is the poor quality experience during load shedding.
This should not be the case at all. We live in Africa where we have mastered
the management of redundant power on the sites, and surely understand the
importance of this. Operators could overcome network quality issues linked to
load shedding and this does not only refer to power on site. Their networks (RAN
and Backhaul) should have the ability to instantly adapt to major changes without
affecting the network performance or quality delivered. For the operators, the
correct application of self-organising networks should not be a question of when,
but how they can continuously improve and learn to adapt faster with every power
outage.

Network providers who are serious about a customer-centric organisation, should
use these results together with their internal deep dive analysis on their network’s
quality and performance in order to pinpoint and address the real network
problems. The focus should not only be on the network operations’ side of things,
but also on the service level and quality of service monitoring and improvement,
for example, the introduction of a SOC (Service Operating Centre). The SOC can be
one of the most important steps in the operators’ transition towards a customer-
centric organisation and should be at the heart of an operator’s customer
experience management strategy.

The network is the pride of the operator. Operators should not view investment
into the quality of the network as optional, but as an investment into its customers.
Delivering quality of service to customers is the secret to a sustainable future
operating model for any network provider. Operators could use these results
and plan for improvements, if their AI and machine learning algorithms have not
already done so.

Stefanus van der Merwe,
Operations Transformation,
Deloitte Africa

  BrandsEye                                                                       24
SOUTH AFRICAN TELECOMMUNICATIONS SENTIMENT INDEX 2020

Pricing
Despite lockdown restrictions delivering a devastating blow to an already impaired
South African economy, the prevalence of pricing complaints decreased overall in
2020.

Pricing complaints as a percentage of industry-wide negative conversation

                                                  20%
Contribution to overall negative conversation

                                                      CompComm published its data
                                                    pricing inquiry findings in Dec 2019
                                                                                            Vodacom’s new data                                                   Negativity around
                                                  15%                                      prices come into effect                                                MTN’s SA prices

                                                  10%
                                                                                MTN’s new data prices
                                                                                  come into effect
                                                   5%

                                                   0%
                                                        Jan       Feb         Mar            Apr        May          Jun       Jul        Aug   Sep        Oct         Nov            Dec

                                                                                  Monthly trend in pricing complaints      Lockdown level 5            Lockdown level 1

Pricing complaints were at their highest over the first quarter of 2020, largely the
result of the Competition Commission’s inquiry into data prices and subsequent
negotiations with network providers. The Commission’s findings fuelled consumer
discontent with data prices in South Africa.

Over the second quarter, both MTN and Vodacom implemented significant price
cuts on data, coinciding with a steep drop in pricing complaints, which remained
stable across the third quarter of 2020. Pricing complaints, however, picked up
again over the last quarter of the year, mainly driven by dissatisfaction with MTN
prices in South Africa, when compared to other African countries, which led to a
call to boycott the telco.

Pricing Net Sentiment ranking

                                                                                                                                 -19.2%                                      Cell C

                                                                                                                -28.3%                                                       MTN

                                                                                    -42.0%                                                                                   rain

                                                                 -49.8%                                                                                                      Telkom

                           -60.8%                                                                                                                                            Vodacom

                                                BrandsEye                                                                                             25
SOUTH AFRICAN TELECOMMUNICATIONS SENTIMENT INDEX 2020
Cell C recorded the highest positive sentiment and least negative sentiment
towards pricing, putting it at the top of the ranking in this aspect of customer value.
While affiliated content around its #ExtraGigsForLess and #AllInOneBundles data
deals contributed significantly to its leading pricing Net Sentiment, comparisons to
Vodacom’s updated data prices gave it the edge in pricing.
Despite reducing data prices by up to 40% following the Competition Commission’s
inquiry into data prices in SA, Vodacom saw the worst Net Sentiment in pricing
conversation for 2020.
Top drivers of pricing complaints across the industry
Affordability Special offers Changes in pricing Free data Fees or changes
Industry 74.7% 16.8% 11.0% 1.7% 1.1%
Cell C 73.6% 8.2% 12.6% 1.1% 2.0%
MTN 81.0% 10.4% 13.2% 3.6% 1.0%
rain 61.1% 8.3% 6.0% 0.6% 2.9%
Telkom 59.9% 41.5% 9.6% 0.7% 1.1%
Vodacom 82.6% 8.6% 10.5% 0.8% 0.7%
Vodacom saw the highest prevalence of affordability complaints in the industry.
Following their price cuts, some consumers felt that at R99 for 1GB, the provider’s
data prices were still unaffordable.
Another common theme in Vodacom’s affordability complaints were comments
about the network quality, with consumers noting they paid too much to have to
struggle with network issues. This shows how pricing and network influence each
other.
Despite being a major source of positivity for Telkom when they were first
introduced, the subsequent unhappiness around the Mo’Nice deals reflected in
its high prevalence of special offers complaints, as consumers felt the deals were
arbitrary and worsened over time.
BrandsEye 26SOUTH AFRICAN TELECOMMUNICATIONS SENTIMENT INDEX 2020 Pricing - Deloitte Commentary 2020 was an eventful year for both data prices and growth in data demand. Given the difficulties of merely reducing prices, such as revenue cannibalisation and share price pressure, the market also saw some movement towards providing customers with a more distinct value proposition and an increased interest in the importance of differentiating on customer service. Effective 27 March 2020, the enforced lockdown drove the demand for increased data volumes and improved download speeds, while the two largest mobile operators provided a ±33% decrease in headline data tariffs. Unfortunately, the reduction in mobile tariffs was not in response to the COVID-19 pandemic or a radical pricing strategy, but a mere compliance to the Competition Commission’s Data Services Market Inquiry. Following a decision by the Competition Commission in December 2019, MTN and Vodacom were instructed to reduce their prices by 30- 50%. After discussions with the Commission, Vodacom reduced its headline 1GB data, valid for 30 days price by ±34% to R99 per GB on the 1st of April 2020. This price point was extremely close toCell C’s price point initiated in 2018. It could therefore be argued that some of Vodacom’s pricing decisions might have been a mere price match of Cell C’s price point. MTN followed a month later and matched Vodacom’s price. These price changes happened to coincide with the start of lockdown, which increased people’s dependency on data as they were forced to work and participate in educational activities from home. Almost serendipitously, these price reductions supported customers to better manage the increased demand in home data usage. While this price reduction coincided with a 7pp decrease in pricing complaints, these low levels of price complaints were short lived and pre-price reduction complaint levels were seen in December 2020. A fundamental driver of increased price complaints can be attributed to the public comparison of data rates for MTN SA versus MTN Nigeria on social media. BrandsEye 27
SOUTH AFRICAN TELECOMMUNICATIONS SENTIMENT INDEX 2020

Pricing, coupled with the perceived service customers receive, culminate in a value
proposition. During 2020, Cell C scored the highest on the aspects of “pricing
Net Sentiment”, “customer value perception” as well as “service Net Sentiment”.
The public’s perception of Cell C is fascinating when seen against the backdrop
of their large decline in mobile subscribers, and the subsequent high increase in
subscriber numbers at Telkom mobile.

During 2020 Telkom became the third-largest mobile provider by subscriber
numbers. Even though Cell C’s subscriber numbers fell between 28% and 30%,
the revenue decline over the same period was only about 10%. This implies the
customers who were retained were higher-value customers and the average
revenue per user (ARPU) indeed increased by close to 27% over the period. This
smaller, higher-value subscriber base could be making it easier for the operator to
service them and drive the improved service perception.

The opposite could be true for Telkom, where a large influx of subscribers might
overextend their service teams and perhaps their network. This culminates in a
“customer value perception” which only managed to beat Vodacom. Vodacom
experienced the poorest customer value perception in 2020. Since it predominantly
has quite similar above-the-line price points than other mobile operators in the
market, the difference is perhaps the combination of “network Net Sentiment”
coupled with “pricing Net Sentiment” which upset their customers.

Despite the mandatory data price reductions enforced by ICASA in 2020, data
pricing in South Africa remains high compared to many African countries and
most of the barriers to entry persist. Three of these barriers are the cost of smart
devices compared to the spending power of the average South African, share price
pressure, and the lack of spectrum. All three of these aspects are closely related
to South Africa’s current political and economic environment. The expectation for
2021 is for network operators to focus more on providing tangible value, expand
the range of offerings and improve the customer experience instead of leading
with above the line data price reductions.

Theo Kotzé,
Analytics and Cognitive,
Deloitte Africa

  BrandsEye                                                                      28
SOUTH AFRICAN TELECOMMUNICATIONS SENTIMENT INDEX 2020

Maket Conduct

Treating Customers Fairly (TCF) is an outcomes-based regulatory and supervisory
approach designed to ensure that regulated financial institutions deliver specific,
clearly set out fairness outcomes for financial customers.

As highlighted in this report, customer service has proven to be the biggest
challenge for SA network providers when it comes to providing customer value.
The TCF approach could, therefore, assist telcos in improving their relationship
with customers, as well as avoid potential legal action in the future.

Furthermore, it’s likely that TCF will eventually become applicable in the telecoms
space, as it has in the United Kingdom – where the framework originated – providing
those network providers who adopt it early with a competitive advantage.

Percentage of complaints linked to TCF outcomes per bank

                                                   92.5%

                                                                         82.7%
                             81.7%
        80.3%
                                                                                          78.2%

         Cell C               MTN                   rain                 Telkom         Vodacom
       n = 64 080          n = 129 633           n = 58 385          n = 255 852        n = 215 989

While Telkom, followed by Vodacom, received the highest volume of TCF
complaints through social media, it was rain who saw the highest proportion of
TCF complaints relative to volume of conversation.

As previously highlighted, this could partly reflect rain’s digital business model,
which would result in higher volumes of digital conversation in the absence of
physical branches. However, the discrepancy in this percentage when compared
to other providers suggests that this digital-focused model is not yet able to
adequately service customers.

  BrandsEye                                                                        29
SOUTH AFRICAN TELECOMMUNICATIONS SENTIMENT INDEX 2020
90.7% of social media complaints included TCF
outcomes
Share of TCF-relevant complaints in negative priority conversation
90.7%
TCF Other negative conversation
The bulk of priority complaints fell within one or more of the six outcomes of
TCF, which highlights the applicability of the framework for the telecoms industry
beyond its financial services offering. It also shows that the industry has a long
way to go in treating customers fairly.
To put the previous statistic into perspective, TCF complaints warranting a
response from network providers accounted for nearly a quarter of all online
consumer conversation (24%), which equates to nearly half a million consumer
mentions in 2020.
Telcos’ response rates to TCF-related complaints
Cell C 70.1%
MTN 52.1%
rain 50.7%
50.0%
Telkom 26.0%
Vodacom 64.6%
Percentage of TCF complaints replied to
TCF complaints with a reply
TCF complaints without a reply
BrandsEye 30SOUTH AFRICAN TELECOMMUNICATIONS SENTIMENT INDEX 2020
Half of all TCF-related complaints on social media went
unanswered
As previously noted, responsiveness has proven a major challenge for network
providers, and TCF complaints were no exception. Cell C and Vodacom replied to
the largest proportion of TCF complaints, while Telkom neglected three quarters
of the TCF-relevant complaints it received on social media.
Outcome 5, which speaks to performance of products and service, was the leading
driver of TCF complaints, with product and service-related complaints driving
similar volumes of conversation. Complaints about the performance of products
and service, however, saw little overlap between the two, suggesting they are
areas needing to be addressed separately.
Volume of TCF-related complaints
84.8%
% of TCF complaints
17.6% 15.2%
4.5%
1.6% 1.7%
OUTCOME 1 OUTCOME 2 OUTCOME 3 OUTCOME 4 OUTCOME 5 OUTCOME 6
Culture & governance Product suitability Disclosure Suitable advice Performance & service Claims, complaints &
changes
When it came to product performance, consumers most often cited network issues
and disappearing data for their complaints. Meanwhile, as previously highlighted,
turnaround time was the industry’s main customer service pain point.
Turnaround time requires attention
Turnaround time was the main source of TCF complaints relating to culture and
governance; disclosure; performance & service; and claims, complaints & changes,
while also having a major contribution to complaints around the suitability of
advice. Improved responsiveness would therefore not only boost consumer
sentiment, but also assist network providers in reducing the TCF risk they would
face if the framework were to be implemented in the telecoms industry.
BrandsEye 31SOUTH AFRICAN TELECOMMUNICATIONS SENTIMENT INDEX 2020
TCF outcome by network provider
Outcome 1: Outcome 2: Outcome 3: Outcome 4: Outcome 5: Outcome 6:
Culture & Product suitability Disclosure Suitable advice Performance & Claims, complaints &
governance service changes
Industry 4.5% 17.6% 1.6% 1.7% 84.8% 15.2%
Cell C 5.4% 16.3% 1.8% 2.9% 83.4% 19.0%
MTN 5.7% 24.6% 2.6% 1.8% 77.4% 13.7%
rain 2.3% 9.0% 1.4% 0.6% 95.3% 14.4%
Telkom 3.5% 17.3% 1.0% 1.5% 85.0% 16.4%
Vodacom 6.6% 22.5% 1.6% 2.4% 79.8% 13.5%
Vodacom vanishing data leads to accusations of
unethical behaviour
As highlighted in the risk analysis, Vodacom faced the most risk relating to reports
of vanishing data, as this often led to accusations of unethical behaviour. This,
however, also negatively impacted the perception of the telco’s governance and
culture.
MTN saw the highest prevalence of product suitability and disclosure complaints,
which largely revolved around its data prices and data expiring or depleting
abnormally.
Cell C’s high incidence of complaints around the feedback provided by brand
representatives also reflected in its relatively high volume of complaints around
advice suitability. It appeared both were driven by the frequency with which Cell
C’s social service agents engage with customers. Meanwhile, reports from Cell C
users struggling to cancel their contracts reflected in its relatively high incidence
of complaints around outcome 6.
rain customers complained of poor performance and
service
While all providers saw the bulk of their TCF complaints relating to product
performance and service, rain had the highest proportion of complaints for this
outcome. This aligns with other findings in this study that speak to rain customers
dealing most often with both poor service responsiveness and network quality.
Call centres were the most discussed channel for all six outcomes; however,
complaints around culture & governance and suitable advice mentioned call
centres the most. Customers who struggled to get resolution through the call
centre often questioned their provider’s ability to deliver service and referenced
feedback provided by call centre agents.
BrandsEye 32SOUTH AFRICAN TELECOMMUNICATIONS SENTIMENT INDEX 2020
Similarly, customers often referenced the feedback provided by in-branch staff
in their TCF complaints, denoting the importance of call centre and branch staff
training in complaint handling. Meanwhile, customers often cited information
provided in emails and on network providers’ websites when raising complaints
about disclosure.
Consumers markedly more negative towards telcos’
financial services than telecoms products
When comparing conversation sentiment about financial services offered by
network providers, to sentiment in conversations about other telecoms products,
the former saw a considerably lower Net Sentiment.
Sentiment towards financial services and telecoms products
97.4%
76.3%
23.7%
2.6%
-52.6%
-94.8%
Financial services Telecoms products
Positive Negative Net
However, negative conversation around financial services showed many of the
same issues impacting overall customer service in the industry, with turnaround
time accounting for 79.8% of complaints. The topics of multiple contacts and
no response received drove 42.1% and 28.1% of financial services complaints,
respectively.
BrandsEye 33SOUTH AFRICAN TELECOMMUNICATIONS SENTIMENT INDEX 2020 Market Conduct - Deloitte Commentary The fair treatment of customers – where they can be confident when engaging with a company, that their query or complaint will be heard, prioritised and resolved as efficiently and effectively as possible – is not an unreasonable expectation. Even more so when the product or service is essential, and critical to their increased connectivity needs during a lockdown. It is understandable then, that the emotional context of last year resulted in customers being more negative towards network providers when urgency to resolve issues was met with slow turnaround times and unresponsiveness across all channels. In the first two months of lockdown (April and May 2020), complaint volumes leapt by approximately 18pp (from 21% to 39%), but even as lockdown level restrictions eased, the monthly complaint trend continued to rise. Nine out of 10 relevant to TCF (treating customer fairly) complaints, required a response and half of social media complaints went unanswered. All network providers experienced an upward trend in service complaints in 2020. Unsatisfactory product performance such as disappearing data and network issues were most often cited by consumers as the initial complaint triggers, and this resulted in service complaints as operations tried to handle the inbound flood of interactions that moved from physical channels to the contact centres and other digital channels. When one analyses the top three drivers of the service complaints – turnaround times, no response received and multiple contacts – this indicates that service operations struggled to respond to the volumes and repeat interactions as customers grew increasingly impatient. One must acknowledge that service operations faced the same challenges during lockdown that consumers faced, like travel limitations on staff, adapting to working from home, etc. Many service operations had to adjust to immediately implement remote working, re-route interaction types and channels, and find ways to enable their people to resolve escalated queries while working from home. BrandsEye 34
You can also read