What is the 'Hockey Stick' Debate About? - Department of ...
←
→
Page content transcription
If your browser does not render page correctly, please read the page content below
Ross McKitrick                                                                     APEC Study Group, Australia
“What is the Hockey Stick Debate About?                                                          April 4, 2003

        What is the ‘Hockey Stick’ Debate About?

                                          Ross McKitrick*
                                      Department of Economics
                                        University of Guelph

                                               April 4 2005

                                                Abstract
        The hockey stick debate is about two things. At a technical level it concerns a well-
        known study that characterized the state of the Earth’s climate over the past thousand
        years and seemed to prove a recent and unprecedented global warming. I will explain
        how the study got the results it did, examine some key flaws in the methodology and
        explain why the conclusions are unsupported by the data. At the political level the
        emerging debate is about whether the enormous international trust that has been placed in
        the IPCC was betrayed. The hockey stick story reveals that the IPCC allowed a deeply
        flawed study to dominate the Third Assessment Report, which suggests the possibility of
        bias in the Report-writing process. In view of the massive global influence of IPCC
        Reports, there is an urgent need to bias-proof future assessments in order to put climate
        policy onto a new foundation that will better serve the public interest.

1       Introduction
The hockey stick graph appears to show that the Earth’s climate was very stable from AD1000 to 1900,
then suddenly began to change, with temperatures in the Northern Hemisphere rising dramatically. It was
central to the 2001 Third Assessment Report (TAR) from the Intergovernmental Panel on Climate Change
(IPCC). It appears as Figure 1b in the Working Group 1 Summary for Policymakers, Figure 5 in the
Technical Summary, twice in Chapter 2 (Figures 2-20 and 2-21) of the main report, and Figures 2-3 and
9-1B in the Synthesis Report. Referring to this figure, the IPCC Summary for Policymakers (p. 3) claimed
    *
      Invited Special Presentation to the Conference “Managing Climate Change—Practicalities and Realities
    in a Post-Kyoto Future,” Parliament House, Canberra Australia. My thanks to: the hosts, The Australia
    Asia Pacific Economic Cooperation (APEC) Study Centre at Monash University, and Alan Oxley for the
    invitation to make this presentation.

                                                                                                             1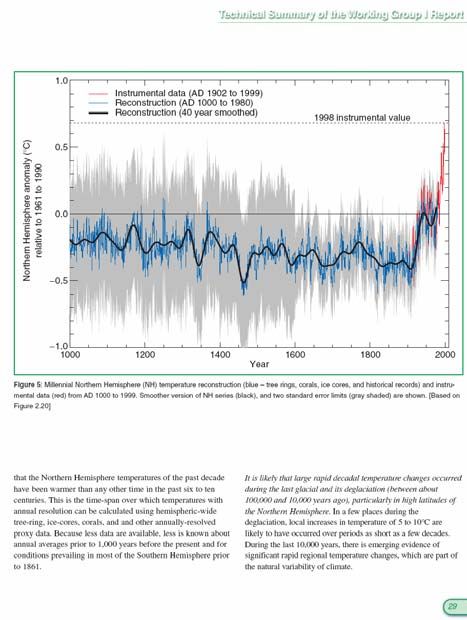
Ross McKitrick APEC Study Group, Australia
“What is the Hockey Stick Debate About? April 4, 2003
it is likely “that the 1990s has been the warmest decade and 1998 the warmest year of the millennium” for
the Northern Hemisphere.
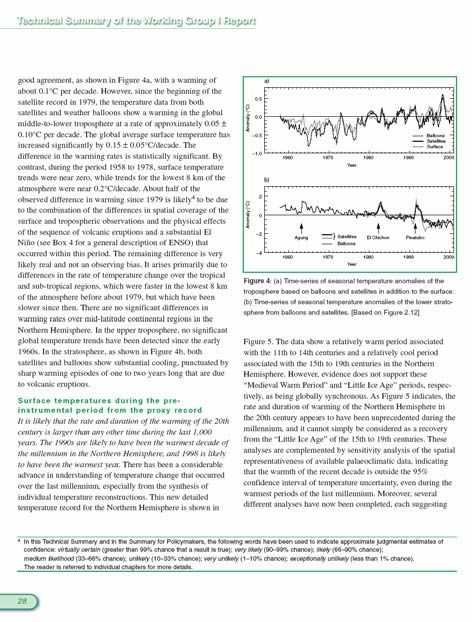
In appreciating the promotional aspect of this graph, observe not only the number of times it appears, but
its size and colourful prominence every time it is shown. This can best be seen by comparing its
presentation with that of another equally-important climate data series, the global average of tropospheric
temperatures as developed by Christie and Spencer using weather satellites.1 The two data series have
been of central importance in debates over climate science in recent years and both convey information
with potentially pivotal implications. Yet the graph of satellite-measured tropospheric data was omitted
altogether from the Summary for Policymakers. It does appear in the Technical Summary, but only in a
relatively small panel (TS Figure 4a) in black-and-white, overlaid with surface data and weather balloon
data in such a way that it is hard to see where the MSU series actually starts. And it is immediately
followed by a full-colour hockey stick occupying over half the next (facing) page. On the following page
I reproduce the page sequence from the IPCC Technical Summary. The contrast is obvious. Like a
magician misdirecting the audience’s attention, the IPCC drew attention towards the hockey stick. They
may argue in hindsight that they had good reason for this strategic emphasis, but they cannot deny that
there was deliberate editorial sleight-of-hand, and readers may in hindsight feel a justifiable sense of
having been tricked.
The implicit message concerning the importance of the hockey stick evidence was not lost on the IPCC
clientele, as evidenced by its heavy subsequently promotion. When the TAR was released in January
2001, Canada’s Chief Climate Science Advisor, Henry Hengeveld, gave his reaction in an interview for
an article in the Toronto Globe and Mail (emphasis added).2
“This gives a fairly clear signal that this isn't just a future issue, it's happening now,” Mr.
Hengeveld said. Among the strongest evidence is the fact that the past century has likely
been the warmest in the Northern Hemisphere in the past millennium, he said. Not only
that, the 1990s ranked as the warmest decade of the millennium, and 1998 was the
warmest year of the millennium in the Northern Hemisphere, which is where most of their
data have been acquired.
The Government of Canada subsequently sent the hockey stick (but not the satellite data) to schools
across the country, and its famous conclusion about the 1990s being the warmest decade of the
millennium was the opening line of a pamphlet sent to every household in Canada to promote the Kyoto
Protocol. A Google search, or simply a browse to a randomly-chosen government environment ministry
web site, will reveal it to be ubiquitous and primary whenever evidence is adduced for global warming or
for plumping up support for Kyoto.
1
See http://www.ghcc.msfc.nasa.gov/MSU/msusci.html.
2
Alanna Mitchell, “Scientists raise alarm of climate catastrophe.” Globe and Mail January 22, 2001.
2Ross McKitrick APEC Study Group, Australia
“What is the Hockey Stick Debate About? April 4, 2003
Figure 1: Extract of IPCC Technical Summary pages 28-29. Note the relative visual roles of the MSU
tropospheric data and the Hockey Stick.
In the aftermath of the hockey stick’s demolition, some scientists connected to the IPCC have tried to
insist that it actually didn’t matter that much to their case. Any such attempt to downplay the influence of
the graph flies in the face of the print record. Without it the TAR would have looked been a very different
document, it would not have been able to conclude what it did, nor could the IPCC have convinced world
leaders to take the actions they subsequently took.
In light of its singular role, and in light of the enormous trust placed by governments around the world in
the IPCC, we should expect they took some pains to ensure the graph’s validity. IPCC leaders have
boasted at length about their rigorous multi-stage review process,3 they have urged world leaders to place
the greatest trust in their Report, and they have summarily dismissed criticism on the grounds that their
Assessment contains the “consensus” view of all qualified climate scientists around the world.
We must evaluate the rigour of the IPCC quality control process, not by the elaborateness of the stated
procedures, but by the contents of its Reports. As I will show, the hockey stick paper was deeply flawed
3
See, for instance, “Consensus Science or Consensus Politics?” Nature 412 12 July 2001 112—114.
3Ross McKitrick APEC Study Group, Australia
“What is the Hockey Stick Debate About? April 4, 2003
and it contradicted other credible evidence then appearing in the scientific literature. The flaws could have
been discovered during the review process under even the most elementary fact-checking. Yet the review
process not only allowed this paper through, but made it front-and-centre in the final Report. The question
then is not whether the IPCC review process is flawed: we can no longer conclude otherwise. The
question is how to bias-proof future Reports in order to put policy onto a new foundation that will better
serve the public interest.
The hockey stick debate is thus about two things. At a technical level it is about flaws in methodology
and erroneous results in a scientific paper. But at the political level the debate is about whether the IPCC
betrayed the trust of governments around the world. If the hockey stick incident was truly inadvertent, we
can expect the IPCC would, in good faith, be fully supportive of new mechanisms to bias-proof its future
reporting-writing process.
2 The Lead-up to the Mann Hockey Stick
Scientists try to discern local climate histories over past centuries using various techniques, including
temperature proxies and ground borehole temperature data. “Proxies” include a wide range of measures
that are, potentially, sensitive to local temperature trends, such as tree ring widths. Boreholes drilled into
the ground have a vertical temperature profile that can be inverted to yield an estimate of the historical
surface temperature sequence at the surface.
In the mid-1990s the use of ground boreholes as a clue to paleoclimate history was becoming well-
established. In 1995 David Deming, a geoscientist at the University of Oklahoma, published a study in
Science4 that demonstrated the technique by generating a 150-year climate history for North America.
Here, in his own words, is what happened next.
With the publication of the article in Science, I gained significant credibility in the
community of scientists working on climate change. They thought I was one of them,
someone who would pervert science in the service of social and political causes. So one
of them let his guard down. A major person working in the area of climate change and
global warming sent me an astonishing email that said “We have to get rid of the
Medieval Warm Period.”5
The Medieval Warm Period (MWP) is an interval from approximately AD1000 to AD1300 during which
many places around the world exhibited conditions that seem warm compared to today. In the 1995
4
Deming, D. (1995). “Climatic Warming in North America: Analysis of Borehole Temperatures.” Science 268,
1576-1577.
5
David Deming (2005) “Global Warming, the Politicization of Science, and Michael Crichton's State of Fear.”
Forthcoming, Journal of Scientific Exploration, v.19, no.2.
4Ross McKitrick APEC Study Group, Australia
“What is the Hockey Stick Debate About? April 4, 2003
Second Assessment Report of the IPCC, there was no hockey stick. Instead the millennial climate history
contained a MWP and a subsequent Little Ice Age, as shown as in Figure 3. The late 20th century appears
to be nothing special by comparison. It is easy to see why this graph was a problem for those pushing the
global warming alarm. If the world could warm so much on such a short time scale as a result of natural
causes, surely the 20th century climate change could simply be a natural effect as well. And the present
climate change could hardly be considered unusually hazardous if even larger climate changes happened
in the recent past, and we are simply fluctuating in the middle of what nature regularly dishes out?
Figure 3: World Climate History According to IPCC in 1995.
Those wanting to “get rid of” the MWP run into the problem that it shows up strongly in the data. Shortly
after Deming’s article appeared, a group led by Shaopeng Huang of the University of Michigan
completed a major analysis of over 6,000 borehole records from every continent around the world. Their
study went back 20,000 years. The portion covering the last millennium is shown in Figure 4. The
similarity to the IPCC’s 1995 graph is obvious. The world experienced a “warm” interval in the medieval
era that dwarfs 20th century changes. The present-day climate appears to be simply a recovery from the
cold years of the “Little Ice Age.”
5Ross McKitrick APEC Study Group, Australia
“What is the Hockey Stick Debate About? April 4, 2003
1.5
1
0.5
0
1000 1100 1200 1300 1400 1500 1600 1700 1800 1900 1990
-0.5
-1
Figure 4. World Climate History after AD1,000 according to ground borehole evidence.
Vertical axis: average anomalies in oC, with range indicating Bayesian probability boundaries.
Source: Huang et al. (1998); data supplied by Huang.
Huang and coauthors published their findings in Geophysical Research Letters6 in 1997. The next year,
Nature published the first Mann hockey stick paper, commonly called “MBH98.”7 Mann et al. followed
up in 1999 with a paper in GRL (“MBH99”) extending their results from AD1400 back to AD1000.8 In
early 2000 the IPCC released the first draft of the TAR. The hockey stick was the only paleoclimate
reconstruction shown in the Summary, and was the only one in the whole report to be singled out for
repeated presentation. The borehole data received a brief mention in Chapter 2 but the Huang et al. graph
was not shown. A small graph of borehole data taken from another study and based on a smaller sample
was shown, but it only showed a post-1500 segment, which, conveniently, trended upwards.
As soon as the IPCC Report came out, the hockey stick version of climate history became canonical.
Suddenly it was the “consensus” view, and for the next few years it seemed that anyone publicly
questioning the result was in for a ferocious reception.
6
Huang, Shaopeng, Henry N. Pollack and Po Yu Shen (1997). “Late Quaternary Temperature Changes Seen in
Worldwide Continental Heat Flow Measurements.” Geophysical Research Letters 24: 1947—1950.
7
Mann, M.E., Bradley, R.S. and Hughes, M.K., 1998. Global-Scale Temperature Patterns and Climate Forcing
Over the Past Six Centuries, Nature, 392, 779-787.
8
Mann, M.E., Bradley, R.S. and Hughes, M.K., Northern Hemisphere Temperatures During the Past Millennium:
Inferences, Uncertainties, and Limitations, Geophysical Research Letters, 26, 759-762, 1999.
6Ross McKitrick APEC Study Group, Australia
“What is the Hockey Stick Debate About? April 4, 2003
3 The Making of the Mann Hockey Stick
3.1 The multiproxy method
Now to the technical details. Mann et al. called their method a “multiproxy” technique, since it combined
a variety of proxies. The most numerous, and influential, proxies in their data set are tree ring
chronologies. The method required mapping a large sample of proxies to a large sample of temperatures,
and it encountered the mathematical problem that there are more equations than there are unknowns. So
the dimensions of the data matrices had to be reduced.
Principal components analysis is a common tool for handling this. It involves replacing a group of series
with a weighted average of those series, where the weights chosen so that the new vector (called the
principal component or PC) explains as much of the variance of the original series as possible. This leaves
a matrix of unexplained residuals, but this matrix can be reduced to a PC as well. In that case the original
PC is called the first PC (PC1), and the PC of the residuals is called the second PC, or PC2. And there
will be residuals from it too, yielding PC3, PC4, etc. The higher the number of the PC, the less important
is the pattern it explains in the original data. PC1 is the dominant pattern, PC2 is the secondary pattern,
etc. In many cases a large number of data series can be summarized with relatively few PCs.
MBH98 applied PC analysis to simplify both temperature and proxy data. For temperatures, they
represent 1,082 series with 16 PCs. They used 112 proxies, of which 71 were individual records and 31
were PCs from 6 regional networks containing over 300 underlying series in total. The networks are from
geographical regions with labels like “NOAMER” (North America) and “SWM” (Southwest-Mexico).
In the Spring of 2003, Stephen McIntyre requested the MBH98 data set from Mann. He is not a scientist
or an economist, he was just curious how the graph was made and wanted to see if the raw data looked
like hockey sticks too. After some delay Mann arranged provision of a file which was represented as the
one used for MBH98. One of the first things Stephen discovered was that the PCs used in MBH98 could
not be replicated. In the process of looking up all the data sources and re-building Mann’s data set from
scratch, Steve discovered a quite a few errors concerning location labels, use of obsolete editions,
unexplained truncations of available series, etc. Some of these had small effects on the final results, but
the replacing the PCs did have a big effect. I joined the project in the late summer of 2003 and we
published a paper9 in October 2003 explaining the errors we found in Mann’s data. We showed that when
these errors were corrected the famous hockey stick disappeared.
In his initial response, Mann argued that we had studied the wrong data set—in other words that the one
he provided had mistakes in it and we ought instead to have used one in a newly-identified FTP archive at
his university. Over the next month we examined his FTP archive and discovered that, in fact, it
9
McIntyre, Steven and Ross McKitrick, (2003). “Corrections to the Mann et. al. (1998) Proxy Data Base and
Northern Hemisphere Average Temperature Series.” Environment and Energy 14(6) pp. 751-771.
7Ross McKitrick APEC Study Group, Australia
“What is the Hockey Stick Debate About? April 4, 2003
corresponded almost exactly to the file we had originally been working with. However it differed in
important ways from the description of the data set in the original Nature paper. We supplied a list of
these discrepancies to Nature and after their own investigation they ordered a Corrigendum from Mann et
al.10
Mann also objected that we did not exactly replicate his computational steps or sequence of proxy rosters.
No one had ever replicated his results, and we now know others had tried but were also unsuccessful. To
date we are the closest anyone has been able to come in print. We were not bothered by Mann’s response
on this point, but it did seem pointless to differ over trivial issues. So we requested his computational
code to eliminate these easily-resolved differences. To our surprise he refused to supply his computer
code, a stance he maintains to today. As for the proxy sequence, in building his PCs it turns out he had
spliced together a number of different series in order to handle segments with missing data in the earliest
part of the analysis. This was not explained in his Nature paper so Steve had not implemented it in the
emulation program. We requested identification of the splicing sequence, which Mann refused to provide,
so Steve worked out an emulation as best he could. In the end nothing turned on it, though Mann
continues to point to it as a knock against our efforts. It is still not possible to identify the final form of
the data used in MBH98 since it requires forming sequences of spliced proxy PC segments and Mann has
given conflicting counts of the number of underlying vectors involved. Still, Steve’s emulation program is
very close to reproducing the original hockey stick, and is as close as anyone is able to get in the absence
of cooperation from Mann and his colleagues.
3.2 The bent principal components
In our analysis of Mann’s FTP archive we found some remnant computer code files that turned out to be
the Fortran routines he used to compute his principal components. In these we discovered why his PCs
could not be replicated. In a conventional PC analysis, if the data are in differing units it is common to
“standardize” them by subtracting the mean of each column and dividing by the standard error. This re-
centers and re-scales all the data to a mean of zero and a variance of 1. With tree ring data no such re-
scaling is needed since the data are pre-scaled before archiving.
In Mann’s program, he applied a scaling, but with a difference. Rather than subtract the mean of the entire
series length, he subtracted the mean of the 20th century portion, then divided by the standard error of the
20th century portion.11 Most of his proxy series do not look like hockey sticks, they look like flat static,
and since they don’t change in the 20th century this procedure did not make much difference. The mean of
the last section is roughly the same as the mean of the whole series (as is the standard error) so either way
of standardizing yields more or less the same result. But some of the series trend upwards in the 20th
century. For these, the Mann method has a huge effect. Since the mean of the 20th century portion is
higher than the mean of the whole series, subtracting the 20th century mean ‘de-centers’ the series,
shifting it off a zero mean. This, in turn, inflates the variance of these series.
10
Mann, Bradley and Hughes (2004) Corrigendum, Nature July 1, 2004, page 105.
11
He also divided again by the detrended standard deviation, though this step is of little consequence.
8Ross McKitrick APEC Study Group, Australia
“What is the Hockey Stick Debate About? April 4, 2003
Figure 5: Two tree ring chronologies from the MBH98 data set. Top: Sheep Mountain, CA, USA.
Bottom: Mayberry Slough, AR, USA. Both series are the same length, but due to the 20th century trend in
the top panel, Mann’s algorithm gives it 390 times the weight of the bottom series in the PC1.
PC algorithms choose weights to maximize the explained variance of a group of data series. If one series
in the group has a relatively high variance, its weight in the PC1 gets inflated. The Mann algorithm did
just this. It would, in effect, look through a data set and identify series with a 20th century trend, then load
all the weight on them. In effect it ‘data-mines’ for hockey sticks.
Figure 5 gives an example of the effect. It shows 2 of the 90 full-length series in Mann’s data base. Both
are part of the North America (“NOAMER”) proxy roster, whose PC1 is the most influential series on the
hockey stick’s final shape. The top panel is a tree ring chronology from a stand of bristlecone pines at
Sheep Mountain, California. The bottom panel is a tree ring chronology from Mayberry Slough,
Arkansas. In the bottom panel, the mean over the last 80 years is roughly equal to the mean for the
previous 500 years, but in the top panel the post-1900 mean is above that for the pre-1900 portion.
Mann’s algorithm gives 390 times as much weight to the top series as to the bottom series in the PC1.
Figure 6 shows the contrasting results. The top panel is the MBH98 PC1 for North America, which they
call the “dominant pattern” in the data, and which has a distinct hockey stick shape. The second panel
shows the simple average of the NOAMER proxies. Note that most proxies look more like Mayberry
Slough—only a handful have the 20th century growth spurt. The third panel shows the PC1 computed
using a common statistical package, in which the data are standardized in the usual way. It looks like the
simple mean, indicating that the dominant pattern in the data does not have a hockey stick shape. I will
explain the bottom panel (“Censored”) shortly.
9Ross McKitrick APEC Study Group, Australia
“What is the Hockey Stick Debate About? April 4, 2003
2
MBH98
-2 0
-6
1
Mean
-1
-3
1
MM04
-1
-3
Censored
1
-1
-3
1400 1500 1600 1700 1800 1900 2000
Figure 6. Top panel: PC1 of the post-1400 NOAMER tree ring network, calculated by MBH98 using
short-segment standardization. Second panel: simple mean of proxies. Third panel: PC1 using standard
software without short-segment standardization. Bottom panel: Unreported PC1 calculated by MBH after
censoring Graybill-Idso high-altitude series. All normalized to 1902-1980.
To test the power of Mann’s data-mining algorithm we ran an experiment in which we developed
sequences of random numbers tuned to have the same autocorrelation pattern as the NOAMER tree ring
data. In an autocorrelated process a random shock takes a few periods to drift back to the mean. Initially
we used a simple first-order autocorrelation model, but later we implemented a more sophisticated
ARFIMA12 routine that more accurately represents the entire autocorrelation function associated with tree
ring data. In statistics these kinds of models are called “red noise.” The key point was that the ARFIMA
data is trendless random noise, simulating the data you’d get from trees in a climate that is only subject to
random fluctuations with no warming trend.
In 10,000 repetitions on groups of red noise, we found that a conventional PC algorithm almost never
yielded a hockey stick shaped PC1, but the Mann algorithm yielded a pronounced hockey stick-shaped
PC1 over 99% of the time. The reason is that in some of the red noise series there is a ‘pseudo-trend’ at
the end, where a random shock causes the data to drift upwards, and before it can decay back to the mean
12
Autoregressive Fractionally-Integrated Moving Average.
10Ross McKitrick APEC Study Group, Australia
“What is the Hockey Stick Debate About? April 4, 2003
the series comes to an end. The Mann algorithm efficiently looks for those kinds of series and flags them
for maximum weighting. It concludes that a hockey stick is the dominant pattern even in pure noise.
Figure 7. Seven panels are PC1’s from red noise data fed into MBH98 algorithm. One panel is the
MBH98 hockey stick itself.
In Figure 7, seven of the panels show the PC1 from feeding red noise series into Mann’s program. One of
the panels is the MBH98 hockey stick graph (pre-1980 proxy portion). See if you can tell which is which.
We submitted a letter to Nature about this flaw in the MBH98 procedure. After a long (8-month)
reviewing process they notified us that they would not publish it. They concluded it could not be
explained in the 500-word limit they were prepared to give us, and one of the referees said he found the
material was quite technical and unlikely to be of interest to the general readers. Instead Mann et al. were
permitted to make a coy disclosure in their July Corrigendum. In an on-line Supplement (but not in the
printed text itself) they revealed the nonstandard method, and added the unsupported claim that it did not
affect the results.
We of course did not drop the matter. We extended our study in two ways. First, we showed that the data
mining procedure did not just pull out a random group of proxies, instead it pulled out an eccentric group
of bristlecone pine chronologies published by Graybill and Idso in 1993.13 These trees (the Sheep
Mountain series in Figure 5 is an example) were studied because of their pattern of cambial dieback. They
all turned out to exhibit a 20th century growth spurt that has not been fully explained, but is likely to be at
least in part due to CO2 fertilization and is known not to be a temperature signal since it does not match
nearby temperature records. The original authors (and others) have stressed that they are not proper
climate proxies. So we felt it was important to examine what would happen to the MBH98 results if the
Graybill-Idso proxies were excluded from the NOAMER group.
The result is in the bottom panel of Figure 6 (“Censored”). It shows what happens when Mann’s PC
algorithm is applied to the NOAMER data after removing 20 bristlecone pine series. Without these
13
Graybill, D.A., and S.B. Idso, (1993) Global Biogeochemical Cycles, 7, 81-95.
11Ross McKitrick APEC Study Group, Australia
“What is the Hockey Stick Debate About? April 4, 2003
hockey stick shapes to mine for, the Mann method generates a result just like that from a conventional PC
algorithm, and shows the dominant pattern is not hockey stick-shaped at all. Without the bristlecone pines
the overall MBH98 results would not have a hockey stick shape, instead it would have a pronounced peak
in the 15th century.
Of crucial importance here: the data for the bottom panel of Figure 6 is from a folder called CENSORED
on Mann’s FTP site. He did this very experiment himself and discovered that the PCs lose their hockey
stick shape when the Graybill-Idso series are removed. In so doing he discovered that the hockey stick is
not a global pattern, it is driven by a flawed group of US proxies that experts do not consider valid as
climate indicators. But he did not disclose this fatal weakness of his results, and it only came to light
because of Stephen McIntyre’s laborious efforts.
Another extension to our analysis concerned the claims of statistical significance in Mann’s papers. We
found that meaningless red noise could yield hockey stick-like proxy PCs. This allowed us to generate a
“Monte Carlo” benchmark for statistical significance. The idea is that if you fit a model using random
numbers you can see how well they do at “explaining” the data. Then the “real world” data, if they are
actually informative about the climate, have to outperform the random numbers. We calculated
significance benchmarks for the hockey stick algorithm and showed that the hockey stick did not achieve
statistical significance, at least in the pre-1450 segment where all the controversy is. In other words,
MBH98 and MBH99 present results that are no more informative about the millennial climate history
than random numbers.
3.3 The Gaspé cedar
Another oddity in MBH98 is that some series are duplicated within the data base. One of these, the Gaspé
“northern treeline” series14 is included as a separate proxy (treeline #11) but it is also in the NOAMER PC
collation as cana036. The data begin in 1404, but the chronology is based on only one tree up to 1421 and
only 2 trees up to 1447. Dendrochronologists do not use site data where only one or two (or zero!) trees
are sampled. In fact the authors who originally sampled the Gaspé data don’t use any of the data before
AD1600. When used as treeline #11, MBH98 listed the start date as 1400 and filled the empty first four
cells by extrapolation. The misrepresented start date enabled them to avoid disclosure of the unique
extrapolation; the extrapolation enabled them to include this series in the calculations going back to
AD1400, rather than withholding it until the AD1450 step.
We wanted to see what would happen if the Gaspé data were not introduced until AD1450. By rights we
could have withheld it until 1600, and only used it once in the data base, but that much alteration to the
MBH98 procedure turned out to be unnecessary. Simply removing the pre-1450 portion had a large effect
on the final graph, as will be shown in the next section. We wrote up the red noise experiment and
significance benchmarking material into a paper which was submitted to Geophysical Research Letters.
14
This series was included in the North American “northern treeline” network even though the Gaspé peninsula is
nowhere near the northern treeline.
12Ross McKitrick APEC Study Group, Australia
“What is the Hockey Stick Debate About? April 4, 2003
We wrote up the information on the Gaspé cedar and the bristlecone pines and submitted it to Energy and
Environment. Both papers were accepted and came out in February 2005.15
3.4 The new score
Figure 8 shows two versions of the hockey stick chart. The dashed line is the MBH98 version. The solid
line applies the corrections to methodology and data discussed in this paper. (More detailed step-by-step
diagrams are provided in our 2005 Energy and Environment paper). The Mann multiproxy data, when
correctly handled, shows the 20th century climate to be unexceptional compared to earlier centuries. This
result is fully in line with the borehole evidence. (As an aside, it also turns out to be in line with other
studies that are sometimes trotted out in support of the hockey stick, but which, on close inspection,
actually imply a MWP as well.)
Our critics, including Mann himself, have mounted several counterarguments which are more fully
canvassed and dealt with in the Environment and Energy paper (vol. 16(1)). The main response is that if
the PC algorithm is corrected, but instead of only using 2 PCs from the NOAMER group we use at least 4
PCs, a hockey stick shape can be partly recovered. This is true. However, there are 4 flaws with this
argument.
(i) MBH98 identified the hockey stick shape as the dominant pattern (PC1) in the proxy data by using
a flawed PC method. Under a corrected method the hockey stick shape is demoted to the fourth PC
and the analysis suggests it accounts for less than 8 percent of the total explained variance, making
it at best a small background signal. If the inclusion of a single higher-order PC accounting for less
than 8 percent of the variance in a single region changes all the results, it does not prove that the
PC4 is actually the “dominant climate pattern”, instead it shows that the model lacks robustness and
the conclusions are unstable. Had this been admitted in 1998 the paper would likely never have
been published.
(ii) If the flawed bristlecone pine series are removed, the hockey stick disappears regardless of how the
PCs are calculated and regardless of how many are included. The hockey stick shape is not global,
it is a local phenomenon associated with eccentric proxies. Mann discovered this long ago and
never reported it.
15
McIntyre, Stephen and Ross McKitrick (2005a) “The M&M Critique of the MBH98 Northern Hemisphere
Climate Index: Update and Implications.” Energy and Environment 16(1) pp. 69-100; (2005b) “Hockey Sticks,
Principal Components and Spurious Significance” Geophysical Research Letters Vol. 32, No. 3, L03710
10.1029/2004GL021750 12 February 2005. For copies please see www.climateaudit.org.
13Ross McKitrick APEC Study Group, Australia
“What is the Hockey Stick Debate About? April 4, 2003
0.2
0.0
deg C
-0.2
-0.4
1400 1500 1600 1700 1800 1900 2000
Figure 8. Dashed line: MBH98 proxy-based Northern Hemisphere temperature index reconstruction.
Solid line: Series resulting from using corrected PCs (retaining 5 PCs in the North America network),
removing Gaspé extrapolation and applying CO2 fertilization adjustment to full length of bristlecone pine
series.16
(iii) The MBH98 model fails to attain statistical significance regardless of the number of PCs used,
regardless of whether the bristlecone pines are included or not, and regardless of any other
salvaging strategy proposed by Mann and his colleagues in recent weeks. It is no more informative
about the early millennial climate than a table of random numbers.
(iv) MBH99 acknowledged that the bristlecone series are flawed and need an adjustment to remove the
CO2 fertilization effect. But they only applied the correction to the pre-1400 portion of the series.
When we apply the correction to the full series length the hockey stick shape disappears regardless
of how many PCs are retained.
Since our work has begun to appear we have enjoyed the satisfaction of knowing we are winning over the
expert community, one at a time. Physicist Richard Muller of Berkeley studied our work last year and
wrote an article about it:
16
Source: McIntyre and McKitrick 2005, under review.
14Ross McKitrick APEC Study Group, Australia
“What is the Hockey Stick Debate About? April 4, 2003
[The findings] hit me like a bombshell, and I suspect it is having the same effect on many others.
Suddenly the hockey stick, the poster-child of the global warming community, turns out to be an
artifact of poor mathematics.17
In an article in the Dutch science magazine Natuurwetenschap & Techniek, Dr. Rob van Dorland of the
Dutch National Meteorological Agency commented “It is strange that the climate reconstruction of Mann
passed both peer review rounds of the IPCC without anyone ever really having checked it. I think this
issue will be on the agenda of the next IPCC meeting in Peking this May.”18 In February 2005 the German
television channel Das Erste interviewed climatologist Ulrich Cubasch, who revealed that he too had
been unable to replicate the hockey stick (emphasis added):
He [Climatologist Ulrich Cubasch] discussed with his coworkers - and many of his professional
colleagues - the objections, and sought to work them through… Bit by bit, it became clear also to
his colleagues: the two Canadians were right. …Between 1400 and 1600, the temperature shift
was considerably higher than, for example, in the previous century. With that, the core
conclusion, and that also of the IPCC 2001 Report, was completely undermined.19
Recently Stephen McIntyre and I received an email from Dr. Hendrik Tennekes, retired director of the
Royal Meteorological Institute of the Netherlands. He wrote to convey comments he wished to be
communicated publicly:
“The IPCC review process is fatally flawed. The behavior of Michael Mann is a disgrace to the
profession…The scientific basis for the Kyoto protocol is grossly inadequate.”
4 Lessons for the IPCC
Points (i)—(iv) above are examples of the technical arguments in the hockey stick debate. It is now time
to turn to the other level of the debate: what does it tell us about the IPCC?
In April 2001, just after the release of the TAR, then Chairmen Robert Watson and Sir John Houghton
gave a news conference in which they dismissed the idea of substantial disagreement with the IPCC
Report:
Watson, described by many diplomats as the world's most authoritative voice on global
warming, dismissed suggestions that there was a 50-50 split in the scientific community
over climate change or humanity's role in producing it.
17
Muller, Richard, 2004. Global Warming Bombshell. MIT Technology Review Retrieved from
18
Natuurwetenschap & Techniek (NWT) Feb 27, 2005.
19
See http://www.daserste.de/wwiewissen/thema_dyn~id,pmhkzlh24crqytp5~cm.asp (accessed March 29, 2005).
15Ross McKitrick APEC Study Group, Australia
“What is the Hockey Stick Debate About? April 4, 2003
“It's not even 80-20 or 90-10 (in percentage terms). I personally believe it's something
like 98-2 or 99-1,” said Watson, chairman of the Intergovernmental Panel on Climate
Change (IPCC)...
John Houghton, a British expert who co-chairs an IPCC panel investigating climate change,
said his work involved between 600 and 700 scientists writing and reviewing 5,000 papers.
“That's a very large body of scientists,” he said. Houghton said that worldwide there were no
more than 10 scientists active in the field and well-versed in the arguments who disagreed
with the notion of human-induced climate change.20
These are very telling quotations. Watson and Houghton are commenting on the scientific community as
they encounter it. They are describing the group of people with whom they had just worked for two years
producing the TAR. It is, according to Watson, 99% lined up on one opinion. According to Houghton, no
more than 10 qualified scientists disagree with them. But that tells us nothing about the range of qualified
opinion on climate issues. It only tells us about the self-selection process (deliberate or unconscious)
within the IPCC.
Group efforts are always at risk of self-selection and groupthink. The pressure to conform within the
IPCC should not be underestimated. Recently (March 22, 2005) Steve McIntyre and I received an email
from a meteorologist who works at a well-known national weather research agency. He was writing to ask
us for some information in advance of an upcoming meeting at his institute to discuss our paper. In the
course of his letter he made the following comments:
Since its publication they [colleagues at his institute] have been asked to comment on this
as the “[country’s] expert institute”. However, they do not do this type of research
themselves and thus have problems positioning themselves in this discussion. Rather than
admitting that they - like many others including myself - lack a sufficient background to
really judge the discussion they frantically try to keep up the impression for the outside
world that they actually do possess this expertise. I've seen it happen in public appearance
of the [institute staff] now on many occasions. What complicates matters is that they are
heavily involved in IPCC but also in [national] projects on climate change so that they
actually cannot afford to question the IPCC climate science.
This is quite an admission. A major public research institution makes expert pronouncements on issues it
actually doesn’t have the expertise to evaluate, just for the sake of keeping up appearances. And they
refrain from criticizing the IPCC because they depend on their affiliation with it to maintain their public
standing and, presumably, their funding. It’s quite a scandalous situation.
20
Quoted in William McLean, “UN Expert: Climate Change Skeptics a Tiny Minority.” Reuters, April 5 2001.
16Ross McKitrick APEC Study Group, Australia
“What is the Hockey Stick Debate About? April 4, 2003
The IPCC carries an enormous trust. Governments around the world rely on its reports to the active
exclusion of all other information sources. The combination of massive influence with a lack of
independent oversight, internal and external conflicts of interest and refusal to take critics seriously is
unacceptable. The prominence given to the hockey stick without any serious review indicates either that
the IPCC has a much weaker review process than they have claimed, or that the Panel is systematically
biased, or both. Either way it represents a breach of the trust placed in it. Now is the time for serious
thought about how to correct the imbalance in the IPCC.
In any other official context we find that important institutions make provision for independent points of
view to be fully represented, and information presented for consideration is subject to adversarial
scrutiny. In business there are rules requiring independent audits and oversight by Securities
Commissions. Courts insist on independent representation for the prosecution and the defence without
exception, and each side has the opportunity to cross-examine the others’ witnesses. It is time to build
into the IPCC provision for independent review, oversight and critical scrutiny of the final results. It is no
longer enough to appeal to the black box of the expert review process, which proved to be inadequate for
ensuring accuracy and balance in the TAR. I propose two innovations to the IPCC process to accomplish
these things.
A. AN AUDIT PANEL. A group of experts fully independent of the IPCC should be assembled
immediately after the release of any future IPCC Reports to prepare an audit report which will be
released under the imprimatur of the IPCC itself. The audit will identify the key studies on which the
Report’s conclusions have been based, and scrutinize those studies, with a view to verifying that, at a
minimum:
o The data are publicly available,
o The statistical methods were fully described, correctly implemented and the computer code is
published,
o If the findings given maximum prominence are at odds with other published evidence, good
reason is provided in the text as to why these findings have been given prominence.
Any competent scientist can assess these things. My strong recommendation is that such a panel be
drawn from the ranks of competent mathematicians, statisticians, physicists and computer scientists
outside the climatology profession, to prevent the conflict of interest that arises because
climatologists face career repercussions from publicly criticizing the IPCC. Also, participation should
exclude officials from environment ministries, because of the conflict of interest entailed in the fact
that environment ministries are the main financial beneficiaries of the promotion of global warming
fears.
B. A COUNTER-WEIGHT PANEL. A Working Group 4 should be assembled from among the expert
community unaffiliated with Working Group 1 to publish, as part of the IPCC process, a formal
critique of the next Working Group 1 assessment report.21 Such a panel should deal with both
21
Chris Essex and I develop this proposal at greater length in Taken By Storm (see www.takenbystorm.info).
17Ross McKitrick APEC Study Group, Australia
“What is the Hockey Stick Debate About? April 4, 2003
economic and scientific aspects of the IPCC’s work as they bear upon the WGI Report. It would be
ideal to then have Working Group 1 prepare a response, to which Working Group 4 would then
prepare a reply.
It would be important that this exercise be sponsored by client governments and published under the
IPCC imprimatur. It is no good waiting for the expert community to self-organize into such a panel,
nor will it do to expect private firms or foundations to sponsor such a panel, since people cannot seem
to get past their suspicions of ulterior motives when private sponsors have undertaken such work in
the past. It is in government’s interest to test the IPCC’s output carefully, so they ought to take the
lead in organizing the work.
In making this ‘Team B’-type proposal I have encountered a few common objections. One is that
there is no need for it since the IPCC is already balanced. I think I have established adequate grounds
to doubt this. Another is the concern that it suggests a lack of trust, or an impugning of motives. In a
business or legal setting however, there are checks and balances in place, including the entire system
of independent auditing, not because we assume people in businessmen are dishonest but because we
want a system that still works even if some people aren’t always honest and unbiased. Checks and
balances are a fact of life.
A third objection is that it will create confusion by giving ‘equal’ time to the other side. People won’t
know whom to believe. This point is rather revealing. Are people worried that if the contra-IPCC
position were carefully put before the public, it might appear surprisingly compelling? But isn’t the
IPCC so confident in its position that they dismiss the very existence of credible counter-evidence? If
their critics are truly unqualified and incompetent, it will only strengthen the hand of the IPCC by
putting each side’s best arguments side-by-side, thereby laying to rest the idea that the IPCC
systematically ignores good arguments from its critics.
On the other hand perhaps the opposite will happen. Perhaps the IPCC’s position is actually rather
fragile, and allowing the public to see the opposing arguments would give away the game. I suspect
that some within the IPCC might just be afraid of this.
18You can also read