Pacific Halibut Multiregional Economic Impact Assessment (PHMEIA): update for SRB018 - International Pacific Halibut ...
←
→
Page content transcription
If your browser does not render page correctly, please read the page content below
IPHC-2021-SRB018-09

  Pacific Halibut Multiregional Economic Impact Assessment (PHMEIA): update for SRB018
                                                   PREPARED BY: IPHC SECRETARIAT (B. HUTNICZAK; 11 MAY 2021)

PURPOSE
To provide an update on the International Pacific Halibut Commission (IPHC) economic study, including
progress on developing the economic impact assessment model, state of the collection of primary
economic data from Pacific halibut dependent sectors, and most recent results on regional and
community economic impacts.

BACKGROUND
Under the Convention, the IPHC's mandate is optimum management of the Pacific halibut resource,
which necessarily includes an economic dimension. Fisheries economics is an active field of research
around the world in support of fisheries policy and management. Adding the economic expertise to the
IPHC Secretariat, the IPHC has become the first regional fishery management organization (RFMO) in
the world to do so.
The goal of the IPHC economic study is to provide stakeholders with an accurate and all-sectors-
encompassing assessment of the economic impact of the Pacific halibut resource in Canada and the
United States of America. The intention of this update is to inform on the project's progress.
The economic effects of changes to harvest levels can be far-reaching. Fisheries management policies
that alter catch limits have a direct impact on commercial harvesters, but at the same time, there is a
ripple effect through the economy. Industries that supply commercial fishing vessels with inputs,
generally referred to as backward-linked industries, rely on this demand when making decisions related
to their production levels and expenditure patterns. For example, vessels making more fishing trips
purchase more fuel and leave more money in a local grocery store that supplies crew members'
provisions. More vessel activity means more business to vessel repair and maintenance sector or gear
suppliers. An increase in landings also brings more employment opportunities, and, as a result, more
income from wages is in circulation. When spending their incomes, local households support local
economic activity that is indispensable to coastal communities' prosperity.
Changes in the domestic fisheries output, unless fully substituted by imports, are also associated with
production adjustments by industries relying on the supply of fish, such as seafood processors. Similarly
to the directly affected sector, any change in production by the forward-linked industry has a similar
ripple effect on its suppliers. The complete path of landed fish, from the hook to the plate, also includes
seafood wholesalers and retailers, and, in the case of highly-prized fish such as Pacific halibut,
services. Traditionally, the vast majority of Pacific halibut is consumed at white-tablecloth restaurants.
Any adjustment in gross revenue generated by these industries resulting from a change in the supply
of directly affected fish is further magnifying the economic impact of management decisions altering
harvest levels.
Similar effects are attributed to the recreational fishing sector. By running their businesses, charter
operators generate demand for fuel, bait fish, boat equipment, and fishing trip provisions. They also
                                              Page 1 of 28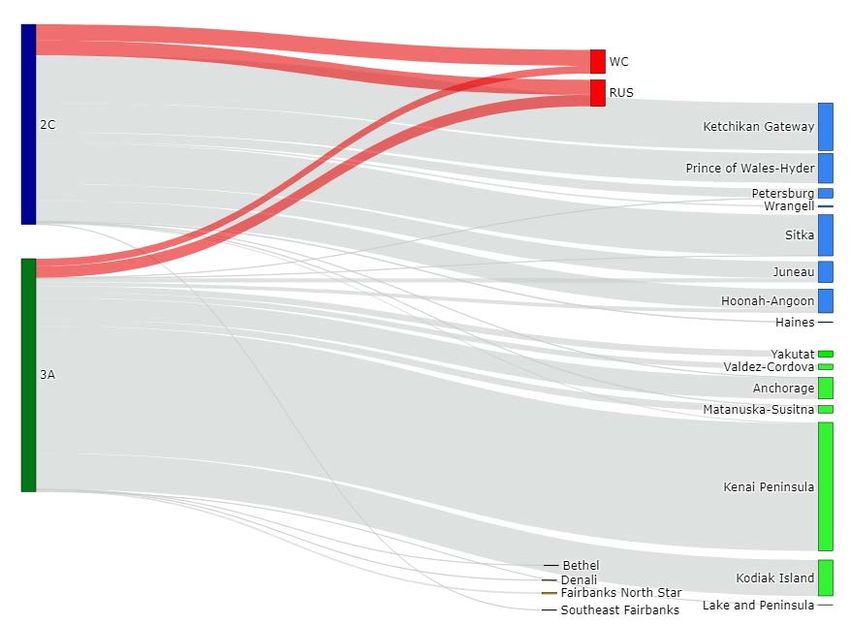
IPHC-2021-SRB018-09
create employment opportunities and provide incomes that can be spent locally, supporting various
local businesses. What is more, anglers themselves contribute to the economy by creating demand for
goods and services related to their fishing trips. A number of sectors support tourism relaying on the
Pacific halibut fishing, both guided and unguided. These include lodging, local retailers, or restaurants.
Besides shaping a complex combination of local effects, the industries' interlinked nature is generating
cross-regional impacts. Economic benefits from the primary area of the resource extraction are leaked
when inputs are imported, when wages earned by nonresidents are spent outside the place of
employment, or when earnings from quota holdings flow to nonresident beneficial owners. At the same
time, the inflow of economic benefits to the local economies from outside is occurring when products
are exported or local businesses are bringing tourism cash to the region.
Understanding the multiregional impacts of changes to fisheries sectors is now more important than
ever considering how globalized it is becoming. Fish harvested on the other side of the globe can be
easily found on the shelf or on the menu in the United States or Canada, competing with domestically
produced seafood. The United States and Canada imported seafood worth over USD 28.8 billion (CAD
37.4 billion) in 2018 (Statistics Canada, 2020a; US Census, 2020). On the production side, the origin
of inputs to any sector is increasingly distant, implying a gradual shift of economic activity supported by
fisheries and seafood industries abroad. While generally cost-effective, such high exposure to
international markets makes seafood accessibility fragile to perturbations, as shown by the covid-19
outbreak (OECD, 2020). Fisheries are also at the forefront of exposure to the accelerating impacts of
climate change. A rapid increase of the water temperature of the coast of Alaska, termed the blob, is
affecting fisheries (Cheung and Frölicher, 2020) and may have a profound impact on Pacific halibut
distribution. Thus analyzing the sector in a broader context is crucial.
A good grasp of the multiregional impacts is also fundamental to correctly assess the impacts the
resource such as Pacific halibut has on communities. Some of the local communities particularly rely
on fishing-related economic activities. A good understanding of localized effects is pivotal to
policymakers that are often concerned about community impacts, particularly in terms of impact on
employment opportunities and households’ welfare. Fisheries policies have a long history of
disproportionally hurting smaller communities, often because potential adverse effects were not
sufficiently assessed. For example, in a system based on transferable quotas, small remote fishing
communities are more likely to sell their quota. What follows is a disproportional economic impact on
the spatial scale. Loss of fisheries opportunities in small indigenous communities can be an unintended
consequence of quota systems (Carothers, Lew, and Sepez 2010; Szymkowiak, Kasperski, and Lew
2019).

Update on the model development
Economic impacts are typically estimated with the use of an input-output (IO) model. The traditional IO
model is used to investigate how changes in final demand affect economic variables such as output,
income and employment or contribution to the region's gross domestic product (GDP). This is known
as impact analysis. With an adjustment for the shock type, the model can also demonstrate the
magnitude of changes in supply-constrained industries such as total allowable catch (TAC) constrained
                                              Page 2 of 28
IPHC-2021-SRB018-09
fisheries. Adopting a multiregional approach, the model accommodates the cross-regional trade. The
IO model can also be extended to the so-called social accounting matrix (SAM). Adopting SAM, the
calculated effects account for labor commuting patterns and residency of beneficial owners of
production factors, and as a result, the flow of earnings between regions.
The Pacific halibut multiregional economic impact assessment (PHMEIA) model is a multiregional SAM
model describing economic interdependencies between sectors and regions developed to assess the
economic contribution of Pacific halibut resource to the economy of the United States and Canada. The
adopted methodology is an extension from the multiregional SAM model for Southwest Alaska
developed by Seung, Waters, and Taylor (2019) and draws on a few decades' worth of experience in
developing IO models with applications to fisheries (for review of relevant literature, please refer to the
economic study section on the IPHC website, subsection Review of economic impact assessment
models focused on the fisheries sector).
The PHMEIA model accounts for three economic impact (EI) components. The direct EIs reflect the
changes realized by the direct Pacific halibut resource stock users (fishers, charter business owners).
The indirect EIs are the result of business-to-business transactions indirectly caused by direct the EIs.
The indirect EIs provide an estimate of the changes related to expenditures on goods and services
used in the production process of the directly impacted industries. In the context of the PHMEIA, this
includes an impact on upstream economic activities associated with supplying intermediate inputs to
the direct users of the Pacific halibut resource stock. Finally, the induced EIs result from increased
personal income caused by the direct and indirect effects. In the context of the PHMEIA, this includes
economic activity generated by households spending earnings that rely on the Pacific halibut resource.
The model reflects the interdependencies between eleven major sectors and two Pacific halibut-specific
sectors. These include the Pacific halibut fishing sector, as well as the forward-linked Pacific halibut
processing sector. 1 In addition, the extended model (referred here as PHMEIA-r) introduces to the SAM
also the Alaskan saltwater charter sector that is disaggregated from the services-providing industry. 2
The list of industries considered in the PHMEIA and PHMEIA-r models, as well as the primary
commodities they produce, is available in Table 1.
The model accounts for interregional spillovers. These represent economic stimulus in the regions other
than the one in which the exogenous change is considered. This allows accommodation of increasing
economic interdependence of regions and nations. The model considers three primary Pacific halibut
producing regions, as well as residual regions to account for cross-boundary effects of fishing in the
Pacific Northwest:
    •   Alaska (AK)
    •   US West Coast (WC – including WA, OR and CA)

1 As noted by Steinback and Thunberg (2006), there is a number of seafood substitutes available to buyers. Thus including
impacts beyond processors and wholesalers in the SAM framework could be misleading considering that it is unlikely that
supply shortage would result in a noticeable change in retail level gross revenues. Alternative approaches to assess these
effects are beyond the scope of the project at this time. Data limitations preclude the inclusion of wholesale buyers from the
assessment of forward-linked effects.
2 The inclusion of the British Columbia and US West Coast charter sector is underway, pending data collection.

                                                       Page 3 of 28
IPHC-2021-SRB018-09
   •   British Columbia (BC)
   •   Rest of the United States (RUS)
   •   Rest of Canada (ROC)
   •   Rest of the world (ROW)3
By accounting for the economic linkages among these six regions, the study shows the importance of
multiregional approaches to measuring economic impacts more accurately. This is particularly
important in the context of shared resources and joint management, such as the case of collective
management of Pacific halibut by the IPHC. The economic metrics derived from the PHMEIA model
range from total economic impact on output along the value chain to impacts on employment and
incomes, as well as contribution to the GDP and households' prosperity.
The model adopts a recently published multiregional generalized RAS (MRGRAS) updating technique
(Temursho, Oosterhaven and Cardenete, 2020) to develop an up-to-date model that can incorporate
partial information on its components while continuing to conform to the predefined balanced structure.
This technique can make the multiregional model consistent with aggregated national data 4 and include
up-to-date estimates from a limited number of focus sectors. For more details on the methodological
approach, please refer to the article Method for efficient updating of regional supply and use tables
(Journal of Economic Structures, In Review) and economic study section on the IPHC website
(subsection Methodological annex).
The current version of the model is based primarily on secondary data sources. 5 As such, the results
are conditional on the adopted assumptions for the components for which data were not available. In
order to improve the accuracy of the assessment, the IPHC intends to increasingly rely on the primary
economic data collected directly from members of Pacific halibut dependent sectors (see Identification
of available data sources and primary data collection), applying the so-called partial-survey method
(Miller and Blair 2009, pp. 303). The subsequent revisions of the model incorporating IPHC-
collected data will bring a better characterization of the Pacific halibut sectors' economic
impact.
The model is operational and available for 2014, 2016, 2018, and 2019. For more details on the SAM
application to the assessment of the impact of the Pacific halibut resource on the economies of Canada
and the United States, please refer to the economic study section on the IPHC website (subsection
PHMEIA model).

3 The ROW region in the model is considered exogenous. This implies that the trade relations with the ROW are unaffected

by the changes to the Pacific halibut sectors considered in this project. While the full inclusion of the ROW component
allows for assessment of impact outside Canada and the United States if trade with ROW was to be considered responsive
to changes in Pacific halibut sector activity, this is not typically seen in the literature.
4 For example, data from the National Economic Accounts (NEA). NEA data provide a comprehensive view of national

production, consumption, investment, exports and imports, and income and saving. These statistics are best known by
summary measures such as gross domestic product (GDP), corporate profits, personal income and spending, and personal
savings.
5 That is data collected by other parties, not the IPHC.

                                                    Page 4 of 28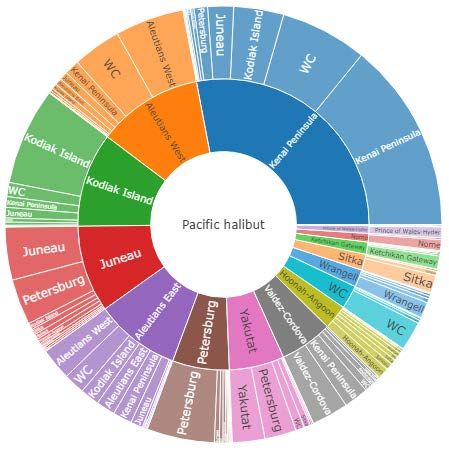
IPHC-2021-SRB018-09
Table 1 Industries and commodities considered in the PHMEIA and PHMEIA-r models.
                  Industry                                                   Primary commodity produced
            1     Pacific halibut fishing                                    Pacific halibut
            2     Other fish and shellfish fishing                           Other fish and shellfish(1)
            3     Agriculture and natural resources (ANR)                    Agriculture and natural resources
            4     Construction                                               Construction
            5     Utilities                                                  Utilities
            6     Pacific halibut processing                                 Seafood
            7     Other fish and shellfish processing                        Seafood
            8     Food      manufacturing      (excluding    seafood         Food (excluding seafood) (2)
                  manufacturing)
             9    Manufacturing (excluding food manufacturing)               Manufactured goods (excluding food)
            10    Transport                                                  Transport
            11    Wholesale                                                  Wholesale
            12    Retail                                                     Retail
            13    Services (including public administration)                 Services (including public administration)
            14    Saltwater charter sector(3)                                Saltwater fishing trips
Notes: (1)In the case of Canada, other fish and shellfish commodity includes, besides wild capture production, also aquaculture output
produced by the aquaculture industry that is a part of the ANR industry. Other fish and shellfish processing industry in the USA component,
on the other hand, draws more on the ANR commodity that includes aquaculture output. However, this misalignment between model
components is not concerning as linking these is based on the trade of aggregated seafood commodity. (2)There is a slight misalignment
between model components related to the allocation of beverage and tobacco manufacturing products that, in some cases, are considered
non-durable goods and lumped with the food commodity. In the case of the USA component, this misalignment is corrected with the use
of additional data available from the Annual Survey of Manufactures (ASM) (US Census, 2021b). No correction is performed for the ROW
component, but the global production of beverage and tobacco products is considered of minor importance compared to other food
commodities. (3)Saltwater charter sector extension included in PHMEIA-r model, currently applied only for Alaska. The Pacific halibut
charter sector is assumed to account for 22.4% (2019) of the Alaskan saltwater charter sector. This is calculated as a share of Pacific
halibut effort reported by Webster & Powers (2020) in total effort reported by the Marine Recreational Information Program (NOAA,
2021c).

Identification of available data sources and primary data collection
The current version of the model is built using a broad set of secondary data sources. These include
region-specific commercial fishing outputs in terms of value (DFO, 2021; NOAA, 2021a), including
detailed landing data from eLandings system for Alaska (ADFG, 2021a), wholesale value 6 (AgriService
BC, 2018; COAR, 2021), employment and wages 7 (AK DLWD, 2020; Statistics Canada, 2021), out-of-
state employment (Kreiger and Whitney, 2021), seafood trade (NOAA, 2020; Statistics Canada,
2020a). Lew & Lee (2019) report on costs, earnings, and employment in the Alaska saltwater sport
fishing charter sector in 2017. Additional data are available on recreational harvest and participation in
recreational angling (ADFG, 2020; RecFIN, 2020; Webster and Powers, 2020; NOAA, 2021c),
subsistence and research harvest (IPHC, 2020a). More details on fisheries-related secondary data
sources can be found in the economic study section on the IPHC website (subsection Fisheries-related
economic statistics).
The social accounting matrix, even if built with the purpose of assessing a limited number of sectors
(i.e., Pacific halibut dependent industries in this case), also requires input on supply and use by all
industries in the economy, as well as supplementary data on household accounts to provide insight into

6   Not available for the US West Coast (confirmed with NOAA NWFSC, personal communication).
7   Not available for the US West Coast (confirmed with NOAA NWFSC, personal communication).
                                                            Page 5 of 28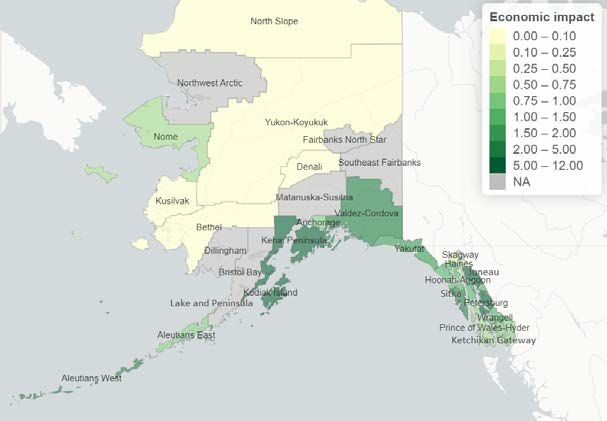
IPHC-2021-SRB018-09
the demographics of the workforce that builds the market for supply and demand of labor and trade
data to link model components. The following sources serve as a base for the up-to-date estimates (list
not exhaustive):
    •   US Bureau of Economic Analysis (BEA) industry accounts supplemented by BEA Regional Data
        resources (BEA, 2020) - the USA model component
    •   United States Census Bureau's Annual Survey of Manufactures (ASM) (US Census, 2021b) –
        complementary statistics on manufacturing establishments
    •   Provincial-level supply and use tables published by Statistics Canada (Statistics Canada, 2020b)
        – the Canadian model component
    •   US Trade provided by the U.S. Census Bureau (US Census, 2020)
    •   Canadian International Merchandise Trade Database (Statistics Canada, 2020a)
More accuracy of the results can be achieved by incorporating into the model primary economic data
collected directly from members of Pacific halibut-dependent sectors. An essential input to the SAM
model is data on production structure (i.e., data on the distribution of revenue between profit and
expenditure items). Currently, the model uses estimates from the species-based NOAA model for
Alaska for 2014 (Seung, Waters and Taylor, 2019), as well as Pacific halibut sector estimates for the
West Coast provided directly by the authors of the NOAA input-output model for the Pacific Coast
fisheries (Leonard and Watson, 2011; Pacific halibut estimates not published). No equivalent detail
model is available for British Columbia, although some partial statistics are derived from Edwards and
Pinkerton (2020). 8
A series of surveys to gather information from commercial fishers and processing plant operators has
been announced at the AM96. To expand the model's scope, a survey aimed at charter business
owners has been announced at the IM96. The web-based survey forms are available:
    •   Here, for Pacific halibut commercial harvesters;
    •   Here, for Pacific halibut processors;
    •   Here, for Pacific halibut charter business owners.
IPHC stakeholders are encouraged to fill the relevant survey form and contribute to the
assessment of the importance of the Pacific halibut resource to the economy of Canada and the
United States of America.

Primary data collection in the time of the crisis
Recent perturbations in the markets caused by covid-19 serve as an additional argument for
considering the broader economic dimension of Pacific halibut's contribution to regional economies.
The widespread closure of restaurants, the Pacific halibut's biggest customers, diminished the demand
for fish, particularly high-quality fresh fish that fetch higher prices. Lower prices, down in 2020 by up to
30% compared with the previous year (Stremple, 2020; Table 2), caused a slow first half of the season

8Edwards and Pinkerton (2020) provide estimates of average operational and fixed costs. These are used to derive value
added related to Pacific halibut fishing used in the model.
                                                   Page 6 of 28
IPHC-2021-SRB018-09
(Ess 2020). Less harvest activity has repercussions in the economy beyond the harvest sector as it
affects also harvest sector suppliers and downstream industries that rely on its output. Outbreaks of
covid-19 in fish processing plants (Estus, 2020; Krakow, 2020) also affect economic activity generated
regionally by this directly related to the Pacific halibut supply sector. Moreover, seafood processors
incur additional costs associated with protective gear, testing, and quarantine accommodations (Ross,
2020; Sapin and Fiorillo, 2020; Welch, 2020).
The pandemic turned out to be also a major impediment to successful primary data collection in 2020.
The survey's announcement happened shortly before the covid-19 outbreak that shifted the focus of
participants to the Pacific halibut fishery. An intensified effort to reach out to commercial vessel
operators was made starting July when the IPHC fisheries data specialists (ports) distributed a paper
version of the survey. To this date, however, too few responses have been received to make reliable
estimates for full model calibration, and the Secretariat continues efforts to improve the response rate.
Meanwhile, the survey results are used to inform the model on a number of parameters for which no
other estimates are available (e.g., the workforce composition).
The preliminary survey results are available to all contributors and prospective participants for
comparison with regional and local averages here: 9
http://iphcecon.westus2.cloudapp.azure.com:3838/srApp/.
As a reminder, the participants to the Pacific halibut fisheries (commercial and charter sector) are
encouraged to fill the form for 2020, but also retrospectively submit information for 2019. Responses
are accepted on a rolling basis and used to update the results app periodically. The benefits of filling
the survey for both years are as follows:
• Data for 2019, covering pre-covid-19 operations, can be considered a baseline suitable for
drawing conclusions under normal circumstances and using for predictions.
• Data for 2020, covering an abnormal year of operations, can be used to assess losses incurred
by the Pacific halibut sectors, but also sectors' resilience to unfavorable exogenous
circumstances. If the project continues and data for 2021 are collected, the project could inform
on the response to the crisis and undertake an analysis of the path to recovery.
9 At this stage, the estimates are based on a limited sample and should not be considered necessarily reflective of the whole
indicated sector. The main intention of sharing this app at this time is to demonstrate the potential of the survey to provide
a comparison of a broad set of economic statistics across regions and years.
Page 7 of 28IPHC-2021-SRB018-09
Table 2 Pacific halibut commercial landings by IPHC Regulatory Area – 2019 vs. 2020.
IPHC Regulatory Area Value [USD] Price [USD] Value [USD] Price [USD]
2019 2019 2020 2020
2A 5,015,314 3.64 NA NA
2B 34,988,780 5.02 NA NA
2C 17,305,677 5.67 12,547,601 4.32
3A 43,214,560 5.65 28,027,417 4.37
3B 8,410,477 5.46 6,130,597 4.19
4A 5,947,111 4.46 4,438,663 3.80
4B 4,079,609 4.41 3,229,892 3.67
4C 1,991,117 4.23 242,879 3.76
4D 4,452,681 4.49 5,162,180 3.94
4E 348,426 5.42 280,031 3.94
SUM AK (2C-4E) 85,749,658 5.35 60,059,259 4.21
Notes: NA – not available. Data for 2A based on (NOAA, 2021a), and data for 2B based on (DFO, 2021). Estimates for Alaska based on
data from eLandings system (ADFG, 2021a), limited to harvest landed under IFQ and CDQ management program and reported sold.
Value calculated based on average price per ticket and landings allocated based on ADFG grid converted to IPHC regulatory areas. For
border areas, the first reported area was assigned.
Pacific halibut value along the supply chain
The complete path of landed fish, from the hook to the plate, includes, besides harvesters and
processors, also seafood wholesalers and retailers, and in the case of highly-prized fish such as Pacific
halibut, services when it is served in restaurants. Any change in gross revenue generated by these
industries as a result of a change in the supply of directly affected fish is further magnifying the
economic impact of management decisions altering harvest levels.
Isolating data on Pacific halibut wholesale and retail is challenging as no relevant statistics have been
identified. However, it is important to note that there are many seafood substitutes available to buyers.
Thus, including economic impacts beyond processors and wholesalers could be misleading when
considering that it is unlikely that supply shortage would result in a noticeable change in retail level
gross revenues (Steinback and Thunberg, 2006).
Recreational sector in the PHMEIA model – PHMEIA-r
There are two components to consider when attempting to assess the full scope of the Pacific halibut
resource's economic impact occurring as a result of recreational fishing activities. The first is the
contribution to the economy by the charter sector that provides service to anglers. These include
services directly related to angling, for example, providing a boat, trip supplies and guides, but also not
directly related, for example, hospitality services in case of fly-in lodges that specialize in serving
customers interested in Pacific halibut fishing. The economic impact is generated by the sector's
demand for inputs from other industries, including manufacturing, professional services (accounting,
marketing, etc.) and demand for labor.
The second component is the contribution of anglers who create demand for goods and services related
to their fishing trips. This includes expenses related to the travel that would otherwise not be incurred
Page 8 of 28IPHC-2021-SRB018-09
(e.g., auto rental, fuel cost, lodging, food, site access fees), as well as money spent on durable goods
that are associated with recreational fishing activity, e.g., rods, tackle, outdoor gear, boat purchase,
etc. This component applies to both guided and unguided recreational fishing. Assessment of anglers'
contribution to the economy typically requires surveying private anglers on their fishing-related
expenditures and fishing preferences.
The extended PHMEIA-r model introduces to the SAM the Alaskan saltwater charter sector.
Economic impact assessment of subsistence fishing
Previous research suggested that noncommercial or nonmarket-oriented fisheries contribution to
national GDP is often grossly underestimated, particularly in developing countries (e.g., Zeller, Booth,
and Pauly 2006). Subsistence fishing is also important in traditional economies, often built around
indigenous communities. Wolfe and Walker (1987) found that there is a significant relationship between
the percentage of the native population in the community and reliance on wildlife as a food source in
Alaska. However, no comprehensive assessment of the economic contribution of the subsistence
fisheries to the Pacific northwest is available. The only identified study, published in 2000 by Wolfe
(2000), suggests that the replacement value of the wild food harvests in rural Alaska may be between
131.1 and 218.6 million dollars, but it does not distinguish between different resources and assumes
equal replacement expense per lb. Aslaksen et al. (2008) proposed an updated estimate for 2008 based
on the same volume, noting that transportation and food prices have risen significantly between 2000
and 2008, and USD 7 a pound is a more realistic replacement value. This gives the total value of USD
306 million, but the approach relies upon the existence of a like-for-like replacement food (in terms of
taste and nutritional value), which is arguably difficult to accept in many cases (Haener et al., 2001)
and ignores the deep cultural and traditional context of the Pacific halibut in particular (Wolfe, 2002). A
more recent study by Krieg, Holen, and Koster (2009) suggests that some communities may be
particularly dependent on wildlife, consuming annually up to 899 lbs per person, but no monetary
estimates are derived. Moreover, although previous research points to the presence of sharing and
bartering behavior that occurs in many communities (Wolfe, 2002; Szymkowiak and Kasperski, 2020),
the economic and cultural values of these networks have yet to be thoroughly explored.
Economic impact assessment results
This section summarizes the most recent outcomes of the PHMEIA and PHMEIA-r models. It is
important to note that these are based on the current version of the model incorporating primarily
secondary data sources. As such, the results are conditional on the adopted assumptions for
the components for which up-to-date data were not available (summarized for Alaska in
Appendix 1 Assumptions on the Pacific halibut sectors in Alaska) and are subject to change.
The current results incorporate the following changes in comparison to the results presented at the
AM97:
- The model uses an updated set of data, and estimates are now available for 2019 (previously
up to 2018);
Page 9 of 28IPHC-2021-SRB018-09
- The report includes preliminary estimates of community effects – it incorporates county-level
results for Alaska;
- The extended model (PHMEIA-r) provides preliminary estimates for the charter sector (limited
to guided fishing in Alaska);
- The estimates fully incorporate described flows of earnings related to all Pacific halibut sectors
(fishing, processing, and charter/Alaska only).
Economic impact of Pacific halibut commercial fishing
The model results suggest that Pacific halibut commercial fishing's total estimated impact in 2019
amounts to USD 194.2 mil. (CAD 257.7 mil.) in earnings 10 (including estimated USD 42.5 mil / CAD
56.4 mil in earnings in the Pacific halibut fishing sectors), USD 134.3 mil. (CAD 178.2 mil.) in
compensation of employees (including estimated USD 26.6 mil / CAD 35.3 mil in wages in the Pacific
halibut fishing sectors), 4,326 in jobs, USD 178.4 mil (CAD 236.7 mil.) in households income and over
USD 665.2 mil. (CAD 882.6 mil.) in output. This is about 5.3 times the fishery output value of
USD 126.4 mil. 11 (CAD 167.7 mil.) recorded for 2019 (DFO, 2021; NOAA, 2021a). The estimate is the
total economic impact, the sum of the direct, indirect, and induced effects from changes to the Pacific
halibut fishing sector, as well as indirect and induced effects associated with forward-linked industries
(Pacific halibut processing sector).
Table 3 Estimated economic impact of Pacific halibut commercial sector in 2019.
Value [mil. USD / mil. CAD] Value per 1 USD of output
Value of landings 126.4 / 167.7 -
Economic impact – output 665.2 / 882.6 5.26
Economic impact – compensation of employees 134.3 / 178.2 1.06
Economic impact – earnings 194.2 / 257.7 1.54
Economic impact - employment 4326 jobs 34.22
Economic impact – households 178.4 / 236.7 1.41
The results suggest that the revenue generated by Pacific halibut at the harvest stage accounts for only
a fraction of economic activity that would be forgone if the resource was not available to fishers in the
pacific northwest. Besides supporting production by other industries, the sector also contributes to the
GDP of Canada and the United States and has a considerable impact on employment in both countries.
Understanding such a broad scope of impacts is essential for designing policies with desired effects
depending on regulators' priorities.
Moreover, the results suggest that incorporating Pacific halibut-specific outflows has a considerable
impact on results. Error! Reference source not found. shows the estimates of economic impact on
households in Alaska from the final model contrasted with estimates from the model that does not
account for cross-regional flows of earnings. While 1 USD of Pacific halibut output in Alaska could
generate USD 0.71 USD for Alaskan households, out-of-state employment, flows related to beneficial
10 Earnings include both employee compensation and proprietors’ income.
11 For Alaska, the model only includes harvest landed under IFQ and CDQ management program that was marked as sold.
Page 10 of 28IPHC-2021-SRB018-09
ownership of Pacific halibut fishing rights in Alaska (i.e. quota holdings) and corporate interests of
processing sector entities cause this estimate to drop to USD 0.58.
Table 4 Effect of incorporating Pacific halibut specific outflows - impact on households per 1 USD of
Pacific halibut output in Alaska (2019).
Model with no Pacific halibut Model with Pacific halibut
specific outflows specific outflows
Households in Alaska 0.71 0.58
WC households 0.11 0.21
RUS households 0.41 0.42
Notes: Impacts on households in Canada omitted.
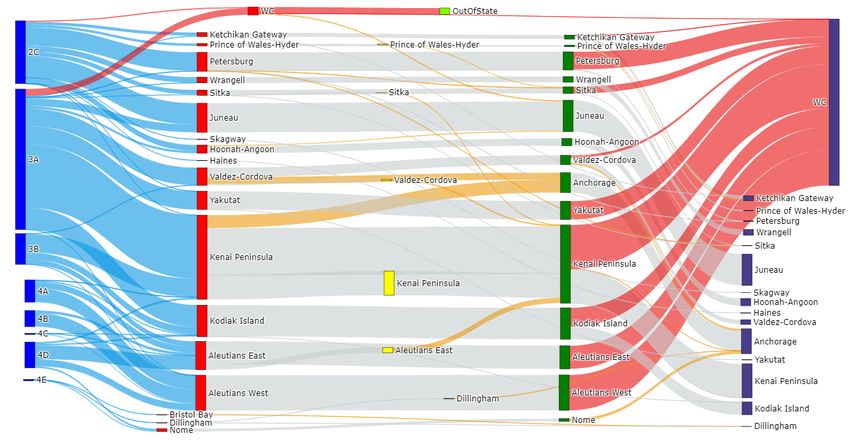
Community impacts in Alaska
Besides providing economic impact estimates for broadly-defined regions, the PHMEIA model results
can inform the community impacts of the Pacific halibut resource throughout its range and highlight
communities particularly dependent on fishing-related economic activities.
Based on the 2019 PHMEIA model, Pacific halibut commercial output in Alaska of USD 85.7 mil. 12
generated through Pacific halibut directed commercial fishing and directly forward-linked Pacific halibut
processing about USD 28.2 mil of earnings, of which USD 19.8 mil. (70.2%) was retained in Alaska. 13
The earnings were not evenly distributed (Table 5, Figure 1). The highest earnings are estimated for
Kenai Peninsula, Kodiak Island and Petersburg counties. The most direct earnings per dollar landed
are estimated for Ketchikan Gateway, Petersburg and Sitka countries, while the least for Aleutians
East, Yakutat and Aleutians West counties. Low earnings per 1 USD of Pacific halibut landed in the
county are a result of the outflow of earnings related to vessels’ home base, vessels’ ownership and
quota ownership, processing locations and processing companies’ ownership.
The last column of Table 5 represents the distribution of the total economic impact of Pacific halibut
industries on households in Alaska by county (USD 49.6 mil. in total for 2019). The remaining economic
impact on households representing indirect and induced EIs is evaluated based on local exposure 14 to
the region's Pacific halibut economic impact, using calculated multiplier effects. It is important to note
that these estimates assume the use of imported commodities in the same proportions by each county
and no cross-county trade in commodities, 15 which in turn implies that intra-Alaska indirect and induced
economic effects retention within the county.
12 Limited to harvest landed under IFQ and CDQ management program and reported sold.
13 Community effects assessment is currently limited to Alaska. The feasibility of a similar assessment for other regions is
currently under investigation. For example, Canadian quotas (L fishery), which are vessel-based, can be allocated based
on vessel owner’s residency, searchable in the Canadian Register of Vessels available through Transport Canada’s Vessel
Registration Query System.
14 Local exposure assessed as a county’s share in the total value of Pacific halibut landed in Alaska. Values were assigned
to counties based on the registered homeport of the vessel landing Pacific halibut.
15 This assumption implies that all commodities used in the production that are not imported from another state or country
are sourced from the county where the production process occurs. This applies to all industries in the economy. For
example, if the Pacific halibut fishing industry in Aleutians East county uses USD 1,000 of food commodity as an input to
production and, on average, Alaska imports from other US states and abroad 30% of food commodity it uses for production,
Page 11 of 28IPHC-2021-SRB018-09
The updated PHMEIA app translates these effects directly based on changes in harvest allocations by
IPHC Regulatory Area using eLandings data that include the harvest location (PHMEIA app release
2.0).
Table 5 Economic impacts estimates for Alaskan counties - 2019.
County Estimated earnings Earning per 1 USD of Change in % value of Estimated economic
from Pacific halibut Pacific halibut landed landings vs. % impact of Pacific
commercial sectors in the county estimated earnings halibut commercial
(fishing and fishing on
processing) households(1)
Aleutians East 0.32 0.067 - 0.86
Aleutians West 1.45 0.129 - 4.35
Anchorage 0.53 NA + 0.81
Bristol Bay c NA + c
Dillingham c c c c
Fairbanks North Star c NA + c
Haines 0.19 NA + 0.39
Hoonah-Angoon 0.40 0.201 - 1.09
Juneau 1.65 0.237 + 5.13
Kenai Peninsula 4.69 0.182 - 11.25
Ketchikan Gateway 0.39 0.502 + 0.85
Kodiak Island 3.23 0.369 + 8.31
Lake and Peninsula c NA c c
Matanuska-Susitna c NA + c
Nome 0.22 0.288 + 0.52
Petersburg 2.83 0.437 + 7.50
Prince of Wales-Hyder 0.22 0.362 + 0.59
Sitka 1.04 0.432 + 2.48
Skagway c NA + c
Southeast Fairbanks c NA + c
Valdez-Cordova 0.82 0.175 - 2.04
Wrangell 0.56 0.223 - 1.19
Yakutat 0.67 0.118 - 1.54
Notes: Counties with no Pacific halibut landings or earnings from Pacific halibut sectors omitted. c – masked to preserve confidentiality;
NA – not applicable (no landings reported for the given county). (1)Assumes intra-Alaska indirect and induced economic effects retention
within the county, i.e. no cross-county trade in commodities.
the model assumes that USD 700 of food commodity demanded by the Pacific halibut fishing industry is sourced from within
the Aleutians East county, not other Alaskan counties. The same rule is applied to the workforce. Available statistics suggest
a considerable movement of workers between Alaskan counties (see summary in Appendix 3 Intra-Alaska workplace
commuting flows summary). Further research on the impact of cross-county flow of commodities and wages on the
presented results is recommended.
Page 12 of 28IPHC-2021-SRB018-09
Figure 1 County-level economic impact estimates for Alaska – 2019.
Economic impact of Pacific halibut charter fishing in Alaska
Assuming that the economic impact of Pacific halibut charter fishing in Alaska is equivalent to estimating
the total economic loss resulting from the saltwater charter sector therein shrinking by share of Pacific
halibut effort in total effort (22.4% in 2019), the total economic impact of Pacific halibut charter sector
in Alaska is assessed at USD 87.7 mil for 2019.
It is more meaningful, however, to analyze the Pacific halibut charter sector in terms of its contribution
to households, particularly to local households. Table 6 summarizes the results, also providing a
comparison with the economic impact on households of commercial fishing in Alaska. Not surprisingly,
the economic impact per 1 USD of output is higher for the commercial vs. the charter sector. The
commercial sector is producing an intermediate input that is not only supporting suppliers to the
harvesting sector, but also the forward-linked processing sector. However, the economic impact of 1 lbs
of Pacific halibut removal counted against TAC in the stock assessment is 66% higher for the charter
sector when compared with the commercial sector.
It should also be noted that this assessment accounts for only a fraction of the Pacific halibut
contribution to the economy through recreational fishing. The analysis, at this time, does not account
for the impact of anglers spending money on durable goods they use on the charter trips (e.g., fishing
equipment) and expenditures by private anglers.
Page 13 of 28IPHC-2021-SRB018-09
Table 6 Results for the Pacific halibut charter sector in Alaska and comparison with the commercial
sector in Alaska (2019).
Unit Charter Commercial
Economic impact on households Total in mil. USD 27.08 105.45
Economic impact on households in Alaska Total in mil. USD 14.2 49.56
Economic impact on households USD per 1 USD of output 1.05 1.23
Economic impact on households in Alaska USD per 1 USD of output 0.55 0.58
Economic impact on households USD per 1 lb of removals 9.54 5.75
Economic impact on households in Alaska USD per 1 lb of removals 5.01 2.70
Final remarks
The study's main contribution is the first consistent estimation of both backward and forward-linked
effects of fisheries supply changes in a multiregional setup tracing the transmission of impacts
internationally. 16 By linking multiple spatial components, the model offers a better understanding of the
impacts of changes in shared stock supply.
The complexity of Pacific halibut supply-side restriction in the form of region-based allocations suggests
the need for a tool enabling regulators to assess various combinations of TAC allocations. To address
this, the results are complemented by an interactive web-based application allowing users to estimate
and visualize joint effects based on custom changes simultaneously applied to all IPHC-managed
Pacific halibut producing areas. The tool is available at:
http://iphcecon.westus2.cloudapp.azure.com:3838/ModelApp_azure/.
Release 2.0 of the tool (expected by May 20, 2021) accounts for the commercial sector and the charter
sector in Alaska. Inclusion of the recreational component for other regions is underway. The updated
version of the tool also translates changes in harvest allocations by IPHC Regulatory Area to county-
level economic impact estimates for Alaska, informing on community impacts of changes to Pacific
halibut regional allocations. See Appendix 2 Harvest translated into landings by county for example of
the translation table.
The updated PHMIA model translating the changes in harvest allocations by IPHC Regulatory area
directly to economic impact is also well adapted to use with the Pacific halibut management strategy
evaluation (MSE) framework (IPHC, 2020b). Economic performance metrics presented alongside
already developed biological/ecological performance metrics would bring the human dimension to the
MSE framework, adding to the IPHC’s portfolio of tools for assessing policy-oriented issues (as
requested by the Commission, IPHC-2021-AM097-R, AM097-Req.02).
Lastly, while the quantitative analysis is conducted with respect to components that involve monetary
transactions, Pacific halibut's value is also in its contribution to the diet through subsistence fisheries
and importance to the traditional users of the resource. To native people, traditional fisheries constitute
a vital aspect of local identity and a major factor in cohesion. One can also consider the Pacific halibut's
16 While a study analyzing the impact of Pacific salmon fisheries on the economy of both the USA and Canada using the IO
approach was identified (Gislason et al., 2017), the models therein are disconnected and do not offer the consistency of an
integrated multiregional model.
Page 14 of 28IPHC-2021-SRB018-09
existence value as an iconic fish of the Pacific Northwest. While these elements are not quantified at
this time, recognizing such an all-encompassing definition of the Pacific halibut resource contribution,
the project echoes a broader call to include the human dimension into the research on the impact of
management decisions, as well as changes in environmental or stock conditions.
OBJECTIVES
Table 7 summarizes the progress to date against the IPHC economic study objectives.
Table 7. The study objectives – summary of progress
Objective Status*
Item 1: Survey of previous studies and existing information ---
Item 1.a: Literature review COMPLETED
Item 1.b: Description of ongoing regular data collection programs COMPLETED
Item 1.c: Collection of primary data – commercial sector survey IN PROGRESS
Item 1.d: Collection of primary data – charter sector survey IN PROGRESS
Item 2: Comprehensive qualitative structural description of the current economics of the ---
Pacific halibut resource
Item 2.a: Description of the economics of the Pacific halibut commercial sector COMPLETED
Item 2.b: Description of the economics of the Pacific halibut recreational sector COMPLETED
Item 2.c: Description of the economics of other Pacific halibut sectors (bycatch, subsistence, IN PROGRESS
ceremonial, research, non-directed)
Item 3: Quantitative analysis of the economic impact of the directed Pacific halibut fishery ---
Item 3.a: Methodology – a model of the economy COMPLETED
Item 3.b: Methodology – inclusion of the commercial sector in the SAM COMPLETED(1)
Item 3.c: Methodology – inclusion of the recreational sector in the SAM COMPLETED(1)
Item 3.d: Methodology – economic value of the subsistence use IN PROGRESS(2)
Item 4: Account of the geography of the economic impact of the Pacific halibut sectors ---
Item 4.a: Visualization of region-specific economic impacts COMPLETED(1)
Item 5: Analysis of the community impacts of the Pacific halibut fishery throughout its range, ---
including all user groups
Item 5.a: Community impacts assessment of the Pacific halibut fishery COMPLETED(1)
Item 6: Summary of the methodology and results of the IPHC study in comparison to other ---
economic data and reports for the Pacific halibut resource, other regional fisheries, and
comparable seafood industry sectors
Item 6.a: Putting results into perspective IN PROGRESS
* All items marked as COMPLETED are subject to updates based on the direction of the project and evolution of the situation in the
Pacific halibut fisheries. (1)Subject to changes based on the data collected through the IPHC Economic survey. (2)Subject of collaborative
research proposal with NOAA Alaska Fisheries Science Center.
Suggested extensions beyond the 2-year time frame
Expanding the static SAM model to a computable general equilibrium model
Relaxing the assumption of fixed technical coefficients by specifying these coefficients econometrically
as a function of relative prices of inputs is one of the most compelling extensions to the static IO or
SAM models. Such models, generally referred to as computable general equilibrium (CGE) models,
require however extensive research to develop credible functional relationships between prices and
consumption that would guide economic agents' behavior in the model.
Page 15 of 28IPHC-2021-SRB018-09
The CGE approach is a preferred way forward when expanding the model usability and considering
applying it in conjunction with the Pacific halibut management strategy evaluation (IPHC, 2020b). The
dynamic model is well suited to analyze the impact of a broad suite of policies or external factors that
would affect the stock over time.
Improving the spatial granularity of the SAM model
Extending the community analysis beyond a simplified approach described in section Community
impacts in Alaska to a full community level (or any other spatial scale) SAM-based model requires
significant investment in identifying the economic relationships between different sectors or industries
(including both seafood and non-seafood industries) within each broader-defined region, this including
deriving estimates on intra-regional trade in commodities and flow of earnings. It is an appealing
extension of the current model, but not a feasible avenue for the project with its current time frame.
Study of recreational demand
It is important to note that while it is reasonable to assume that changes in harvest limits have a
relatively proportional impact on production by commercial fishers (unless these are dramatic and imply
fleet restructure or a significant shift in prices), the effects on the recreational sector are not so
straightforward.
A separate study estimating changes in saltwater recreational fishing participation as a response to the
changing recreational harvest limits is necessary if the stakeholders are interested in assessing policy
impact rather than snapshot economic impact. Such studies typically require surveying recreational
fishers.
There is scope for collaboration here with the NOAA Alaska Fisheries Science Center, where there is
ongoing work on estimating the marginal value of a Pacific halibut from the charter fishing sector in
Alaska. If the project was to continue beyond two years, the IPHC could consider surveying recreational
fishers. The charter owners who participated in the charter survey pilot implied willingness to help with,
e.g., distributing a link to the IPHC survey inquiring about their customers' fishing preferences. How to
reach private anglers partaking in unguided fishing was not researched at this time.
Assessment of the economic impact of other sources of Pacific halibut mortality
All-sectors-encompassing assessment of the economic impact of the Pacific halibut resource
necessitates the development of a methodological approach for the remaining sources of Pacific halibut
mortality, including subsistence fishing, bycatch, and research catch. Methods adopted for the
commercial and charter sector are not adequate for this portion of the harvest.
Page 16 of 28IPHC-2021-SRB018-09
RECOMMENDATIONS
That the SRB:
1) NOTE paper IPHC-2021-SRB018-09 which provides an update on the IPHC economic study,
including progress on the development of the economic impact assessment model, state of the
collection of primary economic data from Pacific halibut dependent sectors, and the most recent
set of results on regional and community impacts;
2) RECOMMEND the use of the PHMEIA model results as supplementary performance metrics in
the MSE framework;
3) RECOMMEND improvements to the PHMEIA and PHMEIA-r framework, including
methodological approach and model assumptions.
4) NOTE that improving the accuracy of economic impact assessment of the Pacific halibut
resource depends on broader stakeholders' active participation in developing the necessary data
for analysis and RECOMMEND additional outreach activities.
LITERATURE
ADFG (2020) Alaska Sport Fishing Survey database, Alaska Department of Fish and Game, Division
of Sport Fish. Available at: http://www.adfg.alaska.gov/sf/sportfishingsurvey.
ADFG (2021a) Commercial Fishing Reporting: eLandings. Available at:
http://www.adfg.alaska.gov/index.cfm?adfg=fishlicense.elandings.
ADFG (2021b) Commercial Permit and License Holders Listing. Available at:
https://www.adfg.alaska.gov/index.cfm?adfg=fishlicense.holders.
AgriService BC (2018) British Columbia Seafood Processing Employment 2014.
AK DLWD (2020) Statewide Data: Fishing and Seafood Industry Data, Department of Labor and
Workforce Development. Available at: https://live.laborstats.alaska.gov/seafood/seafoodstatewide.cfm.
Aslaksen, I. et al. (2008) ‘Interdependency of subsistence and market economies in the Arctic’, in The
Economy of the North. Statistics Norway. Available at:
http://www.ssb.no/english/subjects/00/00/30/sa84_en/kap5.pdf.
BEA (2020) Input-Output Accounts Data, Bureau of Economic Analysis. Available at:
https://www.bea.gov/industry/input-output-accounts-data.
Carothers, C., Lew, D. K. and Sepez, J. (2010) ‘Fishing rights and small communities: Alaska halibut
IFQ transfer patterns’, Ocean and Coastal Management, 53(9), pp. 518–523. doi:
10.1016/j.ocecoaman.2010.04.014.
CFEC (2021a) CFEC Public Search Application - Permits. Available at:
https://www.cfec.state.ak.us/plook/#permits.
CFEC (2021b) CFEC Public Search Application - Vessels. Available at:
https://www.cfec.state.ak.us/plook/#vessels.
Page 17 of 28IPHC-2021-SRB018-09
Cheung, W. W. L. and Frölicher, T. L. (2020) ‘Marine heatwaves exacerbate climate change impacts
for fisheries in the northeast Pacific’, Scientific Reports, 10(1), pp. 1–10. doi: 10.1038/s41598-020-
63650-z.
COAR (2021) Commercial Fishing Reporting, Commercial Operator’s Annual Reports. Available at:
https://www.adfg.alaska.gov/index.cfm?adfg=fishlicense.coar.
DFO (2021) Seafisheries Landings, Fisheries and Oceans Canada. Available at: https://www.dfo-
mpo.gc.ca/stats/commercial/sea-maritimes-eng.htm.
Edwards, D. N. and Pinkerton, E. (2020) ‘Priced out of ownership: Quota leasing impacts on the
financial performance of owner-operators’, Marine Policy, 111. doi: 10.1016/j.marpol.2019.103718.
Ess, C. (2020) ‘Restaurant closings, depressed Japan market push halibut, blackcod prices down’,
National Fisherman.
Estus, J. (2020) ‘COVID spikes at Alaska sh processing plants raise alarm’, Indian Country Today.
Gislason, G. et al. (2017) Economic Impacts of Pacific Salmon Fisheries.
Haener, M. K. et al. (2001) ‘Can Stated Preference Methods be used to Value Attributes of Subsistence
Hunting by Aboriginal Peoples? A Case Study in Northern Saskatchewan’, American Journal of
Agricultural Economics, 83(5), pp. 1334–1340. doi: https://doi.org/10.1111/0002-9092.00287.
IPHC (2020a) 2020 Pacific Halibut Landings, International Pacific Halibut Commission. Available at:
https://www.iphc.int/data/landings-2020.
IPHC (2020b) Management Strategy Evaluation, International Pacific Halibut Commission. Available
at: https://www.iphc.int/management/science-and-research/management-strategy-evaluation.
IRS (2020) SOI Tax Stats - Migration Data, Internal Revenue Service. Available at:
https://www.irs.gov/statistics/soi-tax-stats-migration-data.
Krakow, M. (2020) ‘56 workers at Anchorage seafood plant test positive for COVID-19’, Anchorage
Daily News.
Kreiger, R. and Whitney, S. (2021) Nonresidents Working in Alaska 2019.
Krieg, T. M., Holen, D. L. and Koster, D. (2009) Subsistence harvests and uses of wild resources in
Igiugig, Kokhanok, Koliganek, Levelock, and New Stuyahok, Alaska, 2005.
Leonard, J. and Watson, P. (2011) ‘Description of the Input-Output model for Pacific Coast fisheries’,
NOAA Technical Memorandum NMFS-NWFSC, 111(April).
Lew, D. K. and Lee, J. (2019) ‘Costs, Earnings, and Employment in the Alaska Saltwater Sport Fishing
Charter Sector, 2017’, NOAA Technical Memorandum NMFS-AFSC, 398. Available at:
https://repository.library.noaa.gov/view/noaa/22556.
Miller, R. E. and Blair, P. D. (2009) Input-Output Analysis: Foundations and Extensions. Cambridge:
Cambridge University Press. doi: DOI: 10.1017/CBO9780511626982.
NOAA (2020) Foreign Trade, NOAA Fisheries. Available at:
https://www.st.nmfs.noaa.gov/apex/f?p=213:3.
Page 18 of 28IPHC-2021-SRB018-09
NOAA (2021a) Annual commercial landing statistics. Available at:
https://foss.nmfs.noaa.gov/apexfoss/f?p=215.
NOAA (2021b) Charter (Sport) Halibut - Charter Halibut Permits List. Available at:
https://www.fisheries.noaa.gov/alaska/commercial-fishing/permits-and-licenses-issued-
alaska#charter-(sport)-halibut.
NOAA (2021c) Marine Recreational Information Program Query Results. Available at:
https://www.fisheries.noaa.gov/data-tools/recreational-fisheries-statistics-queries.
OECD (2020) ‘Fisheries, aquaculture and COVID-19: Issues and Policy Responses’, Tackling
Coronavirus (Covid-19).
RecFIN (2020) Pacific Recreational Fisheries Information Network (RecFIN) APEX reporting system,
Recreational Fisheries Information Network. Available at: https://reports.psmfc.org/recfin/f?p=601.
Ross, I. (2020) For Alaska’s seafood processors, the COVID-19 pandemic has cost tens of millions of
dollars, KDLG.
Sapin, R. and Fiorillo, J. (2020) ‘Seafood processors pay a steep price to keep workers safe from
coronavirus’, IntraFish. Available at: https://www.intrafish.com/processing/seafood-processors-pay-a-
steep-price-to-keep-workers-safe-from-coronavirus/2-1-852502.
Seung, C. K. and Lew, D. K. (2017) ‘A multiregional approach for estimating the economic impact of
harvest restrictions on saltwater sportfishing’, North American Journal of Fisheries Management, 37(5),
pp. 1112–1129. doi: 10.1080/02755947.2017.1345808.
Seung, C. K., Waters, E. and Taylor, M. L. (2019) ‘Developing a Multi-Regional Social Accounting
Matrix (MRSAM) for Southwest Alaska Fisheries’, NOAA Technical Memorandum NMFS‐AFSC, 399.
Southwick Associates (2014) Alaska’s Nonresident Anglers, 2009-2013.
Statistics Canada (2020a) Canadian International Merchandise Trade Database. Available at:
https://www5.statcan.gc.ca/cimt-cicm/home-accueil?lang=eng.
Statistics Canada (2020b) Supply and Use Tables. Available at:
https://www150.statcan.gc.ca/n1/en/catalogue/15-602-X.
Statistics Canada (2021) Table 14-10-0023-01 Labour force characteristics by industry, annual.
Available at: https://doi.org/10.25318/1410002301-eng.
Steinback, S. R. and Thunberg, E. M. (2006) ‘Northeast Region Commercial Fishing Input-Output
Model’, NOAA Technical Memorandum NMFS-NE, 188.
Stremple, C. (2020) ‘Local fish put Haines residents to work despite COVID-19 economic slump’,
KHNS.
Szymkowiak, M. and Kasperski, S. (2020) ‘Sustaining an Alaska Coastal Community: Integrating Place
Based Well-Being Indicators and Fisheries Participation’, Coastal Management, pp. 1–25. doi:
10.1080/08920753.2021.1846165.
Szymkowiak, M., Kasperski, S. and Lew, D. K. (2019) ‘Identifying community risk factors for quota share
Page 19 of 28You can also read