Changing friction at the base of an Alpine glacier - Nature
←
→
Page content transcription
If your browser does not render page correctly, please read the page content below
www.nature.com/scientificreports
OPEN Changing friction at the base
of an Alpine glacier
Dominik Gräff* & Fabian Walter
Repeating earthquakes are a global phenomenon of tectonic faults. Multiple ruptures on the same
fault asperities lead to nearly identical waveforms characteristic for these seismic events. We
identify their microseismic counterparts beneath an Alpine glacier, where basal sliding accounts
for a significant amount of ice flow. In contrast to tectonic faults, Alpine glacier beds are subject to
large variations in sliding velocity and effective normal stresses. This leads to inter- and sub-seasonal
variations in released seismic moment from stick–slip asperities, which we explain with the rate-and-
state friction formalism. During summer, numerically modelled effective normal stresses at asperities
are three times higher than in winter, which increases the local shear resistance by the same factor.
Stronger summer asperities therefore tend to form in bed regions well connected to the efficient
subglacial drainage system. Moreover, asperities organise themselves into a state of subcriticality,
transferring stresses between each other. We argue that this seismic stick–slip behavior has potentially
far-reaching consequences for glacier sliding and in particular for catastrophic failure of unstable ice
masses.
Processes controlling glacier and ice stream dynamics occur at or close to the ice-bed interface1. These basal pro-
cesses regulate stagnation or acceleration of polar ice s treams2,3, are responsible for seasonal speed up of tidewater
outlet glaciers4, initialize local instabilities and enable their propagation as surges along the entire glacier b ed5.
This may cause catastrophic failure of basal resistance resulting in break-off events6 or runaway surges during
which entire glacier tongues detach from their b eds7.
In conventional glacier sliding theories, normal traction at perfectly lubricated bed obstacles controls basal
sliding by enhanced viscous creep and melt-refreeze c ycles8. On soft beds, till deformation and true basal sliding
of the ice over the till surface takes place9,10. Though initially ignored in sliding investigations, dynamically chang-
ing friction at the bed may also play a critical role in basal sliding: Sudden sliding events of Antarctic ice streams
suggest a frictional resistance, which evolves over sub hourly time scales11. Laboratory experiments confirm that
under certain conditions, rate-weakening friction at the ice stream bed can explain sliding instabilities and thus
the episodic ice stream acceleration12,13. Moreover, sliding episodes seem to be the sum of countless microseismic
stick–slip events, which themselves are a manifestation of rate-weakening f riction14.
In recent years, microseismic stick–slip events have been observed at fast ice s treams15–17 as well as slowly
moving parts of the Greenland ice sheet and Alpine g laciers18–20. Microseismic stick–slip events tend to cluster
at distinct bed locations producing nearly identical seismic waveforms and repeated ruptures may coalesce into
sustained tremor-like signals16,21. The clustering behavior can be explained with rate-weakening friction asperi-
ties embedded within an otherwise smoothly sliding, rate-strengthening ice-bed interface, a concept, which has
been extensively studied in the context of tectonic f aults22.
The underlying theoretical principles are still debated but have to include a dependence on subglacial water
pressures supported by decades of observations23,24. In this regard, the configuration of the subglacial drainage
system is of primary importance, as it can consist of efficient channels operating under low pressures or of net-
works of smaller, inefficient and pressurized drainage p athways25. Depending on water availability, subglacial
pressures and drainage channels evolve over seasonal or sub seasonal time scales: water-filled cavities, which
are part of the inefficient drainage system, open during periods of high subglacial water pressure and stay open
throughout the melt season reducing the contact forces between ice and bed thus enhancing sliding26. In con-
trast, efficient drainage channels characteristic for the melt season are more dynamic and react to diurnal vari-
ations in meltwater supply from the s urface27. The spatially and temporarily varying hydraulic regimes have to
be accounted for in realistic theories of basal sliding. Although microseismic stick–slip events seem to react to
meltwater input20, a systematic analysis of stick–slip activity is still needed to clarify if dynamic friction satisfies
the hydraulic constraints on basal sliding.
Laboratory of Hydraulics, Hydrology and Glaciology (VAW), ETH Zürich, Zürich, Switzerland. *email: graeff@vaw.
baug.ethz.ch
Scientific Reports | (2021) 11:10872 | https://doi.org/10.1038/s41598-021-90176-9 1
Vol.:(0123456789)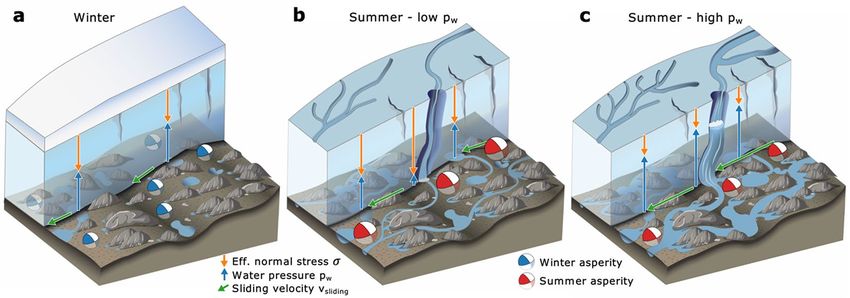
www.nature.com/scientificreports/
2400
a b c
N 2520
2375
Normalized ground velocity
Study site
Ice flow 2350
2505
Height [m a.s.l.]
2325
2490
2300
Zurich 2275
Bern 2475
Rhone-
gletscher 2250
2225
0.0 0.1 0.2 0.3
0 1 2 3 km 0 100 200 m
2200 Time [s]
Figure 1. Study site with stick–slip asperities and seismogram. (a) Orthoimage of Rhonegletscher and study
site. (b) Zoom into the red rectangle of a. Background shows the bedrock topography from interpolated ground-
penetrating-radar surveys29. Surface topography is indicated by gray contours. Red (blue) triangles indicate
seismic sensor array in summer (winter). Red (blue) beach balls show focal mechanisms of individual summer
(winter) stick–slip clusters. Zoom into dense asperity region is shown in Supplementary Fig. S6. (c) Vertical
seismograms of events from one cluster. Source of orthoimage in a: Swiss Federal Office of Topography.
In this study, we investigate the interplay between frictional glacier sliding and varying sub-glacial condi-
tions beneath an Alpine glacier. Stick–slip asperities react to seasonal changes in glacial melt water supply and
organize themselves into a sub-critical state in which they react to each other’s activity over hundreds of meters.
Elucidating how stresses and sliding velocity at the glacier bed change on inter- and sub-seasonal time scales,
we show that rate-and-state friction developed for tectonic earthquake cycles is a viable theoretical framework
to describe basal sliding.
Results
Study site and data acquisition. Our study site is located in the ablation zone of Rhonegletscher (Swit-
zerland) at an elevation of ~ 2500 m above sea level, where the glacier is ~ 200 m thick and at the pressure melt-
ing point (rectangle in Fig. 1a at WGS84: 46.597, 8.382)28. As shown below, seasonal and diurnal variations in
surface velocity indicate a significant contribution of basal sliding to ice flow. During a winter measurement
period (February 13th–March 20th, 2018) and a summer period (July 21st–August 22nd, 2018), we deployed
seismometer arrays consisting of seven and nine seismometers, respectively, forming 300–500 m large apertures
(Fig. 1b and Supplementary Table S1). Three stations were co-located in both years and during summer were
equipped with GPS antennae for measurements of surface displacements.
Basal microseismic stick–slip asperities. During both measurement periods, we recorded basal micro-
seismic stick–slip events (Mw ≈ −3 to −2, i.e. very weak) with shear faulting source mechanisms indicated by
mixed P-wave polarities throughout the arrays. We detect the stick–slip signals with a spectral discriminator,
apply hierarchical clustering to identify events with identical waveforms and perform a template match search
on the continuous data (Methods/Supplementary Fig. S1, S2, S3, S4, S5). Using a probabilistic nonlinear hypo-
center location scheme30 we locate stick–slip sources accounting for picking and velocity model uncertainties
(Supplementary Table S4).
The 1158 stick–slip events recorded in summer form seven clusters, the 2025 winter events form eleven
clusters (Fig. 1b), with each cluster containing events of nearly identical waveforms (Fig. 1c). Each cluster is
associated with the hypocentral location of an asperity, where bed properties allow for the accumulation of elastic
strain, which is released during stick–slip e vents12. The summer and winter cluster locations are not identical,
showing that permanent topographic bed features are not the primary control of stick–slip events, in contrast
to ice shelf pinning points in Antarctica producing stick–slip e vents31. Location uncertainties of three asperities
from winter and summer overlap, however comparison of waveforms shows that locations differ slightly (Sup-
plementary Fig. S6). This indicates that on small spatial scales, subglacial conditions favoring stick–slip asperities
change between the seasons. ·
On average, the seismic moment rate ( M0) released from summer asperities is three times higher compared
to winter asperities. Seismic moments of events from winter asperities are typically half a magnitude lower
than during summer. However, melt-induced seismic background noise reduces detectability of low-magnitude
stick–slip events in summer32. Thus, undetected events with weak seismic moments· comparable to winter events
may exist during summer. This means that our calculated seasonal difference in M0 is a lower bound.
Stick–slip event scaling relation. Within individual asperities, winter events are weaker with shorter
recurrence time compared to summer. Combined, they follow a scaling relation between recurrence time Tr and
seismic moment M0 of Tr ∝ M00.53±0.01 implying that the rate of seismic moment release is higher in summer
compared to the winter season (Fig. 2a).
Scientific Reports | (2021) 11:10872 | https://doi.org/10.1038/s41598-021-90176-9 2
Vol:.(1234567890)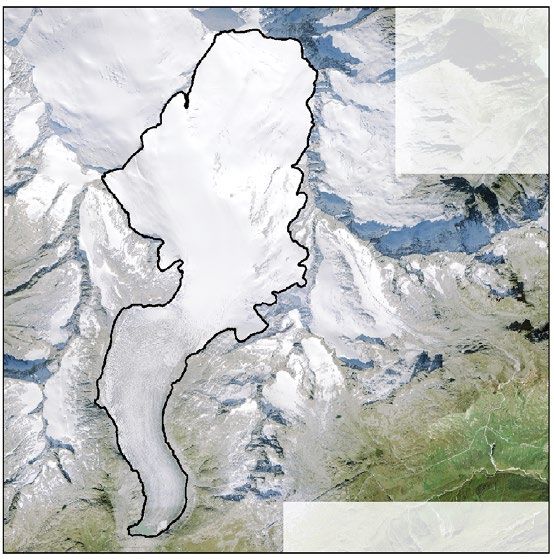
www.nature.com/scientificreports/
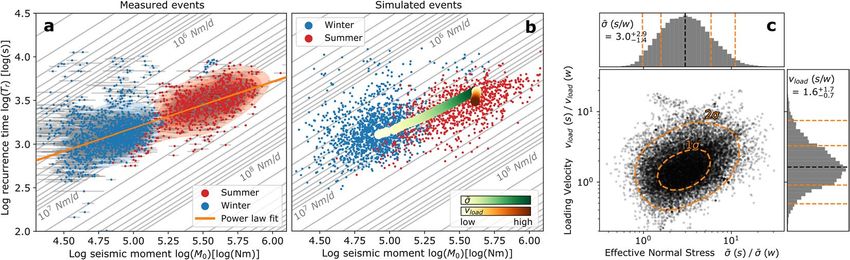
Figure 2. Recurrence time-seismic moment scaling relation. (a) Double-logarithmic scatter plot of measured
intra-asperity recurrence time versus event seismic moment for summer (red) and winter (blue) events. Orange
line indicates the 1σ area of a power law fit. Along gray diagonal lines, recurrence times and seismic moment
·
change while seismic moment
is constant M0 = M0 /Tr = const.→
rate
·
log(Tr ) = log(M0 ) − log M0 + log(86400). Plotted moment rates follow a logarithmic scale increasing
towards the lower right and selected values are labeled. (b) Same as a, but with simulated data points. Green and
red paths describe a threefold increase in effective normal stress and 1.6-fold increase in loading velocity that is
needed to describe recurrence time and seismic moment increases from winter to summer. (c) Double-
logarithmic scatter plot showing the parameters that were adjusted to reproduce the data in a. The x-axis shows
the ratio of effective normal stress in summer vs. winter, the y-axis shows the ratio of the loading velocity in
summer vs. winter. Histograms show the one-dimensional distribution of the scatter points. Orange dashed
lines indicate 1σ and 2σ uncertainty regions.
The measured dependence of event recurrence on seismic moment is approximately three times as strong as
1/6
what is expected for a seismogenic strike-slip fault that also slips aseismically, which is Tr ∝ M0 22. It is still 1.5
1/3
times stronger than for a purely seismically slipping fault for which one would expect Tr ∝ M0 33. However,
the comparison to scaling relations for tectonic faults is questionable, because in our alpine glacier setting, envi-
ronmental parameters controlling both recurrence time and seismic moment vary substantially more. Seasonal
and daily sliding velocities, which are responsible for elastic loading on basal asperities, vary by up to 100%34.
Most importantly, depending on surface melt production, subglacial water pressures may vary by one hundred
meter of water column over the course of a few hours and locally reach flotation level during peak p ressures35.
As a result, the seismic stress drop at stick–slip asperities is not constant such that a simple normalization by
the sliding velocity36 cannot explain the observed scaling between Tr and M0 and would result in even higher
scaling exponents (Supplementary Notes). Therefore, changing conditions at the glacier bed including changing
effective normal stresses have to be considered.
Modelling summer–winter scaling. On frictional faults, sliding and cycles of quiescence and seismic
activity are described by rate-and-state laws relating the coefficient of friction µ to an evolving interface state
and the sliding v elocity37. Seismogenic sliding arises as an instability when friction decreases with increasing
sliding velocity (‘rate-weakening’). In contrast, rate-strengthening friction tends to stabilize sliding via increased
frictional drag and therefore arrests transient increases in sliding velocity.
Rate-and-state friction is commonly described by the logarithmic law
µ = µ0 + a ln(v/v0 ) + b ln(v0 θ/L) (1)
where v is the sliding velocity, v0 is the steady-state sliding velocity such that µ = µ0 when v = v0. a, b are material
parameters of the interface and rate-weakening holds when a < b. The critical slip distance L is often interpreted
as a memory distance over which the population of small-scale contacts between the two fault sides c hanges38,39.
θ is the state variable that represents an average contact lifetime and which is described by an evolution l aw37:
dθ θv
=1− (2)
dt L
We use (1) in combination with (2) in order to model our observed scaling of recurrence time and seismic
moment of stick–slip events and in particular the difference between summer and winter measurements (Fig. 2a).
The effect of varying subglacial water pressures is captured by equating µ to the ratio of effective normal stress
σ (normal stress minus subglacial water pressure) and shear stress τ at the bed:
τ =µ·σ (3)
Sliding velocities vary in response to these pressure variations24,26. The parameters L, a, b are difficult to
constrain, but laboratory measurements have established conditions resulting in rate-weakening beds for ice at
the pressure melting point and specific interface conditions40.
The rate-and-state formalism describes friction as velocity dependent and allows interface strengthening
(‘healing’) between events. This means that simple failure thresholds for sliding velocity or shear stress do not
Scientific Reports | (2021) 11:10872 | https://doi.org/10.1038/s41598-021-90176-9 3
Vol.:(0123456789)www.nature.com/scientificreports/
1e6 1e7
1.2 3.0 1.5
a Summer events b 16 Summer
Winter
Surface velocity change [cm/d])
Winter events
Seismic moment rate [Nm/d]
1.0 2.5
Event seismic moment [Nm]
Summer moment rate 1.0
14
Surface velocity [cm/d]
Summer velocity change
0.8 2.0
0.5 12
0.6 1.5
10
0.0
0.4 1.0 8
0.5
0.2 0.5 6
0.0 0.0 1.0 4
07-21 07-25 07-29 08-01 08-05 08-09 08-13 08-17 08-21
Summer measurement time [month-day]
02-13 02-17 02-21 02-25 03-01 03-05 03-09 03-13 03-17
Winter measurement time [month-day]
Figure 3. Stick–slip activity time series. (a) Time series of stick–slip events for the summer (different color
dots) and winter measurement periods (gray dots with time scale on the bottom). Blue area indicates the
released seismic moment for the summer events with 1σ uncertainty. Yellow area indicates the measured surface
velocity during the summer measurement period with 1σ uncertainty. (b) Normalized histogram of surface
velocity measurements during summer and winter. The difference is attributed to basal sliding.
exist, but that stick–slip initiation depends nonlinearly on various parameters, including the time elapsed since
the previous event. Rate-and-state friction is a semi-empirical formulation, which holds for different materials
in laboratory and natural faults. Physical interpretation for rate-strengthening and weakening parametrized by
L, a and b are found in characteristic material behavior. For ice-bed contacts, healing may be related to pressure-
enhanced melting at contacts between ice and small-scale bed bumps41. Regelation and viscous ice flow near the
ice-bed interface are candidates for rate-strengthening m echanisms8, whereas sediment entrainment at the ice
sole can lead to rate-weakening12,42.
In order to simulate the observed scaling between seismic moment and recurrence time, we vary effective
normal stress and loading velocity (rate of build-up shear stress at asperity) between pairs of summer and
winter simulations while keeping L, v0 , µ0 , a, and b constant within these pairs (Supplementary Table S3). Our
numerical implementation of rate-and-state friction is based on a 1D spring-loaded slider-block, which simu-
lates the stick–slip asperity via the block-bed contact and lumps elastic stresses within the ice and bed into the
spring force. This model disregards the influence of fault area, which we expect to be dictated by regular bedrock
undulations filled with subglacial t ill43 and thus to remain constant between summer and winter. Moreover, by
averaging seismic moments and recurrence times over all asperities, local deviations from mean fault areas or
material composition at individual asperities are expected to cancel out. The assumption of a constant fault area
leads to a proportionality between the seismic stress drop �τs , and the measured seismic moment M0 (Stein
and Wysession, 2003):
7 M0
�τs = ⇒ �τs ∝ M0 for fault dimension D = const. (4)
16 D3
We apply Bayes’ theorem44 with data variance given by our spread in moment and recurrence time measure-
ments and priors listed in the Supplementary Table S3. As a result, the effective normal stress at the basal asperi-
ties during summer is expected to be a factor of 3.0+2.9
−1.4 larger than in winter, and summer sliding velocities are
required to be 1.6+1.7
−0.7 times larger than in winter (Fig. 2c). Uncertainties of one standard deviation are given and
arise primarily from overlapping summer/winter data points (Fig. 2a, b).
An increase in basal loading velocity for the summer season agrees with surface velocity measurements
(Fig. 3b). No simple measurement exists to confirm the calculated increase in effective normal stress at the asperi-
ties. However, the increase shows that during summer, subglacial water pressures at asperities are lower such
that effective normal stresses increase. This can be explained by efficient drainage channels operating under low
water pressures27 and nearby asperities which highlights the hydraulic control on frictional resistance to ice flow.
Sub‑seasonal stick–slip variations. We compare seismic moment release over six-hour windows
summed over all asperities to surface velocity variations (Fig. 3a). Both time series were bandpass filtered (Meth-
ods) to suppress fluctuations of the diurnal melt cycle and velocity variations thus reflect longer term trends in
surface melt water production and the connectivity of un-channelized regions of the bed45. Measured surface
velocity variations result from sliding variations and mirror released seismic moment rate: Within one or two
days, moment rate maxima and minima respectively coincide with minima and maxima in surface velocity
(Fig. 3a, note the flipped velocity axis). Surface velocity decreases when the glacier lowers due to falling water
pressures. This can be explained by the increase of contact area between the glacier ice and the underlying b ed46
resulting in increased frictional resistance at asperities.
Higher effective normal stresses at the asperities increase recurrence times. This, in turn, increases fault
healing, which overcompensates decreasing loading velocities to induce higher seismic moment rates. This
overcompensation is another manifestation of the rate-and-state effect responsible for the winter-to-summer
increase in effective pressure, which is around twice as large as the concurrent loading velocity increase (3.0+2.9
−1.4
compared to 1.6+1.7
−0.7).
Scientific Reports | (2021) 11:10872 | https://doi.org/10.1038/s41598-021-90176-9 4
Vol:.(1234567890)www.nature.com/scientificreports/
Figure 4. Conceptual model of subglacial hydraulic system and asperities therein. (a) Subglacial environment
in winter. Isolated cavities dominate the subglacial hydraulic system. Sliding velocity is low and effective normal
stresses and stick–slip asperities are evenly distributed over the bed (b) Summer conditions during phases with
low basal water pressure. Linked cavities have opened up and constitute the non-efficient subglacial drainage
system that enables high sliding velocities even during low water pressures in channels. Stick–slip asperities
develop close to these channels and release high moments. (c) Similar to b, but with high basal water pressures
resulting in high sliding velocities and less moment released at stick–slip asperities compared to summer
conditions with low water pressures shown in panel b.
During episodes of fast sliding and corresponding low seismic moment rates, effective stresses at the asperi-
ties reduce due to pressurization of the subglacial discharge system and can locally even lead to uplift of the ice
column23. Accordingly, effective stresses may fall below a critical value σc which for a spring-loaded slider-block
model with spring constant k is σc = kL/(b − a)37. In this case, even for rate-weakening bed material, frictional
sliding proceeds aseismically.
Discussion
Our analysis reveals differences in seismogenic glacier sliding at seasonal and sub-seasonal time scales. Rate-
and-state friction explains these observations in terms of variations in glacier loading velocity and effective
normal stresses. On seasonal timescales, both parameters act in accord to increase stick–slip magnitudes more
strongly than recurrence times resulting in higher moment rates in summer. On the other hand, for multi-day
variations in stick–slip activity during summer, loading velocity and effective normal stresses compete, and
the latter dominates to increase moment rate during decelerating sliding by the effect of fault healing. In this
picture, stick–slip asperities form preferentially at bed regions, which are well connected to efficient subglacial
drainage channels and thus are subject to higher effective pressures and variations thereof (Fig. 4)27. Basal sliding
velocities are driven by pressurized subglacial cavities which dampen the response of sliding to changing water
pressures in the efficient drainage s ystem26,45. These findings highlight the inhomogeneous hydraulic control
on basal resistance to ice flow in the presence of an efficient subglacial drainage system. Our 1D rate-and-state
friction model requires a tripling in effective normal stress for summer conditions compared to winter, but only
1.6-fold increase in loading velocities (Fig. 2).
The concept of hydraulically-induced sliding variations is not n ew24,26,47. However, our findings show that
high effective normal stresses and hence high shear resistance focus at discrete patches acting as microseismic
stick–slip asperities48. The effect of this stress concentration on large-scale basal resistance to ice flow depends on
whether basal motion at stick–slip asperities is entirely seismic or contains other mechanisms such as enhanced
viscous ice deformation of the ice sole. Even for the latter case, these stress concentrations will locally affect basal
motion, since ice deformation depends on effective stress: Close to flotation level, our calculated threefold change
in effective stress can result in order-of-magnitude changes in effective viscosity of temperate i ce49.
The presented stick–slip catalogue shows that at least parts of the glacier bed behave like tectonic faults sub-
ject to rate-and-state friction 37. Glacial data sets therefore provide new observational constraints on numerical
rate-and-state friction models, because in contrast to tectonic faults, they are subject to large variations in effec-
tive normal stress and loading v elocity36 resulting in varying static stress drops. The correspondence between
moment rate extrema and velocity variations in summer (Fig. 3) indicates that stick–slip asperities influence
each other’s behavior over distances of at least 100–200 m: different asperities contribute at different times to
moment rate maxima, such that reduced seismic activity of one asperity is compensated by increased activity of
another asperity. This constitutes a self-organized system where overall structural order forms without an external
control50. Stress transfer between asperities occurs on daily or even sub-daily timescales. This is around or above
the Maxwell relaxation time, which is on the order of hours for high effective pressures at stick–slip asperities,
and up to a several days at low effective pressures typical for inefficient drainage regions between asperities49. The
absence of stick–slip episodes rupturing several asperities at once implies that stress transfer between asperities
mainly happens via viscous creep through rate-strengthening bed regions but does not exclude elastic stress
transfer between weakly mechanically coupled asperities.
Scientific Reports | (2021) 11:10872 | https://doi.org/10.1038/s41598-021-90176-9 5
Vol.:(0123456789)www.nature.com/scientificreports/
Similar to repeating earthquakes at the Parkfield section of the San Andreas F ault51, stick–slip asperities at
Rhonegletscher must not exceed a critical density and are only weakly mechanically coupled52. Otherwise, global
ruptures of the self-organizing stick–slip failures eventually result from mutual triggering of asperities that are
close to a state of failure similar as for earthquakes and no characteristic recurrence time of slips exist53. Moments,
spatial and temporal distributions then scale as power laws54. For stick–slip asperities at Rhonegletscher, the lack
of strong mechanical coupling between the asperities prohibits these large-scale failures resulting in moment
dependent recurrence times revealing a memory of past events and a sub-critical state of self-organization55,
whereas for a super-critical asperity density, randomness in recurrence times is e xpected52. On the other hand,
critical asperity density could be a failure criterion for catastrophic glacial collapses7. Accordingly, we interpret
regular glacial surge behavior as a sub-critical re-organization of the stress system similar to our sub-seasonal
glacier velocity variations at Rhonegletscher.
Sliding seismicity at the glacier bed is strongly guided by the subglacial hydraulic system. Our findings show
that concepts developed for earthquake faults apply to frictional processes at the glacier bed and may play an
important role in the stability of small mountain glaciers and big ice streams. This also implies that glaciers offer
a natural laboratory to study earthquake cycles and fault microseismicity subject to much higher variability in
loading velocity and effective normal stress compared to tectonic strike-slip faults themselves. Relatively cheap
in-situ glacial drilling experiments analogous to the San Andreas Fault Observatory at Depth, could image
microseismic sliding at an unrivaled resolution.
Methods
Data acquisition. From September 28th 2017 to August 13th 2019, we operated three Lennartz 3D/BHs
seismometers in an equilateral triangle with ~ 200 m side lengths in shallow (2–4 m) postholes in the ablation
zone of Rhonegletscher (station RA51-53 of network 4D). The postholes had to be re-drilled several times dur-
ing the deployment due to a surface melt of more than 10 m. We deployed these seismometers together with
Nanometrics Taurus and Centaur digitizers sampling sensor output voltage at 500 Hz.
During the winter measurement period analyzed here (February 13th – March 20th, 2018), we extended the
triangular array with four HL-6B 3-D geophones. We record their measurements with DIGOS DATA-CUBE3
digitizers sampling at 400 Hz. During the summer measurement period (July 21st – August 22nd, 2018), we
extended the existing three-seismometer array with six additional Lennartz 3D/BHs sensors, each connected to
a Nanometrics Centaur digitizer sampling at 500 Hz. Locations and specifications of all passive seismic stations
are in the Supplementary Table S1.
Co-located with the three multiannual Lennartz 3D/BHs stations, we operated three PPM 2022-S13 GNSS
sensors sampled at 15 s. Additionally, we installed a reference station on the orographic right moraine of the
glacier for differential positioning in the data post-processing.
Event catalog creation. Event detection. Signal discrimination between basal icequakes (stick–slip and
tensile faulting) and surface icequakes mainly caused by crevassing, is based on high frequency content and
short duration of the former. Elevated melt-induced seismic background noise in the ablation zone of alpine
glaciers limits detectability of relatively weak stick–slip signals. In continuous spectrograms we automatically
detect basal icequakes by searching for events with high (> 10 Hz) and broad frequency content. We verify these
detections by the existence of distinct P- and S-wave arrivals and assess their frequency content and the relative
power within both phases (Supplementary Fig. S1, S2).
Hierarchical clustering. Basal icequakes at glaciers are known to cluster temporally but also spatially result-
ing in virtually identical seismic waveforms18,20 (Supplementary Fig. S5). We use a hierarchical clustering to
group events with similar waveforms. Orphans (events with low correlation with the rest of the catalogue) are
discarded and event waveforms within clusters are stacked. These stacks are again clustered hierarchically to
identify multiply detected clusters. The hierarchical clustering is designed to create clean rather than complete
clusters, because the completeness will be achieved by subsequent template matching. For the further analysis we
accept only clusters with mixed P-wave polarities. With this requirement we almost exclusively limit our study
to the bed area directly below the seismometer arrays (i.e. one double-couple nodal plane of the seismic source
must cross the array). On the other hand, this mixed polarity requirement ensures that we do not include basal
crevassing events in our stick–slip catalogue.
Cluster cross‑correlation. With the waveform stack of each stick–slip cluster, we run a normalized matched
template cross-correlation search based on the algorithm E Qcorrscan56 additionally accounting for template
waveform SNR by only correlating station recordings with SNR above 3.5. By looking at the distribution of the
cross-correlation coefficients, we define a threshold that separates events that we assume to be correct detec-
tions from false ones. This threshold is often clear from a kink in the cross-correlation coefficients’ histogram
separating correctly matched events from other events or noise that are more frequently matched at low cross-
correlation coefficients. (Supplementary Fig. S4).
Cluster location. For cluster location we use the probabilistic nonlinear hypocenter location algorithm
NonLinLoc30 that accounts for picking and velocity model uncertainties. We use a P-wave velocity of
vp = 3750 m/s and an S-wave velocity of vs = 1875 m/s. Both values are based on active seismic measurements
approximately 2 km down-glacier of our study s ite57. We include an uncertainty of 5% to these velocity values
into our homogeneous velocity model, assuming that we only pick arrivals from direct waves that only travel
through ice, but not through the underlying bedrock. The wave arrival time picking is done manually from
Scientific Reports | (2021) 11:10872 | https://doi.org/10.1038/s41598-021-90176-9 6
Vol:.(1234567890)www.nature.com/scientificreports/
waveform stacks that are output by the hierarchical clustering. Parameters for NonLinLoc are specified in Sup-
plementary Table S5. Cluster locations are listed in Supplementary Table S2.
Seismic moment calculation. With knowledge of the source location, an estimate of shear fault mechanisms
from direct P-wave polarities and typical elastic properties of glacier ice, we use the time integral of the hori-
zontally polarized S-wave (SH) in the displacement seismogram to determine seismic moments of stick–slip
events58:
t2
4πρ i β3i
M0 = R uSH (t)dt (5)
2FSH
t1
ρi = 900 kg/m3 is the density of ice and βi = 1875 m/s is the S-wave velocity of ice. FSH is the radiation pattern
echanism59. The factor 2 accounts for the free surface amplification.
of a double couple source for a given focal m
The distance between hypocenter and recording seismic station is denoted by R. The integral over the ground
displacement caused by the SH-wave uSH is taken over the full SH-wave cycle from time t1 to t2. The ground
displacement is obtained by integrating the recorded ground velocity seismogram and correcting for the instru-
ment response.
Since some of our seismometers were installed in shallow boreholes, in a prior step the horizontal sensor
orientation must be determined. This was done by horizontally rotating the seismogram of strong events from
each asperity such that the P-wave amplitude is maximized on one horizontal component of the seismogram.
From the known location of each station and each stick–slip cluster epicenter, the sensor orientation could be
determined by calculating the mean rotation angle of all station-cluster pairs.
We manually pick the integration time window in Eq. (5) (t1 to t2) for the SH-wave of each cluster and use
the alignment of the events in the stack to integrate for each event separately. For each event and station, we
determine the seismic moment using Eq. (5) and searching for the orientation of the radiation pattern of a
double-couple source with slip along the bed gradient that minimizes the standard deviation of seismic moments
derived for each station. From the most suitable radiation patterns, we calculate the mean within cluster and
thus obtain the fault orientation of each stick–slip asperity.
In order to account for the occasional borehole sensor re-installation in the seismic moment calculation, we
use the amplitudes of the vertical components of the S-waves, which are always aligned with gravity, independent
of the alignment of horizontal components. The vertical S-wave components scale linearly with integrated SH-
waves and thus provide relative changes of seismic moments within each cluster. By scaling these relative changes
with the calculated mean moment of the cluster from events outside of the redrilling period, we can precisely
measure changes in intra-cluster seismic moments (Supplementary Fig. S7) and calculate absolute moments and
their uncertainties. The resulting seismic moment catalog can be downloaded from the ETH Research Collection
as stated in section Data availability.
Recurrence time ‑ seismic moment scaling. Power law fit. The recurrence time and seismic moment
1/6
of repeating microseismic stick–slip events are expected to follow a power law relation Tr ∝ M0 for the case
that aseismic creep exists22. We remove obvious outliers from the data by calculating the relative reduced χ 2
change of a power law fit for each individual sample and remove data points that are not within two standard
deviations of that sample distribution (Supplementary Fig. S8). We then apply a weighted linear fit to the remain-
ing data points in double-logarithmic space (log(Tr ) vs. log(M0 )). The result is shown in Fig. 2a.
Spring‑loaded slider‑block model. We use a simple numerical 1D spring-loaded slider-block model on a
frictional surface to model the recurrence time – seismic moment scaling. In this model, friction follows the
Dietrich-Ruina law of rate-and-state friction38,39 expressed by:
v v0 θ
τ = µ0 + a ln + b ln σ (6)
v0 L
where τ is shear stress and σ is the effective normal stress. The terms in brackets comprise the dynamic friction
coefficient with slip velocity v, a reference velocity v0 and the steady-state friction coefficient µ0 for v = v0. The
rate-strengthening parameter is a, the rate-weakening parameter is b. L Is the critical slip distance and θ is the
state variable evolving according to:
dθ θv
=1− (7)
dt L
We implement this law in a system of three differential equations. The first one is the regularized
Dietrich–Ruina law solved for the slip velocity v,
v0 θ −b/a
τ
−µ0
v = exp v0 · · exp −1 (8)
a L aσ
where we subtract 1 in the last term to start with 0 slip velocity. The second differential equation is the evolution
of the state variable (Eq. 6) and the third differential equation expresses the temporal derivative of the shear
stress τ according to Hook’s law
Scientific Reports | (2021) 11:10872 | https://doi.org/10.1038/s41598-021-90176-9 7
Vol.:(0123456789)www.nature.com/scientificreports/
τ̇ = k(vload − v) (9)
with the constant loading velocity vload of the spring in the slider-block model.
For σ > σ c with
kL
σc = (10)
−(a − b)
being the critical effective normal stress, our rate-and-state friction law results in unstable sliding under quasi-
static loading, producing stick–slip events60. We define the slip to be seismic, when the slip velocity reaches
v > 1 mm/s. All slip accommodated at lower velocities is assigned to aseismic creep.
Velocity weakening asperities at the glacier bed need to have a minimum size to slide seismically37, whereas
we assume that their maximum size is limited by geometrical constraints of the glacier bed, like bedrock undula-
tions. We thus assume that on average the asperity sizes and material properties are constant between the seasons,
allowing us to use the most simplified case of a 1D spring-loaded slider-block model (Supplementary Fig. S9).
Bayesian inversion. We use an affine invariant Markov chain Monte Carlo Ensemble s ampler61, to invert the
recurrence time-seismic moment scaling of observed stick–slip events for parameters in the spring-loaded
slider-block model subject to the rate-and-state friction law (Eqs. 8–10). These parameters include effective nor-
mal stress and loading velocity. We insert an ensemble of 3.8 million prior ensembles (48 walkers making 80,000
steps corresponding to 20 × the autocorrelation time) containing prior distributions of 11 parameters (Supple-
mentary Table S3), to the spring-slider model (Supplementary Fig. S10) and measure the likelihood to fit the
observed recurrence time-seismic moment scaling by comparing the sample likelihood with the corresponding
scatter point density from the observational data. Thus, we define the likelihood function for summer and winter
data as the two-dimensional Kernel Density Estimation of the measurement distribution in the recurrence time-
seismic moment phase space (Fig. 2a). Since we follow the assumption that neither material properties, rate-and-
state friction parameters, nor the fault size change between winter and summer, we keep all input parameters
(Supplementary Table S3) except for effective normal stress σ and loading velocity vload constant. This yields the
variation in effective normal stress and loading velocity between summer and winter that is needed to reproduce
the observed scaling. Figure 2b in the shows the modelled data and Fig. 2c shows the distribution of changes in
loading velocity and effective normal stress between summer and winter. Figure S11 in the Supplementary Mate-
rial shows a corner plot of the complete posterior parameter distributions and Table S4 lists the best fit values
which are discussed in the Supplementary Notes.
Time series processing. Seismic moment rate. · We calculate the cumulative seismic moment that is re-
leased by all detected stick–slip asperities per time ( M0) by summing up the seismic moments from individual
events over six hours. Choosing this time interval, we cover sufficient events to produce a smooth activity meas-
ure of stick–slip asperities and are sensitive to multi-day variations in activity. We low pass filter resulting time
series at a frequency of two days.
GPS velocity processing. From Global Positioning System (GPS) measurements on the glacier surface sampled
at 15 s, velocities were calculated by using a static post processing method resulting in one velocity value per two
hours. Outliers are removed by dropping data points of vertical velocity with a standard deviation larger than
3 m/d that result from adjustments of the antenna, and replacing them with linearly interpolated values. We also
resample the data to the same resolution as the seismic moment rate and apply a Butterworth bandpass filter
with corner frequencies of 3 days and 20 days.
Summer/winter GNSS velocity comparison. During the winter seismometer deployment, GNSS stations were
buried by more than two meters of snow and therefore were not operational. This is why we cannot compare the
winter stick–slip activity with ice flow velocity. However, winter GPS velocity measurements from November
2018 exist. Since already in November winter conditions are present at the measurement site, we assume that
on monthly averages, these velocities are equal to the velocities that were present during the winter seismom-
eter deployment. The distribution of measured velocities in Fig. 3b shows that winter surface velocities can be
expected to be lower than summer surface velocities for most of the time. However, parts of the distribution
overlap, reflecting summer night-time velocities and fast winter velocities.
Data availability
Seismometer data from stations RA51-RA63 of the 4D local glacier seismology network (https://doi.org/10.
12686/s ed/n etwor ks/4 d) are archived at the Swiss Seismological Service and can be accessed via its web interface
http://arclink.ethz.ch/webinterface/. All further data generated and analyzed during this study, like stick–slip
icequake catalog, information about asperity source mechanisms, seismic station information, glacier surface
GPS velocity and results from the Bayesian inversion are available in ETH Zurich’s Research Collection with
https://doi.org/10.3929/ethz-b-000466250.
Received: 1 March 2021; Accepted: 7 May 2021
Scientific Reports | (2021) 11:10872 | https://doi.org/10.1038/s41598-021-90176-9 8
Vol:.(1234567890)www.nature.com/scientificreports/
References
1. Clarke, G. K. C. Subglacial processes. Annu. Rev. Earth Planet. Sci. 33, 247–276 (2005).
2. Maier, N., Humphrey, N., Harper, J. & Meierbachtol, T. Sliding dominates slow-flowing margin regions, Greenland Ice Sheet. Sci.
Adv. 5, eaaw5406 (2019).
3. Clarke, G. K. C. Fast glacier flow: ice streams, surging, and tidewater glaciers. J. Geophys. Res. Solid Earth 92, 8835–8841 (1987).
4. Sole, A. J. et al. Seasonal speedup of a Greenland marine-terminating outlet glacier forced by surface melt–induced changes in
subglacial hydrology. J. Geophys. Res. Earth Surf. 116, (2011).
5. Thøgersen, K., Gilbert, A., Schuler, T. V. & Malthe-Sørenssen, A. Rate-and-state friction explains glacier surge propagation. Nat.
Commun. 10, 2823 (2019).
6. Faillettaz, J., Funk, M. & Vincent, C. Avalanching glacier instabilities: review on processes and early warning perspectives. Rev.
Geophys. 53, 203–224 (2015).
7. Kääb, A. et al. Massive collapse of two glaciers in western Tibet in 2016 after surge-like instability. Nat. Geosci. 11, 114–120 (2018).
8. Weertman, J. On the sliding of glaciers. J. Glaciol. 3, 33–38 (1957).
9. Iverson, N. R., Hanson, B., Hooke, R. L. & Jansson, P. Flow mechanism of glaciers on soft beds. Science 267, 80–81 (1995).
10. Zoet, L. K. & Iverson, N. R. A slip law for glaciers on deformable beds. Science 368, 76–78 (2020).
11. Wiens, D. A., Anandakrishnan, S., Winberry, J. P. & King, M. A. Simultaneous teleseismic and geodetic observations of the stick-
slip motion of an Antarctic ice stream. Nature 453, 770–774 (2008).
12. Lipovsky, B. P. et al. Glacier sliding, seismicity and sediment entrainment. Ann. Glaciol. 60, 182–192 (2019).
13. Zoet, L. K. & Iverson, N. R. Rate-weakening drag during glacier sliding. J. Geophys. Res. Earth Surf. 121, 1206–1217 (2016).
14. Lipovsky, B. P. & Dunham, E. M. Slow-slip events on the Whillans Ice Plain, Antarctica, described using rate-and-state friction as
an ice stream sliding law. J. Geophys. Res. Earth Surf. 122, 973–1003 (2017).
15. McBrearty, I. W., Zoet, L. K. & Anandakrishnan, S. Basal seismicity of the Northeast Greenland Ice Stream. J. Glaciol. 66, 430–446
(2020).
16. Winberry, J. P., Anandakrishnan, S., Wiens, D. A. & Alley, R. B. Nucleation and seismic tremor associated with the glacial earth-
quakes of Whillans Ice Stream, Antarctica. Geophys. Res. Lett. 40, 312–315 (2013).
17. Danesi, S., Bannister, S. & Morelli, A. Repeating earthquakes from rupture of an asperity under an Antarctic outlet glacier. Earth
Planet. Sci. Lett. 253, 151–158 (2007).
18. Helmstetter, A., Nicolas, B., Comon, P. & Gay, M. Basal icequakes recorded beneath an Alpine glacier (Glacier d’Argentière, Mont
Blanc, France): evidence for stick-slip motion?. J. Geophys. Res. Earth Surf. 120, 379–401 (2015).
19. Hudson, T. S. et al. Icequake source mechanisms for studying glacial sliding. J. Geophys. Res. Earth Surf. 125, e2020JF005627 (2020).
20. Roeoesli, C., Helmstetter, A., Walter, F. & Kissling, E. Meltwater influences on deep stick-slip icequakes near the base of the Green-
land Ice Sheet. J. Geophys. Res. Earth Surf. 121, 223–240 (2016).
21. Umlauft, J. et al. Stick-slip tremor beneath an alpine glacier. Geophys. Res. Lett. 48, e2020GL090528 (2021).
22. Chen, T. & Lapusta, N. Scaling of small repeating earthquakes explained by interaction of seismic and aseismic slip in a rate and
state fault model. J. Geophys. Res. Solid Earth 114, (2009).
23. Iken, A., Röthlisberger, H., Flotron, A. & Haeberli, W. The uplift of Unteraargletscher at the beginning of the melt season—a
consequence of water storage at the bed?. J. Glaciol. 29, 28–47 (1983).
24. Sugiyama, S. & Gudmundsson, G. H. Short-term variations in glacier flow controlled by subglacial water pressure at Lauteraar-
gletscher, Bernese Alps, Switzerland. J. Glaciol. 50, 353–362 (2004).
25. Nienow, P., Sharp, M. & Willis, I. Seasonal changes in the morphology of the subglacial drainage system, Haut Glacier d’Arolla,
Switzerland. Earth Surf. Proc. Land. 23, 825–843 (1998).
26. Iken, A. & Truffer, M. The relationship between subglacial water pressure and velocity of Findelengletscher, Switzerland, during
its advance and retreat. J. Glaciol. 43, 328–338 (1997).
27. Röthlisberger, H. Water pressure in intra- and subglacial channels. J. Glaciol. 11, 177–203 (1972).
28. GLAMOS. The Swiss Glaciers 2015/16 and 2016/17. Vol. 137/138 (Cryospheric Commission (EKK) of the Swiss Academy of Sci-
ences (SCNAT), 2018).
29. Rutishauser, A., Maurer, H. & Bauder, A. Helicopter-borne ground-penetrating radar investigations on temperate alpine glaciers:
a comparison of different systems and their abilities for bedrock mappingHelicopter GPR on temperate glaciers. Geophysics 81,
WA119–WA129 (2016).
30. Lomax, A., Virieux, J., Volant, P. & Berge-Thierry, C. In Advances in seismic event location, Springer, 101–134 (2000).
31. Pirli, M., Hainzl, S., Schweitzer, J., Kohler, A. & Dahm, T. Localised thickening and grounding of an Antarctic ice shelf from tidal
triggering and sizing of cryoseismicity. Earth Planet. Sci. Lett. 503, 78–87 (2018).
32. Carmichael, J. D. & Hartse, H. Threshold magnitudes for a multichannel correlation detector in background seismicity. Bull.
Seismol. Soc. Am. 106, 478–498 (2016).
33. Beeler, N. M., Lockner, D. L. & Hickman, S. H. A simple stick-slip and creep-slip model for repeating earthquakes and its implica-
tion for microearthquakes at Parkfield. Bull. Seismol. Soc. Am. 91, 1797–1804 (2001).
34. Vincent, C. & Moreau, L. U. C. Sliding velocity fluctuations and subglacial hydrology over the last two decades on Argentière
glacier, Mont Blanc area. J. Glaciol. 62, 805–815 (2016).
35. Fudge, T. J., Humphrey, N. F., Harper, J. T. & Tad Pfeffer, W. Diurnal fluctuations in borehole water levels: configuration of the
drainage system beneath Bench Glacier, Alaska, USA. J. Glaciol. 54, 297–306 (2008).
36. Chen, K. H., Nadeau, R. M. & Rau, R. J. Towards a universal rule on the recurrence interval scaling of repeating earthquakes?
Geophysical Research Letters 34, (2007).
37. Scholz, C. H. Earthquakes and friction laws. Nature 391, 37–42 (1998).
38. Dieterich, J. H. Rock friction and earthquake prediction 790–806 (Springer, 1978).
39. Ruina, A. Slip instability and state variable friction laws. J. Geophys. Res. Solid Earth 88, 10359–10370 (1983).
40. Zoet, L. K. et al. The effects of entrained debris on the basal sliding stability of a glacier. J. Geophys. Res. Earth Surf. 118, 656–666
(2013).
41. Zoet, L. K. & Iverson, N. R. A healing mechanism for stick-slip of glaciers. Geology 46, 807–810 (2018).
42. Zoet, L. K. et al. Application of constitutive friction laws to glacier seismicity. Geophys. Res. Lett. 47, e2020GL088964 (2020).
43. Walter, F. et al. Distributed acoustic sensing of microseismic sources and wave propagation in glaciated terrain. Nat. Commun. 11,
2436 (2020).
44. Bayes, F. An essay towards solving a problem in the doctrine of chances. Biometrika 45, 296–315 (1958).
45. Andrews, L. C. et al. Direct observations of evolving subglacial drainage beneath the Greenland Ice Sheet. Nature 514, 80–83
(2014).
46. Howat, I. M., Tulaczyk, S., Waddington, E. & Björnsson, H. Dynamic controls on glacier basal motion inferred from surface ice
motion. J. Geophys. Res. Earth Surf. 113, (2008).
47. Bindschadler, R. The importance of pressurized subglacial water in separation and sliding at the glacier bed. J. Glaciol. 29, 3–19
(1983).
48. Anandakrishnan, S. & Alley, R. B. Ice Stream C, Antarctica, sticky spots detected by microearthquake monitoring. Ann. Glaciol.
20, 183–186 (1994).
Scientific Reports | (2021) 11:10872 | https://doi.org/10.1038/s41598-021-90176-9 9
Vol.:(0123456789)www.nature.com/scientificreports/
49. Greve, R. & Blatter, H. Dynamics of ice sheets and glaciers (Springer, 2009).
50. Ito, K. & Matsuzaki, M. Earthquakes as self-organized critical phenomena. J. Geophys. Res. Solid Earth 95, 6853–6860 (1990).
51. Sammis, C. G. & Rice, J. R. Repeating earthquakes as low-stress-drop events at a border between locked and creeping fault patches.
Bull. Seismol. Soc. Am. 91, 532–537 (2001).
52. Dublanchet, P. Scaling and variability of interacting repeating earthquake sequences controlled by asperity density. Geophys. Res.
Lett. 46, 11950–11958 (2019).
53. Sornette, A. & Sornette, D. Earthquake rupture as a critical point: Consequences for telluric precursors. Tectonophysics 179, 327–334
(1990).
54. Bak, P. & Tang, C. Earthquakes as a self-organized critical phenomenon. J. Geophys. Res. Solid Earth 94, 15635–15637 (1989).
55. Main, I. G. & Naylor, M. Entropy production and self-organized (sub) criticality in earthquake dynamics. Philos. Trans. R. Soc. A
Math. Phys. Eng. Sci. 368, 131–144 (2010).
56. Chamberlain, C. J. et al. EQcorrscan: repeating and near-repeating earthquake detection and analysis in python. Seismol. Res. Lett.
89, 173–181 (2017).
57. Hellmann, S. et al. Acoustic velocity measurements for detecting the crystal orientation fabrics of a temperate ice core. Cryosphere
Discuss. 2021, 1–26 (2021).
58. Boatwright, J. A spectral theory for circular seismic sources; simple estimates of source dimension, dynamic stress drop, and radi-
ated seismic energy. Bull. Seismol. Soc. Am. 70, 1–27 (1980).
59. Aki, K. & Richards, P. G. Quantitative seismology. (2002).
60. Brace, W. F. & Byerlee, J. D. Stick-slip as a mechanism for earthquakes. Science 153, 990–1000 (1966).
61. Foreman-Mackey, D., Hogg, D. W., Lang, D. & Goodman, J. emcee: the MCMC hammer. Publ. Astron. Soc. Pac. 125, 306 (2013).
Acknowledgements
We thank all fieldwork participants of the Rhonegletscher project for over two years, especially Pascal Graf and
Raphael Moser from the Swiss Seismological Service. We also thank all members of the Glacier Seismology
group at ETH-VAW for fruitful discussion on basal stick-slip sliding over the last four years, Mauro Werder for
his help with the Bayesian Inversion, and Sylvain Barbot for his numerical implementation of the spring-loaded
slider-block model. Thanks also to Dorde Masovic who created the 3D model of Fig. 4 and Philippe Limpach
who processed the GPS data. The fieldwork and salary of D.G. were financed via ETH Grant ETH-06 16-2. F.W.
was financed by the Swiss National Science Foundation via Grant PP00P2_183719.
Author contributions
D.G. led field campaigns, analyzed the data and formulated the manuscript together with F.W., who was the PI
of the project and provided scientific guidance throughout data acquisition and analysis.
Competing interests
The authors declare no competing interests.
Additional information
Supplementary Information The online version contains supplementary material available at https://doi.org/
10.1038/s41598-021-90176-9.
Correspondence and requests for materials should be addressed to D.G.
Reprints and permissions information is available at www.nature.com/reprints.
Publisher’s note Springer Nature remains neutral with regard to jurisdictional claims in published maps and
institutional affiliations.
Open Access This article is licensed under a Creative Commons Attribution 4.0 International
License, which permits use, sharing, adaptation, distribution and reproduction in any medium or
format, as long as you give appropriate credit to the original author(s) and the source, provide a link to the
Creative Commons licence, and indicate if changes were made. The images or other third party material in this
article are included in the article’s Creative Commons licence, unless indicated otherwise in a credit line to the
material. If material is not included in the article’s Creative Commons licence and your intended use is not
permitted by statutory regulation or exceeds the permitted use, you will need to obtain permission directly from
the copyright holder. To view a copy of this licence, visit http://creativecommons.org/licenses/by/4.0/.
© The Author(s) 2021
Scientific Reports | (2021) 11:10872 | https://doi.org/10.1038/s41598-021-90176-9 10
Vol:.(1234567890)You can also read