Analysis of crustal deformation in Luzon, Philippines using geodetic observations and earthquake focal mechanisms
←
→
Page content transcription
If your browser does not render page correctly, please read the page content below
Tectonophysics 432 (2007) 63 – 87
                                                                                                                www.elsevier.com/locate/tecto

Analysis of crustal deformation in Luzon, Philippines using geodetic
          observations and earthquake focal mechanisms
                  Gerald Galgana a,b,⁎, Michael Hamburger a , Robert McCaffrey c,1 ,
                                  Ernesto Corpuz d,2 , Qizhi Chen a
                         a
                         Department of Geological Sciences, Indiana University, Bloomington, IN 47405, United States
                                b
                                  Manila Observatory, Loyola Heights, Quezon City, Metro Manila, Philippines
             c
                 Department of Earth and Environmental Sciences, Rensselaer Polytechnic Institute, Troy, NY 12180, United States
                     d
                       Philippine Institute of Volcanology and Seismology, UP Campus, Diliman, Quezon City, Philippines

                      Received 10 October 2006; received in revised form 30 November 2006; accepted 4 December 2006
                                                      Available online 24 January 2007

Abstract

    We utilize regional GPS velocities from Luzon, Philippines, with focal mechanism data from the Harvard Centroid Moment
Tensor (CMT) Catalog, to constrain tectonic deformation in the complex plate boundary zone between the Philippine Sea Plate and
Eurasia (the Sundaland block). Processed satellite imagery and digital elevation models are used with existing gravity anomaly,
seismicity, and geologic maps to define a suite of six elastic blocks. Geodetic and focal mechanism data are inverted
simultaneously to estimate plate rotations and fault-locking parameters for each of the tectonic blocks and faults comprising Luzon.
Major tectonic structures that were found to absorb the plate convergence include the Manila Trench (20–100 mm yr− 1) and East
Luzon Trough (∼ 9–15 mm yr− 1)/Philippine Trench (∼ 29–34 mm yr− 1), which accommodate eastward and westward subduction
beneath Luzon, respectively; the left-lateral strike-slip Philippine Fault (∼ 20–40 mm yr− 1), and its northward extensions, the
Northern Cordillera Fault (∼17–37 mm yr− 1 transtension), and the Digdig Fault (∼ 17–27 mm yr− 1 transpression). The Macolod
Corridor, a zone of active volcanism, crustal thinning, extension, and extensive normal and strike-slip faulting in southwestern
Luzon, is associated with left-lateral, transtensional slip of ∼ 5–10 mm yr− 1. The Marikina Fault, which separates the Central
Luzon block from the Southwestern Luzon block, reveals ∼ 10–12 mm yr− 1 of left-lateral transpression. Our analysis suggests that
much of the Philippine Fault and associated splays are locked to partly coupled, while the Manila and Philippine trenches appear to
be poorly coupled. Luzon is best characterized as a tectonically active plate boundary zone, comprising six mobile elastic tectonic
blocks between two active subduction zones. The Philippine Fault and associated intra-arc faults accommodate much of the trench-
parallel component of relative plate motion.
© 2006 Elsevier B.V. All rights reserved.

Keywords: Crustal deformation; Philippines; Geodetic observations

 ⁎ Corresponding author. Department of Geological Sciences, Indiana University, Bloomington, IN 47405, United States. Tel.: +1 812 855 1008,
+1 812 855 2934; fax: +1 812 855 7899.
   E-mail address: ggalgana@indiana.edu (G. Galgana).
 1
   Tel.: +1 518 276 8521; fax: +1 518 276 2012.
 2
   Tel.: +63 2 426 1468; fax: +63 2 926 7749/926 3229.

0040-1951/$ - see front matter © 2006 Elsevier B.V. All rights reserved.
doi:10.1016/j.tecto.2006.12.001
64 G. Galgana et al. / Tectonophysics 432 (2007) 63–87
1. Introduction Gordon and Stein, 1992). Plate boundary zones are of
prime importance to understanding the fundamental
Over the past several decades, a fundamental modi- nature of interaction between tectonic plates, as these
fication of the plate tectonics paradigm has taken place. broad zones account for the majority of the world's
The concept of rigid plates separated by discrete plate interplate tectonic activity (e.g., Stein and Sella, 2002;
bounding faults (e.g., Morgan, 1968) has given way to a Kreemer et al., 2003). On the other hand, our un-
more realistic model that consists of slowly deforming, derstanding of plate boundary processes in these zones is
relatively rigid plates, separated by broad areas of rapid challenged by the complexity and temporal variability of
deformation, designated as plate boundary zones (e.g., present-day deformation. In particular, plate boundary
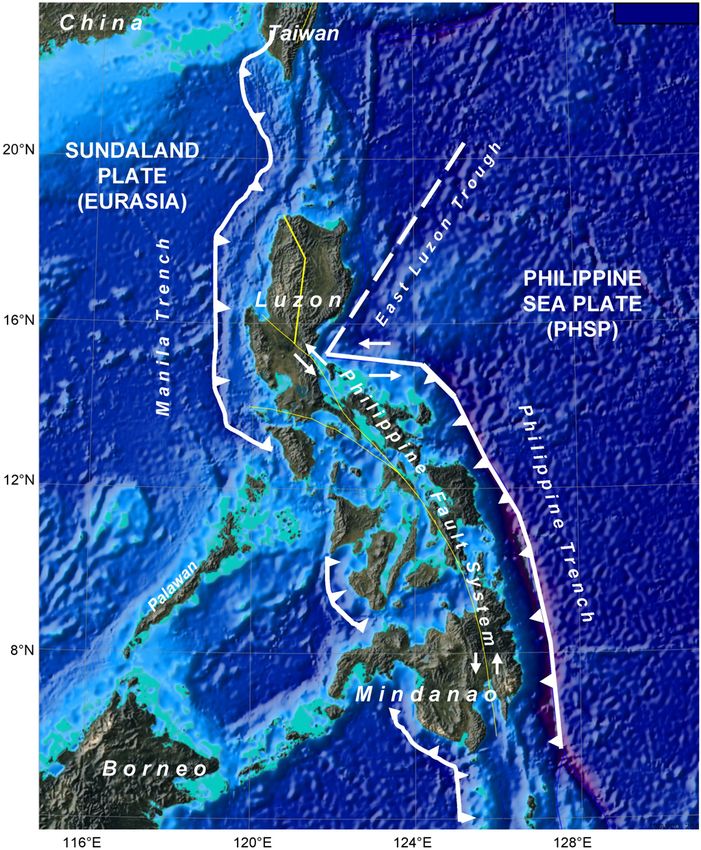
Fig. 1. Physical map of the Philippines, showing topography and bathymetry. The two opposing subduction zones (the Manila Trench and the
Philippine Trench/East Luzon Trough), major plates (SUND and PHSP) and the major Philippine Fault System with splays in Luzon (yellow lines)
are mapped (basemap derived from the UNAVCO Jules Verne Navigator). (For interpretation of the references to color in this figure legend, the reader
is referred to the web version of this article.)G. Galgana et al. / Tectonophysics 432 (2007) 63–87 65 zones associated with oblique subduction (such as the Plate boundary zones have been defined using a Cascadia subduction zone, Sumatra in the Indonesian variety of models, ranging from a simple fault-bounded arc, and the North Island of New Zealand) are char- plate boundary (e.g., Morgan, 1968) to a series of sub- acterized by extensive strike-slip faulting, high seismic- parallel faults and crustal blocks (e.g., Bennett et al., ity, rapid vertical axis rotations and significant intraplate 1996); from half-space elastic models to more complex deformation in the overlying plate (Fitch, 1972; multi-layered elastic–viscoelastic models (e.g., Thatch- McCaffrey, 2002; Wallace et al., 2004). The island of er, 1995). Some models define the lithosphere as a Luzon, in the northern Philippine island arc, provides continuously deforming viscoelastic surface (e.g., another example of plate boundary zone deformation. Houseman and England, 1986; Spakman and Nyst, Luzon is situated in an area where the rapid convergence 2003), while others define the deforming crust as a series between the Eurasian Plate (Sundaland block) and the of rotating blocks (e.g., McCaffrey, 2002). The contin- Philippine Sea Plate is accommodated across two major uous modeling approach primarily treats the lithosphere subduction zones and a rapidly deforming island arc as a viscoelastic or fluid material which deforms con- (Fig. 1). Detailed analysis of the kinematics of Luzon tinuously–but at variable rates–throughout the layer. will help elucidate how deformation occurs within plate The fault-and-block system describes zones of deforma- boundary zones in general. tion as comprised of a set of finite, elastic blocks, Fig. 2. A: Seismicity map (1973–2006) derived from the USGS National Earthquake Information Center (NEIC) catalogue. Magnitudes of these shallow events (depth b 70 km) are depicted by the circle diameters. B: Focal mechanism map (1977–2003) derived from the Harvard CMT Catalogue. Symbols depict lower-hemisphere projections of best double-couple solutions, with compressional quadrant shaded in black.
66                                     G. Galgana et al. / Tectonophysics 432 (2007) 63–87

                                                       Fig. 2 (continued ).

separated by discrete faults, essentially a small-scale             Sea Plate (Fitch, 1972; Seno et al., 1993; Rangin et al.,
analog to the global model of plate tectonics. While we             1999). The northern Philippines is unusual in that it is
cannot rule out the viscoelastic models of arc deforma-             characterized by opposing subduction on the east and
tion, the presence of major, intra-arc faults within the            west sides, major intra-arc strike-slip faults, active vol-
island of Luzon, such as the Philippine Fault and Verde             canism, and high seismic activity (Fig. 2) within the arc
Passage fault system, leads us to analyze the kinematics            complex (Cardwell et al., 1980; Hamburger et al., 1982;
using the finite elastic block method. In this study, we use        Aurelio, 2000). Subduction of the Philippine Sea Plate
Global Positioning System (GPS) measurements and                    occurs along the eastern margin of the archipelago,
earthquake focal mechanisms to constrain block veloc-               marked by the Philippine Trench and its northern exten-
ities and rotations as well as estimates of slip and locking        sion, the East Luzon Trough (Fig. 1). The Philippine
strain along major faults.                                          Trench is a seismically active, north–south trending
                                                                    depression characterized by a poorly defined Wadati–
1.1. Tectonic setting                                               Benioff earthquake zone which extends to about 100 km
                                                                    depth (Cardwell et al., 1980). This trench, which marks
   The Philippine archipelago is part of a broad zone of            the boundary of the westward-subducting Philippine
convergence between the Sundaland block, an indepen-                Sea Plate under the Philippine Mobile Belt, extends
dent part of Eurasian Plate (see Chamot-Rooke and Le                from the Island of Mindanao in the south to its northern
Pichon, 1999; Michel et al., 2001) and the Philippine               termination, east of central Luzon (Fig. 1). The trench is
G. Galgana et al. / Tectonophysics 432 (2007) 63–87 67
Fig. 3. Map of southwestern Luzon, showing major tectonic structures. Prominent volcanic centers are marked with triangles.
characterized by large negative gravity anomalies, and is Between the two subduction zones lies the seismi-
associated with moderate to large-magnitude interplate cally active, NW–SE trending, sinistral strike-slip
thrust-type earthquakes (Fig. 2B) (Lewis and Hayes, Philippine Fault (Figs. 1 and 3) (Barrier et al., 1991;
1983; Hamburger et al., 1982; Tomida, 1998). To its Rangin et al., 1999; Bacolcol, 2003). The Philippine
north, the East Luzon Trough represents a northeast- Fault traverses the entire Philippine archipelago from
trending incipient subduction zone; it is also character- the northeast of Mindanao Island through the central
ized by deep bathymetry, well-defined negative gravity Philippines and as far north as northwestern Luzon
anomalies, and high seismicity (Fig. 2A), but without (Fig. 1). Fault activity is estimated to have started at
subduction-related volcanism (Hamburger et al., 1982; about 15 Ma and extends through Holocene time (Karig,
Lewis and Hayes, 1983; Tomida, 1998). 1983), although some estimates suggest a much younger
On the west side of Luzon, the South China Sea age (Barrier et al., 1991). The fault divides into a series
Basin subducts eastward along the Manila Trench, the of splays across the southern Cordillera Central, where
primary convergence zone between Eurasia and Luzon some appear to extend to the forearc region of the
(Hayes and Lewis, 1984; Rangin et al., 1999; Yu et al., Manila Trench. The Philippine fault is seismically
1999). The trench is associated with a well-developed active, with fault slip rates of about 9–17 mm yr− 1
forearc system and extends southward from Taiwan in determined from geomorphic data (Daligdig, 1997), 20–
the north to Mindoro Island in the south along the 25 mm yr− 1 from plate kinematics (Barrier et al., 1991),
western margin of Luzon (Fig. 1) (Hayes and Lewis, 35 mm yr− 1 determined from GPS measurements
1984). At its northern and southern terminations, sub- (Rangin et al., 1999; Yu et al., 1999; Thibault, 1999),
duction at the Manila Trench is interrupted by arc- and 68.6 mm yr− 1 from historical seismicity (Acharya,
continent collision, i.e., between the northern Philippine 1980). The fault passes through the northern mountains
arc and the Eurasian continental margin at Taiwan and of the Cordillera Central, into the southern Sierra Madre
between the Palawan–Borneo Block and Luzon at the mountains of east-central Luzon, and near Bondoc
island of Mindoro (De Boer et al., 1980; Suppe, 1988). Peninsula in southern Luzon (Figs. 1 and 3) (Barrier68 G. Galgana et al. / Tectonophysics 432 (2007) 63–87
et al., 1991). The fault has been associated with major the Macolod Corridor is actively deforming, through a
historical earthquakes, including the M7.6 Luzon combination of shear and extensional deformation.
earthquake of 1990 (Yoshida and Abe, 1992).
The Verde Passage Fault (Fig. 3) is an east–west 2. Observational data
trending, left-lateral strike-slip fault that traverses the
central Philippines from the southern termination of the We use terrain models and satellite images to
Manila Trench. The fault separates the Mindoro terrane delineate faults as a basis for dividing the lithosphere
in the south from southwestern Luzon and permits into discrete tectonic blocks. Geodetic data are then used
eastward translation of Mindoro and the Palawan Block in combination with earthquake source mechanism data
with respect to Luzon (Karig, 1983; Hayes and Lewis, to infer the motions of these blocks. In this section, we
1984; Bischke et al., 1990). The eventual transfer of present the observational data that provide a basis for
strain associated with the Mindoro collision possibly has the geodynamic models of the northern Philippine
resulted in the rifting of southwestern Luzon, along the archipelago.
Macolod Corridor, a region in southwestern Luzon
pervaded by extensive volcanism, faulting, and crustal 2.1. Terrain models
thinning (Förster et al., 1990; Besana et al., 1995;
Pubellier et al., 2000). Recent studies using structural The GTOPO 30 and SRTM 30+ Digital Elevation
and geomorphic analyses (Pubellier et al., 2000) and Models (Smith and Sandwell, 1997; Rabus et al., 2003)
geodetic techniques (Ohkura et al., 2001) indicate that were used as the primary dataset for topographic
Fig. 4. A: Map of observed GPS vectors, with corresponding 95% error ellipses. Velocities are plotted with respect to station MMA8 in Manila (in
CLUZ block). B: Map of observed GPS vectors, with corresponding 95% error ellipses. Velocities are plotted with respect to SUND.G. Galgana et al. / Tectonophysics 432 (2007) 63–87 69
Fig. 4 (continued ).
analyses (Appendix A). We used analytical hill shading tectonic structures based on existing literature (i.e., Förster
to highlight the orientation of fault scarps, lineaments, et al., 1990; Pubellier et al., 2000, 2004; Torres et al., 2002).
and other terrain surfaces (Kennelly and Stickney, 2000; By combining this information with seismicity and focal
Leech et al., 2003). The approach was used to highlight mechanism data (Fig. 2A and B, respectively), the ori-
surficial geologic features within Luzon, such as fault entation and possible boundaries of the tectonic blocks that
scarps of the Philippine, Northern Cordillera, Digdig, comprise Luzon can be better defined. Appendix A shows
Marikina, and Macolod Corridor fault zones (Figs. 1 and 3). some examples of how plate boundaries were determined
Bathymetric data clearly reveal the topographic structures by analyzing the terrain models.
of the Manila Trench and East Luzon Trough, as well as the
Verde Passage–Sibuyan Sea Fault near southwestern 2.2. GPS observations
Luzon (Fig. 1). Three Landsat TM scenes were used to
identify faults within complex deformation areas such as Global Positioning System (GPS) measurements
the Cordillera Central (northern Luzon) and Macolod have been used extensively as primary tools for geodetic
Corridor (southwestern Luzon). The addition of these observations since the late 1980s, and have proven
visible and near-infrared reflectance data provided addi- particularly valuable for measuring plate boundary de-
tional observations for determining and verifying fault formation and tectonic movements (e.g., Segall and
scarps, lineaments, and other geologic features associated Davis, 1997). The data reported here comprise repeat
with possible present-day tectonic activity. Details of campaign measurements of the Luzon regional network
terrain and image processing/interpretation are discussed in as well as smaller sub-networks around the Marikina
Galgana (2005). We also inferred and cross-referenced our Fault and the active volcanoes of Taal, Pinatubo, and
identified block boundaries with locations of faults and Mayon (Thibault, 1999; Beavan et al., 2001; Lowry70 G. Galgana et al. / Tectonophysics 432 (2007) 63–87 Table 1 GPS-derived velocities of campaign and continuous stations used in this study Station name Longitude Latitude Ve Vn Sigma_e Sigma_n ABY3 123.67592 13.47668 1.46 31.72 2.15 1.00 ARA1 121.56281 15.75727 − 16.18 30.21 1.84 0.81 BAKO 106.84891 − 6.49105 51.50 − 2.33 1.58 0.76 BIN1 121.19328 14.46893 5.57 11.80 3.58 1.72 BJFS 115.89248 39.60860 10.82 140.31 1.65 0.98 BLG4 120.94863 14.00060 16.52 2.59 3.23 1.52 BLN4 121.04432 15.18999 −3.07 4.77 1.62 0.72 BRG1 120.60076 18.52034 − 22.57 23.83 1.72 1.32 BUAN 123.64321 13.31098 1.07 31.64 1.88 0.85 CCA5 121.04939 13.89883 17.09 − 0.10 1.69 0.78 CGY8 121.72651 17.61738 − 12.37 31.33 1.65 0.72 CVT1 120.99697 14.28131 15.07 7.94 2.31 1.00 CVT2 120.86505 14.28145 5.41 7.02 3.00 1.37 DAEJ 127.37448 36.39943 61.04 − 5.99 1.49 0.84 DAUP 120.58114 15.17497 9.48 4.02 3.15 1.45 IFG1 121.05154 16.92059 −4.05 25.84 1.77 0.76 LAG1 121.39818 14.26281 7.47 8.34 1.78 0.82 LAG4 121.05432 14.33302 14.60 6.67 2.44 1.07 LMDM 121.07235 14.72264 6.69 1.95 4.79 2.34 LODP 120.51712 15.37277 2.93 4.94 1.76 0.80 LUN1 120.30443 16.58256 0.65 8.93 1.84 0.82 LUZA 120.19528 14.87755 4.75 2.68 0.77 0.54 LUZC 120.56821 16.38796 −5.54 9.63 1.63 1.24 LUZD 120.45556 17.55093 − 16.98 17.47 1.82 1.32 LUZE 121.09697 15.56104 −8.55 10.50 2.70 1.23 LUZF 121.11311 15.81355 − 10.22 24.98 0.67 0.54 LUZG 121.48214 16.60754 − 13.43 36.04 1.24 0.93 LUZH 121.80384 17.71741 − 31.74 34.68 1.72 1.32 LUZI 121.92794 18.24585 − 19.30 40.86 1.53 1.16 MMA1 121.03976 14.53717 4.25 5.06 1.54 0.68 MMA8 120.97271 14.59822 0.00 0.00 0.38 0.31 MRQ1 121.86888 13.56001 24.41 12.68 4.66 2.16 MTYM 121.22052 14.64136 7.34 5.94 2.67 1.25 NE44 120.96957 15.49155 7.63 0.09 2.32 1.06 NTUS 103.67996 1.34580 63.68 − 1.58 5.36 2.25 NVY4 120.90746 16.15877 −0.97 19.17 1.60 0.70 PIMO 121.07773 14.63572 −2.05 7.70 1.63 0.74 PIVS 121.05873 14.65219 2.02 8.38 1.63 0.72 PMG1 120.63321 15.14022 6.69 2.82 1.65 0.73 PNG3 120.10790 16.06330 −1.44 0.00 1.05 0.78 PNG5 120.25369 15.86768 5.33 2.01 1.56 0.69 PTBM 121.20801 14.62012 10.68 5.98 2.74 1.29 QZN3 121.80678 14.92528 −3.78 19.12 6.24 2.76 QZN7 121.41497 15.21113 −4.86 16.31 1.70 0.76 SHAO 121.20044 31.09964 63.19 − 7.63 1.41 0.67 SUBI 120.93997 13.96205 8.01 2.39 2.68 1.25 SUWN 127.05424 37.27552 58.89 − 5.66 1.44 0.76 TGYT 120.93926 14.09765 15.57 4.55 2.42 1.12 TLY2 121.02194 14.09566 13.41 4.15 1.81 0.84 TRC2 120.42575 15.32313 6.75 1.70 2.84 1.32 TRCP 120.42239 15.32424 9.68 2.30 2.74 1.27 UODP 120.38702 15.29706 3.42 4.07 4.62 2.09 UPHM 121.05970 14.65527 5.22 6.71 4.05 1.89 WUHN 114.35726 30.53165 61.91 − 5.52 1.38 0.63 XIAN 109.22149 34.36867 61.06 − 7.22 1.65 0.98 ZBS3 119.92470 15.80569 4.44 2.54 6.73 2.94 ZBS9 120.06370 15.03094 −9.73 10.88 10.09 4.40 Velocities are based on campaign observations made from 1996 to 2002, using datasets from the Luzon network and the stations of Yu et al. (1999).
G. Galgana et al. / Tectonophysics 432 (2007) 63–87                                              71

et al., 2001; Bartel, 2002; Bartel et al., 2003). The entire                combined with systematic reprocessing of GPS cam-
Luzon GPS network is composed of 52 stations (Fig. 4A                       paign data resulted in higher accuracies of GPS
and B), most of which were selected from monuments of                       velocities.
the Philippine GPS Reference System (established in                             The observed GPS velocity field (Fig. 4A, and
1992). These survey points were occupied using dual-                        Table 1), shown in a reference frame with station
frequency, survey-grade receivers through campaign-                         MMA8 in Manila fixed, provides evidence for signif-
style observations in 1996, 1998, 1999 and 2002. These                      icant intra-arc deformation. The horizontal velocity field
campaign stations were linked through observations                          indicates NNW-trending relative motion at rates of
from continuous GPS stations PIMO and MMA8, both                            ∼ 35–45 mm yr− 1 in northeastern Luzon, presumably a
situated in Metro Manila (Table 1). Processing of these                     result of shear along the Philippine Fault, while site
campaign data was initially completed by Thibault                           velocities in northwestern Luzon side display a more
(1999) and Bartel (2002), using the BERNESE software                        northwesterly-oriented motion at slightly reduced rates.
(Rothacher and Mervart, 1996). We undertook proces-                         This contrasting motion probably results from variable
sing of the recent 2002 dataset, as well as reprocessing                    slip along the northern splays of the Philippine Fault
of the 1996–99 GPS data using the NASA-JPL GIPSY-                           (Fig. 4A and B). The observed motion in southeastern
OASIS II software (Webb and Zumberge, 1993).                                Luzon indicates an almost northerly trend with rates of
    The processing approach involved conventional an-                       ∼ 35 mm yr− 1, again the result of shear along the
alysis of both campaign and continuous GPS data in a                        central Philippine Fault, while stations in southwestern
consistent reference frame to determine site positions                      Luzon show east- and north-trending velocities at rates
and velocities. Raw GPS data collected in the field were                    of ∼ 4–10 mm yr− 1 presumably associated with rela-
analyzed in 24-hour daily solutions along with regional                     tively slow deformation along the Macolod Corridor.
and global permanent sites. For the campaign GPS data,                      Sites within central Luzon near the Philippine Fault
our regional solutions were determined by combining                         show northwest-trending velocities at ∼20–30 mm
campaign data with a regional set of permanent sites and                    yr− 1. This reduced velocity results from elastic deform-
used fixed orbits and satellite clock corrections provided                  ation associated with coupling along locked segments
by JPL. The daily free network solutions were trans-                        of the Philippine Fault.
formed into the ITRF1997 reference frame (Internation-
al Terrestrial Reference Frame, epoch 1997) by                              2.3. Slip vectors from earthquake focal mechanisms
estimating a seven-parameter similarity transformation
for each solution (Boucher et al., 1999). Finally,                             Earthquake focal mechanism data provide direc-
individual daily GPS solutions were combined to deter-                      tional constraints on present-day fault motion in
mine site velocities. The coordinates in the ITRF1997                       Luzon. In this study, we use centroid moment tensor
reference frame and their covariance matrix from the                        (CMT) earthquake mechanism data from the Harvard
daily GPS solutions were used in a standard weighted                        CMT Catalog (Dziewonski et al., 1981; Dziewonski
least-squares fit to estimate site positions at a fixed                     and Woodhouse, 1983). Together with epicenter maps
epoch and site velocities. The input covariances were                       (Fig. 2A), slip azimuth data from these focal mechan-
then scaled by a factor, so that the reduced χ2 statistic is                isms can be used to define which tectonic structures
equal to 1.0, thus assuming a Gaussian error distribu-                      are active, as well as the kinematics of motion oc-
tion. This approach, while in reality underestimates true                   curring along these structures. The CMT solutions
error conditions, assumes that blunders and significant                     (Fig. 2B) show systematic patterns associated with the
errors have been removed from the GPS observations                          major plate and block boundaries identified in this
through periodic campaign-style measurements and by                         study. We observe relatively uniform, west-oriented
selectively removing sites affected by local (i.e., cul-                    thrust mechanisms along the eastern margin of Luzon,
tural and volcanic) deformation. This strategy has been                     near the Philippine Trench and the East Luzon Trough,
used successfully to interpret GPS observations in both                     consistent with the westward sense of subduction of
large-scale (Larson et al., 1997; Wang et al., 2001) and                    the Philippine Sea Plate. Along the western Luzon
regional networks (Freymueller et al., 1999, 2000).                         coast, near the Manila Trench, opposing east-oriented
The extension of campaign observations through 2002,                        thrust mechanisms are present, consistent with the

Notes to Table 1:
Velocities are based on campaign observations made from 1996 to 2002, using datasets from the Luzon network and the stations of Yu et al. (1999).
Reference is MMA8, located in CLUZ. Vn–Ve correlation is close to zero.
72 G. Galgana et al. / Tectonophysics 432 (2007) 63–87
subduction of the South China Sea crust under north- 3. Modeling method
ern Luzon. Strike-slip focal mechanisms are prevalent
in the central Luzon area near the Philippine Fault, as We model crustal deformation of Luzon using the
well as at the southern Luzon coast, near the Verde elastic block approach. This model considers the litho-
Passage–Sibuyan Sea Fault, with fault planes subparallel sphere of an actively deforming zone to be composed of
to those two structures. Along the southwestern Luzon a series of finite elastic blocks bounded by faults. The
coast, thrust mechanisms are rotated to a NE–SW faults are defined in 3D space by a series of along-strike
orientation, presumably a result of the Palawan–Mindoro nodes, whose spacing depends on the fault complexity,
block collision. Areas offshore northwestern Luzon show and downdip nodes, designated from 10 km depth to
generally SSE-trending thrust mechanisms with some 25 km depth. For subduction zones, these nodes extend
strike-slip mechanisms located near the Digdig Fault. A to 50 km depth, based on seismicity data. Then, using
complex area of deformation, including normal, thrust, GPS site velocities and earthquake slip vectors as ob-
and shear mechanisms, occupies the Luzon Strait between served data, we simultaneously invert for block rotation
Luzon and Taiwan. While recognizing that there are other and fault-locking parameters. Relative block motion is
intra-block earthquake mechanisms within Luzon, we quantified by angular velocities (Euler poles and
favored to select and use events that would help constrain rotation rates) that in turn define fault slip vectors as
deformation along the eastern and western subduction a function of position along the fault. The forward
zones as well as the major boundaries such as the model of predicted surface deformation due to fault
Philippine Fault and the southern Verde Passage–Sibuyan locking is calculated using an elastic, half-space
Sea Fault. The rather sparse geodetic coverage in some dislocation model (Okada, 1985). This fault-locking
areas (e.g. ILOC, BBLK) prevents high resolution tectonic strain is calculated by integration of surface deforma-
analysis; in this case we can use prominent focal me- tion produced by fault slip over small, finite fault
chanism trends in order to make a reasonable first-order patches between the nodes, with bilinear interpolation
approximation of block motions. used for estimating slip magnitude and coupling values
at every patch (program DEFNODE (McCaffrey, 1995,
2.4. Poles of rotation 2002)).
Frictional locking along faults produces strain in the
Euler poles of rotation were initially defined for the adjacent rocks, a deformation which counteracts free
major plates based on Seno et al. (1993) (Philippine Sea translation of the blocks relative to neighboring blocks.
Plate and Eurasia), Chamot-Rooke and Le Pichon (1999) Fault locking along the faults is parameterized using
(Eurasia and Sundaland) and Rangin et al. (1999) fault coupling values (φ) assigned or estimated at every
(Sundaland–Ilocos–Philippine Sea Plate). Subsequent node, with φ = 1 representing 100% coupling and φ = 0
inversions are made in order to refine estimates of Euler representing 0% coupling (i.e., fully creeping). The
poles and rotation rates, both for major plates and smaller coupling ratio (φ) is mainly a kinematic variable defined
blocks comprising Luzon. Initial plate rotation models as φ = 1 − Vc / V, where Vc is the short-term displacement
are shown in Table 2. rate along the fault and V is the long-term slip rate
(Wallace et al., 2004).
3.1. Block identification
Table 2
Initial values of Euler poles used in this study Block boundaries were delineated through analysis
Plate pairs Latitude Longitude Rate (°/My) Reference of bathymetry and topography, correlated with geologic
[ccw is +] and tectonic maps, seismicity, focal mechanisms, and
EURA– 48.23°N 156.97°E 1.038 Seno et al. (1993) gravity anomalies. Block boundaries are identified by
PHSP areas of sharp discontinuities in rock formations, strong
SUND– 33.23°S 129.80°E −0.286 Chamot-Rooke and gradients in gravity or magnetic properties, disconti-
EURA Le Pichon (1999)
nuities in seismic profiles, gradients in topography and
ILOC– 9.34°N 118.29°E 5.478 Rangin et al. (1999)
SUND bathymetry, fault scarps, prominent ground fractures
ILOC– 17.60°N 122.10°E 6.000 Rangin et al. (1999) and lineations, topographic depressions, uplifted blocks
PHSP or seismicity. In addition, GPS velocities aid in selecting
EURA = Eurasian Plate, SUND = Sundaland plate, ILOC = Ilocos the tectonic blocks by identifying apparent groupings
Block, Northern Luzon and PHSP = Philippine Sea Plate. of the velocities based on orientations and rates. TheG. Galgana et al. / Tectonophysics 432 (2007) 63–87 73 Fig. 5. Microplate map of Luzon. Seven blocks were initially assigned to comprise Luzon, designated as the following: Central Luzon (CLUZ), Southwestern Luzon 1 and 2 (SWL1, SWL2), Northwestern Luzon or Ilocos (ILOC), Northeastern Luzon or Cagayan 1 (CAG1), Cagayan 2 (CAG2), and Southeastern Luzon or Bicol (BBLK). Mindoro (MIND) and Central Visayas (CENV) were added as adjoining southern blocks, while Eurasia (EURA), Sundaland (SUND), and the Philippine Sea Plate (PHSP) were the major plates near the PMB. Section lines A–A′ and B–B′ cross the Philippine Fault, and the Marikina Fault–Macolod Corridor, respectively. See details on Figs. 10 and 12. velocities are grouped together based on uniform Plate (PHSP), and Sundaland or SUND (Chamot-Rooke motion, separated from those with significant gradients and Le Pichon, 1999). The blocks are separated by the of velocity magnitude and/or orientation. following faults and subduction zones (Fig. 5): The Seven blocks were initially defined to comprise Manila Trench (MT), the East Luzon Trough (ELT), the Luzon, as shown in Fig. 5: Central Luzon (CLUZ), Philippine Trench (PT), Philippine Fault (PF-N, PF-M, eastern and western blocks of Southwestern Luzon and PF-S), Verde Passage–Sibuyan Sea Fault (VPSSF1 (SWL1, SWL2), Ilocos (ILOC), Northern Cagayan and VPSSF2), Macolod Corridor (MACO), Marikina (CAG1), Southern Cagayan (CAG2), and Southeastern Fault (MARF), Digdig Fault (DF), East Luzon Trans- Luzon or Bicol (BBLK). Two adjacent southern blocks form Fault (ELF) and the Northern Cordillera Fault were added (Mindoro or MIND and Central Visayas (NCF). The modeling approach described above pre- or CENV) to create a more accurate southern Luzon dicts fault slip rates on each of these block bound- boundary. Three major plates were used to describe aries. While we recognize that some blocks exhibit regional motions: Eurasia (EURA), the Philippine Sea possible significant internal deformation as depicted by
74                                     G. Galgana et al. / Tectonophysics 432 (2007) 63–87

seismicity and numerous focal mechanisms (e.g., ILOC                4. Results
and BBLK), the density of our GPS sites in some
locations prevents higher resolution analysis. Hence the            4.1. General strategy of tests
described blocks represent a first-order approximation
of the Luzon region.                                                   We devised a hierarchy of tests that move from
                                                                    simple to progressively more complex models of ex-
3.2. Block models                                                   plaining present-day crustal deformation in Luzon. First,
                                                                    we examined whether deformation in Luzon could be
   Initially, we ran a series of tests to infer the physical        explained by a single block or by simple combinations
arrangements of tectonic plates. Models were run, for               of two tectonic blocks attached to either the Sundaland
instance, to verify the hypothesis that Luzon moves                 Plate or the Philippine Sea Plate. Then, we addressed
relative to both Sundaland and the Philippine Sea Plate             whether the kinematics of Luzon could be explained by
(see discussion in Beavan et al., 2001), or whether it              block rotations alone or a combination of both block
could be described as a relatively simple two-plate sys-            rotations and fault strain is needed. We then explored
tem based on a single dominant NW–SE Philippine                     models in which Luzon could be composed of two,
Fault, in addition to the east and west subduction zones            three, or more tectonic blocks. Next, we tested for
(Barrier et al., 1991; Bartel, 2002). Progressively more            coupling along faults by fixing locking values along
complex combinations such as a three-plate system                   fault planes, or by allowing the program to solve for the
involving a splaying Philippine Fault (Thibault, 1999)              coupling value. We also investigated the locking depths
or four-, five-, six-, and seven-plate systems were ex-             of active faults by examining models with variable
amined. The best-fit model is determined through mini-              coupling as a function of depth.
mization of misfit between 57 observed and predicted
velocity vectors and 78 focal mechanism slip vectors.               4.2. Tests for block independence
This misfit is parameterized as the reduced chi-square
value (total chi-square divided by the degree of                        To test for block independence, we solved for Luzon
freedom):                                                           initially as one solitary block, then as a block attached to
                                                                    either the Sundaland Plate or the Philippine Sea Plate. As
        X
                ðri =ri Þ2                                          a second test, Luzon was made a two-block system, with
        i¼1;n                                                       the northeastern block associated with the Philippine Sea
v2r ¼                        ;                           ð1Þ        Plate, and the southwestern block associated with the
            n−m
                                                                    Sundaland Plate. Model EG21, which allowed for uni-
where n is the number of observations; m is the number              form internal strain on a single Luzon block, produced a
of free parameters; ri is the residual associated with each         poor fit; χr2 = 6.92 (Table 3). Models considering Luzon
observation (or observed minus calculated velocity),                as part of PHSP (EG40) or SUND (EG41) produced
and σi is the data uncertainty. Minimization is done                higher misfits: χr2 = 36.66 and χr2 = 12.78, respectively.
using simulated annealing with a downhill simplex                   Model EG42 that partitioned Luzon into two blocks with
method (McCaffrey, 2002). For the various models, data              the Philippine Fault as the main locus of motion
misfit is tested using this reduced chi-square (χr2) sta-           produced a poor fit: χr2 = 33.77. This model attaches the
tistic. Chi-square values for the various models are                southwest side of Luzon (ILOC, SWL1, SWL2, CLUZ,
compared, with the resulting lowest value representing              MIND, CENV) to SUND and the northwest side of
the best fit between observed and predicted values. A χr2           Luzon (CAG1, CAG2, BBLK) to PHSP.
value much greater than 1 indicates a relatively poor fit               Tests were run to evaluate the contributions of
for the current model, while a value close to 1 indicates           rotation and coupling, by comparing the block rotation-
acceptable model fit. We then apply F-tests to determine            only model (no fault coupling) versus the block rotation
whether improvements in resulting χ2 are statistically              with fault coupling model. For the no-elastic strain
significant. F-tests are used to compare variances of               (block rotation-only) model, EG33 (7 blocks in this
distributions, and compare results of two models with               case), χr2 = 7.42 was obtained, as opposed to χr2 = 8.33
varying parameters (e.g., Stein and Gordon, 1984).                  for EG15, the model which considered only one pole of
Probabilities of having one model being statistically               rotation for Luzon, plus elastic strain associated with
different from another, and not entirely due to random              coupling along the three subduction zones (i.e., MT,
variability within a population, are determined through             ELT, and PT; see Table 3). The result indicates that
the resulting F-tests.                                              block rotation, in addition to the elastic strain along
G. Galgana et al. / Tectonophysics 432 (2007) 63–87 75
Table 3
Summary of model chi-square values and F-tests for block independence
Model Description No. of No. of DOF Total Reduced Prob.
data parameters χ2 χ2 (%)
EG40 (1 block) Luzon is 1 block, part of PHSP 186 19 167 6121.88 36.66 0
EG41 (1 block) Luzon is 1 block, part of SUND 186 19 167 2134.93 12.78 0
EG42 (2 blocks) Luzon 2 parts: SW Luzon part of SUND, NE Luzon part of PHSP 186 28 158 5335.10 33.77 0
EG21 (1 block) Luzon is 1 block, with internal strain 186 26 160 1106.72 6.92 0
EG33 (7 blocks) Rotation only 186 33 153 1135.04 7.42 0
EG15 (1 block) Fault coupling only 186 23 163 1358.03 8.33 0
EG20 (7 blocks) Without earthquake slip vectors; with rotation and coupling 108 46 62 153.45 2.48 99.7
EG53 (1 block) Poles of rotation fixed for EURA, PHSP, SUND 186 40 146 379.32 2.60 4.57
EG01 (7 Luzon blocks) With earthquake slip vectors, rotation and locking 186 46 140 313.26 2.24 –
The probability (Prob.) column indicates the degree to which the current model is statistically similar to the best-fit model (EG01 in this case). Model
names are designated arbitrarily. DOF=Degrees of Freedom.
subduction zones, is required to explain deformation those which included both GPS data and earthquake slip
within Luzon. A model using combined rotations and vectors. These tests demonstrated that Luzon is part of
elastic strain provided a significantly more accurate neither SUND nor PHSP. Nor could Luzon be explained
representation of the regional kinematics, with χr2 = 2.24 as an overlying solitary plate between SUND and PHSP.
(seven-block model EG01). F-tests demonstrate that These findings indicate that active deformation is indeed
this model is statistically distinguishable from the other occurring across the entire arc complex with the system
previously described models (Table 3). The results show of crustal faults contributing to the process. The suc-
that while block rotations can explain the majority of the ceeding sensitivity tests delve further into the details of
regional deformation in Luzon, fault-locking strain still a multi-block system of deformation in the northern
makes a significant contribution to the observed GPS Philippines.
velocity field.
Tests on models were also run using only GPS 4.3. Block model tests
velocities as input, earthquake slip vectors only, and
combined GPS and slip vector data. Tests using only To find an optimal block model for Luzon, an
GPS velocities (i.e., without earthquake slip vectors) for additional set of inversions were run. Chi-square
combined fault coupling and rotation produced models values were obtained and sensitivity F-tests were
with a nearly equivalent fit at χr2 = 2.47 (EG20); since made between the full seven-block model versus the
this model has fewer constraints as the directions of two, three, four, five, and six-block models. These sets
block motions are not constrained by earthquake slip, of tests were conducted to determine whether the fit
we elected to include earthquake slip vectors as obser- improves statistically upon considering successively
vational constraints in all further tests (e.g., EG01). larger numbers of blocks.
Through the results of these initial sensitivity tests, With the results of inversions from these given block
we verified that crustal deformation in Luzon is best models, it is noted that a systematic decrease (until the
approached by models which considered a combination 7-block model) in χr2 was evident as the number of
of block rotations, fault coupling, and elastic strain, and blocks is increased. The minimum reduced chi-square
Table 4
Summary of chi-square values and F-tests conducted for varying the numbers of blocks comprising Luzon, with both fault locking and block
rotations considered in the inversion
Model Description No. of data No. of parameters DOF Total χ2 Reduced χ2 Prob. (%)
EG11 Two-block model 186 30 156 400.24 2.57 2.1
EG12 Three-block model 186 33 153 348.31 2.28 11.8
EG13 Four-block model 186 36 150 370.87 2.47 5.9
EG32 Five-block model 186 40 146 331.96 2.27 18.8
EH02 Six-block model 186 40 146 286.57 1.96 –
EG01 Seven-block model 186 46 140 313.26 2.24 29.7
The probability (Prob.) column indicates the degree to which the current model is statistically similar to the best-fit model EH02.76 G. Galgana et al. / Tectonophysics 432 (2007) 63–87
Table 5
Summary of chi-square values and F-tests on models with various coupling parameters of faults and subduction zones bounding the blocks
Model Description No. of data No. of parameters DOF Total χ2 Reduced χ2 Prob. (%)
EH02 Variable coupling 186 40 146 286.57 1.96 –
EG74 Fully coupled 186 33 153 494.46 3.23 0.05
EJ20 Coupling at 1, 0.5, 0 186 27 159 556.48 3.50 0.003
EJ21 Coupling forced to 0 for bottom nodes, top nodes variable 186 53 133 347.68 2.61 12.68
The probability (Prob.) column indicates the degree to which the current model is statistically similar to the best-fit model EH02.
value was associated with EH02, meaning that block coupling or φ value is forced to decrease monotonically
motions are best modeled as a product of six moving downdip, as plate coupling theoretically reduces to zero
blocks. F-tests comparing EH02 with the other models at depth (McCaffrey, 2002). Test results eventually
in this set of tests also confirm that it is statistically showed that the variable coupling model was statistically
distinct from the other models (Table 4). Hence, we better and significantly different than both the fully
conclude that motion along several faults within Luzon coupled model and the fixed coupling model (Table 5).
contributes to the active crustal deformation of the area. Coupling for certain faults and subduction zones (e.g., the
We infer, however, that the fault separating blocks Eastern Verde Passage–Sibuyan Sea Fault, the southern
CAG1 and CAG2 can be neglected, given the com- Philippine Fault and the East Luzon Trough), however,
parison of results for the seven-block model (EG01) resulted in high uncertainties due to lack of adequate
against the six-block model (EH02). constraints, principally a paucity of near-field geodetic
observations.
4.4. Coupling tests
4.5. Tests for locking depth
In another series of tests, we modified coupling
values, ranging from fixing the coupling parameter (φ) or In the tests summarized in Table 6, the best-fit model
solving for the φ value (making it variable from being is subjected to variations in locking depth of the
locked or 1 and fully uncoupled or 0). These tests were Philippine Fault system. The locking depth was varied
designed to verify how tectonic motion is accom- from 15, 20, 25, 30 and 35 km by applying variable
modated, and to what depths elastic strain extends. coupling values as a function of depth. Results in Table 6
Furthermore, the coupling tests provide evidence of show that a 25-km locking depth gives the best fit. This
elastic strain accumulation rates, and in turn, possible result is consistent with the 20–25 km coseismic rupture
indications of slip deficits and seismic potential for faults. estimates of Silcock and Beavan (2001) and the July 16,
These tests fix the top, middle, and bottom nodes to 1990 earthquake hypocenter depth of 25 km (Beavan
values of φ = 1.0 (locked), 0.5 (50% partly coupled), and et al., 2001) along the Philippine Fault.
0 (fully uncoupled). Other tests involved solving for the Based on this suite of model tests, which verified a
top and middle nodes, while fixing the bottom nodes with range of block combinations, fault-locking depth, and
zero coupling. Coupling along the subduction interfaces coupling parameters, we conclude that the best repre-
(MT, PT, ELT) and other faults are tested by either sentation of crustal deformation for the island of Luzon
partially coupling or locking the plate boundaries. The is a model comprised of six elastic blocks (model
Table 6
Summary of chi-square values and F-tests on models with different average locking depths of the faults and subduction zones bounding the Luzon
blocks
Model Description No. of data No. of parameters DOF Total χ2 Reduced χ2 Prob. (%)
EG74 15 km locking depth 186 46 140 355.71 2.54 9.84
EG57 20 km locking depth 186 46 140 330.39 2.36 19.81
EH02 25 km locking depth 186 40 146 286.57 1.96 –
EJ31 30 km locking depth 186 40 146 388.47 2.66 3.35
EJ32 35 km locking depth 186 40 146 339.04 2.32 15.54
The probability (Prob.) column indicates the degree to which the current model is statistically similar to the best-fit model EH02.G. Galgana et al. / Tectonophysics 432 (2007) 63–87 77
EH02). This model includes both rotations and fault along the Macolod Corridor and Marikina Fault, trans-
locking with variable coupling for all the faults (along pression along the Digdig Fault, and transtensional
strike and with depth), to a 25 km locking depth. motion along the Northern Cordillera Fault (Table 7).
This partitioning of oblique convergence into arc-
5. Discussion normal and arc-parallel components was first described
in the Philippines (Fitch, 1972), and has been confirmed
Our newly obtained surface velocity field and pub- by numerous subsequent investigations (Cardwell et al.,
lished earthquake source mechanisms provide new 1980; Hamburger et al., 1982; Barrier et al., 1991;
constraints on the nature of present-day deformation in Aurelio, 2000). This strain partitioning process appears
a complex plate boundary zone. In general, our pre- to be typical of oblique subduction along many con-
ferred model describes Luzon as an actively deforming vergent plate zones (McCaffrey, 1992).
island arc, bounded by subduction zones on its flanks
and internally divided into discrete blocks by active 5.1. General pattern of deformation in Luzon
intra-arc faults. Deformation along the margins of
Luzon is dominated by arc-normal convergence, while The details of active crustal deformation for the
intra-arc deformation is dominated by arc-parallel defor- Luzon area are graphically depicted in Figs. 4–7, for our
mation. The oblique convergence between the Eurasian preferred model EH02. The GPS vectors (Fig. 6) show a
and Philippine Sea plates is accommodated through a close match between observed and predicted velocities.
combination of predominantly shear deformation within We note, however, that discrepancies exist in some
and around Luzon: left-lateral strike-slip motion along stations such as MRQ1 (Marinduque Island, south of
the Philippine Fault, left-lateral strike-slip motion along Luzon), presumably because of discrepancies between
the Verde Passage–Sibuyan Sea Fault, deformation earthquake slip vectors and the single geodetic con-
straint in block SW Luzon 1. Sites in very close prox-
Table 7 imity to faults, such as IFG1 near the Digdig Fault and
Summary of fault and subduction slip rates based on the best-fit model, QZN1 and QZN2 near the Philippine Fault, show
EH02 significant discrepancies in both magnitude and orien-
Fault/subduction Slip rate estimates Sense of motion tation, presumably associated with unmodeled defor-
zone name (mm/yr− 1) mation in the near-field of these major fault zones.
Digdig Fault 17 ± 9 to 27 ± 10 Transpression, oblique The modeled block velocity patterns (Fig. 8) show
sinistral strike-slip the combination of both convergence with the major
Macolod Corridor 5 ± 11 to 10 ± 11 Transtensional motion plates flanking Luzon and significant internal deforma-
Marikina Fault 10 ± 11 to 12 ± 11 Transpression, sinistral
tion of the northern Philippine arc. We conclude that
strike-slip
East Luzon 28 ± 12 to 39 ± 8 Sinistral strike-slip PHSP is converging with Luzon at rates of 28–39 mm
Transform Fault yr− 1 in a northwesterly direction, while the convergence
Philippine Trench 29 ± 10 to 34 ± 13 Westward subduction between SUND and central Luzon is highly variable, at
East Luzon Trough 9 ± 6 to 15 ± 7 Westward subduction rates ranging from 20 to 100 mm yr− 1. Slip along the
Manila Trench 20 ± 16 to 100 ± 16 Eastward subduction
Manila Trench appears to reach its maximum at
Phil. Fault-South 29 ± 16 to 25 ± 14 Sinistral strike-slip
(BBLK–SWL1) ∼ 100 mm yr − 1 at its northern extremity (near
Phil. Fault-Middle 29 ± 11 to 40 ± 9 Sinistral strike-slip 19.7°N), decreasing gradually to ∼ 50 mm yr− 1 in
(CLUZ–CAG2, central Luzon (at the SUND–CLUZ boundary, near
SWL2-BBLK) 16°N). Further south, along the SUND–MIND bound-
Phil. Fault-North 10 ± 9 to 15 ± 10 Sinistral strike-slip
ary, the slip appears to drop significantly, to around
(ILOC–CLUZ)
Verde Passage–Sibuyan 39 ± 24 to 41 ± 20 Sinistral strike-slip 20 mm yr− 1, presumably a result of the Palawan–
Sea Fault 1 Mindoro collision at the southern termination of the
(MIND–CLUZ) Manila Trench (Fig. 2). Our model also documents
Verde Passage–Sibuyan 39 ± 24 to 41 ± 20 Sinistral strike-slip westward convergence along the Philippine Trench
Sea Fault 2
(29–34 mm yr− 1) and at the East Luzon Trough (95 mm
(CENV–SWL1)
Northern Cordillera 17 ± 9 to 37 ± 12 Transtensional motion yr− 1), though at a significantly smaller rate. Based on
Fault our results, the principal locus of plate convergence
The values indicate the range (minimum and maximum) of fault slip
(about 60–70%) occurs at the Manila Trench, rather
rates within the fault, considering all nodes from both strike and dip than at the eastern subduction zones (Table 7). This is
direction. consistent with the conclusions of Kreemer et al. (2000).78 G. Galgana et al. / Tectonophysics 432 (2007) 63–87 Fig. 6. Observed (arrows with 95% confidence ellipses) and predicted (arrows with no ellipses) GPS-observed site velocities with respect to station MMA8 in block CLUZ from the best-fit model, EH02. We note that a significant proportion of the surface 5.2. Coupling along faults and subduction zones velocity field results from fault-locking strain, as shown in Fig. 9. Fault-related elastic strain along the Philip- Coupling values for the various block boundaries, pine–Digdig–Northern Cordillera fault system is par- derived from the best-fit model EH02, are summarized in ticularly large, due to the high slip rates and coupling Table 8. Based on the resolved coupling values, we can coefficients, resulting in significant internal strain within infer that Digdig Fault (near the epicenter of the 1990 the neighboring blocks. Luzon earthquake) is locked to 25 km depth, as well as We obtained Euler poles of rotation that approximate the southern sections of the Philippine Fault, along the published values (details of the various Euler poles and SWL1–BBLK interface. The Northern Cordillera Fault rotation rates are depicted in Appendix B). The Euler also exhibits high coupling rates at 0.95 ± 0.33. The Pole for ILOC–SUND (10.72°N, 118.46°E, + 5.726°/ Philippine Fault locking value varies, from locked at the My) was comparable with the initial values of 9.34°N, south to 0.58 ± 0.10 in central Luzon to around 0.81 ± 118.29°E, + 5.478°/My from Rangin et al. (1999). 0.48 at the ILOC–CLUZ interface in northwestern The Euler pole obtained for EURA–PHSP (62.19°N, Luzon. We note that the zone of partial locking is 169.81°E, + 1.052°/My) was also comparable to the situated near the intersection with the Digdig Fault, sug- values 61.4°N, 163.7°E, 1°/My obtained by Kotake and gesting a geometric control. Similarly, the seismically Kato (2002). active zones in southwestern Luzon, the Marikina Fault
G. Galgana et al. / Tectonophysics 432 (2007) 63–87                                                  79

Fig. 7. Observed (light gray arrows) and predicted (black arrows) earthquake slip vectors from the best-fit model, EH02. The 78 earthquake slip vectors
were derived from focal mechanisms, through the Harvard CMT Catalogue (1977–2003). Eastward trending slip vectors in CAG1, ILOC, CLUZ and
MIND are associated with subduction along the Manila Trench. Westward-trending slip vectors in CAG1 and CAG2 are associated with subduction
along the East Luzon Trough, while westward-trending slip vectors at BBLK are associated with subduction at the Manila Trench. Slip vectors that are
near the Philippine Fault, Digdig Fault and the Verde Passage–Sibuyan Sea Fault indicate shallow events that are typically strike-slip in nature.

and the Macolod Corridor, were found to be significantly                       uncertainty). The Philippine Trench exhibits low coupling
coupled (0.98 ± 0.13 and 0.56 ± 0.31, respectively).                           values at 0.27 ± 0.46. The paucity of GPS sites in close
Significantly, the coupling along the Manila Trench                            proximity to the three trenches, however, limits resolution
subduction zone is inferred to be almost zero. This                            of coupling values along these plate boundaries. In these
suggests that, in spite of the very high plate convergence                     cases, coupling values may trade off against estimated
rates revealed in our model, the block motion may result                       block convergence rates. Table 8 summarizes coupling
in relatively low seismic potential. This might explain the                    values and uncertainty estimates for all the faults and
relative paucity of large-magnitude earthquakes along the                      subduction zones.
Manila Trench margin (Rowlett and Kelleher, 1976;
Hamburger et al., 1982). In contrast, the East Luzon                           5.3. Deformation across the Philippine Fault
Trough appears to be locked (although with relatively
high uncertainty). Furthermore, coupling along the Verde                          Our study provides revised estimates of slip rates
Passage Fault was resolved to be 0.84 ± 0.42 on the                            along the Philippine Fault. We confirm that the Philippine
western side, and 0.37 ± 1.83 on the east (with high                           Fault is the main locus of shear deformation within
80                                          G. Galgana et al. / Tectonophysics 432 (2007) 63–87

Fig. 8. Total block velocities with respect to block CLUZ based from the best-fit model, EH02. Note that northeastern Luzon, depicted by blocks
CAG1 and CAG2, behaves as 1 block, i.e., the Northern Cordillera Fault terminates at the Digdig Fault junction.

Luzon, as suggested by Barrier et al. (1991), Yu et al.                        In contrast, Beavan et al. (2001) proposed a sig-
(1999) and Rangin et al. (1999). Fig. 10 shows a surface                   nificantly lower long-term slip rate of ∼15–20 mm yr− 1.
velocity profile across the Philippine Fault. Observed                     They examined deformation across the Philippine Fault
horizontal site velocities (individual points shown in                     using data from the same geodetic network, but analyzed
Fig. 10) describe an “s”-pattern across the fault, with the                the long-term slip rate using both an elastic approach and
fault-parallel velocities exhibiting more pronounced                       a combined elastic–viscoelastic model. Their values of
curvature than the fault-normal component. The fault-                      ∼40 mm yr− 1 along the northern Philippine Fault
parallel component is characteristic of a partially                        obtained using the elastic model correspond well with
coupled, sinistral strike-slip fault, with a slip rate of                  our estimate. However, they obtained a much lower long-
∼ 39.7 mm yr− 1. The curved lines on Fig. 10 show                          term slip rate, when considering accelerated post-seismic
modeled velocity distribution when both block rotation                     slip following the 1990 Luzon earthquake using the
and elastic strain associated with fault locking are                       elastic–viscoelastic model. While this rapid post-seismic
considered. The breadth of this zone of elastic de-                        slip is a viable result of this large crustal earthquake, we
formation results from the relatively deep (25 km)                         conclude for several reasons that the higher rate
locking depth inferred for the fault. Our preferred model                  represents a more reliable long-term slip rate for the
indicates fault-parallel slip rates of 29 to 40 mm yr− 1,                  central Philippine Fault. First, similar high rates of slip
which fall within the ranges proposed by these previous                    are obtained for neighboring segments of the Philippine
studies.                                                                   Fault that were not affected by the 1990 earthquake. (The
G. Galgana et al. / Tectonophysics 432 (2007) 63–87                                             81

Fig. 9. Fault-locking strain vectors from the best-fit model, EH02. Figure shows large fault-locking strain along the NW–SE trending strike-slip
Philippine Fault, the Northern Cordillera Fault and the Philippine Trench/East Luzon Trough.

PF-southern segment moves at about 25–29 mm yr− 1,                         areas of the PF (near the Digdig Fault intersection, site
while north of the 1990 epicenter area moves at about                      of the 1990 M 7.8 event) are estimated at 40 ± 9 mm
17–27 mm yr− 1.) Second, our periodic measurements of                      yr − 1 , and the average dislocation from the 1990
site positions show no evidence of significant temporal                    earthquake is ∼ 5.4 m (Yoshida and Abe, 1992). If we
variations in slip rate, extending as far as twelve years                  consider this to be a characteristic earthquake for this
following the main shock. And finally, as discussed in the                 segment of the fault system, we can estimate a
following section, the long-term recurrence rate for large                 recurrence interval of about 111 to 175 years based on
earthquakes along the Philippine Fault can be readily                      the fully coupled elastic model. With partial coupling
reconciled with the slip rate when the coupling factor is                  considered (58% at this segment of the PF), however,
incorporated in the calculations.                                          the recurrence interval will be much longer (∼ 192 to
    In principle, we can use these fault slip rate estimates,              301 years). This slip rate with partial coupling ap-
combined with earthquake rupture data, to compute                          proaches the paleoseismic recurrence intervals of 300–
recurrence intervals for large earthquakes. In practice,                   400 years obtained by Daligdig (1997). Furthermore,
however, earthquake rupture estimates are only avail-                      the elastic–viscoelastic model explored by Beavan et al.
able for the most recent earthquake along the Philippine                   (2001) identifies a long-term slip rate of 15–20 mm yr− 1
Fault. The relative block velocities near the northern                     quite close to the accumulation rates which consider
You can also read