Logistics Hubs in Oman and Political Uncertainty in the Gulf
←
→
Page content transcription
If your browser does not render page correctly, please read the page content below
Mahmood Al-Wahaibi 5/10/3018

 Logistics Hubs in Oman and Political Uncertainty in the Gulf
Executive Summary
Oman is taking remarkable steps to develop its logistics sector to be one of the main pillars of the
nation’s non-oil based economy in the future. The Impact of the global economic downturn
caused by low oil prices has pushed Gulf States Including Oman to look beyond the existing oil
based economy. Most of the GCC (Gulf Cooperation Council) countries depend heavily on oil
export which constitute over 80% in some countries (El Mahmah, A. 2016).

 Graph 1. Oil Share of GCC Economy

 Source: (El Mahmah, A. 2016)

Therefore, this research utilizes an augmented from of The Gravity Model of Trade developed by
Tinbergen in 1962 to better understand the past trend of Omani non-oil exports & re-exports and
estimate future growth. Non-oil export & re-export as defined by The National Center for
Statistics & Information (NCSI) means non-oil related products that are either made in Oman or
transshipped from Omani port. Furthermore, our augmented model is designed to investigate the
effect of GDP, population growth, actual distance between ports, free trade agreements (FTA),
political relations, and cultural similarity from 2006 to 2016 on the value of non-oil exports & re-
exports with 35 trading partners.
Our augmented gravity model was able to explain 60 % of the variation in non-oil export & re-
export flow across the 35 trading partners. The findings suggest strong correlations between non-
oil export value and most of the mentioned variables to be able to estimate potential trade
opportunities and future trade values. Distance, FTA, Trading Partner’s Population and Trading
Partners’ GDP provide most of the explanatory power to the model. Distance is one of the most
significant variables in the model with negative impact that indicates the farther the country is
the less likely to receive Omani non-oil goods. More importantly, FTA dummy variable is
observed to more than double the amount of non-oil export & re-export (207%). Interestingly,
the growth of Oman’s GDP is highly correlated with the value of non-oil export & re-export over
the past 10 years which indicates the importance of the non-oil sector for the national economy.
The analysis of our model reveals that the magnitude of Oman’s trade potential is maximum with
countries like India, Japan, Pakistan, Iran, United States, Egypt, Brazil, Indonesia, Turkey,
France, Germany, Bahrain, Thailand, Italy, Iraq, Yemen, Kenya, Switzerland, Iceland, and
Norway. On the other hand, there is an over-trade with most Gulf States, China, Singapore,
 1
Mahmood Al-Wahaibi 5/10/3018

South Korea, Malaysia, South Africa, UK, and Australia in the past decade. Understanding these
trends may give the country a strategic advantage to estimate possible outcomes of potential
future FTAs with trading partners and political circumstances in the region.
In addition, the estimated coefficients were used to estimate future non-oil export & re-export
growth from 2017 to 2022 with same trading partners based on three possible scenarios. The
first scenario is Business As Usual that assumes Oman will maintain exact same foreign policies
with all the 35 trading partners without any further economic agreements up to 2022. This
scenario echoes the optimistic outlook of the World Bank and the IMF for the recovery of the
world economy. Second scenario is The Optimistic Scenario that is based on the same economic
outlook in the previous scenario, but assumes signing FTA agreements with China, South Korea,
India, and japan on the GCC level and with Iran and the UK on bilateral level. Third Scenario is
Gulf Crisis Scenario that assumes Gulf States to cut political and economic ties with Oman. This
scenario is envisioned based on the current blockade of Qatar by other GCC members that
isolated the country economically and cut all logistic links.
Logistics hubs are strategic infrastructures in nature that can play pivotal role in expanding
Oman’s trade ties beyond the oil-based economy and protecting the national interest. In other
words, analyzing export & re-export flows offers better understanding of spatial placement of
logistics hubs (ports) that are subject to connectivity, cost, time, and political influence.
Specifically, the special placement of Omani ports is better understood through proximity to
potential markets, proximity to production sites, proximity to population, multimodal
connectivity, and national security.

Introduction
 Oman is moving ahead with very ambitious plan to diversify the economy away from oil. The
oil based economy of Oman is facing some rough time currently with the low oil prices hitting
the income sources of the country. As quick response, the country has formed a national
committee in 2016 with the name Tanfeedh which stands for National Program for Enhancing
Economic Diversification. Tanfeedh has concluded that Tourism and Logistics can be the new
source of income for the country. As result, they mandated The Ministry of Transportation to
formulate Sultanate of Oman Logistics Strategy 2040 (SOLS 2040). With this strategy being in
Place, the ministry incorporated Oman Global Logistics Company (OGL) or ASYAD to
translate this strategy on the ground and handover the ownership of logistics hubs (Ports, dry
ports, warehouses) and logistics operators ( Oman Rail, National Ferries Company, Oman
Shipping Company) to be under the hand of OGL.
Simultaneously, The Supreme Council for Planning (SCP) is taking the initiative to look at all
these different initiatives in the country and trying to develop a holistic picture of all these
expected transformations in a national scale. This huge undertaking is called Oman National
Spatial Strategy Project (ONSS). This project is meant to pinpoint every element of the national
development and address socio-economic issues in the country which a traditional masterplan
don’t pay attention to. An important aspect of ONSS project is regional connectivity and

 2
Mahmood Al-Wahaibi 5/10/3018

logistics evaluation to study the current conditions of the transportation sector as well as the
logistics sector in terms of performance, efficiency, connectivity, and competiveness.
 Furthermore, the strategic location of Oman in the middle of important shipping routes that link
the east with the west as well as Asia with Africa. The government is capitalizing on the
maritime history of Oman as the trading power house of Asia and an important hub in the ancient
Silk Road. This reviving efforts is now faced with the wind of political uncertainty in the region
with Gulf countries, specifically UAE, Saudi Arabia, and Bahrain cutting trade ties with Qatar.
This type of political events has significant implications on creating a self-reliant logistics
system in case of emergency. Qatar right now is facing the consequence of overlaying on Dubai
as the logistics hub for the region by not being able to independently satisfy its logistical
requirements which is the engine for any healthy economy in the world.
 For the sake of this research my logistics hubs definition will be mostly about ports due to the
lack of data on airports, and the small share of airports in the current logistics structure of the
nation. Additionally, Airports are not part of SOLS 2040 plan or OGL as they are operating
independently. The upcoming years will reveal the new structure of airport services in the
country and their strategic plan which then might be considered in further research.
Similarly, Oman also relies on Dubai for shipment/transshipment of goods and services to satisfy
the demand of the local businesses. Oman unfortunately still lags behind the UAE in providing
logistic services in affordable rates which encourages Omani based businesses to turn to Dubai
for their export/import requirements. In response, there is serious push by the government to
build independent logistics system that can support the local market and at the same time
challenge the position of the UAE as the sole logistics hub of the region.
By adding the political factor into the equation, this paper is going to study the potential
relationship between this political uncertainty in the region and the strategic placement of
logistics hubs in the nation. Particularly, we will be utilizing a customized version of gravity
model to examine possible factors that might impact non-oil export and re-export activities of
ports to forecast future export values based on three main scenarios. I hope that we will be able
to understand the political influence on logistics placemen in Oman and how that
political/strategic decisions can maybe overshadow the economic feasibility of sitting up a
logistics hub in a particular location. In other words, understanding the political dimensions can
gave us better understanding of current logistics placements and the nation’s logistics industry
development in the future.

Current Conditions
 The logistics sector in Oman is still in its infantry stage given the slow development of his sector
since 1970. The pace of development in the country was mainly focusing on creating modern
infrastructures to serve people of Oman and the Oil industry by providing adequate roads and
export infrastructures for all sort of petroleum byproducts. Auto-centric development dominates

 3
Mahmood Al-Wahaibi 5/10/3018

the urban landscape and offers not so many options of moving goods and services within the
country and outside the country.
 The Impact of the global economic downturn caused by low oil prices has pushed Gulf States to
look beyond the existing oil based economy. Most of the GCC (Gulf Cooperation Council)
countries depend heavily on oil export which constitute over 80% in some countries (El
Mahmah, A. 2016). The recent low oil prices have great impact on the national budgets of most
GCC countries and fiscal deficits rose to high levels. National governments have to look into
alternative sources of income to bridge the fiscal gaps. Therefore, economic diversification
strategies have been adopted by most GCC countries to speed up the shift from oil-based
economies. For instance, Oman created Tanfeedh as an urgent response to increasing burdens on
the government’s finances. Tanfeedh plan was formulated in cooperation with the Performance
Management and Delivery Unit (PEMANDU) of the Malaysian. The cooperation was possible
because of the close political relationship between the two governments and the successful
model of the Malaysian government in implementing the 5-year plans (Tanfeedh., 2016). The
workshop was organized by the SCP for 6 weeks that involved private sector representative
(businessmen), public sector representative (government officials from different sectors), Shura
Council members (elected body), and the Malaysian experts who analyzed the effectiveness of
previous plans such as Oman Vison2020 and previous 5-year plans.
The targeted sectors were already identified by the Royal Decree (1/2016). The identified sectors
are manufacturing, tourism, logistics, finance, and employment (Times of Oman., 2016).
Tanfeedh’s main aim is to accelerate development in the 9th 5-year plan (2016-2020) to achieve
the goals set by Oman Vision 2020. The strategic geographical location of Oman between the
East and the West overlooking important trading routes makes it a strong candidate to be the
future regional transshipment hub of the region instead of Dubai. As result, Sultanate of Oman
Logistics Strategy (SOLS) 2040 was developed to create an integrated logistics system that
includes ports, airports, public buses, road infrastructure, railroad and sea shipping (SOLS,
2014). This ambitious strategy aims at connecting all logistics hubs of the nations with efficient
road networks and railway to link to the wider region (The Gulf Region).
SOLS 2040 was developed by the Ministry of Communication and Transportation in Oman to
accelerate the development of this crucial sector for the country and establish a guideline for
ASYAD Company to follow in their business model. The report calls for increased utilization
of what is already available of infrastructure to maximize their contribution. The majority of the
report is focused on the GDP contribution of logistics, Employment of Omanis, and building a
logistics name for the country compared to Dubai that has already an established name in the
market (SOLS, 2014). Furthermore, Challenges Highlighted by SOLS 2040 are:
 • Time is critical for making this investment to not lose regional competition to our
 traditional rivals who has better logistics chain in place.
 • Significant shortage of skilled labors ( Expats and Omanis)
 • Mismatch of employment placement and unclear job titles.

 4
Mahmood Al-Wahaibi 5/10/3018

Furthermore, SOLS 2040 forecasts indicate that the contribution of the logistics sector in the
country is going to grow from 1.5 OMR billion in 2014 to approximately 14 billion in 2040 to
make it one of the major employers in the country with estimated 300,000 jobs.

 Table 1. The ambitious Goals of SOLS 2040

 Goals 2014 2020 2030 2040
Logisitcs Contribution to GDP (OMR Billion) 1.5 3 8 14
Employment 30,000 80,000 200,000 300,000
World Bank Logistics Index 59 Top 30 Top 20 Top 10
Global Competitive Index 46 Top 30 Top 20 Top 10
Global Enbaling Trade Report 31 Top 20 Top 10 Top 5
 Source: (Sultanate of Oman Logistics Strategy (SOLS), (2014). Ministry of Transportation and Communication)

In light of that, SOLS 2040 recommends Royal Omani Police to be the law-enforcing body, not
the regulator of truck movement. In other words, truck and fright movement should have its own
regulating body to regulate movement efficiently. Secondly, education and training of young
Omanis is something that requires a national strategy to address the projected growth in the
logistics sector. Thirdly, the creation of research board to oversee logistics research and
development in the country.
In addition, there is an earlier study by the Ministry of Communication and Transport on
enhancing the competitiveness of Omani ports. The study based on survey to various
stakeholders in the public and the private sectors. The study is calling for Integrated National
Action Plan for Enhancing Competitiveness and Integration of Omani Ports (INAP-ECI Omani
Ports) due to the destructive nature of competition between Omani ports in the country.
Furthermore, the study has established a model to forecast trade growth based on time and cost
of shipping until 2040. It is important to note that the study has highlighted that global best
performance of import is 4 days and export is 5 days. Regionally is 7 days. While Oman takes
10 days for export and 9 days for import. Also, the cost of TEU in Oman is much higher than
the region (ECOP., N.A.)
 • Export: Oman is higher than UAE by 90 Dollars per TEU
 • Import: Oman is higher than UAE by 65 Dollars per TEU
Enhancing the competitiveness of Omani Ports report has inspired Oman Multi-Modal Law
which is still in drafting stages. The aim of this law is to introduce Multi-modality to the Omani
regulatory bodies and establish an entire legal procedure for all involved governmental bodies.
For instance, the Ministry of Transport and Communication’s personnel has the authority to
enforcing the law. Also, ratifying e-communication as formally legal document instead of old
fashion hard forms to ease formalities. Mandating insurance for operators to promote security
(Enhancing the competitiveness of Omani Ports, 2014)

 5
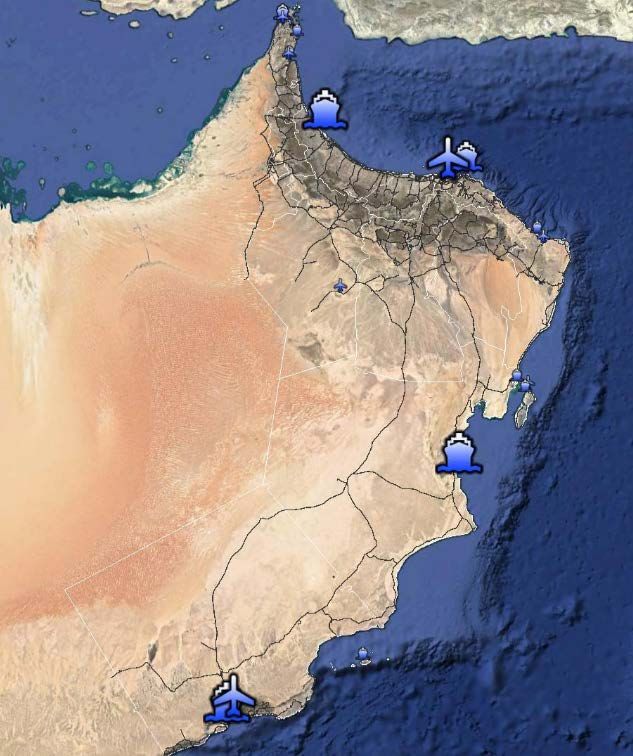
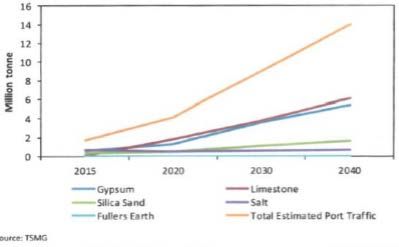
Mahmood Al-Wahaibi 5/10/3018

Main Gateways to the Oman
 Oman has two main strategic ports for the movement of commodities currently while Duqm
Port is still underdevelopment to be able to handle trade and containers in the near future. It is
important to Note that Port Sultan Qaboos was the premier gateway to Oman, but was converted
into tourism-only port to promote tourism in the old city of Muscat and divert truck traffic away
from the capital (Omran, 2016). Sohar and Salalah Port are situated strategically at the two ends
of the country with their own Freezones to promote export oriented industries and attract foreign
investments. While Duqm is based in the middle of the country overlooking the Indian ocean far
away from Strait of Hormuz which is currently the point of international focus with the
intensifying relations between Iran and the Arab World.

 Map 1. Map of Oman with port locations

 Sohar Port 2 Million TEU

 Port Sultan Qaboos (Tourism)

 Duqm Port

 Salalah Port 5 Million TEU

 Source: (Google Earth Pro)
 Despite the national plans for the logistics sector, each one of these ports has its masterplan for
the long run based on their specialty and international affiliation. For instance, Sohar Industrial
Port was founded in 2002 as joint venture (JV) between the Government of Oman and Port of
Rotterdam (Sohar Port, 2017). In 2010 the freezone was added to attract 26 billion of foreign
investment according to port’s authority figures. The port gained more importance with the

 6
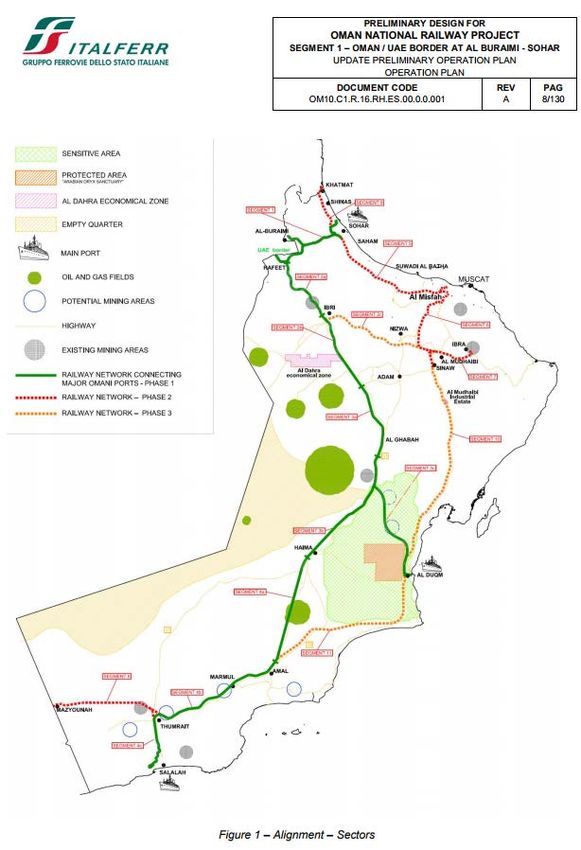
Mahmood Al-Wahaibi 5/10/3018

diversion of all commercial activities of Port Sultan Qaboos to Sohar in August 2014. The port
has its own expansion plan which is based on their own forecasts of future growth.
On the other hand, Salalah Port started operation in 1999 as important transshipment port in the
country (Salalah Port, N.A.) The strategic location at the mouth of the Red Sea and in between
important transshipment routes between Europe and Asia made the port important transit hub for
many international liners including the Mearsk. Similarly, the port has its own masterplan based
on expanding general cargo facilities, not only container transshipment to capture bigger share of
the market.
Duqm Port is one of the largest Special Economic Zones development in the world with land
almost the size of Qatar (Duqm Authority, 2013). Port of Duqm is still under development and
with only little commercial activities at the time to cater to the need of the huge projects in the
zone including Duqm Refinery and Oman Dry Dock. However, once is ready is projected to
handle large volume of Oman mineral export and petroleum as well as container transshipment
due to its proximity to main international sea routes.

 Graph 2. Duqm Port Mineral Export Growth

 Source: (Preliminary Design for Oman National Railway Project (2014). ITALFERR)

Common Issues and Challeng
According to Korea Institute for International Economy Policy (KIEP) report Logistics Hubs in
the GCC countries should be understood as industrial diversification effort to involve the private
sector and strengthen its presence within the economic structure. In general logistics hubs in the
GCC well suited to be hubs for re-export and international joint ventures in the field of logistics
and distribution in the global scale (Hyung, L. K. et al., 2016).
Despite all these plans studies for Omani ports there are several issues that need to be discussed
in order to explain why Omani ports are not competitive enough in the region and internationally
given the strategic location of the country. First of all, there is a problematic lack of
communication between port operators in the country who are in somewhat “destructive
competition” as clearly pointed out by Ministry of Transport and Communication study on
Enhancing the Competitiveness of Omani Port. “Local competition among Omani ports due to
 7
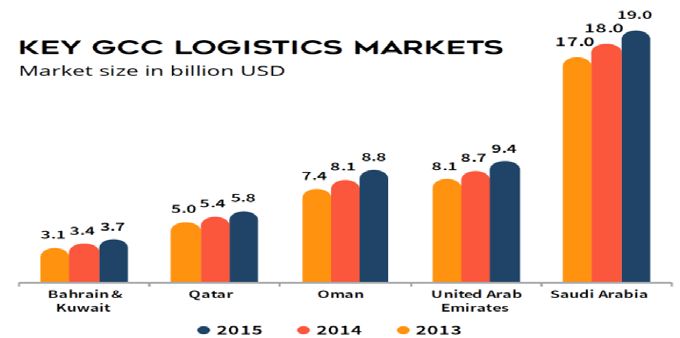
Mahmood Al-Wahaibi 5/10/3018

lack of cooperation and coordination” (ECOP, 2014.). In addition, this lack of coordination
among port operators is direct result of not having a unified regulatory body in the logistics
sector in Oman that calls for coordinated operations between ports.

 Graph 3. Gulf States Logistics Markets by Size

 Source: (: http://www.solidiance.com/whitepaper/download/gcc-logistics-market.php#download)

Secondly, Oman is facing server shortage of skilled labor in the Logistics sector. The logistics
sector in Oman is characterized as not attractive field for locals who has to cope with poor
wages, long working hours and lack of automation. The field is mostly dominated by expatriate
workers with huge gap in specialized education and training in logistics. Thirdly, my interview
with Mr. Nabil Salim Al Bimani who is an Executive Director revealed that Oman Global
Logistics Group or ASYAD’s business model is based on no direct involvement with Logistics
operators to echo the national logistics vision SOLS 2040 (June, 2017). ASYAD as of 2017 has
no clear plan to integrate all these different operators and no clear strategy in liking academic
institutions with operators as recommended by SOLS 2040.
Thirdly, Sohar Port as well as Salalah Port are undertaking massive expansion plans with
forecasted trade flow that is proven problematic. In other words, the current handling capacity of
the ports are still way more than the amount of containers that each port is actually handing
which poses a serious question of whether these expansions are needed in the first place.
 Graph 4. Sohar Port Handling Capacity of Containers

 Sohar Port
 1

 0.8

 0.6

 0.4 Million TEU

 0.2

 0
 2012 2013 2014 2015 2016 2017

 Source: (http://www.soharportandfreezone.com/en/shipping/port-statistics)
 8
Mahmood Al-Wahaibi 5/10/3018

For instance, Sohar Port current handling capacity is 2 Million TEU, while actual containers
handled is 0.83 Million TEU in 2017. This means that the port only used 38% of its capacity.
Slalah Port current handling capacity is 5 Million TEU, while actual containers handled is 3.94
Million TEU. It indicates that the port only used 75% of its current capacity.
 Graph 5. Salalah Port Handling Capacity of Containers

 Port of Salalah
 4.5
 4
 3.5
 3
 2.5
 2 Million TEU
 1.5
 1
 0.5
 0
 2013 2014 2015 2016 2017

 Source: (Data Provided by the Ports Division, Ministry of Transport & Communication)

The Model
Given all these background information about the logistics sector in Oman, ports are the main
logistics hubs of the nation that the Omani economy depends on for export and import purposes.
As maritime nation, Oman ranked top 55 exporter out of 135 countries according to the World
Bank (Global Edge, N.A.). With good political relations with the rest of the world, Oman has
diverse trading partners around the world that can benefit the Omani economy in the long run;
especially with the diversification efforts that are taking place currently. Therefore, our proposed
model is based on the well-known Gravity Model of international trade used by Jan Tinbergen in
1962 to predict bilateral trade between two countries. Gravity Model is based on Newton’s
universal law of gravitation that measures the attraction of two objects based on their mass and
distance, while in our case is economic size (GDP) and distance.
The model has been customized and modified over time to suit different scenarios and improve
accuracy of prediction. For instance, the model has been used to estimate the implications of
free trade agreements (FTAs). David M. Gould who was Senior Economist for the Federal
Reserve Bank of Dallas studied the impact of North America Free Trade Agreement (NAFTA)
on trade flow using gravity model in 1998. The study concluded that “NAFTA is foremost a free
trade agreement, and as such it benefits derive from a shift in resources to industries that reflects
a nation’s comparative advantage and away from industries that do not. It is important to
understand that this shift implies that the benefits comes from both increase in imports and
exports” (Gould, D. M., 1998).

 9
Mahmood Al-Wahaibi 5/10/3018

Gravity model has been widely used to estimate trade potentials for countries and examining the
possibility of expanding trade ties. For example, Amita Batra of the Indian Council for Research
on International Economic Relations (ICRIER) in 2004 use augmented gravity model equation
by using variables “representative of geographical, cultural and historical proximity of bilateral
trade pairs along with their economic size” (Batra, A.,2004). The estimates obtained using the
augmented gravity model specification in this paper indicate a huge potential, “of the order of
US $ 6.5 billion, with Pakistan”. The model also shows that there is tremendous “potential with
China and trade can more than double if barriers and constraints are removed” (Batra, A.,2004).

Gravity model has been used to examine trade flow between Vietnam and 60 countries. The
model found that and culture and distance have great impact on trade flow between Vietnam and
these 60 countries and that there is great trade potential with Africa and West Asia (Binh, D. T.
T., et al., N.A.). Also, Rahman (2003) has estimated trade potential for Bangladesh using panel
data approach with economic factors like openness, exchange rates etc rather than natural factors
such as culture, or natural barriers.

Furthermore, Gravity model is also used by Korea Institute for International Economic Policy
and Yokohama National University to estimate trade flow of South Korea. The study was carried
out by Chan-Hyun Sohn (2005) who found out that South Korea has untapped potential with
Japan and China and they could be desirable partners for FTA. In Africa, Chinedum Onyemechi
(2014) used gravity to model to analyze trade flows of Nigeria. The study examined the
usefulness of the gravity model in sitting up port facilities and dry port facilities by
understanding the trade dynamics given the importance of spatial distances (Onyemechi, C. et
al., 2014).

Given the mentioned importance of gravity model around the world in estimating trade potentials
and logistics placements, the model is proven to be flexible enough to be utilized for different
purposes in specific context. Undoubtedly, each locality has its unique issues with trade flow
and logistics placements which gravity model could possibility accommodate in a form of
independent variables or dummy variables. As result, we believe that our augmented version of
the gravity will be sufficient enough to analyze the export and re-export activities for Omani
ports and help us examine certain criteria for logistics placements in the nation.

Methodology
Gravity model explains the flow of trade between a pair of countries as being proportional to
their economic size (GDP) and inversely proportional to the distance between them. The model
has a lineage that goes back to Tinbergen (1962) and Poyhonen (1963), who specified the gravity
model equation as follows:
 ∝. .
 = (1)

Where Tradeij is the value of the bilateral trade between country i and j, GDPi and GDPj are
country i and j’s respective national incomes. Distanceij is a measure of distance between the two
countries and α is a constant of proportionality.

 10
Mahmood Al-Wahaibi 5/10/3018

 Taking logarithms of the gravity model equation as in (1) we get the linear form of the model
 and the corresponding estimated equation as:

 Log (Tradeij) = α + β1 log (GDPi.GDPj) + β2 log(distanceij) + uij (2)

 Where α, β1 and β2 are coefficients to be estimated. The error term captures any other shocks and
 chance events that may affect trade flow between the two countries. Equation (2) is the core
 gravity model equation where bilateral trade is predicted to be a positive function of economic
 size and negative function of distance.

 It is important to mention that many trade models don’t consider distance as important variable
 to include due to the technological advancement in the age of globalization. However, there are
 several reasons for the inclusion of distance as an explanatory variable (Batra, A., 2004). Some
 of these explanations are as follows:

 • Distance is a proxy for transport costs
 • Distance is an indicator of the time during shipment. For perishable goods the probability
 of surviving intact is a decreasing function of time in transit
 • Synchronization costs: when factories combine multiple inputs, the timing of these needs
 to be synchronized so as to prevent emergence of bottlenecks. Synchronization costs
 increase with increasing distance.
 • Transaction costs: distance may be correlated with the costs of searching for trading
 opportunities and the establishment of trust between potential trading partners.
 • Cultural and religious distance: It is possible that greater geographical distance is
 correlated with larger cultural differences. Cultural and religious differences can impede
 trade in many ways such as inhibiting communication, availability of Halal food, and
 more.

 To account for other factors, our gravity model for Omani ports is designed to test the impact of
 Oman’s GDP, Oman’s population, trading partners GDP, Trading partners, GDP, distance,
 political relation, cultural & religious similarity, and FTAs on Oman’s export and re-export
 activities between 2006 and 2016 with 35 trading partners. Our augmented model is expressed
 as follow:

Log = + β1 log + β2 log + β3 log + β4 log + β5 log + β6 PR + β7 + β8 F + (3)

 Where:
 i = 1 (Oman)
 j = 2, 3, 4,...35 (Trading Partners)
 t = 2006, 2007, 2008,..., 2016.
 Tijt: Total Export & Re-export with country j in year t

 11
Mahmood Al-Wahaibi 5/10/3018

Yit: Oman’s GDP in year t
Yjt: GDP of country j in year t
Nit: Oman’s population in year t
Njt: Population of country j in year t
Dij: Distance in kilometers between Omani Port and county j
PRijt: Political Relation dummy between Oman and country j in year t
Cij: Culture dummy for cultural difference between Oman and country j
 Fijt: Free Trade agreement dummy variable for the strategic partnership between Oman and
country j in year t
eijt: Error term

 Table 2. Dummy Variables Description
 Dummy Variable Description
 PRijt 1= Good Political Relations, 0= No Political
 Relations
 Cij 1= Culturally and Religiously Similar ( Arab,
 Islam), 0= Culturally and Religiously
 Different
 Fijt 1= Free Trade Agreement, 0= no Free Trade
 Agreement

The Political relation dummy is used as proxy for possible political uncertainty that may impact
the flow of trade. Also, the cultural dummy is used to test the potential of trade with other Arab
Nations and Islamic nations that share similar cultural values and similar dietary restrictions
(halal food). Lastly, Free Trade Agreement dummy is used as way to evaluate the impact of
FTAs on the flow of trade and to test whether FTAs can truly increase trade potential with
trading partners.
It is Important to note that the 35 trading partners are chosen based on their importance for the
Omani exports and re-exports activities. Therefore, United States, United Arab Emirates, Saudi
Arabia, Qatar, Bahrain, Kuwait, India, China, South Korea, Japan, Singapore, Pakistan, Iran,
UK, Egypt, Somalia, South Africa, Malaysia, Thailand, France, Germany, Italy, Brazil,
Indonesia, Turkey, Iraq, Australia, Netherlands, Libya, Yemen, Kenya, Tanzania, Switzerland,
Iceland, and Norway.
The Trade volume is based on non-oil export and re-export only due to the fact that it was
difficult to obtain reliable data on imports from each of these courtiers from 2006 to 2016. Not
only that, our main focus in this study is on estimating non-oil export and re-export to examine
the future role of the logistics sector in the diversification efforts away from oil. The National

 12
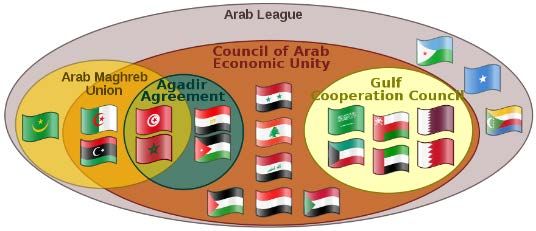
Mahmood Al-Wahaibi 5/10/3018

Center for Statistics and Information (NCSI) is used as primary source for non-oil export and re-
export data.
Distance is measured using an online applications that measures actual sea routes between
countries using nautical miles that was converted into kilometers for our model. Ports.com
identifies possible routes between Omani Ports (Sohar and Salalah) and trading partners’ main
commercial ports. Then one of the Omani ports is chosen depending on the direction of the
country. For instance, the distance between Oman and Tanzania is measured using the route
between Salalah Port and Port of Dar es Salaam. This method is utilized as way to feed the
model with more realistic distances instead of the traditional method of measuring distance
between the two main capitals of the two countries using Google Maps.
Oman’s population and GDP data from 2006 to 2016 was obtained from NCSI. While, trading
partners’ population and GDP data from 2006 to 2016 was obtained from World Bank Open
Data Portal.
Lastly, the existing Free Trade agreements (FTAs) between Oman and one of these trading
partners are included into the model. For example, Oman is a member of the Gulf Cooperation
Council (GCC) since 1981 and it is treated as a form of FTA in our model. Also, Oman is a
member of the Greater Arab Free Trade Area (GAFTA) since 1997 along with 17 Arab
members.
 Figure 1. Arab League Structure

 Source: (Wikipedia)

 Oman has signed has signed few FTA agreements with United States in 2009, EFTA States
(Iceland, Liechtenstein, Norway, Switzerland) in 2009, and Singapore 2013.

Findings (Results)
Our augmented model fits the data well and explains 60 % of the variation in non-oil export and
re-export flow across the 35 trading partners as indicated by the regression. The standard features
of the gravity model work well. Distance, FTA, Trading Partner’s Population, and Trading
Partners’ GDP provide most of the explanatory power in all the regressions. The baseline
variables (both GDP and distance) are very highly significant, have the expected signs and are of
reasonable magnitude.

 13
Mahmood Al-Wahaibi 5/10/3018

 Table 3. Regression Results

 Independent Variables Coefficient T-Test P-value
 FTA 1.122*** 4.756 0.000
 Cultural Similarty 0.341 1.255 0.210
 Distance -1.220*** -10.858 0.000
 Trading Partner Population 0.670*** 9.640 0.000
 Oman Population -0.016 -0.009 0.993
 0.327*** 4.479 0.000
 Trading Partner GDP
 1.793*** 3.095 0.002
 Oman GDP
 Year 0.024 0.216 0.829

 Note. *** is statistically significant at 1% level

Surprisingly, Oman’s population has very small significance with little explanatory power in the
model. In fact, Oman’s population coefficient is in minus number (-0.016) which has indicated
the negative impact of the variable. The only logical explanation to this interesting outcome is
the fact that Oman has very small population compared to many of its main trading partners that
are disproportionality higher such as The United States, India, and China. While on the other
hand that trading partner’s population is very significant as they constitute the consumer market
for the Omani non-oil exports and re-exports.
Cultural & Religious Similarity dummy variable has little significance in the model. Initially, we
through the cultural dummy will have greater significance in explaining Oman’s export pattern;
however, it proves the global expansion of Oman’s trading partners despite cultural differences.
Furthermore, Political Relations dummy was completely rejected by SPSS as it is a constant
variable given Oman’s exceptional political relationship with the world. Oman is once described
by Kevin Sullivan (2015) as “Switzerland of the Middle East” because of Oman’s ability to
avoid political conflicts in the region and maintain balanced foreign relations with nations across
the world.
More importantly, Distance is one of the most significant variables in the middle with negative
impact that indicates the farther the country is the less likely to receive Omani exports or re-
exports. It is logical impact due to the cost and the time associated with longer distance which
works as disincentive for export activities. In addition, it proves the logic of the inverse
relationship of distance in the traditional gravity model. Taking into account countries are more
likely to cover their internal market needs with neighnoring countries rather than farther
countries.
Oman’s GDP and Trading Partner’s GDP are statistically significant as predicted by the gravity
model. GDP works as a proxy for economic size and economic production of a country.
Oman’s GDP indicates the health of the local economy and the ability to export and trading
partners GDP indicates the ability of the market to spend.

 14
Mahmood Al-Wahaibi 5/10/3018

 Graph 6. Growth of Oman GDP and Non-oil Exports

 Oman GDP & Non-Oil Export (Billion OMR)
 35.0

 30.0

 25.0
 Billion OMR

 20.0

 15.0

 10.0

 5.0

 0.0
 2006 2007 2008 2009 2010 2011 2012 2013 2014 2015 2016 2017
 Year

 Oman GDP Non-Oil Export & Re-export

 Source. (https://data.gov.om/search?query=Population&scope=datasets)

Effects of FTA
FTA dummy variable is proven to be highly significant statistically. Our model shows that FTA
could more than double the amount of non-oil export and import for Oman. For instance,
Oman’s non-oil export & re-export to United States went from USD 241.95 million in 2009 to
368.80 in 2010 after signing The United States-Oman FTA in 2009. Also, after signing the
Singapore-GCC FTA in 2013 non-oil export and re-export jumped to USD 256.76 million from
previous year 131.06 (NCSI, 2016).
 Graph 7. FTA impact on Non-oil Export & Re-export

 Export & Re-exports to USA (USD Million)
 1200.00

 1000.00

 800.00
 USD Million

 600.00

 400.00

 200.00

 0.00
 2006 2007 2008 2009 2010 2011 2012 2013 2014
 Year

 Source. (https://data.gov.om/search?query=Population&scope=datasets)

 15
Mahmood Al-Wahaibi 5/10/3018

Oman’s Trade Potential
Having estimated the gravity model for export & re-export flow with 35 main trading partners,
we proceed to estimate trade potential for Oman. In this section the model estimates from the
previous section are used to predict Oman’s trade with all the countries in our sample. The ratio
of trade potential (P) as predicted by the model and actual trade (A). (Frankel, J. &. Romer, D.,
1996). (P/A) is then used to analyze the future direction of trade for Oman. If the value of P/A
exceeds one, the implication is in terms of potential expansion of trade with the respective
country. Depending on the value of P/A, Oman’s trading partners have been divided into two
categories-those with which potential for expansion of trade is foreseen and countries with which
Oman has already exceeded its trade potential. (Batra, A., 2004).
The magnitude of Oman’s trade potential is maximum with countries like India, Japan, Pakistan,
Iran, United States, Egypt, Brazil, Indonesia, Turkey, France, Germany, Bahrain, Thailand, Italy,
Iraq, Yemen, Kenya, Switzerland, Iceland, and Norway. While, There is over trade with most
Gulf States, China, Singapore, South Korea, Malaysia, South Africa, UK, and Australia.

Regional Grouping
For Oman’s trade potential we have grouped the 35 trading partners into groups based on
geographical location or economic coalition to better understanding the spatial distribution of
Oman’s export & re-export markets. Regional grouping also may allow Oman to weigh the
potential of expanding trade with any of the mentioned partners in our sample in form of FTAs
or other bilateral agreements.
 1- Oman-GCC
 Our results shows that there has been overtrade with most Gulf Cooperation Council (GCC)
countries except for Bahrain. Oman as GCC member seems to capitalize highly on other GCC
countries that serve as large market for Omani exports and re-exports. Especially, United Arab
Emirates and Saudi Arabia who are the biggest regional markets for Omani exports

 Table 3. Potential Trade with GCC States

 GCC (P/A) Potential Trade
 United Arab Emirates 0.30 Overtrade
 Saudi Arabia 0.53 Overtrade
 Qatar 0.88 Overtrade
 Bahrain 1.36 Potential Trade
 Kuwait 0.96 Overtrade

It is Important to note that the UAE is the biggest importer of Omani non-oil exports & re-
exports which reached its highest in 2014 (over 5 Billion dollars). This shows the importance of
UAE as important regional logistical hub in the region as some of these Omani exports will be
transshipped somewhere else due to the reasons we mentioned earlier in current conditions
section.

 16
Mahmood Al-Wahaibi 5/10/3018
 Graph 8. Non-oil Export & Re-export to UAE

 Export & Re-export to UAE (USD Million)

 6000

 5000

 4000
 USD Million

 3000
 SAARC (P/A) Potential Trade
 2000 India 5.00 Potential Trade
 Pakistan 4.00 Potential Trade
 1000

 0
 2006 2008 2010 2012 2014 2016
 Year

 Source. (https://data.gov.om/search?query=Population&scope=datasets)

 2- Oman-SAARC
 South Asian Association for Regional Cooperation (SAARC) is a regional intergovernmental
organization that represents countries in the Indian Subcontinent including India, Pakistan,
Afghanistan, Sri Lanka, Bangladesh, Nepal, Maldives, and Bhutan. In our Sample we have India
and Pakistan as important trading partners for Oman. As shown in the results, Oman has great
trade potential with India and Pakistan given their growing economies and growing population
that can serve as consumer base for Omani exports & re-exports.
 Table 4. Potential Trade with SAARC Countries

 SAARC (P/A) Potential Trade
 India 5.00 Potential Trade
 Pakistan 4.00 Potential Trade
 3- Oman-EFTA
European Free Trade Association (EFTA) consists of Switzerland, Iceland, Norway, and
Liechtenstein which we don’t have reliable data about. EFTA represents the biggest potential for
Omani non-oil export & re-exports. Despite the distance factor, EFTA is already in effective
FTA with the GCC with high GDP that overpowered the distance factor in our model.

 Table 5. Potential Trade with EFTA Countries
 EFTA (P/A) Potential Trade
 Switzerland 2.59 Potential Trade
 Iceland 376.15 Potential Trade
 Norway 26.09 Potential Trade

 17
Mahmood Al-Wahaibi 5/10/3018

 4- Oman-GAFTA
Oman is a long standing member of the Greater Arab Free Trade Area (GAFTA) which almost
include all Arab nations. As we can see in the figure below, there is potential trade with Iraq,
Yemen, especially Egypt given the fact that it has the largest population and the third largest
economy in the Arab World.

 Table 6. Potential Trade with GAFTA Countries

 GAFTA (P/A) Potential Trade
 Iraq 1.05 Potential Trade
 Libya 0.09 Overtrade
 Yemen 1.13 Potential Trade
 Egypt 3.62 Potential Trade

 5- Oman- East Africa
Oman has historical relation with east Africa that goes back to the imperial history of the Omani
Empire. As shown in the figure below, there is trade potential with Kenya and Tanzania; while
there is an over trade with Somalia due to the political conflicts and the economic hardships that
the country is going through currently.

 Table 7. Potential Trade with East Africa

 East Africa (P/A) Potential Trade
 Kenya 1.07 Potential Trade
 Somalia 0.19 Overtrade
 Tanzania 1.50 Potential Trade

 6- Oman-Europe (EU)
Omani exports & re-exports have potential in Europe; especially with France, Germany, and
Italy. However, there is an overtrade with UK and the Netherlands currently that serves as the
gateway for Omani exports & re-exports to Europe given their locations as logistics hubs.

 Table 8. Potential Trade with Selected European Countries
 Europe (P/A) Potential Trade
 UK 0.55 Overtrade
 France 2.21 Potential Trade
 Germany 1.14 Potential Trade
 Netherlands 0.09 Overtrade
 Italy 1.50 Potential Trade

 18
Mahmood Al-Wahaibi 5/10/3018

 7- Oman-ASEAN
Association with Southeast Asian Nations (ASEAN) has potential for Oman exports & re-
exports, especially Indonesia with the largest Muslim population in the world and the largest
economy in ASEAN region. We understand the limitation of our model that didn’t account for
other ASEAN countries that clearly demonstrates the ASEAN region potential by only choosing
top trading partners for Omani exports and re-exports

 Table 9. Potential Trade with ASEAN Countries

 ASEAN (P/A) Potential Trade
 Malaysia 0.75 Overtrade
 Thailand 1.00 Potential Trade
 Singapore 0.10 Overtrade
 Indonesia 6.00 Potential Trade

 8- Oman-East Asia
East Asia region is the power house of big economies such as Japan, South Korean, and China.
Our model identifies that Oman is overtrading with China and South Korea, while there is still
trade potential with Japan which is the second largest economy in the region and the third largest
economy in the world.

 Table 10. Potential Trade with East Asia

 East Asia (P/A) Potential Trade
 Japan 2.28 Potential Trade
 South Korea 0.20 Overtrade
 China 0.88 Overtrade

 9- Oman-IORA
The Indian Ocean Rim Association (IORA) is an emerging intergovernmental organization that
Oman is actively participating in to explore economic potentials. One of the biggest potentials is
with Iran due to the good political relations, the spatial proximity to Omani ports, and growing
economy after lifting the imposed economic sanctions.

 Table 11. Potential Trade with IORA Countries

 IORA (P/A) Potential Trade
 Iran 7.57 Potential Trade
 Australia 0.62 Overtrade
 South Africa 0.42 Overtrade

 19
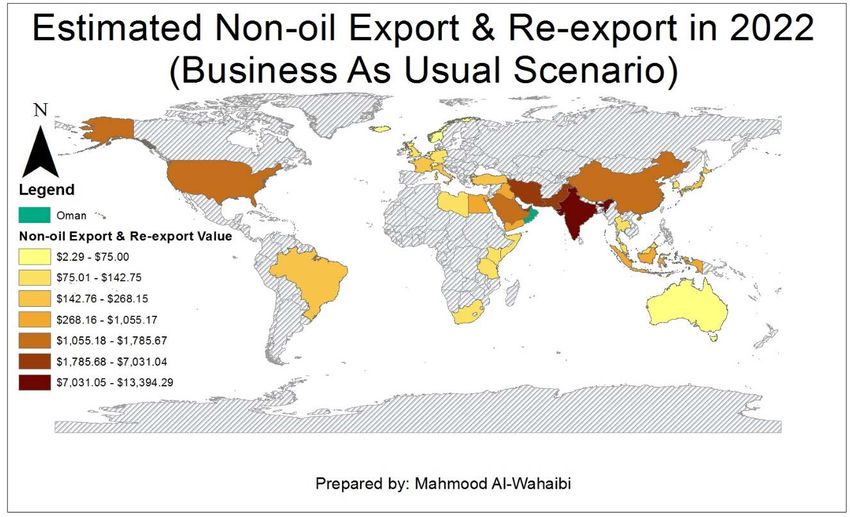
Mahmood Al-Wahaibi 5/10/3018

 10- Oman-US-Brazil-Turkey
Brazil, United States and Turkey represent growing potential market for Omani exports and re-
exports. Especially Brazil with untapped potential with growing economy and increasing
population.

 Table 12. Potential Trade with USA, Turkey, and Brazil

 United States (P/A) Potential Trade
 Unites States 1.14 Potential Trade
 Turkey (P/A) Potential Trade
 Turkey 3.70 Potential Trade
 Brazil (P/A) Potential Trade
 Brazil 20.00 Potential Trade

Forecasting the Future
After analyzing the findings of our augmented gravity model for the period of 2006 to 2016, the
coefficients of the regression model utilized to predict export & and re-export value from 2017
to 2022. For the forecast, we have used IMF and World Bank forecast data for GDP and
population for Oman and the 35 trading partners in our sample. In this section, will be
examining three possible scenarios that may positively or negatively impact the export & re-
export activities of the country.
 1- Business As Usual Scenario

 Map 2. Estimating Non-oil Export & Re-export (Business As Usual Scenario)

 Source. (ArcGIS & Our Model Estimations)
 20
Mahmood Al-Wahaibi 5/10/3018

Business As Usual Scenario assumes that Oman will maintain exact same foreign policies with
all the 35 trading partners without any further economic agreements up to 2022. In addition, this
scenario echoes the optimistic outlook of the World Bank and the IMF for the recovery of the
world economy and having almost all 35 trading partners on growth mode (refer to Appendix 3
for more details). For instance, non-oil export & re-export value to United States is going to
bounce back to growth mode after 2017 and continues on the same trajectory to reach 1.8 billion
dollars by 2022.
 Graph 9. Non-oil Export & Re-export to USA up to 2022

 Export & Re-exports to USA (USD Million)
 2000.00
 1800.00
 1600.00
 1400.00
 USD Million

 1200.00
 1000.00
 800.00
 600.00
 400.00
 200.00
 0.00

 Year

 Source. (2006 to 2016-https://data.worldbank.org/ & 2017 to 2022- our model estimation)

It is important to mention that non-oil export & re-export to the United Arab Emirates is
predicted to recover after 2017 on a slower pace than 2006 to 2016. Our model predicts that the
value of export and re-export would hardly touch 4 billion dollars which less than peak growth in
2014 before the economic crisis by approximately 1.5 billion dollars.
Egypt, India, Brazil, Pakistan, Indonesia, and Iran represent the biggest potential growth for
Omani non-oil export and re-export. Our model shows that value of non-oil export and re-export
will exceed 1 billion dollars by 2021 with India and by 2022 with Egypt. Also, the model is
expecting Omani non-oil exports & re-exports to reach more than 600 million dollars with
Indonesia by 2022 and to reach over 170 million dollars with Brazil by 2022. More importantly,
non-oil export and re-export value with Iran and Pakistan is expected to surge to reach over
billion by 2020.

 21
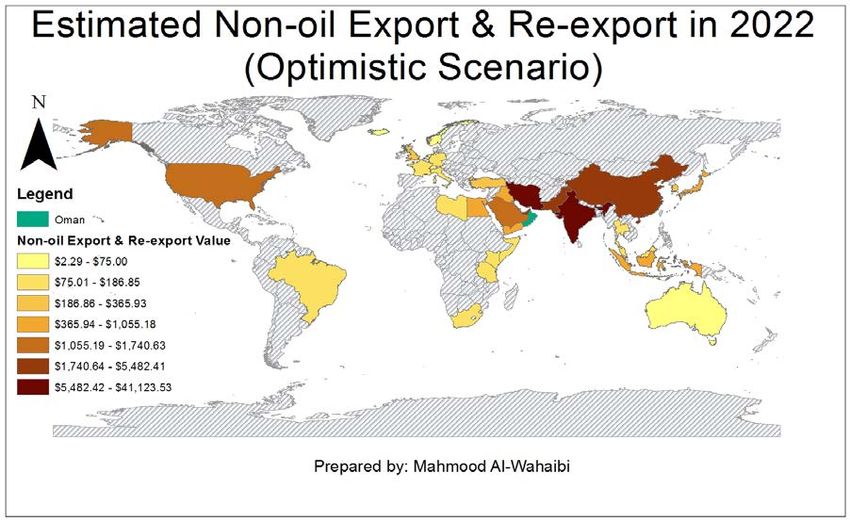
Mahmood Al-Wahaibi 5/10/3018

 Graph 10. Non-oil Export & Re-export to UAE up to 2022

 Export & Re-export to UAE (USD Million)
 6000

 5000

 4000
 USD Million

 3000

 2000

 1000

 0
 2006 2008 2010 2012 2014 2016 2018 2020 2022
 Year

 Source. (2006 to 2016-https://data.worldbank.org/ & 2017 to 2022- our model estimation)

 2- Optimistic Scenario

 Map 3. Estimating Non-oil Export & Re-export (Optimistic Scenario)

 Source. (ArcGIS & Our Model Estimations)

The Optimistic Scenario is based on the same economic outlook in the previous scenario, but
assumes reaching FTA agreements with China, South Korea, India, and japan at GCC level and

 22
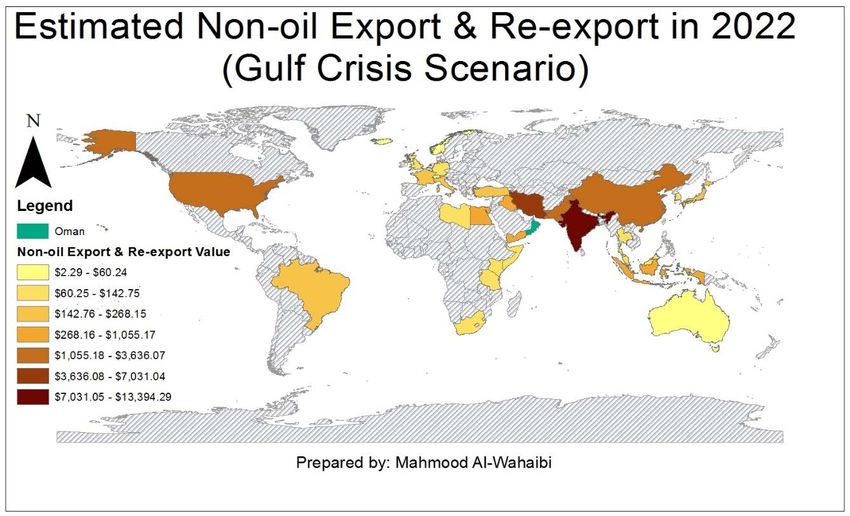
Mahmood Al-Wahaibi 5/10/3018

with Iran and the UK at bilateral level. These assumptions ae based on the ongoing negotiation
of these courtiers with the GCC’s directory general and Oman’s government in particular.
Our model shows that the non-oil export & re-export value jumps by 207% after signing FTA
agreements with these countries. For example, we assumed that South Korea is going to sign
FTA with the GCC in 2019 given the current initial negotiation of Korea with the Gulf States. As
shown in the graph below that export & re-export value to raise to 200 million dollars in 2020
compared 66 million dollars in Business As Usual Scenario.

 Graph 11. Non-oil Export & Re-export to South Korea after Signing FTA in 2019

 Non-oil Export & Re-export to South Korea
 (USD Million)
 300
 250
 USD Million

 200
 150
 100
 50
 0
 2017 2018 2019 2020 2021 2022
 Year

 Optimistic Scenario Business as Usual

 Source. (2006 to 2016-https://data.worldbank.org/ & 2017 to 2022- our model estimation)

Important to note that FTA with India and Iran will accelerate the already trading growing trade
volume exponentially.

 3- Gulf Crisis Scenario
The Gulf Crisis Scenario is based on the ongoing blockade of Qatar by Saudi Arabia, United
Arab Emirates and Bahrain accompanied by some other countries outside the Gulf region such as
Egypt and Maldives. We relied on news agencies, reputed strategic institutes, legal studies and
logistics operators such as the Maersk Line to evaluate the possible impact of such crisis on
Qatar’s trade flow and logistics sector. Therefore, Gulf Crisis Scenario assumes same impacts on
Oman in case of political dispute with other GCC member nations.
A report by Washington Institute for Near East Policy indicates that Qatar had to find new
trading routes mainly with Turkey and Oman as alternatives due to the blockade. The blockade
countries have closed their “boarder, air right and territorial waters to Qatari activities”
(Neubauer, S., 2017). Saudi Arabia and UAE cut all supplies of food products and Qatar had to
move its logistics hub from Jabal Ali Port in Dubai to Sohar in Oman. Also, securing trade route

 23
Mahmood Al-Wahaibi 5/10/3018

with Salalah Port to supply Qatar with all its import needs. The report signifies that the countries
involved in the embargo (Saudi Arabia, Bahrain and UAE) constitute 8% of total export of
Qatar. Patrick Murphy (2017) article in Lexology confirms that “the principal restrictions on
trade imposed by the UAE and other B4 states (Gulf States) so far have been focused on modes
of transport rather than underlying trade or transactions. Qatari flagged or owned vessels and
aircraft have been prevented from entering the territory of B4 states, and vessels travelling to and
from Qatar have been restricted from calling in ports in B4 state”( Murphy, P.,2017). This
includes the port of Fujairah (and its anchorage) which are major regional bunkering hubs.
Dubai’s Jebel Ali container terminal, the largest container terminal in the region, has similarly
restricted vessels loading or discharging cargo destined for or arriving from Qatar. The road
border between KSA and Qatar has also been closed. The exception to this is Egypt, which has
not restricted Qatari vessels from its territorial waters or the Suez Canal.
Furthermore, Maersk Line the world largest shipper confirmed that can no longer transport goods
in or out of Qatar after Arab countries imposed restrictions on trade with Qatar and the company
is looking at alternative shipping routes (Maersk Line, N.A.). A Maersk Line spokesman said
that "We have confirmation that we will not be able to move Qatar cargo in and out of Jebel Ali."

 Map 4. Estimating Non-oil Export & Re-export (Gulf Crisis Scenario)

 Source. (ArcGIS & Our Model Estimations)

By the Same token, if other Gulf States decide to impose a blockade on Oman as result of a
possible political dispute, we expect Oman to lose access to very important market for non-oil
export & re-export; especially United Arab Emirates and Saudi Arabia. The value of Omani
non-oil export & re-exports reached 6.4 billion dollars in 2017 which comprised 47% of Oman’s

 24
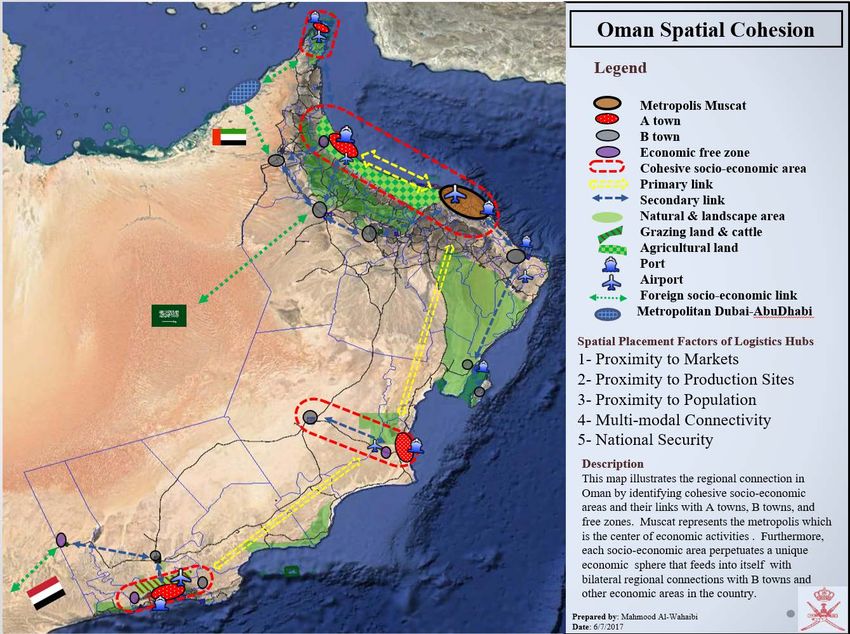
Mahmood Al-Wahaibi 5/10/3018

entire non-oil export & re-export in the same year. United Arab Emirates controlled 24% share
of all Omani non-oil export and 51% share of Omani non-oil export & re-exports to the GCC.

 Graph 12. Omani Non-oil Export & Re-export Value Distribution

 Non-oil Export & Re-export value in 2017
 16.00
 13.70
 14.00

 12.00

 10.00
 Billion USD

 8.00
 6.40
 6.00

 4.00 3.30

 2.00

 0.00
 world GCC UAE

 Source. (https://data.gov.om/OMFRTRD2016)

 Table 13. Non-oil Export & Re-export Share of the GCC and UAE
 Non-Oil Export and Re-export Share
 GCC Share Compared to The World 47%
. UAE Share Compared to The World 24%
 UAE Share Compared to the GCC 51%

Logistics Hubs and Spatial Placement
In this section, we are going to look closer at the major ports or logistics hubs in Oman and use
our findings as way to explain the placement of these ports in relation to several factors. What
we learned from our analysis that Population, Distance, and economic size are very important
components in the gravity model to explain the competitive advantage of a particular region and
its gravitational pull in term of economic activities. In addition, economic theories emphasize the
importance of space in a geographical sense to maximize economic activities. Space or location
influences the way an economic system works. “It is a source of economic advantages (or
disadvantages) such as high (or low) endowments of production factors. It also generates
geographical advantages, like the easy (or difficult) accessibility of an area, and a high (or low)
endowment of raw materials. Space is also the source of advantages springing from the
cumulative nature of productive processes in space: in particular, spatial proximity generates

 25
Mahmood Al-Wahaibi 5/10/3018

economies that reduce production costs” (Capello, R., 2011). Therefore, five factors has been
identified to explain the spatial placement of logistics hubs in Oman.

 Map 5. Oman Spatial Cohesion & Logistics Placement

 Source. (Supreme Council for Planning & Googler Earth Pro)

 1- Proximity to Major Markets
Our augmented gravity model clearly demonstrates the negative impact of distance on non-oil
export & re-export value. The farther the economic partners are, the less expected trade flow due
to the fact that distance serves as proxy for cost and time in our model. Therefore, Omani ports
should capitalize on their location in relation to Major markets that are spatially closer to them to
lower their cost of shipping and time traveled. For example, Sohar Port and Salalah Port are
more than 1200 kilometers apart and both can focus their export & re-export activities on regions
that are spatially closer to them. So, Based on our regional grouping Sohar Port can potentially
focus on GCC, SAARC, East Asia, and IORA markets, while Salalah Port can potentially focus
on EFTA, GAFTA, East Africa, Europe, and in addition to United States and Brazil. This
market segmentation may help reduce the identified “internal destructive competition” between
ports and help the operators to package cheaper services to compete regionally and
internationally (Enhancing Competitiveness of Omani Ports report, 2014).
 26
Mahmood Al-Wahaibi 5/10/3018

 2- Proximity to Production Sites
Port of Sohar is located in Sohar Free Zone that has attracted huge government and international
investments in heavy industries, manufacturing, and petrochemical industries with access to
natural gas and crude oil pipelines. This gives Sohar port a comparative advantage over Salalah
Port to be the premier port of the country in export & re-export activities. On the other hand,
Salalah Port is located strategically at the mouth of the Red Sea to be a transshipment hub, but
the lack of investment in Slalah Freezone area is not helping the port to reach its potential to be
an export gateway for the southern region of the Oman given the close proximity to natural
resources such as minerals and oil.
 3- Proximity to Population (Agglomeration Economy)
As defined by Edward L. Glaeser in a published volume from the National Bureau of Economic
Research in 2007 that “agglomeration economies are the benefits that come when firms and
people locate near one another together in cities and industrial clusters.” Ironically, the
connection between agglomeration economies and transport costs would seem to suggest that
agglomerations should become less important, as transportation and communication costs have
fallen. Yet, “a central paradox of our time is that in cities, industrial agglomerations remain
remarkably vital, despite ever easier movement of goods and knowledge across space” (Glaeser,
E. L., 2007). Therefore, Sohar Port has the advantage of being closer to lager population base in
the northern region than Salalah port in the southern region where they have less population
density.
As shown in Oman Spatial Cohesion Map above, the cohesive socio-economic area represents
the agglomeration economy of Oman where population and economic activities are concentrated.
While Salalah Port is located in class A town with fewer regional connections to population
centers in the country and the region.

 4- Multi-Modal Connectivity
The importance of multi-modal connectivity for the logistics sector in Oman has been already
established in SOLS2040 masterplan, The Multi Modal Law & Policies draft, and Enhancing
Competitiveness of Omani Ports report by the Ministry of Transportation and Communication.
All these studies indicate that the availability of smoother multi-modal connectivity with
logistics hubs will increase their efficiency in cost and handling time. Especially, railway
connection is seen as an economical method in freight movement to and out of ports in most
countries around the world including, Port of Rotterdam and Port of Los Angles. Meifeng Luo
(2003) believes that “because of the increasing importance of multimodal transportation, the
traditional method for port demand estimation using hinterland delimitation is no longer valid for
container port demand estimation. Ports will serve not only markets in their vicinity, but also
compete for markets in areas far from the port, through use of high-speed, low-cost rail
connections” (Luo, M., 2003).

 27
You can also read


