High-Quality Genome-Scale Models From Error-Prone, Long-Read Assemblies - Frontiers
←
→
Page content transcription
If your browser does not render page correctly, please read the page content below
ORIGINAL RESEARCH
                                                                                                                                         published: 12 November 2020
                                                                                                                                       doi: 10.3389/fmicb.2020.596626

                                             High-Quality Genome-Scale Models
                                             From Error-Prone, Long-Read
                                             Assemblies
                                             Jared T. Broddrick 1* † , Richard Szubin 2 , Charles J. Norsigian 2 , Jonathan M. Monk 2 ,
                                             Bernhard O. Palsson 2 and Mary N. Parenteau 1
                                             1
                                              Exobiology Branch, Space Science and Astrobiology Division, NASA Ames Research Center, Moffett Field, CA,
                                             United States, 2 Department of Bioengineering, University of California, San Diego, La Jolla, CA, United States

                                             Advances in nanopore-based sequencing techniques have enabled rapid
                         Edited by:
           Christopher Scott Henry,          characterization of genomes and transcriptomes. An emerging application of this
  Argonne National Laboratory (DOE),         sequencing technology is point-of-care characterization of pathogenic bacteria.
                       United States
                                             However, genome assessments alone are unable to provide a complete understanding
                      Reviewed by:
                    Daniel Machado,
                                             of the pathogenic phenotype. Genome-scale metabolic reconstruction and analysis is
        European Molecular Biology           a bottom-up Systems Biology technique that has elucidated the phenotypic nuances
      Laboratory (EMBL) Heidelberg,
                                             of antimicrobial resistant (AMR) bacteria and other human pathogens. Combining these
                            Germany
                  Eduard Kerkhoven,          genome-scale models (GEMs) with point-of-care nanopore sequencing is a promising
   Chalmers University of Technology,        strategy for combating the emerging health challenge of AMR pathogens. However,
                             Sweden
                                             the sequencing errors inherent to the nanopore technique may negatively affect the
                   *Correspondence:
                     Jared T. Broddrick
                                             quality, and therefore the utility, of GEMs reconstructed from nanopore assemblies. Here
           jared.t.broddrick@nasa.gov        we describe and validate a workflow for rapid construction of GEMs from nanopore
                  † Present
                          address:           (MinION) derived assemblies. Benchmarking the pipeline against a high-quality reference
                Jared T. Broddrick,
                                             GEM of Escherichia coli K−12 resulted in nanopore-derived models that were >99%
Space Bioscience Research Branch,
  Space Biosciences Division, NASA           complete even at sequencing depths of less than 10× coverage. Applying the pipeline
Ames Research Center, Moffett Field,         to clinical isolates of pathogenic bacteria resulted in strain-specific GEMs that identified
                 CA, United States
                                             canonical AMR genome content and enabled simulations of strain-specific microbial
                   Specialty section:        growth. Additionally, we show that treating the sequencing run as a mock metagenome
         This article was submitted to       did not degrade the quality of models derived from metagenome assemblies. Taken
               Systems Microbiology,
               a section of the journal
                                             together, this study demonstrates that combining nanopore sequencing with GEM
             Frontiers in Microbiology       construction pipelines enables rapid, in situ characterization of microbial metabolism.
         Received: 19 August 2020
                                             Keywords: antimicrobial resistance (AMR), metabolic model reconstruction, constraint-based model, nanopore
        Accepted: 19 October 2020
                                             sequencing, MinION nanopore device R , MinION long-read sequencing
      Published: 12 November 2020
                             Citation:
              Broddrick JT, Szubin R,       INTRODUCTION
 Norsigian CJ, Monk JM, Palsson BO
            and Parenteau MN (2020)
                                            Recent advancements in sequencing technologies have opened up the possibility of in situ analysis
 High-Quality Genome-Scale Models
        From Error-Prone, Long-Read
                                            of genomes and transcriptomes. In particular, the nanopore MinION sequencer (Oxford Nanopore
                          Assemblies.       Technologies, Oxford, United Kingdom) has emerged as a promising technology in this application
         Front. Microbiol. 11:596626.       space. The small size and computational footprint required to run the device (Lu et al., 2016)
    doi: 10.3389/fmicb.2020.596626          has enabled its use in human health settings, such as the detection of biothreat pathogens

Frontiers in Microbiology | www.frontiersin.org                                     1                                      November 2020 | Volume 11 | Article 596626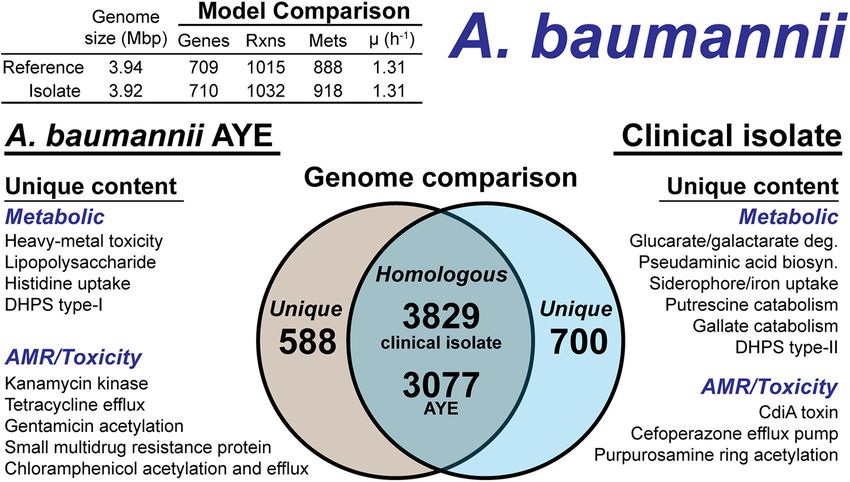
Broddrick et al.                                                                                                        Metabolic Models From MinION

(Gargis et al., 2019), and in extreme environments such as                evolutionary trajectories (Zampieri et al., 2017). As genome-scale
Antarctica (Johnson et al., 2017) and the International Space             metabolic reconstructions are based on an annotated genome,
Station (Castro-Wallace et al., 2017). The platform generates             combining point-of-care sequencing with rapid metabolic model
relatively long sequencing reads enabling the assembly of                 construction would augment existing genome-only assessments.
genomes at low coverage depth (Wick and Holt, 2019). This                 However, it is unknown whether MinION assembly accuracy is
reduces the computational resources required to assemble                  sufficient for constructing high-quality genome-scale models.
genomes from nanopore reads, facilitating bioinformatic
pipelines that can be run on a personal laptop (Castro-Wallace
et al., 2017). However, despite advances in reagent chemistry,            MATERIALS AND METHODS
flowcell design and computational basecalling algorithms, the
                                                                          Additional methods detail and example code can be found in the
technology suffers from lower consensus genome accuracy
                                                                          Supplementary Material.
compared with short-read sequencing techniques, especially
in homopolymer regions (Gargis et al., 2019). Computational
techniques exist to correct the frame-shift mutations that
                                                                          Assembly and Reconstruction Pipeline
arise from these sequencing errors (Arumugam et al., 2019);
                                                                          Read Filtering and Adapter Trimming
however, resource intensive techniques may not be accessible              Details on MinION sequencing and basecalling are captured
in austere locales where the MinION device’s portability is a             in the sample specific sections below. Basecalled reads in Fast5
unique capability.                                                        format were concatenated into a single file using the command
   Point-of-care, rapid characterization of pathogenic bacteria           line. Multiplexed samples were separated by their respective
is a promising in situ application of these technologies and              barcodes using qcat1 . Reads shorter than 1,000 bp (by default)
techniques (van Belkum and Rochas, 2018; Monk, 2019). In                  were removed using Nanofilt (De Coster et al., 2018) and adapters
standard hospital laboratories, short-read (Raven et al., 2019)           were trimmed using Porechop2 with the –no_split argument, as
and hybrid assembly (Hikichi et al., 2019) based methods                  implemented in the ONT bioinformatics package Pomoxis3 .
successfully assessed methicillin-resistance in Staphylococcus            Metagenome Size Determination
aureus (hereafter S. aureus). Additionally, the nanopore                  The filtered and trimmed reads were assembled using miniasm
sequencing technology rapidly profiled antimicrobial resistant            (Li, 2016) as implemented in Pomoxis with one round of
(AMR) pathogens in a clinical setting along with characterization         Racon (Vaser et al., 2017) polishing to create a consensus
of patient microbiota (Leggett et al., 2020). However, a critique         sequence. This low quality assembly was parsed with SeqIO
of genome-based approaches is their inability to elucidate                in the Biopython package (Cock et al., 2009) and the total
an understanding of the pathogenic phenotype (Hendriksen                  genome/metagenome size was determined to be the sum of all
et al., 2019). Recent developments in genome-scale metabolic              sequences larger than 100 kbp.
modeling of pathogenic bacteria have shown promise in filling
this gap between genotype and phenotype.                                  Genome Assembly
   Genome-scale metabolic reconstruction is an emerging tool              The reads were assembled using Flye [v2.6, (Kolmogorov et al.,
in the characterization and analysis of bacterial virulence and           2019)]. The genome size parameter was determined above and
antibiotic resistance. These reconstructions are biochemical              the minimum overlap was set to 1,500 bp and the –plasmids
knowledge bases built from the annotated metabolic content                argument was used. Additionally, for metagenomes, the –meta
encoded in the organism’s genome. When parameterized with                 argument was included. For certain analyses the –asm_coverage
constraints, these reconstructions become genome-scale models             argument was used and set to 70×. The resulting assembly was
(GEMs) that simulate the organism’s phenotype under a given               parsed and the total size was determined by summing all contigs
set of environmental conditions (O’Brien et al., 2015). To                with 10× or greater coverage. If the initial and final genome size
date, genome-scale reconstructions have been built for a wide             parameters differed by a factor of 2 the assembly was repeated
range of pathogenic bacteria to include Escherichia coli (Monk            with the new genome size value.
et al., 2013), multiple strains of Salmonella (Seif et al., 2018),
Acinetobacter baumannii (Norsigian et al., 2018), S. aureus (Seif         Genome Polishing
et al., 2019), Klebsiella pneumoniae (Norsigian et al., 2019),            The draft assembly from Flye was polished with two rounds of
and Streptococcus oralis (Jensen et al., 2020), among others.             Racon after mapping the reads to the assembly using minimap2
While the direct simulation of AMR mechanisms in these                    (Li, 2016). The Racon polished assembly was polished with ONT’s
models is still in its infancy, the GEMs resulting from these             Medaka consensus polishing tool (v0.94 ).
reconstructions elucidated differential metabolic capabilities that
                                                                          Contig Binning
provide a window into the phenotype of these pathogens
                                                                          Contigs that were assessed to be circular based on the Flye
beyond the simple presence-absence of AMR conferring genome
                                                                          assembler were separated from the linear contigs, as were contigs
content. For example, alternate nitrogen resource utilization
in Klebsiella pneumoniae was used to classify strains by                  1
                                                                            https://github.com/nanoporetech/qcat
antibiotic resistance (Norsigian et al., 2019). Additionally, there       2
                                                                            https://github.com/rrwick/Porechop
is a growing consensus that bacterial metabolism represents               3
                                                                            https://github.com/nanoporetech/pomoxis
fundamental constraints in the ability of bacteria to develop AMR         4
                                                                            https://github.com/nanoporetech/medaka

Frontiers in Microbiology | www.frontiersin.org                       2                                     November 2020 | Volume 11 | Article 596626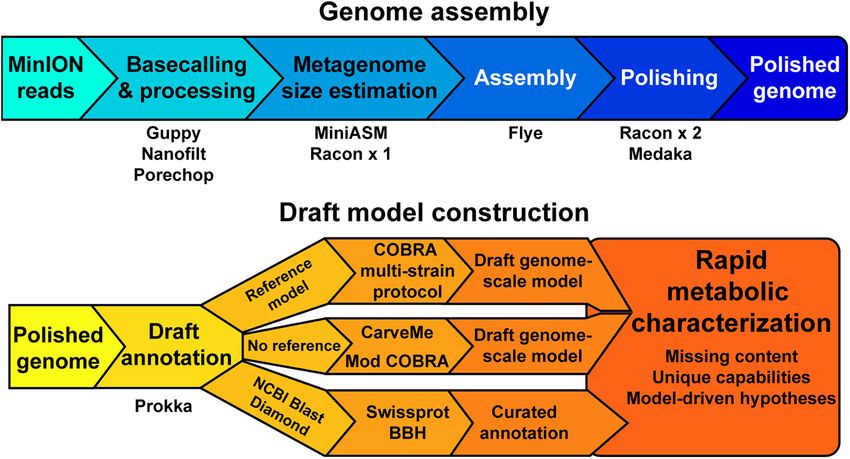
Broddrick et al.                                                                                                        Metabolic Models From MinION

with less than 10× coverage. Linear contigs with GC content that        centrifuged to pellet the DNA and the ethanol was removed
different by less than 5%, determined by SeqIO, and coverage that       with a pipette. The pellet was air dried for several minutes and
differed by less than 15%, based on the Flye output, were grouped       resuspended in nuclease-free water. A Nanodrop was used to
into a single folder for subsequent analysis.                           assess the quality of the genomic DNA prep, Qubit BR assay to
                                                                        check the concentration and Agilent TapeStation to check the
Draft Genome-Scale Models Construction                                  size distribution.
All contigs were annotated with Prokka [v1.13 (Seemann, 2014)].
Draft genome-scale models were built by either taking the               MinION Sequencing
Genbank file output from Prokka as an input into a reference-           Native BOP27 genomic DNA (gDNA) was sequenced on
based model building protocol (Norsigian et al., 2020b) or the          a MinION R9.4 flowcell [Oxford Nanopore (ONT)]. The
protein sequences output from Prokka in Fasta format as an              sequencing library was prepared using the ONT Rapid Barcoding
input into CarveMe (Machado et al., 2018). Content that was not         Sequencing kit (SQK-RBK004) according to the manufacturer’s
included in the draft metabolic reconstructions was annotated by        protocol with the following modifications: to two separate 0.2 mL
homology-based search using either the NCBI Blast search tools          PCR tubes, 1 and 0.5 µg gDNA, were diluted to 9 µL in
(Camacho et al., 2009) or DIAMOND search (Buchfink et al.,              ONT EB (10 mM Tris, 50 mM NaCl, pH 8.0). The barcoded
2015) against the Swissprot database downloaded from Uniprot            fragmentation mix was added in a ratio of 3:1 and 1:1 (µg gDNA:
[Downloaded: 2020/03/22, (The UniProt Consortium, 2019)].               µL fragmentation mix) to the 1 and 0.5 µg samples, respectively.
                                                                        Half the library (∼0.75 µg) was loaded onto the MinION flowcell
Split ORF Recovery                                                      without loading beads. ONT EB was used to bring the total
Open reading frames that were split into multiple fragments due         library volume to 75 µL prior to loading. Sequencing was
to sequencing errors were recovered by generating bidirectional         performed for 6 h on a flowcell with approximately 700 active
(reciprocal) best-hit mappings between the protein sequences            pores. Sequencing Fast5 files were basecalled using the ONT
from Prokka and the Swissprot database. Adjacent genes with the         Guppy basecaller (v3.2.2) with GPU acceleration on a laptop
same Swissprot best-hit were combined into a single amino acid          with an Intel i7-6550U processor and 8 GB RAM connected
sequence and output to a new file in the Fasta format. This new         to an external GPU housing with an Nvidia GTX1070 (1920
file was used in the reference-dependent protocol above.                CUDA cores, 8 GB VRAM) via a Thunderbolt 3 connection.
                                                                        Quality filtering was enabled with default settings using high
Escherichia coli K−12 str. BOP27                                        accuracy, high accuracy with base pair modification, and fast base
Validation Experiments                                                  calling algorithms. Basecalled reads were demultiplexed with qcat
Culturing                                                               (v1.1.05 ) prior to assembly.
Escherichia coli K−12 strain BOP27 from a frozen glycerol stock
                                                                        Assembly and Annotation
was first streaked on an LB agar plate and grown overnight at
                                                                        The pipeline above was used to generate draft assemblies and
37◦ C. Several mL of LB media was inoculated with a single colony
                                                                        annotations for high accuracy, high accuracy with base pair
and grown to late exponential phase.
                                                                        modification, and fast basecalling methods. Subsets of reads at
DNA Extraction                                                          15, 20, 40, and 100× coverage (before size filtering and adapter
The cells were pelleted by centrifugation and resuspended in            trimming) at N50 values of 20 and 10 k, were generated by
500 µL SETS buffer (75 mM NaCl, 25 mM EDTA pH 8, 20 mM                  randomly subsampling the total dataset (approximately 320×
Tris-HCl pH 7.5, 25% Sucrose). 5 µL RNaseA and 10 µL                    coverage). Additionally, a “worst-case” subset was generated by
lysozyme were then added and the sample was incubated at                taking the 15× subset and removing all reads larger than 15 kbp.
37◦ C for 60 min. 14 µL proteinase K and 30 µL 20% SDS were             Overall accuracy of the BOP27 strain assembly versus the E. coli
added, the sample was mixed gently by inversion and incubated           strain K12 substrain MG1655 reference was determined using
at 55◦ C for 2 h inverting occasionally. 200 µL 5 M NaCl was            the assess assembly function in Pomoxis6 . Single nucleotide
added and the sample mixed thoroughly by gentle inversion.              polymorphisms (SNPs) and InDels were determined using the
500 µL chloroform was then added and the sample mixed by                dnadiff functions within MUMmer (Kurtz et al., 2004). The
gentle inversion for 30 min at room temperature. Following              NanoFilt parameters were set to remove reads shorter than 2,000
centrifugation for 15 min at 4,500 × g at room temperature              base pairs prior to adapter and barcode trimming by Porechop.
the upper aqueous phase was transferred to new 1.5 mL tube              All assemblies were generated on a laptop computer equipped
and another round of chloroform extraction was performed. The           with an Intel i7-8650U processor and 16 GB of RAM.
upper aqueous phase was transferred to new 1.5 mL tube. The             Draft Model Construction
volume was measured and 1/10 that volume of 3 M sodium                  The pipeline above was used to generate draft genome
acetate was added to the sample. DNA was precipitated with 0.7          scale metabolic reconstructions (GEM). The most recent
volumes of isopropanol and the sample was placed on a slow              E. coli strain K12 substrain MG1655 GEM, iML1515 (Monk
rocker for 5 min. The filamentous genomic DNA precipitate was           et al., 2017) was used as the reference model and reference
fished out with a Pasteur pipette, formed into a hook and sealed
with a flame, and transferred to a series of 3 microcentrifuge          5
                                                                            https://github.com/nanoporetech/qcat
tubes containing 1 mL 70% ethanol each. The final tube was              6
                                                                            https://github.com/nanoporetech/pomoxis

Frontiers in Microbiology | www.frontiersin.org                     3                                       November 2020 | Volume 11 | Article 596626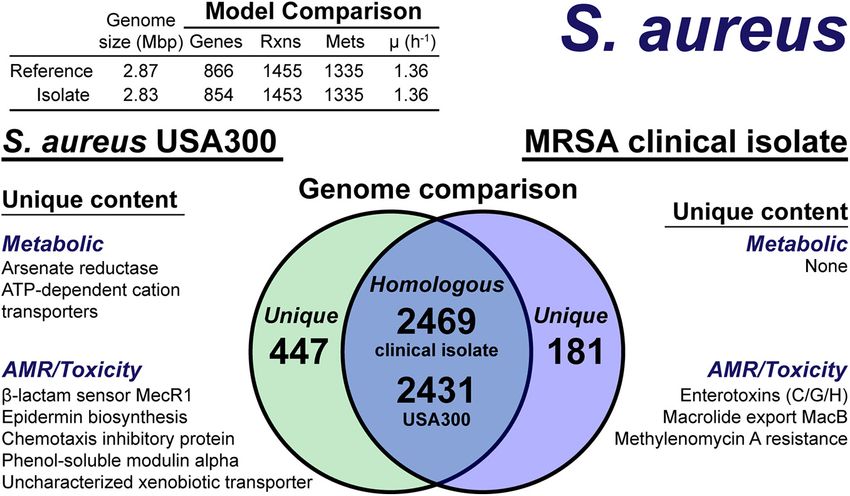
Broddrick et al. Metabolic Models From MinION
genome (NCBI Reference Sequence: NC_000913.3). The Swissprot database using DIAMOND. These annotations were
Swissprot database downloaded from Uniprot [(The UniProt manually curated for metabolic content, the putative biochemical
Consortium, 2019), downloaded: March 22, 2020] was used reaction catalyzed determined from online databases [BiGG
as the reference database and DIAMOND (Buchfink et al., (Norsigian et al., 2020c) and KEGG (Kanehisa and Goto, 2000;
2015) was used to create the bidirectional best hit list. Model Kanehisa et al., 2019)], and the reaction manually coded into the
construction and simulation were performed in the Python draft metabolic reconstruction to create complete, curated GEMs.
programming language with COBRApy (Ebrahim et al., Draft metabolic reconstructions for the E. faecium
2013) using the default GLPK solver in Jupyter Notebooks clinical isolate were generated using a modified version of
(Kluyver et al., 2016). the multi-strain reconstruction pipeline described above
(Supplementary Material) and the following reference genome-
Assembly and Reconstruction of scale reconstructions: Lactococcus lactis subsp. cremoris
Pathogenic Bacteria MG1363, iNF516 (Flahaut et al., 2013), E. coli strain K12
Culturing Methods substrain MG1655, iML1515 (Monk et al., 2017), Bacillus
subtilis strain 168, iYO844 (Oh et al., 2007), and S. aureus strain
Clinical isolates of S. aureus, Acinetobacter baumannii (hereafter:
USA300 substrain TCH1516, iYS854 (Seif et al., 2019). A draft
A. baumannii) and Enterococcus faecium (hereafter: E. faecium)
reconstruction was also generated using CarveMe (Machado
were cultured in the same manner as described above for
et al., 2018) using the default settings. Model simulations and
E. coli. DNA extraction leveraged the same protocol as that
reconstruction were performed in the Python programming
for E. coli above with the exception that lysostaphin was used
language with COBRApy (Ebrahim et al., 2013) using the default
instead of lysozyme.
GLPK solver in Jupyter Notebooks (Kluyver et al., 2016).
MinION Sequencing
Native genomic DNA (gDNA) was sequenced on a MinION Mock Metagenome Assembly
R9.4 flowcell [Oxford Nanopore (ONT)]. The sequencing library The metagenome was assembled following the pipeline without
was prepared using the ONT Rapid Barcoding Sequencing kit demultiplexing the barcoded reads prior to assembly. Bin
(SQK-RBK004) according to the manufacturer’s protocol with contamination was manually determined by homology search of
the following modification: the gDNA input was increased to proteins annotated in each bin contig using NCBI Basic Local
800 ng genomic DNA and the optional SPRI bead cleanup was Alignment Search Tool [BLAST (Camacho et al., 2009)] against
omitted. The run was allowed to proceed for approximately 6 h. the non-redundant database.
Assembly and Annotation Phylogenomic Analysis
The pipeline above was used to generate draft assemblies and Phylogenomic analysis was performed using GToTree (Lee,
annotations for high accuracy (HAC) and high accuracy with 2019) and the tools included therein (Edgar, 2004; Capella-
base pair modification (HAC+mod) basecalling methods. The Gutiérrez et al., 2009; Hyatt et al., 2010; Price et al., 2010; Eddy,
NanoFilt parameters were set to remove reads shorter than 1,000 2011; Tange, 2018; Shen and Xiong, 2019). Phylogenomic analysis
base pairs prior to adapter and barcode trimming by Porechop. of the clinical isolates with other strains of the species was
Flye was set to a minimum overlap of 1,500 bp and the – performed by taking the Prokka protein sequence FASTA file
plasmid option was enabled. All assemblies were generated on and comparing it to all Refseq assemblies for that species in the
a laptop computer equipped with an Intel i7-8650U processor NCBI genome database. For placing the clinical isolates in the
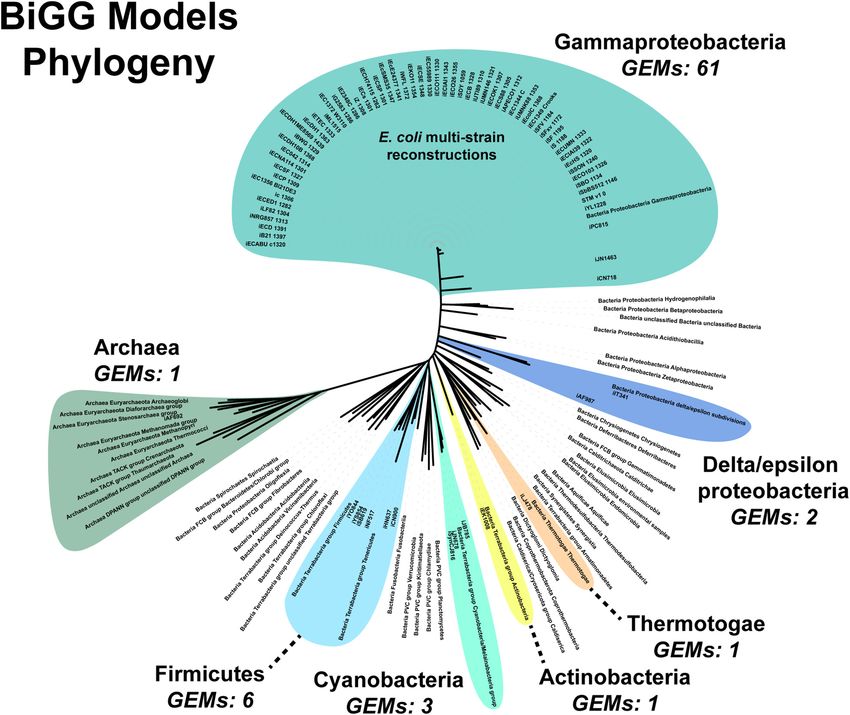
and 16 GB of RAM. BiGG Models Database phylogeny, the database was parsed for
the NCBI accession number used to reconstruct each GEM, the
Draft Model Construction genomes were downloaded from NCBI and used for analysis.
The pipeline above was used to generate draft genome scale To place the BiGG models into a microbial tree of life, a table
metabolic reconstructions (GEM) from the draft genomes of of all representative, complete archea and bacteria genomes was
the clinical isolates. For S. aureus, the most recent GEM of downloaded from the NCBI genome browser (approximately
strain USA300 substrain TCH1516, iYS854 (Seif et al., 2019), 3,200 genomes). From this list, a single representative from each
was used as the reference model and reference genome (NCBI phylum was selected (54 genomes) and the genbank file passed
Reference Sequence: NC_010079.1). For A. baumannii, the most to GToTree for analysis. All phylogenomic trees were visualized
recent GEM of strain AYE, iCN718 (Norsigian et al., 2018), using the Interactive Tree of Life web-based tool (Letunic and
was used as the reference model and reference genome (NCBI Bork, 2019). A list of NCBI accession numbers used can be found
Reference Sequence: NC_010410.1). The Swissprot database in the Supplementary Material.
downloaded from Uniprot [(The UniProt Consortium, 2019),
downloaded: March 22, 2020] was used as the reference database
and DIAMOND (Buchfink et al., 2015) was used to create the RESULTS
bidirectional best hit list. Unique genome content was defined as
putative open reading frames that did not map to the reference Assembly and Reconstruction Pipeline
genome (percent ID cutoff of 80% and e-value cutoff of e-10). Our objective was to assess the quality of genome-scale metabolic
These proteins were annotated by homology search against the network reconstructions resulting from MinION-based
Frontiers in Microbiology | www.frontiersin.org 4 November 2020 | Volume 11 | Article 596626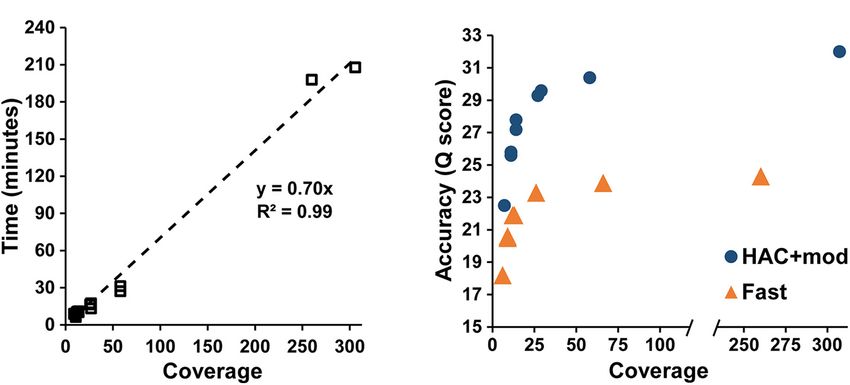
Broddrick et al.                                                                                                             Metabolic Models From MinION

assemblies. The assembly and draft reconstruction pipeline                         and it leverages a different name-space for reactions and
was designed to rapidly take extracted gDNA to a contextual                        metabolites, making model comparison difficult.
framework for characterizing microbial metabolism (Figure 1).
We leveraged existing studies that compare long-read assemblers                    Pipeline Validation With E. coli K−12
to develop our assembly pipeline (Wick and Holt, 2019).                            We assessed the ability of MinION sequencing and our pipeline
The Flye assembler (Kolmogorov et al., 2019) showed the                            to recapitulate the well-curated E. coli strain K−12 substrain
best balance of speed and accuracy and was used for all our                        MG1655 genome-scale model iML1515 (Monk et al., 2017).
assemblies. Flye requires an approximation of genome or                            A primary objective of this study was to optimize the trade-off
metagenome size. Thus, we used a rapid, but inaccurate,                            in time versus accuracy; thus, we explored multiple basecalling
assembly method [miniasm, (Li, 2016)] to approximate the                           strategies for the raw reads. CPU basecalling was prohibitively
genome size prior to assembly by Flye. This step can be bypassed                   slow (on the order of days to weeks); thus, we only present GPU
if the approximate genome size is known. We polished the Flye                      accelerated basecalling results, which was 100-times faster. The
assembly with multiple rounds of Racon (Vaser et al., 2017)                        MinION generated approximately 200 k reads, 83% of which
before running the assembly polisher, Medaka, as recommended                       passed the Q score quality threshold for all basecaller methods;
by ONT. We attempted to use existing binning tools for our                         however, this 83% of the reads constituted 94% of the base
metagenomes [BinSanity (Graham et al., 2017)]; however, these                      pairs sequenced. The coverage depth for the E. coli genome
programs required computational resources in excess of a typical                   varied depending on the basecalling method; the high accuracy
laptop. As our pipeline is designed to be used in austere field                    algorithm (both with and without methylation calling) resulted
conditions, we implemented a simple binning strategy based                         in ∼307× coverage while the fast method resulted in only 260×
on coverage and contig GC content. This approach requires                          coverage. The N50/N90 values were approximately 21/6 kbp
manual curation of the binned contigs prior to annotation                          for all methods. The high-accuracy basecalling model required
and model building.                                                                177 min while the fast method required 53 min (Table 1).
    We employed reference-dependent and independent                                    We compared the polished genomes with varying rounds of
strategies for generating draft metabolic reconstructions. We                      Racon combined with Medaka (Table 2). Overall, miniasm with
adapted a recently published protocol for building multi-strain                    one round of Racon was similar in accuracy to the Flye assembly
metabolic reconstructions based on a reference model (Norsigian                    with no additional polishing steps, although Flye alone resulted in
et al., 2020b). The input for this protocol requires a file in the                 a sixfold reduction in SNPs, likely due to Flye’s built in polishing
NCBI Genbank format. The annotation tool Prokka includes a                         step. Polishing the Flye assembly with Medaka increased the
Genbank formatted output appropriate for this pipeline input.                      accuracy of the assembly compared to Flye alone. Two rounds
For organisms without a reference model of a closely related                       of Racon were necessary and sufficient to maximize assembly
strain or species, we used CarveMe (Machado et al., 2018), a tool                  accuracy (Table 2).
that uses the entire BiGG Models database (King et al., 2016)                          We assessed the time versus accuracy tradeoff for three
and homology search to generate a draft genome-scale network                       different basecalling models. The Guppy basecalling program
reconstruction. An additional automated reconstruction tool,                       can leverage a Fast algorithm as well as two high-accuracy
modelSEED (Henry et al., 2010), is available but was not used as it                (HAC) algorithms; one of which accounts for methylation of
performs similar or worse than CarveME (Machado et al., 2018)                      A and C nucleotides (HAC+mod). As previously mentioned,

  FIGURE 1 | A schematic of the genome assembly and model construction pipeline used in this study.

Frontiers in Microbiology | www.frontiersin.org                                5                                 November 2020 | Volume 11 | Article 596626
Broddrick et al. Metabolic Models From MinION
TABLE 1 | Summary of assembly statistics for E. coli strain K12 substr. BOP27.
Basecaller Coverage Read N50 Genome Contigs Q score SNPs InDels Basecalling Assembly
(bp) size (Mbp) time (min) time (min)
HAC+ 307× 22k 4.640 1 32.0 21 598 177 207
HAC− 306× 22k 4.639 1 27.3 4452 901 176 207
Fast 260× 22k 4.638 1 24.3 10621 4316 53 197
TABLE 2 | Assembly quality for E. coli strain K12 substr. BOP27 at different steps score of 30.4 compared to 32.0 for the highest coverage
in the pipeline for reads basecalled with the high accuracy algorithm with
dataset (Figure 2B).
methylation calling enabled.
The Fast algorithm also resulted in single, circular contigs
Genome size (Mbp) Q-score SNPs InDels for most datasets. The exceptions were the worse-case scenario
(6× coverage with all reads longer than 15 kbp removed), which
MiniASM_R1 4.636 25.6 470 9279
resulted in 24 contigs, and a dataset with 9× coverage and an N50
Flye 4.649 25.3 76 10482
of 22k, which resulted in 2 contigs. Similar to the HAC+mod
Flye + Medaka 4.641 30.7 27 1660
algorithm, assembly accuracy increased non-linearly with a Q
Flye + R1 + M 4.639 30.9 32 654
score of 23.9 at 66× coverage versus 24.3 at 260× (Figure 2B).
Flye + R2 + M 4.640 32.0 21 598
For both algorithms, decreases in both SNPs and InDels followed
Flye + R4 + M 4.640 32.0 25 596
the same non-linear trend (Supplementary Figures 1A,B). Based
R#, Racon rounds; M, Medaka; SNP, single nucleotide polymorphism; InDel, on these results, an assembly reaches 99% of the maximum
insertions/deletions.
accuracy at 80× coverage with an assembly time of 56 min for
a genome size of approximately 5 Mbp.
Errors in the assemblies affected the number of coding
the HAC algorithm takes approximately 3 times longer than
DNA sequence(s) (CDS) identified by Prokka. The E. coli
the Fast algorithm. The overall accuracy of the assemblies at
K−12 MG1655 reference genome annotation contains 4305
similar coverage values (∼300× for both HAC algorithms and
CDS, 88 tRNA, and 22 rRNA. The HAC+mod assemblies
260× for the Fast algorithm) were quite different with Q scores
had a higher number of CDS annotated that varied from a
of 32.0, 27.3, and 24.3 for the HAC+mod, HAC, and Fast
4% to an 83% increase over the reference (Supplementary
algorithms, respectively (Table 1). All three methods resulted
Table 2). The increase in the number of CDS was linearly
in a single contig of a size that was shorter than the reference
correlated with assembly accuracy and can be used as a proxy
genome by 1.7 to 3.3 kbp. The HAC+mod algorithm reduced the
for assembly quality (Figure 3). While the correlation was the
number of SNPs by 200-fold compared to the HAC algorithm,
same between HAC+mod and Fast algorithms (coefficient of
suggesting DNA modification has a significant effect on read
determination = 0.98), the slope was different between the two
accuracy. The number of InDels in the HAC+mod algorithm
algorithms due to the difference in maximum assembly accuracy.
was reduced by 33% compared to the HAC algorithm. The Fast
algorithm resulted in an assembly with over 10,000 SNPs and
4,300 InDels (Table 1).
Genome-Scale Metabolic
We evaluated the effect of coverage depth on the assembly Reconstructions From MinION
accuracy and time for the basecalled reads. We subsampled the Assemblies
HAC+mod reads to generate two datasets with genome coverage We used the outputs from the Prokka annotation to build
of 15, 20, 40, and 100× coverage. The N50 value of one dataset genome-scale metabolic network reconstructions (GEMs) for
was left at the original value (approximately 21 kbp) while one three representative assemblies from the Fast and HAC+mod
set was subsampled to have an N50 value of 11 kbp. These sets algorithms. We leveraged a recently published model building
were then filtered to remove reads smaller than 2,000 bp and a protocol that generates a reconstruction based on a reference
quality score lower than 7, as well as adapter trimmed, resulting model (Norsigian et al., 2020b). We added an additional step
in final coverage values of 11, 14, 27, and 58×. An additional that attempts to recombine CDS that were split into multiple
subset was generated from the 15× read set where all reads protein sequences due to sequencing errors. This homology-
larger than 15 kbp were removed resulting in 7× coverage and based correction resulted in a substantial recovery of split CDS.
an N50 of 9 kbp. We generated similar datasets for reads from For the Fast basecalling algorithm, 76–84% of split CDS were
the Fast algorithm. recombined into a single protein sequence (Table 3). For the
Assembly accuracy increased rapidly with increasing coverage HAC+mod algorithm, this ranged from 82 to 96% with the
depth. For the HAC+mod datasets, all read subsets resulted highest coverage assembly achieving 4312 putative CDS versus
in a single, circular contig except for the 7× coverage subset 4305 for the reference E. coli K−12 MG1655 reference genome.
with all reads longer than 15 kbp removed (Supplementary We also leveraged an optional step in the process where the
Table 2). Assembly time increased linearly with coverage nucleotide sequences for each CDS in the reference genome is
depth (Figure 2A); however, assembly accuracy increased queried against the draft genome. Open reading frames missing
non-linearly with the 58× coverage read set achieving a Q from the draft annotation due to sequencing errors can be
Frontiers in Microbiology | www.frontiersin.org 6 November 2020 | Volume 11 | Article 596626Broddrick et al. Metabolic Models From MinION
FIGURE 2 | Assembly statistics versus coverage depth. (A) Assembly time versus genome coverage depth. (B) Assembly accuracy versus coverage depth.
pathogenic bacteria. The clinical isolates included a hospital-
acquired MRSA strain isolated from a patient with prolonged
bacteremia secondary to osteomyelitis at Westchester Medical
Center in Valhalla, New York. The A. baumannii strain was
isolated from an osteomyelitis patient in 2017 in San Diego, CA,
United States. The E. faecium strain was isolated from a patient
in Cairo, Egypt. These isolates provided a practical application
of the pipeline as antibiotic resistance genes can be identified
by comparative analysis with reference models. Additionally,
high-quality genome scale metabolic reconstructions exist for
A. baumannii strain AYE (Norsigian et al., 2018) and S. aureus
strain USA300 (Seif et al., 2019), which could serve as reference
reconstructions. Currently a metabolic reconstruction is not
available for E. faecium. Thus, we assessed the completeness of
draft reconstructions of E. faecium using our pipeline compared
FIGURE 3 | Assembly accuracy versus the number of coding DNA sequences to an automated reconstruction pipeline [CarveMe (Machado
annotated. et al., 2018)]. The demultiplexed samples were basecalled,
assembled and annotated using our pipeline, a summary of which
is shown in Table 4. Circular contigs were generated for all
recovered using this step. A summary of recovered open reading
three bacterial genomes. Additionally, plasmids were recovered
frames is shown in Table 3.
for A. baumannii and E. faecium.
Using the most recent E. coli K−12 MG1655 GEM, iML1515,
as a reference model, we generated GEMs based on homology Staphylococcus aureus Clinical Isolate
search between annotations of the corrected draft assemblies and The S. aureus isolate reads were assembled into a single
the reference genome. The resulting models were surprisingly circular contig that resulted in a near-complete genome-
complete, even for the lowest accuracy assemblies (Table 3). scale model. Overall genome coverage was approximately
When simulated, all models, even the lowest accuracy assembly 75×, which, based off the pipeline validation in E. coli, was
from the Fast basecalling algorithm, predicted the same growth expected to result in a near-complete assembly. We generated
rate as the reference model. All metabolic reactions were present assemblies using reads from both high accuracy algorithms,
in the models, with the exception of the lowest accuracy with and without accounting for methylation of A and C bases
HAC+mod assembly, which was missing 2 of 2,712 reactions. (HAC−mod and HAC+mod, respectively). The HAC−mod
All models contained over 99% of the genes present in the assembly resulted in fewer total ORFs with a longer mean length
reference model. Predicted growth capabilities on 298 possible (Table 4). The reduction in fragmented ORFs suggested the
carbon sources were identical for all six models and iML1515 HAC−mod algorithm resulted in a more accurate assembly
(Supplementary Figure 2). than the HAC+mod algorithm, in contrast to the results in
E. coli (Table 1).
Assembly and Reconstruction of The draft genome-scale model of the clinical isolate was
Pathogenic Bacteria nearly identical to that of the reference model. Using the
After validating the model generation pipeline on E. coli K−12, pipeline’s split ORF recombination step reduced the number of
we applied the method to characterize clinical isolates of predicted ORFs by 58 in the HAC−mod assembly and 145 in
Frontiers in Microbiology | www.frontiersin.org 7 November 2020 | Volume 11 | Article 596626Broddrick et al. Metabolic Models From MinION
TABLE 3 | Statistics of genome-scale metabolic reconstructions built from the assembly and annotation pipeline.
Basecaller Coverage # contigs Split CDS recovered (%) ORFs recovered Genes Reactions Growth rate (hr−1 )
Fast 6× 24 4155 (76%) 547 1502 2712 0.877
66× 1 1725 (84%) 40 1507 2712 0.877
260× 1 1576 (83%) 32 1511 2712 0.877
HAC+mod 7× 5 2902 (82%) 233 1510 2710 0.877
58× 1 360 (93%) 5 1515 2712 0.877
307× 1 176 (96%) 3 1516 2712 0.877
iML1515 N/A N/A N/A N/A 1516 2712 0.877
TABLE 4 | Assembly statistics for clinical isolates of pathogenic bacteria characterized in this study.
HAC+ HAC−
Barcode Species ID Size (Mbp) Cov. ORFs Mean ORF length (bp) ORFs Mean ORF length (bp) Assembly time (min)
BC07 A. baumannii 3.93 13× 5826 561 5376 622 13
BC09 E. faecium 2.89 46× 3595 669 3217 762 34
BC11 S. aureus 2.84 75× 2961 803 2788 859 27
the HAC+mod; again suggesting the HAC−mod algorithm was homology search, we added the reactions back to the draft
more accurate due to fewer split ORFs. For both algorithms, only reconstruction of the clinical isolate. The final missing reactions
a single ORF was recovered by homology search of reference were alternate peptidoglycan biosynthesis pathways in the
nucleotide sequences against the assemblies. The draft clinical reference strain. This alternate pathway is missing or different in
isolate metabolic reconstruction consisted of 851 genes and the clinical isolate and its omission from the draft reconstruction
1,448 reactions compared to 866 genes and 1,455 reactions was valid. The only unique capabilities in the reference strain
in the reference model iYS854. Of the 7 missing reactions genome were a putative arsenate reductase and a trio of poorly
none were essential and the growth rate predicted by the characterized ATP-dependent transporters with low homology
draft model, before curation, was identical to that of the to cation uptake proteins. There were no unique metabolic
reference model. Draft reconstructions were identical for both the capabilities identified in the clinical isolate. The final, curated
HAC−mod and HAC+mod assemblies. Thus, we only curated clinical isolate reconstruction, iSA854isolate (Supplementary
the HAC−mod derived draft. Material), consisted of 854 genes, 1,453 reactions and 1,335
The model construction pipeline provides an annotation metabolites (Figure 4).
of unique content, both in the reference strain and clinical There were differences in the antibiotic resistance capabilities,
isolate. Using these annotations, we rapidly curated the draft host toxicity mechanisms and antimicrobial peptide biosynthesis
clinical isolate reconstruction into a complete model. The between the reference strain and the clinical isolate (Figure 4).
clinical isolate had 181 proteins without a clear homolog in Of the methicillin resistance genes present in the reference
the USA300 strain (Figure 4), of which 57 had homology to a strain, USA300 TCH1516, only the transmembrane β-lactam
protein the Swissprot database. From these 57 proteins, it was sensor, MecR1 (Peacock and Paterson, 2015), was missing in
determined 16 were homologous to a protein in the reference, the clinical isolate. The clinical isolate genome encoded for a
but below the 80% PID cutoff. Thus, we curated the final list possible MacB efflux transporter (Kobayashi et al., 2001), which
of 41 proteins in the clinical isolate for unique metabolic and confers resistance to macrolides, such as erythromycin (Lin
antibiotic resistance or toxicity content. A similar analysis of et al., 2009). The chemotaxis inhibitory protein, responsible for
the reference strain USA300 TCH1516 resulted in 447 proteins evading the host immune system (de Haas et al., 2004), and
without homology in the clinical isolate (Figure 4). Of these phenol-soluble modulins, capable of lysing host cells (Cheung
477 proteins, 100 were homologous to Swissprot proteins and et al., 2014), were not present in the clinical isolate. While
upon manual curation, we identified 67 as proteins of known both the reference strain and clinical isolate genomes encoded
function that were unique to the reference compared to the for Staphylococcal enterotoxin A, D, and E, the clinical isolate
clinical isolate. also encoded for enterotoxins C, G, and H. Biosynthesis of
The metabolic capabilities of USA300 TCH1516 and the the antimicrobial lantibiotic, epidermin, was unique to the
clinical isolate were almost identical. We first assessed the reference strain. No known lantibiotic biosynthesis pathways
reactions missing from the draft model that were present in were present in the clinical isolate; however, a lantibiotic exporter
the reference. For 5 of the 7 missing reactions, we determined was annotated. It should be noted, this analysis is based on
homology scores below the cutoff resulted in the reactions genome comparison analysis and not direct outputs from model
being removed from the draft reconstruction. However, after simulations as many of these mechanisms are out of scope
manual curation of these proteins against the Swissprot database for GEMs. However, the genome comparison was facilitated by
Frontiers in Microbiology | www.frontiersin.org 8 November 2020 | Volume 11 | Article 596626Broddrick et al. Metabolic Models From MinION
FIGURE 4 | Comparison of S. aureus USA300 TCH1516 versus the S. aureus clinical isolate based on outputs of the genome-scale metabolic reconstruction
pipeline.
the pipeline as only non-redundant content required manual 244 had homology to a protein the Swissprot database. From
intervention and annotation. these 244 proteins, it was determined 83 were homologous to a
protein in the reference, but below the 80% PID cutoff. Thus,
Acinetobacter baumannii Clinical Isolate we curated the final list of 161 proteins for unique metabolic
The A. baumannii isolate reads were assembled into one circular and antibiotic resistance or toxicity content. A reciprocal analysis
genome and one linear plasmid despite an overall genome of the reference strain AYE resulted in 558 proteins without
coverage of approximately 13×. We generated assemblies using homology in the clinical isolate (Figure 5). Of these 558 proteins,
reads from both high accuracy algorithms, with and without 267 were homologous to Swissprot proteins and upon manual
accounting for methylation of A and G bases (HAC−mod curation, we identified 179 as proteins of known function that
and HAC+mod, respectively). Again, the HAC−mod assembly were unique to the reference compared to the clinical isolate.
resulted in fewer total ORFs with a longer mean length (Table 4) We first assessed the remaining reactions missing from the
and, thus, resulted in a more accurate assembly than the draft model that were present in the reference. Manual curation
HAC+mod algorithm. of the non-CPS missing reactions suggested these capabilities
The metabolic content of the draft genome-scale model were indeed not present in the clinical isolate. These included
of the clinical isolate differed from that of the reference acetolactate decarboxylase, proline racemase, allophanate
model. The pipeline’s split ORF recombination step reduced the hydrolase, an ABC-type histidine/cationic amino acid importer,
number of predicted ORFs by 326 in the HAC−mod assembly and a plasmid encoded creatine amidohydrolase. Additionally,
suggesting the low genome coverage, and resulting accuracy, the DNA modifying enzyme cytosine-5-methyltransferase
resulted in a substantial number of frameshifts. Five ORFs were (model reaction CYTOM) was absent in the clinical isolate.
recovered by homology search of reference nucleotide sequences Unique capabilities in the reference strain AYE genome included
against the assemblies. The draft clinical isolate metabolic heavy metal efflux pumps for arsenic, and mercury as well as
reconstruction consisted of 675 genes and 1,007 reactions several genes related to CPS biosynthesis in addition to those
compared to 709 genes and 1,015 reactions in the reference mentioned above.
model iCN718. Of the 8 missing reactions, one was essential; In contrast, there were several additional metabolic
a capsular polysaccharide (CPS) biosynthetic enzyme, UDP- capabilities annotated in the clinical isolate. Degradation
N-acetyl-D-glucosamine epimerase (model reaction UAG4E). pathways for glucarate and galactarate, putrescine, and gallate
Upon removing the product of this reaction, UDP-N-acetyl-D- were present in the isolate (Figure 5). These pathways were
galactosamine, from the CPS biomass reaction, the draft model already present in the BiGG Models database (Norsigian et al.,
was able to simulate growth. This observation, along with the 2020c) in models for E. coli [iML1515 (Monk et al., 2017)],
absence of another CPS biosynthetic enzyme, UDP-N-acetyl- Bacillus subtilis [iYO844 (Oh et al., 2007)], and Pseudomonas
D -mannosamine oxidoreductase (model reaction UACMAMO), putida [iJN1462, (Nogales et al., 2020)]. As such, this new model
suggested differences in the CPS between the two species, which content was easily transferred to the draft reconstruction and
was evident during the subsequent manual curation phase. the gene-reaction associations updated with the clinical isolate
The A. baumannii clinical isolate had 700 proteins without a ORFs (Supplementary Material). While both the clinical isolate
clear homolog in the AYE reference strain (Figure 5), of which and the reference strain contained a Type-I dihydropteroate
Frontiers in Microbiology | www.frontiersin.org 9 November 2020 | Volume 11 | Article 596626Broddrick et al. Metabolic Models From MinION FIGURE 5 | Comparison of A. baumannii AYE versus the A. baumannii clinical isolate based on outputs of the genome-scale metabolic reconstruction pipeline. synthase, the clinical isolate also encoded for a Type-II version For antimicrobial toxins, the clinical isolate genome included a of this enzyme. The Type-I is rapidly inhibited by sulfonaminde contact-dependent growth inhibition system, CdiA (Willett et al., antibiotics while the Type-II may confer resistance to this class 2015), which was not present in the reference genome. Efflux of antibiotics (Rådström et al., 1991). pumps and the aminoglycoside acetyltransferase are in-scope for The CPS biosynthesis loci in the clinical isolate suggested the the GEM and if combined with a model of antibiotic uptake presence of pseudaminic acid. The genetic organization of the kinetics could simulate AMR mechanisms. However, the CdiA clinical isolate CPS loci was highly similar to the pseudaminic mechanism is out of scope for GEMs and the analysis above is acid containing K2 capsule (Kenyon et al., 2014). However, the based on genome comparison. K2 capsule is hypothesized to use N-acetyl-galactosamine as the initiation sugar (Kenyon et al., 2014). As mentioned above, E. faecium Draft Reconstruction the clinical isolate is missing the UDP-N-acetyl-D-glucosamine We attempted to generate a draft metabolic model of epimerase, which biosynthesizes N-acetyl-galactosamine. Thus, Enterococcus faecium (E. faecium) using a modified version the initiating CPS sugar for the clinical isolate is unknown. The of the pipeline. As a reference model does not exist for this pseudaminic acid biosynthesis pathway was not in the BiGG species, we adapted the model construction pipeline to use a Models Database. Thus, we manually curated the pathway into neighboring organism in the BiGG Models Database (Norsigian the draft reconstruction. There was one additional metabolic et al., 2020c) as a reference. As expected, phylogenomic capability annotated in the clinical isolate but not added to the analysis indicated the E. faecium strain clustered with the other draft reconstruction. A gene cluster with very low homology Firmicutes in the BiGG database (Supplementary Figure 3). to siderophore-mediated iron uptake was annotated. The low We also chose a “type-strain,” in this case E. faecium strain DO homology annotations prevented the content from being added (NCBI: NC_017960.1), which was used to perform the ORF to the model; however, this pathway is redundant with iron recovery step of the pipeline. Additionally, this version of the uptake systems present in both the reference strain and the pipeline used an e-value threshold (1e-10) instead of PID to clinical isolate. The final, curated clinical isolate reconstruction, establish homology with the reference species. We generated iAB710isolate (Supplementary Material), consisted of 710 genes, draft metabolic reconstructions of E. faecium using three 1,032 reactions and 918 metabolites (Figure 5). Firmicute GEMs due to their phylogeny as well as E. coli due to There were differences in the antibiotic resistance capabilities the model size and quality as reference species (Table 5). and antimicrobial toxins between the A. baumannii reference None of the E. faecium reconstructions created a complete strain and the clinical isolate (Figure 5). Genetic evidence for model. The reconstructions varied in size from 319 to 448 genes antibiotic resistance unique to the reference AYE strain included (Table 5). However, each reconstruction also contained unique kanamycin, tetracycline, gentamicin, chloramphenicol and small content not present in the draft models derived from the other multidrug resistance. The clinical isolate genome encoded for an reference species. The total, non-redundant draft reconstruction ABC transporter that functions as a cefoperazone efflux pump consisted of 626 genes, 1,045 reactions and 1,050 metabolites (Yamanaka et al., 2016). Additionally, in the clinical isolate, (Supplementary Material). This combined model was unable there was evidence for an aminoglycoside acetyltransferase that to simulate growth, likely due to the lack of a species-specific acetylates aminoglycoside molecules conferring resistance to biomass reaction. The number of ORFs without homology to the purpurosamine ring containing antibiotics (Nobuta et al., 1988). reference species increased with increasing phylogenetic distance Frontiers in Microbiology | www.frontiersin.org 10 November 2020 | Volume 11 | Article 596626
Broddrick et al.                                                                                                                        Metabolic Models From MinION

TABLE 5 | Draft metabolic reconstructions of E. faecium clinical isolate using different reference genome-scale reconstructions.

                                  Reference Strain                   Ref model genes                   Model Genes                  Unique               No BBH hits

E. faecium GEM                    Lactococcus lactis                         517                             342                      35                     1435
                                    Bacillus subtilis                        844                             319                      21                     1492
                               Staphylococcus aureus                         854                             448                      77                     1545
                                    Escherichia coli                        1515                             434                      97                     1848

from E. faecium (Table 5). However, this did not correlate with                         binning and annotation (10×). Reads for a substrain of E. coli
model size as the most phylogenetically distance species, E. coli,                      CFT073 constituted 11% of the total reads but only 3% of
resulted in the second largest model.                                                   the sequenced nucleotides (Supplementary Table 3) and did
   We compared the results from our pipeline with that from                             not exceed the coverage cutoff for binning. Surprisingly, the
an automated reconstruction tool, CarveMe (Machado et al.,                              assembly for a substrain of E. coli O157:H7 was fragmented
2018). CarveMe uses a universal model based on an older version                         with highly variable coverage of the main chromosome (14–
of the BiGG database, which is conceptually similar to, but                             22×). This sample stood in stark contrast to the other assemblies
more comprehensive than, our use of multiple reference models                           above the cutoff threshold suggesting an issue during gDNA
above. CarveMe then removes model content based on a linear                             extraction or library construction. Still, the size of the assembled
programming (MILP) approach. Annotated E. faecium protein                               fragments was similar to the canonical size for this strain of
sequences aligned to the CarveMe universal model protein                                E. coli (Table 6) and a draft reconstruction (not curated for
database suggested 708 unique hits with an e-value above the                            novel content) based on iML1515 was able to solve for growth
threshold of 1e-10, which is similar to our combined model                              (Supplementary Dataset).
size of 626 genes. The CarveMe GEM contained 471 genes,                                    As A. baumannii had the least similarity of the circular
1,045 reactions and 784 metabolites. While this model was                               genomes, we ran the model reconstruction pipeline on the
smaller than our combined model, it was capable of simulating                           metagenome-derived assembly for this isolate. The metagenome-
growth on a chemically rich media (all exchange reactions open)                         derived assembly contained 5,019 annotated ORFs with an
while our combined model was not. The difference between the                            average ORF length of 659 bp compared to 5,376 ORFs and
number of homologous proteins in our E. faecium assembly                                622 bp in the HAC−mod assembly. This result suggested
(708) and the final CarveMe model gene count (471) suggested                            assembly quality was higher for the metagenome than the
the MILP “carving” process removed metabolic content that                               demultiplexed assembly, possibly due to slightly higher coverage
should likely be included in the E. faecium reconstruction. As                          (Table 6). The draft reconstruction from the metagenome-
the CarveMe method is a top-down model building tool, this is                           derived assembly and the HAC−mod assembly were identical
somewhat expected. There was unique content in both models.                             with 675 genes and 1,007 reactions, with the same 8 reference
Of the 471 genes in the CarveMe model, 106 were missing from                            model reactions missing in both draft reconstructions. This result
our combined model. At the same time, our combined model                                suggests near-complete genome scale metabolic reconstructions
contained 261 genes not present in the CarveMe model. These                             can be built with metagenome-derived assemblies.
results suggest the reconstructions resulting from both pipelines
require manual curation.
                                                                                        DISCUSSION
Mock Metagenome
As analysis of microbial communities in situ is an important                            Overall, the results from the assembly and model
capability of the MinION sequencing platform, we assessed the                           construction pipeline suggest accurate genome-scale metabolic
quality of assemblies derived from treating the entire sequencing                       reconstructions can be generated directly from MinION-based
run as a mock metagenome. There were six separate sample                                assemblies. The pipeline delivered >99% complete E. coli models
preparations, or carry-over from previous runs, present in the                          for all coverage depths and assembly accuracies. Assembly
mock metagenome including three strains of E. coli, with an order                       accuracy rapidly increased with increasing coverage depth while
of magnitude difference in the read count between the least and                         the time required for assembly increased linearly with coverage
most abundant sample (Supplementary Table 3). Single, circular                          depth (Figures 2A,B). These data suggest a coverage target
contigs were recovered from the metagenome for S. aureus,                               of approximately 80× provides a balance between assembly
A. baumannii, and E. faecium, similar in length to the assemblies                       accuracy and time required. At this value, an assembly is within
from demultiplexed reads (Table 6). Comparison of the genomes                           1% of its maximum accuracy and the pipeline can be complete
derived from the HAC−mod reads and the metagenome resulted                              in less than an hour on a laptop, for a genome of approximately
in Q-scores of 29.4, 34.2, and 43.6 for A. baumannii, E. faecium,                       5 Mbp. While the Fast basecaller resulted in low accuracy, error
and S. aureus, respectively (99.88% similar or better). Fragmented                      prone assemblies, the reconstructions that resulted from these
contigs for Synechococcus elongatus PCC 7942, assessed to                               reads were still greater than 99% complete. This is likely due
be carry-over from a previous sequencing run on the same                                to the fact that network reconstructions require only a binary
MinION flow cell, did not exceed the coverage cutoff for                                presence-absence assessment in order to add a reaction to the

Frontiers in Microbiology | www.frontiersin.org                                    11                                       November 2020 | Volume 11 | Article 596626
Broddrick et al. Metabolic Models From MinION
TABLE 6 | Assembly statistics for the MinION mock metagenome assembly.
Contigs Contig ID Mean coverage # contigs Mean GC content (%) Size (bp)
Circular contigs A. baumannii 16 1 39 3924200
A. baumannii plasmid 125 1 38 19664
E. coli O157:H7 Fragment 5 1 49 7257
E. coli O157:H7 Fragment 23 1 55 2035
E. coli O157:H7 Plasmid 50 1 48 92091
E. faecium 57 1 38 2877951
E. faecium plasmid 275 1 36 57023
E. faecium plasmid 610 1 35 48025
E. faecium plasmid 3164 1 39 2014
S. aureus 80 1 33 2826253
S. elongatus sp. PCC 7942 33 1 60 7842
Bin 1 E. coli O157:H7 17 3 50 737975
Bin 2 E. coli O157:H7 39 1 49 55052
Bin 3 E. coli O157:H7 plasmid 829 2 44 3300
Bin 4 S. elongatus sp. PCC 7942 12 1 53 43757
Bin 5 E. coli O157:H7 27 3* 50 4626033
Bin 6 E. faecium plasmid 71 1 36 164487
*2 kbp S. aureus contaminating contig.
model. Taken together, this data suggests the GEM accuracy is strains in the same metagenome may have affected the assembly
equal to the genome assembly accuracy. As MinION assemblies quality. However, an assembly of the demultiplexed barcoded
achieve greater than 99% consensus accuracy, the resulting GEMs reads yielded similar results (Supplementary Table 4). Thus, the
also achieve this level of completion. It should be noted that issue was inherent in the read data and the presence of multiple,
assembly quality and speed continue to increase due to advances similar strains did not affect the assembly quality. Consistency
in computational algorithms and hardware. For example, we between the metabolic capabilities of the S. aureus clinical
validated the Supplementary Dataset example pipeline process isolate and the reference strain, USA300 TCH1315, resulted in
on a laptop equipped with an intel i7-9750 45W processor with a solvable, near complete genome-scale model directly from
32 GB RAM, and an RTX2060 GPU. High accuracy basecalling the pipeline. The pairwise comparison output from the pipeline
of the E. coli data took 90 min compared to 177 min (Guppy also enabled a rapid assessment of putative AMR capabilities
v. 3.6.1 vs. 3.2.2, mobile RTX2060 vs. desktop GTX1070) and (Figure 4). The observed differences, such as the presence
assembly of a 40× HAC E. coli dataset took 12 min compared to of a putative MacB efflux pump in the clinical isolate, could
28 min on the i7-8650U processor. assist in treatment selection or be used to correlate disease
The assembly pipeline resulted in circular contigs for S. aureus, presentation and clinical outcomes with genomic content. These
A. baumannii, and E. faecium clinical isolates. The relationships observations were based on comparative genomics and not a
between coverage depth and the overall genome accuracy and result of model simulations.
number of split ORFs were consistent with the validation results The metabolic capabilities of the A. baumannii clinical isolate
from E. coli. The recovery of the complete A. baumannii genome diverged from the reference AYE strain (Figure 5). The presence
despite an overall coverage of 13×, was particularly encouraging. of additional catabolic pathways, especially gallate, provide
Additionally, the pipeline recovered plasmids for A. baumannii insight into the potential source and environmental background
and E. faecium, an important capability as plasmids often contain of the pathogen. Phylogenomic analysis of the clinical isolate
AMR conferring genes (Buckner et al., 2018). identified A. baumannii strain XL380, isolated from cucumber
Treating the sequencing run as a metagenome did not degrade rhizosphere, as the most similar (NCBI accession CP046536.1,
the quality of the resulting assemblies. In fact, our results for Supplementary Figure 4). As gallate is a plant metabolite, it
A. baumannii suggested an increase in assembly quality due to the is plausible the clinical isolate also originated from a plant
incorporation of reads that are excluded from the demultiplexed rhizosphere. Additionally, the pipeline generated sufficient detail
samples due the lack of a barcode (approximately 11% of the about the clinical isolate’s capsular polysaccharide (CPS) to
reads, Supplementary Table 3). This result shows promise for associate it with the K2 capsular (Kenyon et al., 2014), while at
rapid in situ characterization of simple microbial communities, the same time deduced the initiating sugar is different in this
for which there is precedence in the literature (Castro-Wallace strain. The presence of pseudaminic acid in the polysaccharide of
et al., 2017; Arumugam et al., 2019; Sevim et al., 2019). The Helicobacter pylori was correlated with increased virulence (Kao
fragmented nature of the E. coli O157:H7 genome in the mock et al., 2016), again demonstrating the pipeline employed in this
metagenome stood out from the quality assemblies of the other study has value in identifying metabolic content that may inform
species. We hypothesized the presence of three different E. coli disease progression and likely clinical outcomes.
Frontiers in Microbiology | www.frontiersin.org 12 November 2020 | Volume 11 | Article 596626You can also read


