ScanGAN360: A Generative Model of Realistic Scanpaths for 360 Images
←
→
Page content transcription
If your browser does not render page correctly, please read the page content below
ScanGAN360: A Generative Model of Realistic Scanpaths for 360◦ Images

                                                 Daniel Martin1              Ana Serrano2             Alexander W. Bergman3                    Gordon Wetzstein3
                                                                                                    Belen Masia1

                                                    1                                    2                                                      3
                                                        Universidad de Zaragoza, I3A         Centro Universitario de la Defensa, Zaragoza           Stanford University
arXiv:2103.13922v1 [cs.CV] 25 Mar 2021

                                                                    Abstract

                                            Understanding and modeling the dynamics of human
                                         gaze behavior in 360◦ environments is a key challenge in
                                         computer vision and virtual reality. Generative adversar-
                                         ial approaches could alleviate this challenge by generat-
                                         ing a large number of possible scanpaths for unseen im-
                                         ages. Existing methods for scanpath generation, however,
                                         do not adequately predict realistic scanpaths for 360◦ im-
                                         ages. We present ScanGAN360, a new generative adver-
                                         sarial approach to address this challenging problem. Our
                                         network generator is tailored to the specifics of 360◦ im-
                                         ages representing immersive environments. Specifically, we
                                         accomplish this by leveraging the use of a spherical adapta-
                                         tion of dynamic-time warping as a loss function and propos-
                                         ing a novel parameterization of 360◦ scanpaths. The quality            Figure 1. We present ScanGAN360, a generative adversarial ap-
                                         of our scanpaths outperforms competing approaches by a                 proach to scanpath generation for 360◦ images. ScanGAN360
                                                                                                                generates realistic scanpaths (bottom rows), outperforming state-
                                         large margin and is almost on par with the human baseline.
                                                                                                                of-the-art methods and mimicking the human baseline (top row).
                                         ScanGAN360 thus allows fast simulation of large numbers
                                         of virtual observers, whose behavior mimics real users, en-
                                         abling a better understanding of gaze behavior and novel
                                                                                                                for the time-dependent visual behavior of the user, making
                                         applications in virtual scene design.
                                                                                                                it difficult to predict the order of fixations, or give insight
                                                                                                                into how people explore an environment over time. For this
                                                                                                                purpose, some recent work has explored scanpath predic-
                                         1. Introduction                                                        tion [2, 3, 62, 4], but these algorithms do not adequately
                                            Virtual reality (VR) is an emerging medium that unlocks             model how people explore immersive virtual environments,
                                         unprecedented user experiences. To optimize these expe-                resulting in erratic or non-plausible scanpaths.
                                         riences, however, it is crucial to develop computer vision                 In this work, we present ScanGAN360, a novel frame-
                                         techniques that help us understand how people explore im-              work for scanpath generation for 360◦ images (Figure 1).
                                         mersive virtual environments. Models for time-dependent                Our model builds on a conditional generative adversarial
                                         visual exploration behavior are important for designing and            network (cGAN) architecture, for which we discuss and val-
                                         editing VR content [42], for generating realistic gaze trajec-         idate two important insights that we show are necessary for
                                         tories of digital avatars [18], for understanding dynamic vi-          realistic scanpath generation. First, we propose a loss func-
                                         sual attention and visual search behavior [60], and for devel-         tion based on a spherical adaptation of dynamic time warp-
                                         oping new rendering, display, and compression algorithms,              ing (DTW), which is a key aspect for training our GAN ro-
                                         among other applications.                                              bustly. DTW is a metric for measuring similarity between
                                            Current approaches that model how people explore vir-               two time series, such as scanpaths, which to our knowledge
                                         tual environments often leverage saliency prediction [43,              has not been used to train scanpath-generating GANs. Sec-
                                         13, 31, 2]. While this is useful for some applications, the            ond, to adequately tackle the problem of scanpath genera-
                                         fixation points predicted by these approaches do not account           tion in 360◦ images, we present a novel parameterization of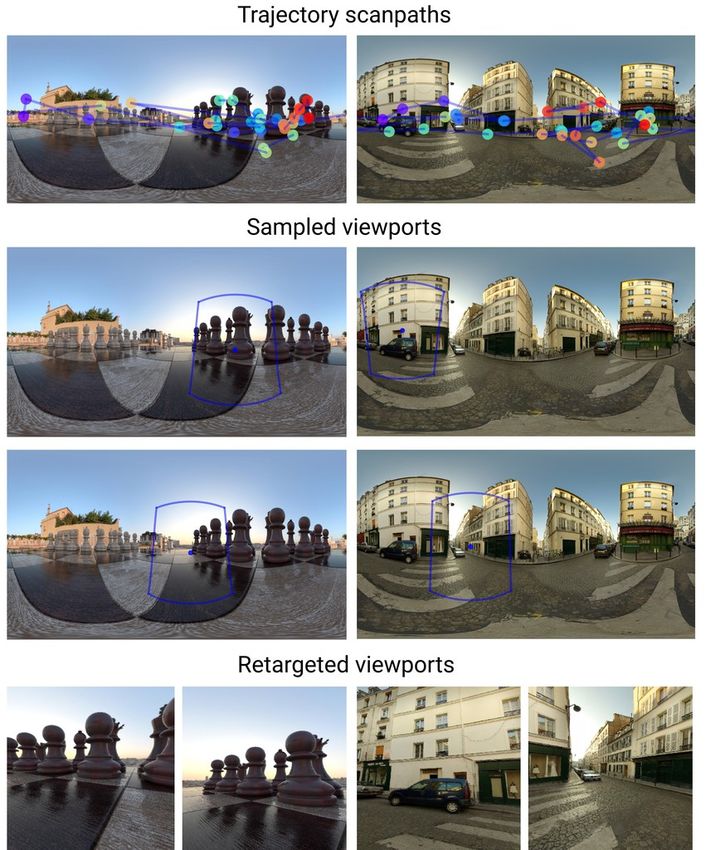
the scanpaths. These insights allow us to demonstrate state-     neers in this field: they proposed a general framework for
of-the-art results for scanpath generation in VR, close to the   generating scanpaths based on Markov stochastic processes.
human baseline and far surpassing the performance of ex-         Several approaches have followed this work, incorporating
isting methods. Our approach is the first to enable robust       behavioral biases in the process in order to produce more
scanpath prediction over long time periods up to 30 sec-         plausible scanpaths [24, 47, 27, 48]. In recent years, deep
onds, and, unlike previous work, our model does not rely         learning models have been used to predict human scanpaths
on saliency, which is typically not available as ground truth.   based on neural network features trained on object recogni-
    Our model produces about 1,000 scanpaths per second,         tion [22, 53, 14, 5].
which enables fast simulation of large numbers of virtual
observers, whose behavior mimics that of real users. Us-
                                                                 Attention in 360◦ images Predicting plausible scanpaths
ing ScanGAN360, we explore applications in virtual scene
                                                                 in 360◦ imagery is a more complex task: Observers do not
design, which is useful in video games, interior design,
                                                                 only scan a given image with their gaze, but they can now
cinematography, and tourism, and scanpath-driven video
                                                                 also turn their head or body, effectively changing their view-
thumbnail generation of 360◦ images, which provides pre-
                                                                 port over time. Several works have been proposed for mod-
views of VR content for social media platforms. Beyond
                                                                 eling saliency in 360◦ images [33, 43, 31, 11, 44]. However,
these applications, we propose to use ScanGAN360 for
                                                                 scanpath prediction has received less attention. In their re-
applications such as gaze behavior simulation for virtual
                                                                 cent work, Assens et al. [3] generalize their 2D model to
avatars or gaze-contingent rendering. Extended discussion
                                                                 360◦ images, but their loss function is unable to reproduce
and results on applications are included in the supplemen-
                                                                 the behavior of ground truth scanpaths (see Figure 4, third
tary material and video.
                                                                 column). A few works have focused on predicting short-
    We will make our source code and pre-trained model
                                                                 term sequential gaze points based on users’ previous his-
publicly available to promote future research.
                                                                 tory for 360◦ videos, but they are limited to small temporal
                                                                 windows (from one to ten seconds) [56, 25, 35]. For the
2. Related work                                                  case of images, a number of recent methods focus on devel-
Modeling and predicting attention The multimodal na-             oping improved saliency models and principled methods to
ture of attention [30], together with the complexity of hu-      sample from them [2, 4, 62].
man gaze behavior, make this a very challenging task. Many          Instead, we directly learn dynamic aspects of attention
works devoted to it have relied on representations such as       from ground truth scanpaths by training a generative model
saliency, which is a convenient representation for indicat-      in an adversarial manner, with an architecture and loss
ing the regions of an image more likely to attract atten-        function specifically designed for scanpaths in 360◦ im-
tion. Early strategies for saliency modeling have focused        ages. This allows us to (i) effectively mimic human be-
on either creating hand-crafted features representative of       havior when exploring scenes, bypassing the saliency gen-
saliency [19, 52, 61, 29, 20, 7], or directly learning data-     eration and sampling steps, and (ii) optimize our network to
driven features [49, 22]. With the proliferation of exten-       stochastically generate 360◦ scanpaths, taking into account
sive datasets of human attention [43, 39, 20, 8, 59], deep       observer variability.
learning–based methods for saliency prediction have been
successfully applied, yielding impressive results [37, 36, 14,   3. Our Model
50, 54, 55, 58].
    However, saliency models do not take into account the            We adopt a generative adversarial approach, specifically
dynamic nature of human gaze behavior, and therefore, they       designed for 360◦ content in which the model learns to gen-
are unable to model or predict time-varying aspects of at-       erate a plausible scanpath, given the 360◦ image as a con-
tention. Being able to model and predict dynamic explo-          dition. In the following, we describe the parameterization
ration patterns has been proven to be useful, for example,       employed for the scanpaths, the design of our loss function
for avatar gaze control [12, 41], video rendering in virtual     for the generator, and the particularities of our conditional
reality [26], or for directing users’ attention over time in     GAN architecture, ending with details about the training
many contexts [9, 38]. Scanpath models aim to predict vi-        process.
sual patterns of exploration that an observer would perform
                                                                 3.1. Scanpath Parameterization
when presented with an image. In contrast to saliency mod-
els, scanpath models typically focus on predicting plausi-          Scanpaths are commonly provided as a sequence of two-
ble scanpaths, i.e., they do not predict a unique scanpath       dimensional values corresponding to the coordinates (i, j)
and instead they try to mimic human behavior when ex-            of each gaze point in the image. When dealing with 360◦
ploring an image, taking into account the variability be-        images in equirectangular projections, gaze points are also
tween different observers. Ellis and Smith [16] were pio-        often represented by their latitude and longitude (φ, λ),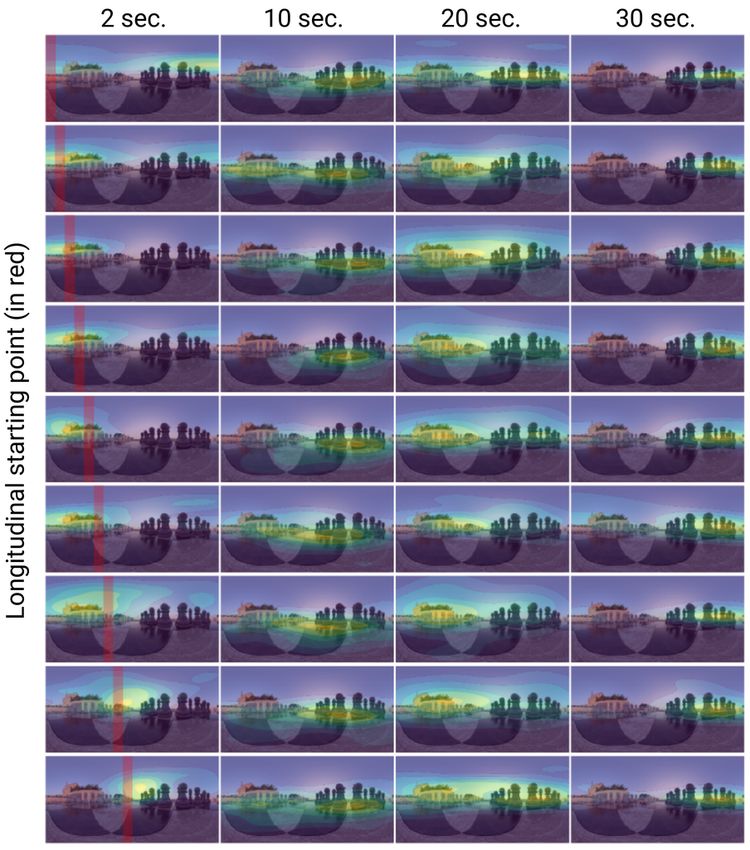
Figure 2. Illustration of our generator and discriminator networks. Both networks have a two-branch structure: Features extracted from the
360◦ image with the aid of a CoordConv layer and an encoder-like network are concatenated with the input vector for further processing.
The generator learns to transform this input vector, conditioned by the image, into a plausible scanpath. The discriminator takes as input
vector a scanpath (either captured or synthesized by the generator), as well as the corresponding image, and determines the probability of
this scanpath being real (or fake). We train them end-to-end in an adversarial manner, following a conditional GAN scheme. Please refer
to the text for details on the loss functions and architecture.

φ ∈ [− π2 , π2 ] and λ ∈ [−π, π]. However, these parame-                or G(z, y)), as well as the condition y (the RGB 360◦ im-
terizations either suffer from discontinuities at the borders           age), and outputs the probability of the scanpath being real
of a 360◦ image, or result in periodic, ambiguous values.               (or fake). The architecture of both networks, generator and
The same point of the scene can have two different repre-               discriminator, can be seen in Figure 2, and further details
sentations in these parameterizations, hindering the learning           related to the architecture are described in Section 3.4.
process.
    We therefore resort to a three-dimensional parameteriza-            3.3. Loss Function
tion of our scanpaths, where each gaze point p = (φ, λ) is                 The objective function of a conventional conditional
transformed into its three-dimensional representation P =               GAN is inspired by a minimax objective from game theory,
(x, y, z) such that:                                                    with an objective [32]:

    x = cos(φ) cos(λ); y = cos(φ) sin(λ); z = sin(φ).                          min max V (D, G) =
                                                                                 G    D
                                                                                                                                      (1)
This transformation assumes, without loss of generality,                       Ex [log D(x, y)] + Ez [log(1 − D(G(z, y), y)].
that the panorama is projected over a unit sphere. We                   We can separate this into two losses, one for the generator,
use this parameterization for our model, which learns a                 LG , and one for the discriminator, LD :
scanpath P as a set of three-dimensional points over time.
Specifically, given a number of samples T over time, P =                             LG = Ez [log(1 − D(G(z, y), y))],                (2)
(P1 , ..., PT ) ∈ R3×T . The results of the model are then
converted back to a two-dimensional
                                p       parameterization in              LD = Ex [log D(x, y)] + Ez [log(1 − D(G(z, y), y))]. (3)
terms of latitude (φ = atan2(z, x2 + y 2 )) and longitude                  While this objective function suffices in certain cases, as
(λ = atan2(y, x)) for display and evaluation purposes.                  the complexity of the problem increases, the generator may
                                                                        not be able to learn the transformation from the input distri-
3.2. Overview of the Model
                                                                        bution into the target one. One can resort to adding a loss
    Our model is a conditional GAN, where the condition                 term to LG , and in particular one that enforces similarity to
is the RGB 360◦ image for which we wish to estimate a                   the scanpath ground truth data. However, using a conven-
scanpath. The generator G is trained to generate a scanpath             tional data term, such as MSE, does not yield good results
from a latent code z (drawn randomly from a uniform distri-             (Section 4.4 includes an evaluation of this). To address this
bution, U(−1, 1)), conditioned by the RGB 360◦ image y.                 issue, we introduce a novel term in LG specifically targeted
The discriminator D takes as input a potential scanpath (x              to our problem, and based on dynamic time warping [34].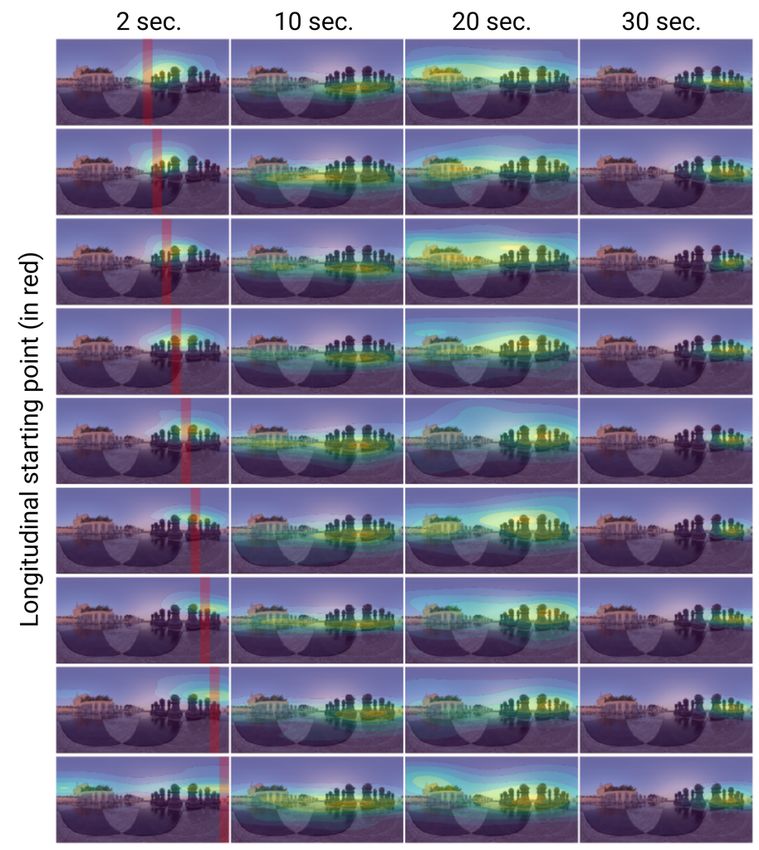
Dynamic time warping (DTW) measures the similar-             generator, and x or G(z, y) in the discriminator). The im-
ity between two temporal sequences, considering both the         age branch extracts features from the 360◦ image, yielding
shape and the order of the elements of a sequence, with-         a set of latent features that will be concatenated with the
out forcing a one-to-one correspondence between elements         input vector for further processing. Due to the distortion
of the time series. For this purpose, it takes into account      inherent to equirectangular projections, traditional convo-
all the possible alignments of two time series r and s, and      lutional feature extraction strategies are not well suited for
computes the one that yields the minimal distance between        360◦ images: They use a kernel window where neighboring
them. Specifically, the DTW loss function between two            relations are established uniformly around a pixel. Instead,
time series r ∈ Rk×n and s ∈ Rk×m can be expressed               we extract features using panoramic (or spherical) convolu-
as [15]:                                                         tions [13]. Spherical convolutions are a type of dilated con-
              DTW(r, s) = minhA, ∆(r, s)i,               (4)     volutions where the relations between elements in the im-
                              A
                                                                 age are not established in image space, but in a gnomonic,
where ∆(r, s) = [δ(ri , sj )]ij ∈ Rn×m is a matrix con-          non-distorted space. These spherical convolutions can rep-
taining the distances δ(·, ·) between each pair of points in r   resent kernels as patches tangent to a sphere where the 360◦
and s, A is a binary matrix that accounts for the alignment      is reprojected.
(or correspondence) between r and s, and h·, ·i is the inner         In our problem of scanpath generation, the location of
product between both matrices.                                   the features in the image is of particular importance. There-
    In our case, r = (r1 , ..., rT ) ∈ R3×T and s =              fore, to facilitate spatial learning of the network, we use the
(s1 , ..., sT ) ∈ R3×T are two scanpaths that we wish to com-    recently presented CoordConv strategy [28], which gives
pare. While the Euclidean distance between each pair of          convolutions access to its own input coordinates by adding
points is usually employed when computing δ(ri , sj ) for        extra coordinate channels. We do this by concatenating a
Equation 4, in our scenario that would yield erroneous dis-      CoordConv layer to the input 360◦ image (see Figure 2).
tances derived from the projection of the 360◦ image (both       This layer also helps stabilize the training process, as shown
if done in 2D over the image, or in 3D with the parameteri-      in Section 4.4.
zation described in Section 3.1). We instead use the distance
over the surface of a sphere, or spherical distance, and de-     3.5. Dataset and Training Details
fine ∆sph (r, s) = [δsph (ri , sj )]ij ∈ Rn×m such that:
                                                                    We train our model using Sitzmann et al.’s [43] dataset,
 δsph (ri , sj ) =                                               composed of 22 different 360◦ images and a total of 1,980
                                                                 scanpaths from 169 different users. Each scanpath contains
             q
               1     x    x  2    y    y 2     z    z  2
 2 arcsin          (ri − sj ) + (ri − sj ) + (ri − sj ) ,        gaze information captured during 30 seconds with a binoc-
               2
                                                          (5)    ular eye tracking recorder at 120 Hz. We sample these cap-
                                                                 tured scanpaths at 1 Hz (i.e., T = 30), and reparameter-
leading to our spherical DTW:                                    ize them (Section 3.1), so that each scanpath is a sequence
                                                                 P = (P0 , ..., P29 ) ∈ R3×T . Given the relatively small size
           DTWsph (r, s) = minhA, ∆sph (r, s)i.           (6)    of the dataset, we perform data augmentation by longitu-
                              A
                                                                 dinally shifting the 360◦ images (and adjusting their scan-
We incorporate the spherical DTW to the loss function of
                                                                 paths accordingly); specifically, for each image we generate
the generator (LG , Equation 2), yielding our final generator
                                                                 six different variations with random longitudinal shifting.
loss function L∗G :
                                                                 We use 19 of the 22 images in this dataset for training, and
        L∗G = LG + λ · Ez [DTWsph (G(z, y), ρ)],          (7)    reserve three to be part of our test set (more details on the
                                                                 full test set are described in Section 4). With the data aug-
where ρ is a ground truth scanpath for the conditioning im-      mentation process, this yields 114 images in the training set.
age y, and the weight λ is empirically set to 0.1.                  During our training process we use the Adam opti-
   While a loss function incorporating DTW (or spherical         mizer [21], with constant learning rates lG = 10−4 for the
DTW) is not differentiable, a differentiable version, soft-      generator, and lD = 10−5 for the discriminator, both of
DTW, has been proposed. We use this soft-DTW in our              them with momentum = (0.5, 0.99). Further training and
model; details on it can be found in Section S1 in the sup-      implementation details can be found in the supplementary
plementary material or in the original publication [15].         material.
3.4. Model Architecture
                                                                 4. Validation and Analysis
    Both our generator and discriminator are based on a two-
branch structure (see Figure 2), with one branch for the con-       We evaluate the quality of the generated scanpaths with
ditioning image y and the other for the input vector (z in the   respect to the measured, ground truth scanpaths, as well as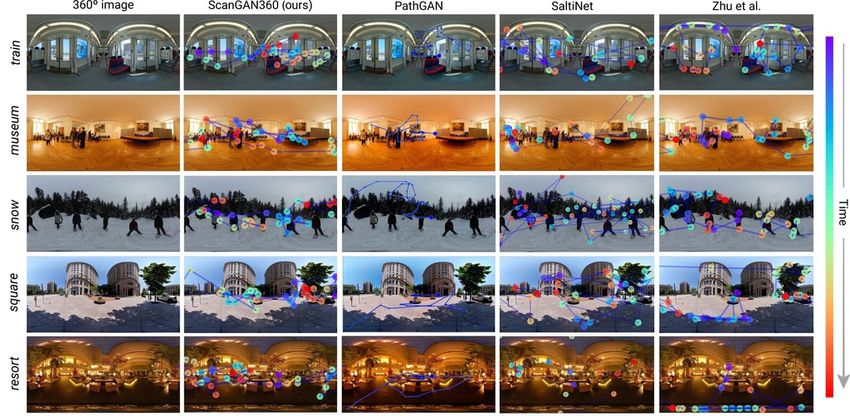
Figure 3. Results of our model for two different scenes: market and mall from Rai et al.’s dataset [39]. From left to right: 360◦ image,
ground truth sample scanpath, and three scanpaths generated by our model. The generated scanpaths are plausible and focus on relevant
parts of the scene, yet they exhibit the diversity expected among different human observers. Please refer to the supplementary material for
a larger set of results.

to other approaches. We also ablate our model to illustrate             scanpaths, and a set of generated scanpaths, we compute
the contribution of the different design choices.                       each similarity metric for all possible pairwise comparisons
    We evaluate or model on two different test sets. First,             (each generated scanpath against each of the ground truth
using the three images from Sitzmann et al.’s dataset [43]              scanpaths), and average the result. In order to provide an
left out of the training (Section 3.5): room, chess and robots.         upper baseline for each metric, we also compute the human
To ensure our model has an ability to extrapolate, we also              baseline (Human BL) [57], which is obtained by comparing
evaluate it with a different dataset from Rai et al. [39]. This         each ground truth scanpath against all the other ground truth
dataset consists of 60 scenes watched by 40 to 42 observers             ones, and averaging the results. In a similar fashion, we
for 25 seconds. Thus, when comparing to their ground truth,             compute a lower baseline based on sampling gaze points
we cut our 30-second scanpaths to the maximum length of                 randomly over the image (Random BL).
their data. Please also refer to the supplementary material
for more details on the test set, as well as further evaluation         4.2. Results
and results.                                                                Qualitative results of our model can be seen in Figures 3
                                                                        and 1 for scenes with different layouts. Figure 3, from left
4.1. Scanpath Similarity Metrics
                                                                        to right, shows: the scene, a sample ground truth (captured)
    Our evaluation is both quantitative and qualitative. Eval-          scanpath, and three of our generated scanpaths sampled
uating scanpath similarity is not a trivial task, and a num-            from the generator. Our model is able to produce plausible,
ber of metrics have been proposed in the literature, each fo-           coherent scanpaths that focus on relevant parts of the scene.
cused on a different context or aspect of gaze behavior [17].           In the generated scanpaths we observe regions where the
Proposed metrics can be roughly categorized into: (i) di-               user focuses (points of a similar color clustered together), as
rect measures based on Euclidean distance; (ii) string-based            well as more exploratory behavior. The generated scanpaths
measures based on string alignment techniques (such as the              are diverse but plausible, as one would expect if different
Levenshtein distance, LEV); (iii) curve similarity methods;             users watched the scene (the supplementary material con-
(iv) metrics from time-series analysis (like DTW, on which              tains more ground truth, measured scanpaths, showing this
our loss function is based); and (v) metrics from recurrence            diversity). Further, our model is not affected by the inherent
analysis (e.g., recurrence measure REC and determinism                  distortions of the 360◦ image. This is apparent, for exam-
measure DET). We refer the reader to supplementary mate-                ple, in the market scene: The central corridor, narrow and
rial and the review by Fahimi and Bruce [17] for an in-depth            seemingly featureless, is observed by generated virtual ob-
explanation and comparison of existing metrics. Here, we                servers. Quantitative results in Table 1 further show that our
include a subset of metrics that take into account both the             generated scanpaths are close to the human baseline (Hu-
position and the ordering of the points (namely LEV and                 man BL), both in the test set from Sitzmann et al.’s dataset,
DTW), and two metrics from recurrence analysis (REC and                 and over Rai et al.’s dataset. A value close to Human BL in-
DET), which have been reported to be discriminative in                  dicates that the generated scanpaths are as valid or as plau-
revealing viewing behaviors and patterns when comparing                 sible as the captured, ground truth ones. Note that obtaining
scanpaths. We nevertheless compute our evaluation for the               a value lower than Human BL is possible, if the generated
full set of metrics reviewed by Fahimi and Bruce [17] in the            scanpaths are on average closer to the ground truth ones,
supplementary material.                                                 and exhibit less variance.
    Since for each image we have a number of ground truth                   Since our model is generative, it can generate as many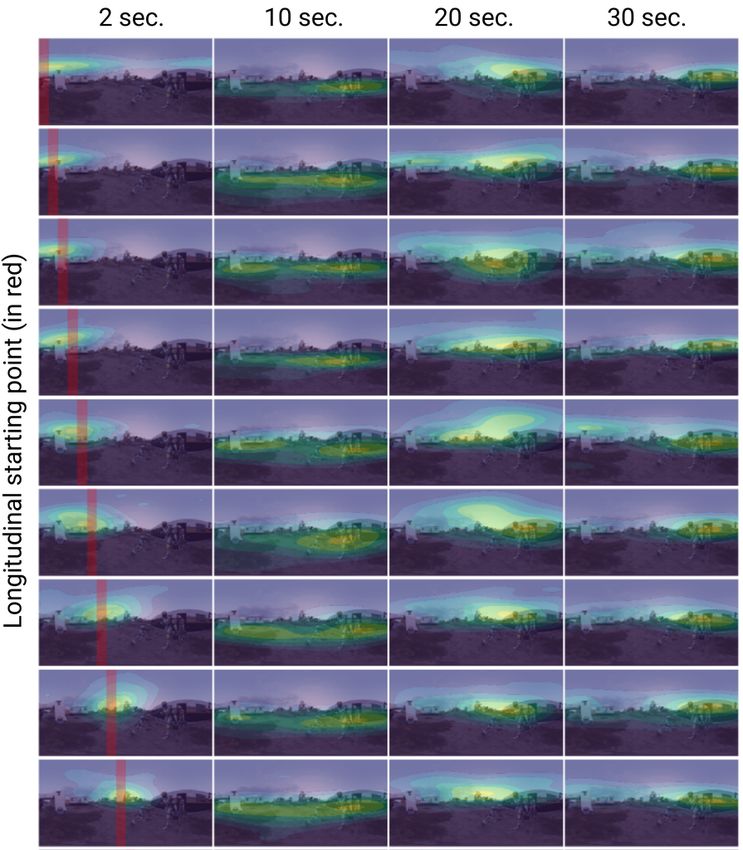
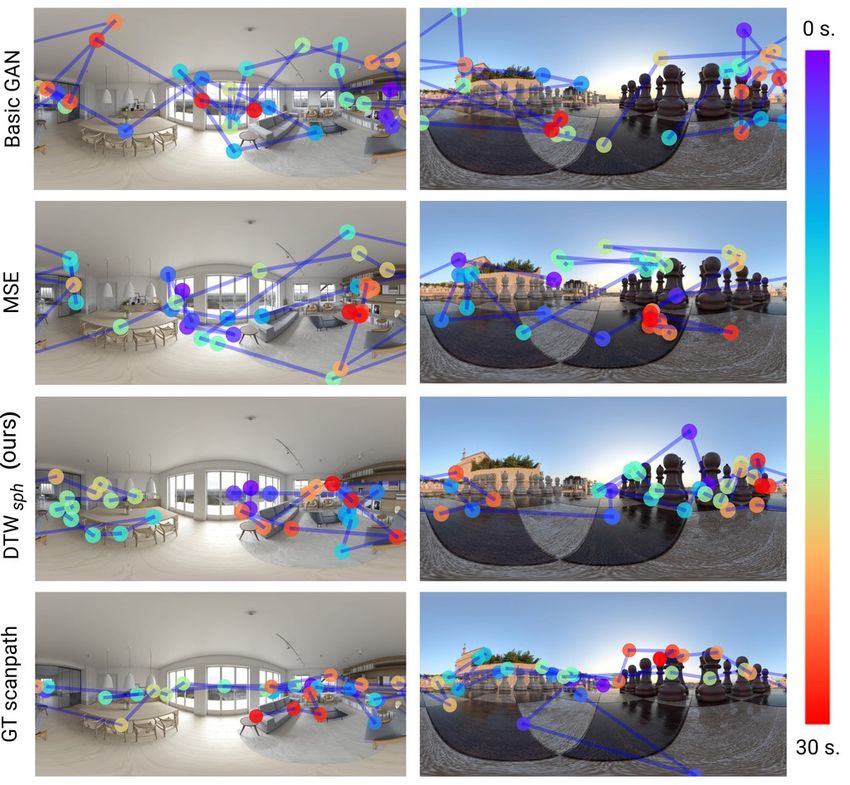
Figure 4. Qualitative comparison to previous methods for five different scenes from Rai et al.’s dataset. In each row, from left to right:
360◦ image, and a sample scanpath obtained with our method, PathGAN [3], SaltiNet [4], and Zhu et al.’s [62]. Note that, in the case
of PathGAN, we are including the results directly taken from their paper, thus the different visualization. Our method produces plausible
scanpaths focused on meaningful regions, in comparison with other techniques. Please see text for details, and the supplementary material
for a larger set of results, also including ground truth scanpaths.

scanpaths as needed and model many different potential ob-              sults closer to the ground truth scanpaths than Zhu et al.’s
servers. We perform our evaluations on a random set of 100              and SaltiNet. The latter is based on a saliency-sampling
scanpaths generated by our model. We choose this num-                   strategy, and thus these results indicate that indeed the tem-
ber to match the number of generated scanpaths available                poral information learnt by our model is relevant for the fi-
for competing methods, to perform a fair comparison. Nev-               nal result. Our model, as expected, also amply surpasses the
ertheless, we have analyzed the stability of our generative             random baseline. In Figure 4 we see how PathGAN scan-
model by computing our evaluation metrics for a variable                paths fail to focus on the relevant parts of the scene (see,
number of generated scanpaths: Our results are very sta-                e.g., snow or square), while SaltiNet exhibits a somewhat
ble with the number of scanpaths (please see Table 2 in the             erratic behavior, with large displacements and scarce areas
supplementary material).                                                of focus (train, snow or square show this). Finally, Zhu
                                                                        et al.’s approach tends to place gaze points at high contrast
4.3. Comparison to Other Methods                                        borders (see, e.g., square or resort).

   We compare ScanGAN360 to three methods devoted to
                                                                        4.4. Ablation Studies
scanpath prediction in 360◦ images: SaltiNet-based scan-
path prediction [2, 4] (we will refer to it as SaltiNet in the             We also evaluate the contribution of different elements of
following), PathGAN [3] and Zhu et al.’s method [62]. For               our model to the final result. For this purpose, we analyze
comparisons to SaltiNet we use the public implementation                a standard GAN strategy (i.e., using only the discriminative
of the authors, while the authors of Zhu et al. kindly pro-             loss), as the baseline. Figure 5 shows how the model is un-
vided us with the results of their method for the images from           able to learn both the temporal nature of the scanpaths, and
Rai et al.’s dataset (but not for Sitzmann et al.’s); we there-         their relation to image features. We also analyze the results
fore have both qualitative (Figure 4) and quantitative (Ta-             yielded by adding a term based on the MSE between the
ble 1) comparisons to these two methods. In the case of                 ground truth and the generated scanpath to the loss function,
PathGAN, no model or implementation could be obtained,                  instead of our DTWsph term (the only previous GAN ap-
so we compare qualitatively to the results extracted from               proach for scanpath generation [3] relied on MSE for their
their paper (Figure 4, third column).                                   loss term). The MSE only measures a one-to-one corre-
   Table 1 shows that our model consistently provides re-               spondence between points, considering for each time instant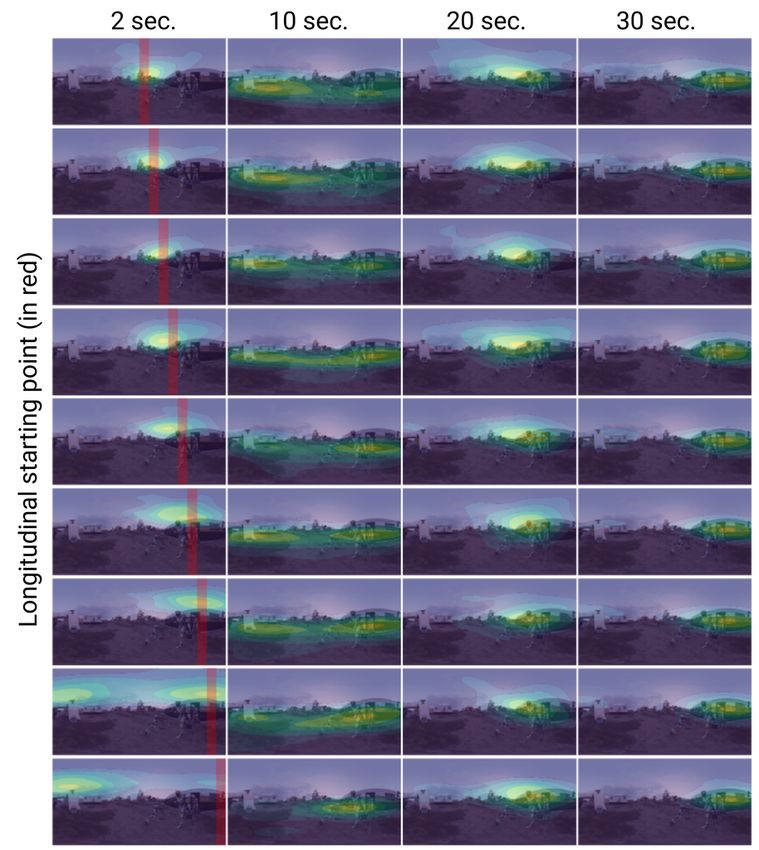
Table 2. Quantitative results of our ablation study. Arrows indi-
                                                                         cate whether higher or lower is better, and boldface highlights the
                                                                         best result for each metric (excluding the ground truth Human BL).
                                                                         Please refer to the text for details on the ablated models.
                                                                                   Metric               LEV ↓   DTW ↓      REC ↑    DET ↑
                                                                                 Basic GAN              49.42   2088.44     3.01     1.74
                                                                                    MSE                 48.90   1953.21     2.41     1.73
                                                                           DTWsph (no CoordConv)        47.82   1988.38     3.67     1.99
                                                                               DTWsph (ours)            46.19   1925.20     4.50    2.33
                                                                          Human Baseline (Human BL)     43.11   1843.72     7.81     4.07

                                                                         4.5. Behavioral Evaluation
                                                                             While the previous subsections employ well-known met-
                                                                         rics from the literature to analyze the performance of our
                                                                         model, in this subsection we perform a higher-level analysis
                                                                         of its results. We assess whether the behavioral characteris-
                                                                         tics of our scanpaths match those which have been reported
                                                                         from actual users watching 360◦ images.
Figure 5. Qualitative ablation results. From top to bottom: ba-
sic GAN strategy (baseline); adding MSE to the loss function of
the former; our approach; and an example ground truth scanpath.
                                                                         Exploration time Sitzmann et al. [43] measure the explo-
These results illustrate the need for our DTWsph loss term.              ration time as the average time that users took to move their
                                                                         eyes to a certain longitude relative to their starting point,
                                                                         and measure how long it takes for users to fully explore the
                                                                         scene. Figure 6 (left) shows this exploration time, measured
Table 1. Quantitative comparisons of our model against
SaltiNet [4] and Zhu et al. [62]. We also include upper (human
                                                                         by Sitzmann et al. from captured data, for the three scenes
baseline, Human BL) and lower (randomly sampling over the im-            from their dataset included in our test set (room, chess, and
age, Random BL) baselines. Arrows indicate whether higher or             robots). To analyze whether our generated scanpaths mimic
lower is better, and boldface highlights the best result for each met-   this behavior and exploration speed, we plot the exploration
ric (excluding the ground truth Human BL). ∗ SaltiNet is trained         time of our generated scanpaths (Figure 6, center left) for
with Rai et al.’s dataset; we include it for completeness.               the same scenes and number of scanpaths. We can see how
                                                                         the speed and exploration time are very similar between
    Dataset              Method        LEV ↓   DTW ↓     REC ↑   DET ↑
                      Random BL        52.33   2370.56    0.47    0.93   real and generated data. Individual results per scene can
  Test set from         SaltiNet       48.00   1928.85    1.45    1.78   be found in the supplementary material.
 Sitzmann et al.   ScanGAN360 (ours)   46.15   1921.95    4.82    2.32
                       Human BL        43.11   1843.72    7.81    4.07
                      Random BL        43.11   1659.75    0.21    0.94   Fixation bias Similar to the center bias of human eye fix-
   Rai et al.’s         SaltiNet∗      48.07   1928.41    1.43    1.81
    dataset            Zhu et al.      43.55   1744.20    1.64    1.50   ations observed in regular images [20], the existence of a
                   ScanGAN360 (ours)   40.99   1549.59    1.72    1.87   Laplacian-like equator bias has been measured in 360◦ im-
                       Human BL        39.59   1495.55    2.33    2.31
                                                                         ages [43]: The majority of fixations fall around the equa-
                                                                         tor, in detriment of the poles. We have evaluated whether
                                                                         the distribution of scanpaths generated by our model also
a single point, unrelated to the rest. This hinders the learn-           presents this bias. This is to be expected, since the data our
ing process, leading to non-plausible results (Figure 5, sec-            model is trained with exhibits it, but is yet another indicator
ond row). This behavior is corrected when our DTWsph is                  that we have succeeded in learning the ground truth distri-
added instead, since it is specifically targeted for time series         bution. We test this by generating, for each scene, 1,000
data and takes into account the actual spatial structure of the          different scanpaths with our model, and aggregating them
data (Figure 5, third row). The corresponding quantitative               over time to produce a pseudo-saliency map, which we term
measures over our test set from Sitzmann et al. can be found             aggregate map. Figure 6 (right) shows this for two scenes
in Table 2. We also analyze the effect of removing the Co-               in our test set: We can see how this equator bias is indeed
ordConv layer from our model: Results in Table 2 indicate                present in our generated scanpaths.
that the use of CoordConv does have a positive effect on the
results, helping learn the transformation from the input to              Inter-observer congruency It is common in the literature
the target domain.                                                       analyzing users’ gaze behavior to measure inter-observer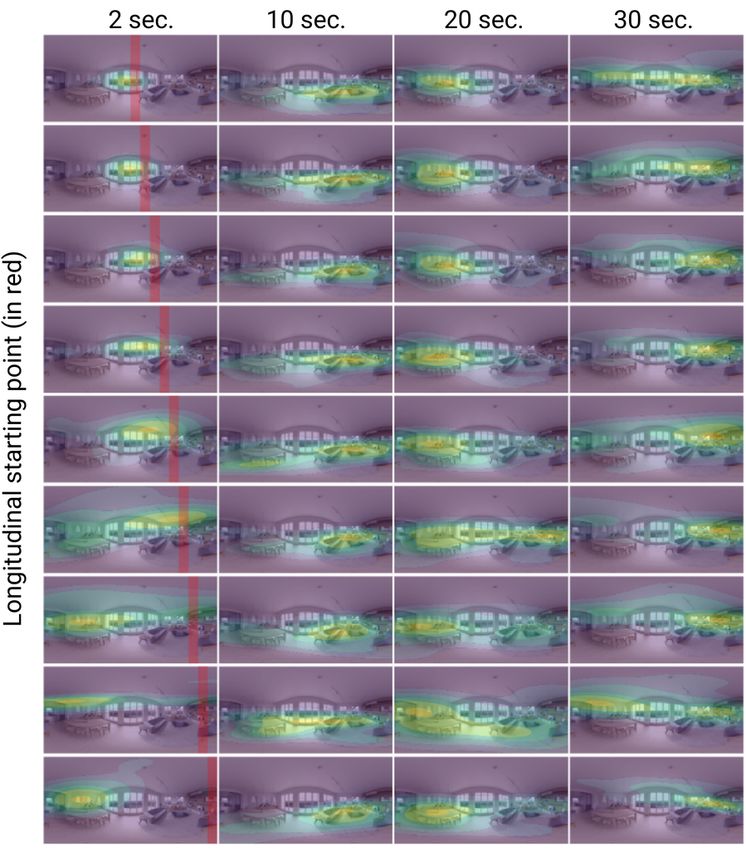
Figure 6. Behavioral evaluation. Left: Exploration time for real captured data (left) and scanpaths generated by our model (center left).
Speed and exploration time of our scanpaths are on par with that of real users. Center right: ROC curve of our generated scanpaths for
each individual test scene (gray), and averaged across scenes (magenta). The faster it converges to the maximum rate, the higher the
inter-observer congruency. Right: Aggregate maps for two different scenes, computed as heatmaps from 1,000 generated scanpaths. Our
model is able to produce aggregate maps that focus on relevant areas of the scenes and exhibit the equator bias reported in the literature.

congruency, often by means of a receiver operating char-                approaches. We further explore applications of our model:
acteristic (ROC) curve. We compute the congruency of our                Please refer to the supplementary material for a description
“generated observers” through this ROC curve for the three              and examples of these.
scenes in our test set from the Sitzmann et al. dataset (Fig-              Our GAN approach is well suited for the problem of
ure 6, center right). The curve calculates the ability of the           scanpath generation: A single ground truth scanpath does
ith scanpath to predict the aggregate map of the correspond-            not exist, yet real scanpaths follow certain patterns that
ing scene. Each point in the curve is computed by gener-                are difficult to model explicitly but that are automatically
ating a map containing the top n% most salient regions of               learned by our approach. Note that our model is also very
the aggregate map (computed without the ith scanpath), and              fast and can produce about 1,000 scanpaths per second.
calculating the percentage of gaze points of the ith scanpath           This may be a crucial capability for interactive applications:
that fall into that map. Our ROC curve indicates a strong               our model can generate virtual observers in real time.
agreement between our scanpaths, with around 75% of all
gaze points falling within 25% of the most salient regions.             Limitations and future work Our model is trained with
These values are comparable to those measured in previous               30-second long scanpaths, sampled at 1 Hz. Although
studies with captured gaze data [43, 23].                               this is significantly longer than most previous approaches
                                                                        [16, 23, 27], exploring different or variable lengths or sam-
Temporal and spatial coherence Our generated scan-                      pling rates remains interesting for future work. When train-
paths have a degree of stochasticity, to be able to model the           ing our model, we focus on learning higher-level aspects of
diversity of real human observers. However, human gaze                  visual behavior, and we do not explicitly enforce low-level
behavior follows specific patterns, and each gaze point is              ocular movements (e.g., fixations or saccades). Currently,
conditioned not only by the features in the scene but also by           our relatively low sampling rate prevents us from model-
the previous history of gaze points of the user. If two users           ing very fast dynamic phenomena, such as saccades. Yet,
start watching a scene in the same region, a certain degree             fixation patterns naturally emerge in our results, and future
of coherence between their scanpaths is expected, that may              work could explicitly take low-level oculomotor aspects of
diverge more as more time passes. We analyze the temporal               visual search into account.
coherence of generated scanpaths that start in the same re-                 The model, parameterization, and loss function are tai-
gion, and observe that indeed our generated scanpaths fol-              lored to 360◦ images. In a similar spirit, a DTW-based loss
low a coherent pattern. Please refer to the supplementary               function could also be applied to conventional 2D images
for more information on this part of the analysis.                      (using an Euclidean distance in 2D instead of our δsph ), po-
                                                                        tentially leading to better results than current 2D approaches
5. Conclusion                                                           based on mean-squared error.
                                                                            We believe that our work is a timely effort and a first step
   In summary, we propose ScanGAN360, a conditional                     towards understanding and modeling dynamic aspects of at-
GAN approach to generating gaze scanpaths for immersive                 tention in 360◦ images. We hope that our work will serve
virtual environments. Our unique parameterization tailored              as a basis to advance this research, both in virtual reality
to panoramic content, coupled with our novel usage of a                 and in conventional imagery, and extend it to other scenar-
DTW loss function, allow our model to generate scanpaths                ios, such as dynamic or interactive content, analyzing the
of significantly higher quality and duration than previous              influence of the task, including the presence of motion par-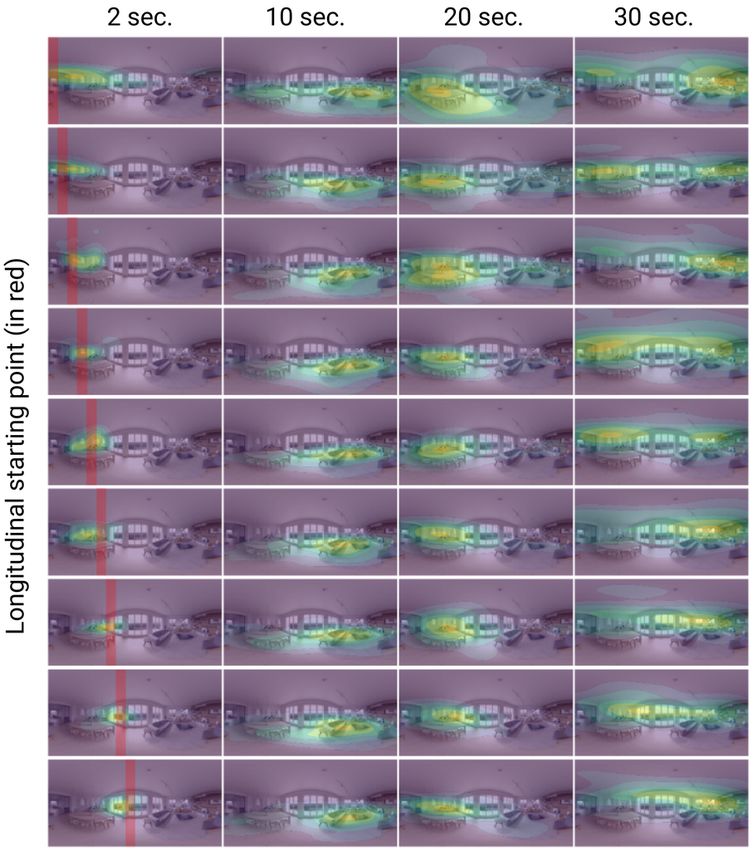
allax, or exploring multimodal experiences. We will make               [14] Marcella Cornia, Lorenzo Baraldi, Giuseppe Serra, and Rita
our model and training code available in order to facilitate                Cucchiara. Predicting human eye fixations via an lstm-based
the exploration of these and other possibilities.                           saliency attentive model. IEEE Transactions on Image Pro-
                                                                            cessing, 27(10):5142–5154, 2018. 2
References                                                             [15] Marco Cuturi and Mathieu Blondel. Soft-dtw: a dif-
                                                                            ferentiable loss function for time-series. arXiv preprint
 [1] Elena Arabadzhiyska, Okan Tarhan Tursun, Karol                         arXiv:1703.01541, 2017. 4, 1
     Myszkowski, Hans-Peter Seidel, and Piotr Didyk. Saccade           [16] Stephen R Ellis and James Darrell Smith. Patterns of sta-
     landing position prediction for gaze-contingent rendering.             tistical dependency in visual scanning. Eye movements and
     ACM Transactions on Graphics (TOG), 36(4):1–12, 2017. 5                human information processing, pages 221–238, 1985. 2, 8
 [2] Marc Assens, Xavier Giro-i Nieto, Kevin McGuinness, and           [17] Ramin Fahimi and Neil DB Bruce. On metrics for measuring
     Noel E O’Connor. Saltinet: Scan-path prediction on 360                 scanpath similarity. Behavior Research Methods, pages 1–
     degree images using saliency volumes. In Proceedings of                20, 2020. 5, 2
     the IEEE ICCV Workshops, pages 2331–2338, 2017. 1, 2, 6,
                                                                       [18] Kaye Horley, Leanne M Williams, Craig Gonsalvez, and
     4
                                                                            Evian Gordon. Face to face: visual scanpath evidence for
 [3] Marc Assens, Xavier Giro-i Nieto, Kevin McGuinness, and
                                                                            abnormal processing of facial expressions in social phobia.
     Noel E O’Connor. Pathgan: visual scanpath prediction with
                                                                            Psychiatry research, 127(1-2):43–53, 2004. 1
     generative adversarial networks. In Proceedings of the Eu-
                                                                       [19] Laurent Itti, Christof Koch, and Ernst Niebur. A model
     ropean Conference on Computer Vision (ECCV), pages 0–0,
                                                                            of saliency-based visual attention for rapid scene analysis.
     2018. 1, 2, 6, 4
                                                                            IEEE Transactions on pattern analysis and machine intelli-
 [4] Marc Assens, Xavier Giro-i Nieto, Kevin McGuinness, and
                                                                            gence, 20(11):1254–1259, 1998. 2
     Noel E O’Connor. Scanpath and saliency prediction on 360
                                                                       [20] Tilke Judd, Krista Ehinger, Frédo Durand, and Antonio Tor-
     degree images. Signal Processing: Image Communication,
                                                                            ralba. Learning to predict where humans look. In IEEE
     69:8–14, 2018. 1, 2, 6, 7
                                                                            ICCV, pages 2106–2113. IEEE, 2009. 2, 7
 [5] Wentao Bao and Zhenzhong Chen. Human scanpath predic-
     tion based on deep convolutional saccadic model. Neuro-           [21] Diederik P. Kingma and Jimmy Ba. Adam: A method for
     computing, 404:154 – 164, 2020. 2                                      stochastic optimization. In ICLR, 2014. Last updated in
                                                                            arXiv in 2017. 4
 [6] Mathieu Blondel, Arthur Mensch, and Jean-Philippe Vert.
     Differentiable divergences between time series.           arXiv   [22] Matthias Kümmerer, Thomas S. A. Wallis, and Matthias
     preprint arXiv:2010.08354, 2020. 1                                     Bethge.      Deepgaze ii: Reading fixations from deep
 [7] A. Borji. Boosting bottom-up and top-down visual features              features trained on object recognition. arXiv preprint
     for saliency estimation. In 2012 IEEE Conference on Com-               arXiv:1610.01563, 2016. 2
     puter Vision and Pattern Recognition, 2012. 2                     [23] O. Le Meur and T. Baccino. Methods for comparing scan-
 [8] Zoya Bylinskii, Tilke Judd, Ali Borji, Laurent Itti, Frédo Du-        paths and saliency maps: strengths and weaknesses. Behav-
     rand, Aude Oliva, and Antonio Torralba. Mit saliency bench-            ior Research Methods, pages 251–266, 2013. 8
     mark. http://saliency.mit.edu/, 2019. 2                           [24] Olivier Le Meur and Zhi Liu. Saccadic model of eye move-
 [9] Ying Cao, Rynson WH Lau, and Antoni B Chan. Look over                  ments for free-viewing condition. Vision Research, 116:152
     here: Attention-directing composition of manga elements.               – 164, 2015. 2
     ACM Trans. Graph., 33(4):1–11, 2014. 2, 3                         [25] Chenge Li, Weixi Zhang, Yong Liu, and Yao Wang. Very
[10] Chien-Yi Chang, De-An Huang, Yanan Sui, Li Fei-Fei, and                long term field of view prediction for 360-degree video
     Juan Carlos Niebles. D3tw: Discriminative differentiable dy-           streaming. In 2019 IEEE Conference on Multimedia Infor-
     namic time warping for weakly supervised action alignment              mation Processing and Retrieval (MIPR), pages 297–302.
     and segmentation. In Proceedings of the IEEE/CVF Confer-               IEEE, 2019. 2
     ence on Computer Vision and Pattern Recognition (CVPR),           [26] Suiyi Ling, Jesús Gutiérrez, Ke Gu, and Patrick Le Callet.
     June 2019. 1                                                           Prediction of the influence of navigation scan-path on per-
[11] Fang-Yi Chao, Lu Zhang, Wassim Hamidouche, and Olivier                 ceived quality of free-viewpoint videos. IEEE Journal on
     Deforges. Salgan360: Visual saliency prediction on 360 de-             Emerging and Sel. Topics in Circ. and Sys., 9(1):204–216,
     gree images with generative adversarial networks. In 2018              2019. 2
     IEEE Int. Conf. on Multim. & Expo Workshops (ICMEW),              [27] Huiying Liu, Dong Xu, Qingming Huang, Wen Li, Min Xu,
     pages 01–04. IEEE, 2018. 2                                             and Stephen Lin. Semantically-based human scanpath esti-
[12] Alex Colburn, Michael F Cohen, and Steven Drucker. The                 mation with hmms. In Proceedings of the IEEE International
     role of eye gaze in avatar mediated conversational interfaces.         Conference on Computer Vision, pages 3232–3239, 2013. 2,
     Technical report, Citeseer, 2000. 2                                    8
[13] Benjamin Coors, Alexandru Paul Condurache, and An-                [28] Rosanne Liu, Joel Lehman, Piero Molino, Felipe Petroski
     dreas Geiger. Spherenet: Learning spherical representations            Such, Eric Frank, Alex Sergeev, and Jason Yosinski. An in-
     for detection and classification in omnidirectional images.            triguing failing of convolutional neural networks and the co-
     In Proc. of the European Conference on Computer Vision                 ordconv solution. In Neural information processing systems,
     (ECCV), pages 518–533, 2018. 1, 4                                      pages 9605–9616, 2018. 4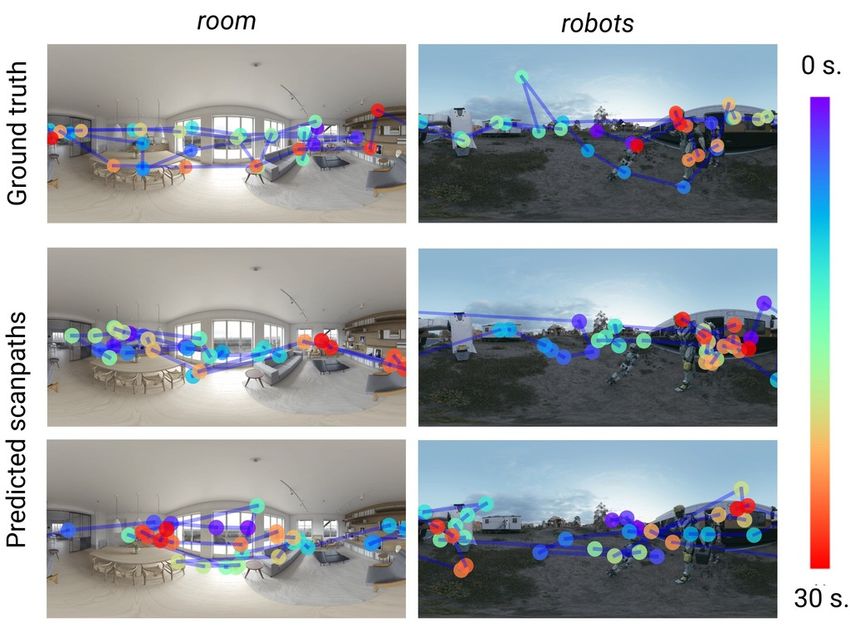
[29] Y. Lu, W. Zhang, C. Jin, and X. Xue. Learning attention map       [44] Mikhail Startsev and Michael Dorr. 360-aware saliency esti-
     from images. In 2012 IEEE Conference on Computer Vision                mation with conventional image saliency predictors. Signal
     and Pattern Recognition, 2012. 2                                       Proces.: Image Comm., 69:43–52, 2018. 2
[30] Daniel Martin, Sandra Malpica, Diego Gutierrez, Belen Ma-         [45] Yu-Chuan Su and Kristen Grauman. Making 360 video
     sia, and Ana Serrano. Multimodality in VR: A survey. arXiv             watchable in 2d: Learning videography for click free view-
     preprint arXiv:2101.07906, 2021. 2                                     ing. In 2017 IEEE Conference on Computer Vision and Pat-
[31] Daniel Martin, Ana Serrano, and Belen Masia. Panoramic                 tern Recognition (CVPR), pages 1368–1376. IEEE, 2017. 3
     convolutions for 360◦ single-image saliency prediction. In        [46] Yu-Chuan Su, Dinesh Jayaraman, and Kristen Grauman.
     CVPR Workshop on CV for AR/VR, 2020. 1, 2                              Pano2vid: Automatic cinematography for watching 360◦
[32] Mehdi Mirza and Simon Osindero. Conditional generative                 videos. In Asian Conf. on CV, pages 154–171. Springer,
     adversarial nets. arXiv preprint arXiv:1411.1784, 2014. 3              2016. 3
[33] Rafael Monroy, Sebastian Lutz, Tejo Chalasani, and Aljosa         [47] Benjamin W Tatler and Benjamin T Vincent. The promi-
     Smolic. Salnet360: Saliency maps for omni-directional im-              nence of behavioural biases in eye guidance. Visual Cogni-
     ages with cnn. Signal Processing: Image Communication,                 tion, 17(6-7):1029–1054, 2009. 2
     69:26 – 34, 2018. 2                                               [48] Hamed Rezazadegan Tavakoli, Esa Rahtu, and Janne
[34] Meinard Müller. Dynamic time warping. Information re-                 Heikkilä. Stochastic bottom–up fixation prediction and sac-
     trieval for music and motion, pages 69–84, 2007. 3, 1                  cade generation. Image and Vision Computing, 31(9):686–
[35] Anh Nguyen, Zhisheng Yan, and Klara Nahrstedt. Your at-                693, 2013. 2
     tention is unique: Detecting 360-degree video saliency in         [49] Antonio Torralba, Aude Oliva, Monica S Castelhano, and
     head-mounted display for head movement prediction. In                  John M Henderson. Contextual guidance of eye movements
     Proc. ACM Intern. Conf. on Multimedia, pages 1190–1198,                and attention in real-world scenes: the role of global features
     2018. 2                                                                in object search. Psychological review, 113(4):766, 2006. 2
[36] Junting Pan, Cristian Canton, Kevin McGuinness, Noel E.           [50] Eleonora Vig, Michael Dorr, and David Cox. Large-scale
     O’Connor, Jordi Torres, Elisa Sayrol, and Xavier and Giro-             optimization of hierarchical features for saliency prediction
     i Nieto. Salgan: Visual saliency prediction with generative            in natural images. In Proceedings of the IEEE Conference
     adversarial networks. 2018. 2                                          on Computer Vision and Pattern Recognition (CVPR), June
[37] Junting Pan, Elisa Sayrol, Xavier Giro-i Nieto, Kevin                  2014. 2
     McGuinness, and Noel E. O’Connor. Shallow and deep con-           [51] LE Vincent and Nicolas Thome. Shape and time distortion
     volutional networks for saliency prediction. In The IEEE               loss for training deep time series forecasting models. In
     Conference on Computer Vision and Pattern Recognition                  Advances in neural information processing systems, pages
     (CVPR), June 2016. 2                                                   4189–4201, 2019. 1
[38] Xufang Pang, Ying Cao, Rynson WH Lau, and Antoni B                [52] Dirk Walther and Christof Koch. Modeling attention to
     Chan. Directing user attention via visual flow on web de-              salient proto-objects. Neural Networks, 19:1395–1407,
     signs. ACM Trans. on Graph., 35(6):1–11, 2016. 2, 3                    2006. 2
[39] Yashas Rai, Jesús Gutiérrez, and Patrick Le Callet. A dataset   [53] Wenguan Wang and Jianbing Shen. Deep visual atten-
     of head and eye movements for 360 degree images. In Pro-               tion prediction. IEEE Transactions on Image Processing,
     ceedings of the 8th ACM on Multimedia Systems Conference,              27(5):2368–2378, 2017. 2
     pages 205–210, 2017. 2, 5, 1                                      [54] W. Wang and J. Shen. Deep visual attention prediction. IEEE
[40] Kerstin Ruhland, Christopher E Peters, Sean Andrist,                   Transactions on Image Processing, 27(5):2368–2378, 2018.
     Jeremy B Badler, Norman I Badler, Michael Gleicher, Bilge              2
     Mutlu, and Rachel McDonnell. A review of eye gaze in              [55] Wenguan Wang, Jianbing Shen, Xingping Dong, and Ali
     virtual agents, social robotics and hci: Behaviour genera-             Borji. Salient object detection driven by fixation prediction.
     tion, user interaction and perception. In Computer graph-              In Proceedings of the IEEE Conference on Computer Vision
     ics forum, volume 34, pages 299–326. Wiley Online Library,             and Pattern Recognition (CVPR), June 2018. 2
     2015. 4                                                           [56] Chenglei Wu, Ruixiao Zhang, Zhi Wang, and Lifeng Sun. A
[41] Matan Sela, Pingmei Xu, Junfeng He, Vidhya Naval-                      spherical convolution approach for learning long term view-
     pakkam, and Dmitry Lagun. Gazegan-unpaired adversar-                   port prediction in 360 immersive video. In Proceedings of
     ial image generation for gaze estimation. arXiv preprint               the AAAI Conference on Artificial Intelligence, volume 34,
     arXiv:1711.09767, 2017. 2                                              pages 14003–14040, 2020. 2
[42] Ana Serrano, Vincent Sitzmann, Jaime Ruiz-Borau, Gordon           [57] Chen Xia, Junwei Han, Fei Qi, and Guangming Shi. Pre-
     Wetzstein, Diego Gutierrez, and Belen Masia. Movie edit-               dicting human saccadic scanpaths based on iterative repre-
     ing and cognitive event segmentation in virtual reality video.         sentation learning. IEEE Transactions on Image Processing,
     ACM Trans. Graph. (SIGGRAPH), 36(4), 2017. 1                           28(7):3502–3515, 2019. 5
[43] Vincent Sitzmann, Ana Serrano, Amy Pavel, Maneesh                 [58] M. Xu, Y. Song, J. Wang, M. Qiao, L. Huo, and Z. Wang.
     Agrawala, Diego Gutierrez, Belen Masia, and Gordon Wet-                Predicting head movement in panoramic video: A deep re-
     zstein. Saliency in VR: How do people explore virtual                  inforcement learning approach. IEEE Transactions on Pat-
     environments? IEEE Trans. on Vis. and Comp. Graph.,                    tern Analysis and Machine Intelligence, 41(11):2693–2708,
     24(4):1633–1642, 2018. 1, 2, 4, 5, 7, 8, 3                             2019. 2
[59] Chuan Yang, Lihe Zhang, Ruan Lu, Huchuan, Xiang, and
Ming-Hsuan Yang. Saliency detection via graph-based man-
ifold ranking. In Computer Vision and Pattern Recogni-
tion (CVPR), 2013 IEEE Conference on, pages 3166–3173.
IEEE, 2013. 2
[60] Kiwon Yun, Yifan Peng, Dimitris Samaras, Gregory J Zelin-
sky, and Tamara L Berg. Exploring the role of gaze behavior
and object detection in scene understanding. Frontiers in
psychology, 4:917, 2013. 1
[61] Qi Zhao and Christof Koch. Learning a saliency map using
fixated locations in natural scenes. Journal of Vision, 11:9,
2011. 2
[62] Yucheng Zhu, Guangtao Zhai, and Xiongkuo Min. The pre-
diction of head and eye movement for 360 degree images.
Signal Processing: Image Communication, 69:15–25, 2018.
1, 2, 6, 7, 4Supplementary Material
This document offers additional information and details
on the following topics:
• (S1) Extended description of the soft-DTW (differen-
tiable version of DTW) distance metric used in our
model.
Figure 7. Simple visualization of dynamic time warping (DTW)
• (S2) Additional results (scanpaths generated with our alignment. Instead of assuming a pair-wise strict correspondence,
method) for different scenes used in our evaluation in DTW optimizes the alignment between two sequences to minimize
the main paper. their distance.
• (S3) Additional ground truth scanpaths for the scenes
used in our evaluation in the main paper. In our case, r = (r1 , ..., rT ) ∈ R3×T and s = (s1 , ..., sT ) ∈
R3×T are two scanpaths that we wish to compare.
• (S4) Further details on our training process. The main difference lies in the replacement of the minA
with the minA γ function, which is defined as follows:
• (S5) Further details on metrics and evaluation, includ-
ing a larger set of metrics (which we briefly introduce),
and extended analysis. mini≤n ai , γ=0
minγ (a1 , ..., aN ) = Pi=1 −ai /γ (9)
−γ log n e , γ>0
• (S6) Further details on the behavioral evaluation of our
scanpaths. This soft-min function allows DTW to be differentiable,
with the γ parameter adjusting the similarity between the
• (S7) Example applications of our method. soft implementation and the original DTW algorithm, both
being the same when γ = 0.
S1. Differentiable Dynamic Time Warping:
soft-DTW S2. Additional Results
One of the key aspects of our framework relies in the We include in this section a more extended set of results.
addition of a second term to the generator’s loss function, First, we include results for the scenes room (see Figures 17
based on dynamic time warping [34]. As pointed in Section to 20), chess (see Figures 21 to 24), and robots (see Fig-
3.3 in the main paper, dynamic time warping (DTW) mea- ures 25 to 28) from the Sitzmann et al. dataset [43]. Then,
sures the similarity between two temporal sequences (see we include results for the five scenes from the Rai et al.
Figure 71 , Equation 5 in the main paper for the original dataset [39] used in comparisons throughout the main pa-
DTW formulation, and Equations 6 and 7 in the main pa- per: train (see Figures 29 to 32), resort (see Figures 33
per for our spherical modification on DTW). However, the to 36), square (see Figures 37 to 40), snow (see Figures 41
original DTW function is not differentiable, therefore it is to 44), and museum (see Figures 45 to 48).
not suitable as a loss function. Instead, we use a differen-
tiable version of it, soft-DTW, which has been recently pro- S3. Ground Truth Scanpaths for Comparison
posed [15] and used as a loss function in different problems Scenes
dealing with time series [6, 10, 51].
Differently from the original DTW formulation (Equa- We include in Figures 49 to 53 sets of ground truth scan-
tion 5 in the main paper), the soft-DTW is defined as fol- paths for all the images shown in Figure 4 in the main pa-
lows: per, which is devoted to comparisons of our method against
other models; and in Figures 54 to 56 sets of ground truth
soft-DTWγ (r, s) = minγ hA, ∆(r, s)i, (8) scanpaths for the three images from our test set from Sitz-
A mann et al.’s dataset.
where, as with traditional DTW, ∆(r, s) = [δ(ri , sj ]ij ∈
Rn×m is a matrix containing the distances δ(·, ·) between S4. Additional Details on our Training Process
each pair of points in r and s, A is a binary matrix that In addition to the details commented in Section 3.5 in
accounts for the alignment (or correspondence) between r the main paper, our generator trains two cycles per discrim-
and s, and h·, ·i is the inner product between both matrices. inator cycle, to avoid the latter from surpassing the former.
1 https://databricks.com/blog/2019/04/30/understanding-dynamic- To enhance the training process, we also resort to a mini-
time-warping.html batching strategy: Instead of inputting to our model a setcontaining all available scanpaths for a given image, we • Determinism: Percentage of cross-recurrent points that
split our data in different mini-batches of eight scanpaths form diagonal lines (i.e., percentage of gaze trajecto-
each. This way, the same image is input in our network mul- ries common to both scanpaths).
tiple times per epoch, also allowing more images to be in-
cluded in the same batch, and therefore enhancing the train- • Laminarity: Measures locations that were fixated in
ing process. We trained our model for 217 epochs, as we detail in one of the scanpaths, but only fixated briefly
found that epoch to yield the better evaluation results. in the other scanpath. This way, it indicates whether
specific areas of a scene are repeatedly fixated.
S5. Additional Details on Metrics and Evalua-
tion • Center of recurrence mass: Defined as the distance of
the center of gravity from the main diagonal, indicates
Throughout this work, we evaluate our model and com- the dominant lag of cross recurrences, i.e., whether the
pare to state-of-the-art works by means of several widely same gaze point in both scanpaths tends to occur close
used metrics, recently reviewed by Fahimi and Bruce [17]. in time.
Table 3 shows a list of these metrics, indicating which ones
take into account position and/or order of gaze points. In
the following, we briefly introduce these metrics (please re- Table 3. Set of metrics to quantitatively evaluate scanpath similar-
ity [17]. Each metric specializes in specific aspects of the scan-
fer to Fahimi and Bruce [17] for a formal description):
paths, and as a result using any of them in isolation may not be
representative.
• Levenshtein distance: Transforms scanpaths into
strings, and then calculates the minimum number of Metric Abrv Position Order
single-character edits (insertions, deletions, or substi- Levenshtein distance LEV 3 3
tutions) required to change one string (scanpath) into ScanMatch SMT 3 3
the other. All edits costs are treated equally. Hausdorff distance HAU 3 7
• ScanMatch: Improved version of Levenshtein dis- Frechet distance FRE 3 3
tance. Different from Levenshtein distance, Scan- Dynamic time warping DTW 3 3
Match takes into account semantic information (as a Time delay embedding TDE 3 7
score matrix), and can even take into account duration Recurrence REC 3 7
of data points. This way, each of the edit operations Determinism DET 7 3
can be differently weighted. Laminarity LAM 7 7
Center of recurrence mass COR 7 7
• Hausdorff distance: Represents the degree of mis-
match between two sets by measuring the farthest spa-
Our model is stochastic by nature. This means that the
tial distance from one set to the other, i.e., the distance
scanpaths that it generates for a given scene are always dif-
between two different curves.
ferent, simulating observer variability. We have analyzed
• Frechet distance: Similar to Hausdorff distance, it whether the reported metrics vary depending on the num-
measures the similarity between curves. However, ber of scanpaths generated, to asses the stability and overall
Frechet disatance takes into account both the position goodness of our model. Results can be seen in Table 4
and ordering of all the points in the curves. We include in Table 5 the evaluation results with the full
set of metrics shown in Table 3 (extension to Table 1 in the
• Dynamic time warping: Metric that compares two main paper), and in Tables 6 and 7 the evaluation results of
time-series with varying (and differing) lengths to our ablation studies over the full set of metrics (extension to
find an optimal path to match both sequences while Table 2 in the main paper).
preserving boundary, continuity, and monotonicity to Images for one of our test sets belong to Rai et al.’s
make sure that the path respects time. dataset [39]. This dataset is larger than Sitzmann et al.’s
• Time delay embedding: Splits a scanpath into sev- in size (number of images), but provides gaze data in the
eral sub-samples, i.e., small sub-scanpaths. This met- form of fixations with associated timestamps, and not the
rics calculates a similarity score by performing several raw gaze points. Note that most of the metrics proposed in
pair-wise Hausdorff comparisons over sub-samples the literature for scanpath similarity are designed to work
from both scanpaths to compare. with time series of different length, and do not necessarily
assume a direct pairwise equivalence, making them valid to
• Recurrence: Measures the percentage of gaze points compare our generated scanpaths to the ground truth ones
that match (are close) between the two scanpaths. from Rai et al.’s dataset.Table 4. Quantitative results of our model with sets of generated human observers. As we briefly discuss through the paper,
scanpaths with different number of samples. Our results are stable
this enables a number of applications, starting with avoiding
regardless the number of generated samples.
the need to recruit and measure gaze from high numbers of
Dataset # of samples LEV ↓ DTW ↓ REC ↑ DET ↑ observers in certain scenarios. We show here two applica-
100 46.19 1925.20 4.50 2.33 tions of our model, virtual scene design and scanpath-driven
Test set from 800 46.10 1916.26 4.75 2.34 video thumbnail creation for static 360◦ images, and discuss
Sitzmann et al. 2500 46.15 1921.95 4.82 2.32
Human BL 43.11 1843.72 7.81 4.07 other potential application scenarios.
100 40.95 1548.86 1.91 1.85
Rai et al.’s 800 40.94 1542.82 1.86 1.86
dataset 2500 40.99 1549.59 1.72 1.87
Virtual scene design In an immersive environment, the
Human BL 39.59 1495.55 2.33 2.31 user has control over the camera when exploring it. This
poses a challenge to content creators and designers, who
have to learn from experience how to layout the scene to
S6. Behavioral Evaluation elicit a specific viewing or exploration behavior. This is
not only a problem in VR, but has also received attention
In this section, we include further analysis and additional
in, e.g., manga composition [9] or web design [38]. How-
details on behavioral aspects of our scanpaths, extending
ever, actually measuring gaze from a high enough number
Section 4.5 in the main paper.
of users to determine optimal layouts can be challenging
and time-consuming. While certain goals may require real
Temporal and spatial coherence As discussed in the users, others can make use of our model to generate plausi-
main paper, our generated scanpaths have a degree of ble and realistic generated observers.
stochasticity, and different patterns arise depending on As a proof of concept, we have analyzed our model’s
users’ previous history. To assess whether our scanpaths ability to adapt its behavior to different layouts of a scene
actually follow a coherent pattern, we generate a set of ran- (Figure 9). Specifically, we have removed certain elements
dom scanpaths for each of the scenes in our test dataset, and from a scene, and run our model to analyze whether these
separate them according to the longitudinal region where changes affect the behavior of our generated scanpaths. We
the scanpath begins (e.g., [0◦ , 40◦ ), [40◦ , 80◦ ), etc.). Then, plot the resulting probability density (using KDE, see Sec-
we estimate the probability density of the generated scan- tion S6) as a function of time. The presence of different ele-
paths from each starting region using kernel density esti- ments in the scene affects the general viewing behavior, in-
mation (KDE) for each timestamp. We include the com- cluding viewing direction, or time spent on a certain region.
plete KDE results for the three images from our test set in These examples are particularly promising if we consider
Figures 11 to 16, for different starting regions, at different that our model is trained with a relatively small number of
timestamps, and computed over 1000 generated scanpaths. generic scenes.
During the first seconds (first column), gaze points tend to
stay in a smaller area, and closer to the starting region; as
time progresses, they exhibit a more exploratory behavior Scanpath-driven video thumbnails of static 360◦ images
with higher divergence, and eventually may reach a conver- 360◦ images capture the full sphere and are thus unintuitive
gence close to regions of interest. We can also see how the when projected into a conventional 2D image. To address
behavior can differ depending on the starting region. this problem, a number of approaches have proposed to re-
target 360◦ images or videos to 2D [46, 43, 45]. In the case
of images, extracting a representative 2D visualization of
Exploration time As introduced in the main paper, we
the 360◦ image can be helpful to provide a thumbnail of it,
also explore the time that users took to move their eyes to a
for example as a preview on a social media platform. How-
certain longitude relative to their starting point, and measure
ever, these thumbnails are static. The Ken Burns effect can
how long it takes for users to fully explore the scene. We in-
be used to animate static images by panning and zooming
clude in Figure 8 the comparison between ground truth and
a cropping window over a static image. In the context of
generated scanpaths in terms of time to explore the scene,
360◦ , however, it seems unclear what the trajectory of such
for all the three scenes from our test set (room, chess, and
a moving window would be.
robots), both individual and aggregated. We can see how
To address this question, we leverage our generated scan-
the speed and exploration time are very similar between real
paths to drive a Ken Burns–like video thumbnail of a static
and generated data.
panorama. For this purpose, we use an average scanpath,
S7. Applications of the Model computed as the probability density of several generated
scanpaths using KDE (see Section S6), as the trajectory of
Our model is able to generate plausible 30-second scan- the virtual camera. Specifically, KDE allows us to find the
paths, drawn from a distribution that mimics the behavior of point of highest probability, along with its variance, of allYou can also read