Peripheral Vision: A New Killer App for Smart Glasses
←
→
Page content transcription
If your browser does not render page correctly, please read the page content below
Peripheral Vision: A New Killer App for Smart Glasses
                     Isha Chaturvedi                                                       Farshid Hassani Bijarbooneh
      The Hong Kong University of Science and Technology                          The Hong Kong University of Science and Technology
                        Hong Kong                                                                    Hong Kong
                chaturvedi.isha6@gmail.com                                                   farshid.hassani@gmail.com

                      Tristan Braud                                                                  Pan Hui
      The Hong Kong University of Science and Technology                                       University of Helsinki
                        Hong Kong                                                                 Helsinki, Finland
                      braudt@ust.hk                                               The Hong Kong University of Science and Technology
                                                                                                    Hong Kong
                                                                                                panhui@cs.helsinki.fi

ABSTRACT                                                                          KEYWORDS
Most smart glasses have a small and limited field of view.                        Human perception; field of view; peripheral vision; smart
The head-mounted display often spreads between the human                          glasses head-mounted display; information input
central and peripheral vision. In this paper, we exploit this                     ACM Reference Format:
characteristic to display information in the peripheral vision                    Isha Chaturvedi, Farshid Hassani Bijarbooneh, Tristan Braud, and Pan
of the user. We introduce a mobile peripheral vision model,                       Hui. 2019. Peripheral Vision: A New Killer App for Smart Glasses.
which can be used on any smart glasses with a head-mounted                        In 24th International Conference on Intelligent User Interfaces (IUI
display without any additional hardware requirement. This                         ’19), March 17–20, 2019, Marina del Ray, CA, USA. ACM, New York,
model taps into the blocked peripheral vision of a user and                       NY, USA, 14 pages. https://doi.org/10.1145/3301275.3302263
simplifies multi-tasking when using smart glasses. To display
the potential applications of this model, we implement an                         1   INTRODUCTION
application for indoor and outdoor navigation. We conduct                         Smartglasses have become increasingly popular in recent
an experiment on 20 people on both smartphone and smart                           years. They provide various applications in information visu-
glass to evaluate our model on indoor and outdoor conditions.                     alization [49], education [16], gaming [41], medical [36] and
Users report to have spent at least 50% less time looking at the                  other commercial industries [2, 15]. Nowadays, most smart-
screen by exploiting their peripheral vision with smart glass.                    glasses embed a small head-mounted screen which spreads
90% of the users Agree that using the model for navigation                        over the eye of the user. The Angular field of view (AFOV or
is more practical than standard navigation applications.                          AOV) measures the angular extent of a 360-degree circle that
                                                                                  is visible by the human eye [6]. Figure 1 shows the AFOV
CCS CONCEPTS                                                                      of the human eye. The foveal system, responsible for the
                                                                                  foveal vision, lies within the central and para-central area.
• Human-centered computing → User studies; Empiri-
                                                                                  The area outside the foveal system is responsible for the pe-
cal studies in HCI; • Computing methodologies → Per-
                                                                                  ripheral vision [39, 42]. The term Field of view (FOV) is often
ception.
                                                                                  used interchangeably with AFOV. Most smartglasses have
                                                                                  small and limited FOV which restricts their potential applica-
                                                                                  tions [34, 46]. The AFOV of Google Glass1 is approximately
                                                                                  30 degrees (as represented Figure 2), which is significantly
Permission to make digital or hard copies of all or part of this work for         smaller than the AFOV of the human eye. This is the case for
personal or classroom use is granted without fee provided that copies are not     most smartglasses including MadGaze Glass2 . This limited
made or distributed for profit or commercial advantage and that copies bear       FOV forces the user to direct his central eye gaze towards the
this notice and the full citation on the first page. Copyrights for components
of this work owned by others than ACM must be honored. Abstracting with
                                                                                  small screen of the glass to extract meaningful information.
credit is permitted. To copy otherwise, or republish, to post on servers or to    Additionally, focusing the eyes on a display screen at close fo-
redistribute to lists, requires prior specific permission and/or a fee. Request   cal distances causes visual fatigue [37, 43], which immensely
permissions from permissions@acm.org.                                             affects the usability of smartglasses. As the user focuses his
IUI ’19, March 17–20, 2019, Marina del Ray, CA, USA                               central eye gaze on the screen of the smartglass at a close
© 2019 Association for Computing Machinery.
ACM ISBN 978-1-4503-6272-6/19/03. . . $15.00                                      1 Google   Inc, https://en.wikipedia.org/wiki/Google_Glass
https://doi.org/10.1145/3301275.3302263                                           2 MadGaze    Group, http://madgaze.com/x5/specs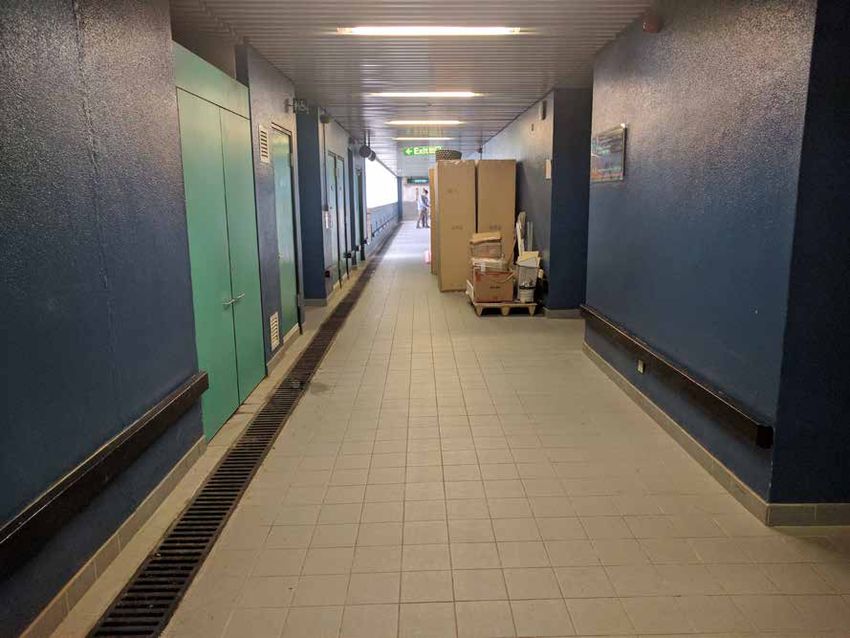
IUI ’19, March 17–20, 2019, Marina del Ray, CA, USA                                                                   I. Chaturvedi et al.

                                                                            by removing the need to focus on the screen of smartglasses.
                               mid-peripheral
                                                                            This paper contributes to the state-of-the-art by develop-
                   far
               peripheral
                                                             far
                                                         peripheral
                                                                            ing a model that combines two theories: motion detection
                               near-peripheral
                                                                            through peripheral vision [8] and color sensitivity of human
                                                   30°   60°          90°
                                                                            eye [26] and demonstrates its application for navigation on
                             paracentral central
                                                                            smartglasses with a head-mounted display. Existing works
                                                                            mainly focus on exploring peripheral vision by changing
                                                                            the hardware of the smartglasses while we propose in this
                                                                            page a pure software solution. Using our model, we develop
                                                                            a high-fidelity peripheral vision-based navigation application
                                                                            for both indoor and outdoor environment scenarios. To the
     Figure 1: Angular Field of View of the Human Eye                       best of our knowledge, this paper presents the first use of
                                                                            peripheral vision in a mobile context, using standard smart-
                                                                            glasses in both indoor and outdoor environment without
                                                                            additional hardware.
                                                                               This paper presents the following contributions:

          AFOV~30°
                                                                                • We present an MPV Model using color and motion to
                                                                                  display visual cues in the peripheral vision of the user.
                                                                                • We implement the MPV Model within a navigation
                                                                                  application. This application is then compared to a
                                                                                  standard navigation application on smartglasses, as
       Figure 2: Angular Field of View of Google Glass
                                                                                  well as the same application on smartphone. As such,
                                                                                  we are able to isolate both the impact of peripheral
focal point, his multitasking ability is strongly affected. This                  vision and use of smartglasses. Thanks to our model,
temporary shift of focus may have deadly consequences. For                        users spend on average 50% less time looking at the
instance, a user driving a car on the highway at 100km/h                          screen of the smartglasses. Furthermore, 90% Agree
who takes his eyes off the road for one second to look at                         that the smartphone application was beneficial.
a map screen is actually blind for 28 meters. Using mobile                      • We further discuss two specific cases, namely strabis-
devices also limits cognitive ability and restricts peripheral                    mus and color-blindness, for which our MPV model
vision [20]. There have been about 5,984 pedestrian traffic                       does not apply. Indeed, color-blindness changes the
fatalities in 2017. One of the main causes of these accidents                     color sensitivity of the eye, while strabismus impacts
is the extensive use of mobile devices3 .                                         the eye mobility. We propose modifications to our
   Smartglasses with a head-mounted display like Google                           model to account for these specific cases.
Glass or even Microsoft HoloLens partially cover the user’s
peripheral vision4 . The peripheral visual field is an important               The rest of this paper is organized as follows: We first
part of the human vision and is useful for daily locomotive ac-             discuss research studies related to ways of increasing field
tivities such as walking, driving, and sports [40]. Visual cues             of view, use of peripheral vision in providing notifications to
from the periphery can help to detect obstacles, avoid acci-                the user, and navigation using smartglasses. In Section 2, we
dents and ensure proper foot placement while walking [21].                  explain our MPV model and its applications for the mobile
   In this paper, we present a Mobile Peripheral Vision (MPV)               users. In Section 3, we discuss our demo application and the
model. Any smartglass with a head-mounted display over-                     user study built around the application. Finally, we discuss
lapping with the peripheral vision can run this model, which                the results of the experiments to evaluate the applicability
does not require any additional hardware. Our model taps                    of our model.
into the peripheral vision of the user by using the screen of
the head-mounted display of the smartglass to present visual
cues. The model simplifies multi-tasking for the mobile user                Related Work
3 Pedestrian
                                                                            In this section, we present the main related studies. These
            Traffic Fatalities by State, https://www.ghsa.org/resources/
spotlight-pedestrians18
                                                                            studies spread around three main fields: enhancing the FOV
4 Google Glass Blocks Peripheral Vision, https://www.livescience.com/       of smartglasses, displaying information on peripheral vision,
48608-google-glass-blocks-peripheral-vision.html                            and navigation on smartglasses.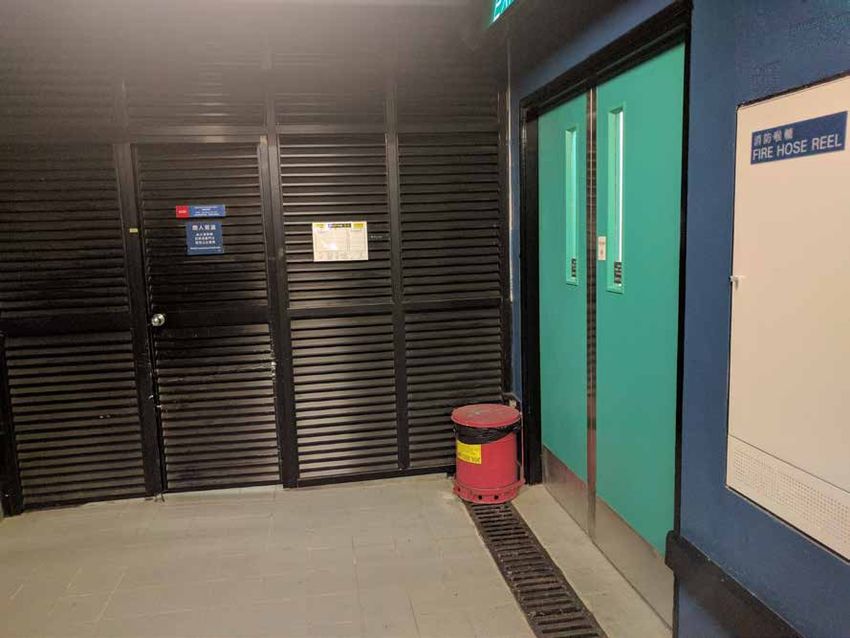
Peripheral Vision: A New Killer App for Smart Glasses                  IUI ’19, March 17–20, 2019, Marina del Ray, CA, USA

Enhancing the FOV of smartglasses                               non-exhaustive list of studies, gaze detection and guiding has
Augmenting the field of view has previously been studied by     been a very active field to target the user’s attention towards
changing the hardware of the smartglasses [7, 28]. Sparse-      specific details of a scene and improve global recollection.
LightAR increases the field of view of head-mounted displays    However, none of these studies exploit peripheral vision to
by adding an array of Light Emitting Diodes (LEDs) around       send subtle cues to the user without altering his focus on the
the central display [47]. Similarly, AmbiGlasses illuminates    main task.
the periphery of the human visual field by adding 12 LEDs          Few studies have explored the possibility of using ani-
in the frame of the glasses [31]. Matviienko et al. [22] dis-   mations in peripheral vision displays for enhancing visual
cuss the possibility of employing ambient light in the car to   interest, without distracting the user [30]. The study in [18]
keep the focus of the user on the road. Some of the studies     explores usable visual language by limiting possible shapes
present new optical designs for head-mounted displays like      and color and using meaningful motion and orientation, for
pinlight display which uses an LCD panel and an array of        near-eye out-of-focus displays which are placed inside a pair
point light sources directly in front of the eye [19], or use   of glasses in far peripheral extremes of human view. This
curved screens and curved lenses to achieve a wider field       study formulates five guidelines for designing near-eye-out-
of view [32]. Finally, Yamada et al. [48] propose to expand     of-focus displays. The study recommends using simple and
the field of view by filling peripheral vision with blurred     single prominent shapes and to avoid composite shapes. It
images. through the use of two different kinds of lenses with   suggests avoiding secondary colors and to limit the usage to
different magnification levels. Contrary to these studies, we   the primary colors. Furthermore, the study suggests that mo-
aim at providing an off-the-shelf solution that necessitates    tion detection is independent of shape recognition and can
no additional hardware and targets pedestrians, cyclists and    be used to convey complex information like path change of
car drivers alike.                                              the symbols moving on the screen. Apart from the required
                                                                external hardware modifications, the visual language in this
                                                                study is restricted to near-eye out-of-focus displays and is
Peripheral Vision                                               tested for only static users, where, as shown in Figure 2,
Some other studies explore peripheral vision to present in-     the screen of smartglasses occupies part of the central and
formation to the user. Few investigate adding a peripheral      near-peripheral area of the human eye.
vision display to ordinary eyeglasses using LEDs [5, 9, 27].
Hahn et al. [10] use an attention-aware peripheral display      Navigation on smartglasses
on ambient displays to measure the user gaze as visual at-      The small field of view of smartglasses makes it difficult to
tention through an infrared camera to give notifications to     use existing Google Maps application. The 3D street view
the user. However, most of the studies involve hardware         and the blue directional arrow in the Google Maps on Google
changes to the smartglasses. Bailey et al. [1] experiment on    Glass application5 are not easily visible unless the eye focus
the possibility to direct the gaze of the user through subtle   is completely directed towards the screen of the glass, which
image-space modulation. Another study [38] built on top         may cause accidents during navigation. Moreover, Google
of these results and significantly improve the performance      Maps work only in an outdoor environment. One of the nav-
of the system. However, both studies only propose to guide      igation methods for smartglasses uses a navigation system
gaze, rather than using the full surface of the eye and pe-     in which a LED matrix is placed at the peripheral vision of
ripheral vision. A study proposes to tap peripheral vision to   the driver to signal the turns on the road, thus requiring
present information without compromising the performance        additional hardware changes to the smartglasses [29]. This
of the primary task [3]. However, the study only introduces     navigation system differs from our model, as our model pro-
the concept of motion perception in the peripheral area with-   vides a software-only solution to navigation on smartglasses.
out proposing any real system design or evaluation. This        Rehman et al [33] implement an augmented reality-based in-
study also proposes a new global positioning system (GPS)       door navigation application for wearable head-mounted dis-
navigation system design using a motion-based interface,        plays like Google Glass. The navigation application overlays
requiring a web-cam based eye tracker. The authors in [13]      information like the location zone and directional instruc-
focus on information presentation mechanism for mobile AR       tions on the visual overlay of environment map in the Google
systems using users’ gaze information. The study provides       Glass. A drawback of this application is that it overlays infor-
a hardware-based solution. It provides a mobile AR display      mation on the small visual overlay of the glass screen. The
system using a combination of a mobile, spectacle-type, wear-   environment map and the overlaid information may not be
able retinal image display (RID) and an eye-tracker system.
Finally, another study [17] also exploit visual cues to guide
the user gaze in a Virtual Reality scene. As shown in this      5 https://support.google.com/glass/answer/3086042?hl=en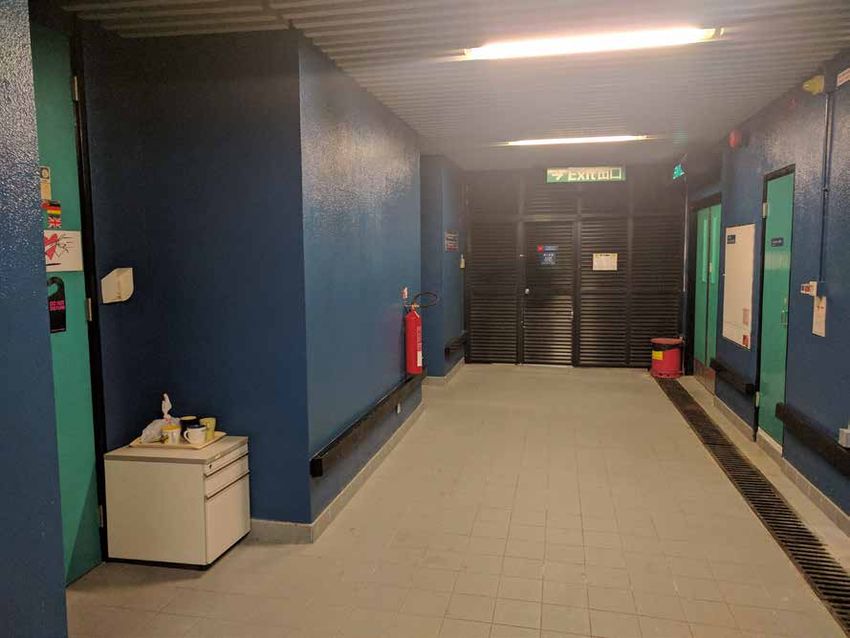
signaled by the red and green photopigments. This             either the red or green photopigment. Nevertheless, these
                                                                       means that colors differing only in terms of the amount       two distinct variations on the condition result in similar
                                                                       of blue do not produce sharp edges. For example, adja-        symptoms: affected persons have trouble discriminating
                                                                       cent mixtures with the same percentage of red and green       any color that is dependent upon a ratio of red to green
                                                                       but a different percentage of blue produce a fuzzy            photopigment (see Figure 5). They do differ, however, in
                                                                       border.                                                       the perception of brightness, since long-wavelength
                                                                         The opponent-channel schema produces at least one           stimuli appear dark to the individual lacking the red
                                                                       other interesting effect as well. Because it links together   photopigment. A relatively rare form of color deficiency
                                                                       the opponent colors of red and green and yellow and           also exists in which the blue photopigment is missing.
                                                                       blue, it becomes physiologically impossible to experience        More common among those with color deficiencies are
                                                                       such combinations as reddish green or yellowish blue.         individuals whose response functions to the photo-
IUI ’19, March 17–20, 2019, Marina del Ray, CA, USA                                                                                                                I. Chaturvedi et al.

                                                                                                                               0°
easily visible, and the user still has to direct central eye gaze
to the screen.
                                                                                                                                                 \    45°
   Our MPV model differs from the existing works as it                                              Mb°j/
provides a software solution to explore peripheral vision                                                                \JÖT1_^" y^>
to present information to the user. The model uses simple                                                                '\4oJ_
                                                                                                                                  ---JKVBLUE'
shapes like single rectangular bars or big circular shape dots                                                     vx\
                                                                                                                                    YELLOW^^
and three primary colors to convey information at the pe-
                                                                                                                                               Λ \ Λ ! WO I 80
riphery. The use of symbols is limited to basic shapes and                                                 pOj 40 P m it           vnT^T—Wfc-                  90°

we display complex information using movement recogni-                                      270 4 -
                                                                                                                   ΛΡ JS^GREENLWJ
tions [18] to achieve high recognition rate. The novelty of
                                                                                                                                  t-VRED^X>
our MPV model is that it is adaptable for any smartglasses
with varying positions of head-mounted displays in the field                                                                 /To
                                                                                                                            [ 50
of view as long as it covers the peripheral vision. Navigation
                                                                                                                                                                           1
                                                                                                                                              ^"ΤΓ      35°
applications can greatly benefit from this model. Indeed, the                                         225°

model is independent of the field of view of glasses and uses
                                                   Figure 6. The zones of color sensitivity
peripheral view of the user. Using our model,for     the    userhuman
                                                      the normal    caneye.                                                        180°

also multi-task while navigating the path using52the informa-
                                                                                                                                                            IEEE CG&A
tion at the periphery. Thus, our model provides a software                            Figure 3: The color sensitivity zones for the normal                       human
solution to navigation on smartglasses with a head-mounted                            eye.
display.

2    SYSTEM DESIGN                                                                            We assume that the glass screen is located between the
                                                                                           near-peripheral and mid-peripheral region of the human
In this Section, we introduce the mobile peripheral vision
                                                                                           eye (Figure 1). As mentioned above, motion detection in
model, discuss the applications of the model, and introduce
                                                                                           the peripheral area of human eye vision can trigger human
the peripheral vision-based navigation application for smart-
                                                                                           awareness. Though color sensitivity diminishes with the
glasses with a head-mounted display.
                                                                                           distance to the central vision area, the human eye can still
                                                                                           detect some colors such as blue outside the central vision.
Mobile Peripheral Vision Model
                                                                                           Since blue color sensitivity is mostly located outside the
The model we propose in this study uses the peripheral vi-                                 central vision, blue makes a good peripheral background
sion of a human eye to display information without having                                  color.
to actively look at the screen of the smartglasses. The user                                  The red and green colors are easily visually perceivable
can thus pick up information on the smartglass without in-                                 due to the abundance of the red and green color cones at the
terrupting his main activity. This model uses the entire glass                             retina center. As the smartglass screen partially covers the
screen to present information to the user and requires no                                  center of the human FOV, we integrate them in our model to
changes to the hardware. As such, any smartglasses with                                    code extra bits of information. The yellow color, which is a
a head-mounted display overlapping with the peripheral                                     mixture of red and green color, is easily visually perceivable
vision can use it. This model articulates around two funda-                                as well. However, it can create confusion when used together
mental concepts:                                                                           with red and green color [26, 35].
     • Color detection in the peripheral area of the eye                                      The model, therefore, uses the following three colors to
     • Motion detection in the peripheral vision                                           signal information to the user: (i) Blue: highest number of
                                                                                           cones in the periphery, (ii) Red: high number of cones in the
Color detection                                                                            retina center, (iii) Green: high contrast with the two other
According to Gerald M. Murch et al. [26], the retina center                                colors.
for a normal human eye has a high cones density which are                                     To achieve high recognition rate, we combine basic shape
responsible for color vision. Their distribution is as follows:                            with movement recognition in the model. The model articu-
red: 64%, green: 32% and blue: 4%. Figure 3 shows the asym-                                lates around three fundamental concepts:
metrical color distribution of the three color cones [26]. The                                    • motion detection by the peripheral vision,
center of the retina has mainly green and red cones. The                                          • the presence of blue cones at the periphery,
blue cones mostly occupy the area outside the central retina.                                     • the abundance of red and green cones at the center of
The periphery has a high percentage of rod cells, the photo-                                        the retina (primary colors), that allow red and green
receptors responsible for motion and night detection [26, 35].                                      to be easily recognized, even at the periphery.
Peripheral Vision: A New Killer App for Smart Glasses IUI ’19, March 17–20, 2019, Marina del Ray, CA, USA
Motion detection
The periphery has a high percentage of rod cells, the photore-
ceptors responsible for motion and night detection [26, 35].
Retinal eccentricity measures how far a given point in the
visual field is from the central fixed point [24]. The rate
threshold or velocity for visual motion perception varies (a) (b)
with retinal eccentricity [23, 25]. This implies that the veloc-
Figure 4: Basic navigation application based on our MPV
ity (degrees per second) with which the notifications flicker
model. A blue color dot blinks on the left sign to indicate
or move depends on the field of view and location of the a point of interest on the left (a). Once the user turns left,
glass screen in the periphery. For simplicity, we use constant the entire screen turns blue to indicate that the user is in
velocity for motion detection for our model. We define the the correct direction (b).
velocity as follows: the rate threshold increases as we go
far from the central gaze [44, 45]. Thus, the rate threshold
for motion detection in the glass depends on the location of the screen to interpret the signal. Blinking, on the other hand,
the head-mounted display in the field of view. Since most permits to attract the user attention while keeping his eye
smartglasses have a small field of view and we assume the focus on the activity.
glass screen to be located between near-peripheral and mid- As the experimental conditions are much more diverse
peripheral region, the threshold velocity for constant motion than previous studies, we limit the visual language to three
detection does not vary considerably. However, we can also primary colors (blue, red and green), simple symbols (cir-
extend the model to head-mounted displays in far peripheral cles, squares, bands), and blinking movement to activate
regions by adjusting the rate threshold. the peripheral vision without directing the gaze of the user
to the screen. This visual language forces to carefully de-
sign applications as the number of possible combinations
Main differences with existing models considerably limits the amount of information (18 possible
Although building on top of the study by Luyten et al. [18], symbols). We also believe that as the display of smartglasses
our MPV model presents significant differences. Indeed, the such as Google glass also overlaps on the central vision, a
authors consider a bulky setup composed of two wide screens more limited language allows the user to focus on his main
(60x60mm) parallel to the head direction. Our MPV model task without being tempted to look at the screen to confirm
uses state-of-the-art smartglasses such as Google glass that the item displayed. Similarly, this model may cause problems
provide a single, much smaller 10x10mm screen, perpendic- to users suffering from certain forms of color-blindness and
ular to the head direction and lying between the central and strabismus. We investigate these issues and provide solutions
peripheral areas of the eye. Moreover, our setup is meant to in Section 3.
be used in a variety of indoor and outdoor conditions, with,
among other things, variable backgrounds and luminosity. Application of the Model
Such a setup limits the amount of symbols and colors avail- The MPV model prevents the user from focusing on the
able to display information. Therefore, our model presents a screen on the smartglass by tapping the peripheral vision.
much more limited graphical language than other studies in This model can be used by a mobile user as well, as it does not
order to avoid confusion. obstruct the vision awareness. The user can walk and pick
After preliminary experiments, we choose to distinguish up the visual cues at the periphery without looking into the
actions solely through color and movement changes. Indeed, screen. One of the main applications of the model is in indoor
displaying too detailed information leads the user to switch and outdoor navigation. This model allows the user to be
his eye focus to the screen. Furthermore, Luyten et al. per- aware of his surroundings while walking or driving without
formed their study on static users and arbitrarily avoided being distracted by the navigation application. Indoors, the
blinking of the symbols as it may attract too much the user model can be used in museums or theme-parks where visitors
attention. However, smartglasses may be used in a wide can navigate without having to constantly stare at the guide
variety of lighting conditions, with a multitude of possible map and losing the enjoyment of the place.
backgrounds, and, more importantly, in motion, which is an Similarly, it can also be used outdoors for sightseeing,
issue not considered by former studies. When the user is where a tourist wants to find the direction of points of interest
moving, our preliminary experiments show that the move- while walking in the street. Figure 4a shows a simple way
ment of a symbol is perceptible within the peripheral vision. of implementing this idea using our MPV model. A blue dot
However, the motion of the user mixes with the motion of blinks at a velocity above the rate threshold of detection on
the symbol, leading our participants to direct their gaze to the left side of the glass screen, indicating the user to turnIUI ’19, March 17–20, 2019, Marina del Ray, CA, USA I. Chaturvedi et al.
left to see points of interest. Once the user turns left, the
entire screen turns blue (Figure 4b), facilitating an easy to
understand user interface for navigation. Since blue color
cones are mostly found outside the central vision (Section 2),
peripheral vision can easily detect blue color.
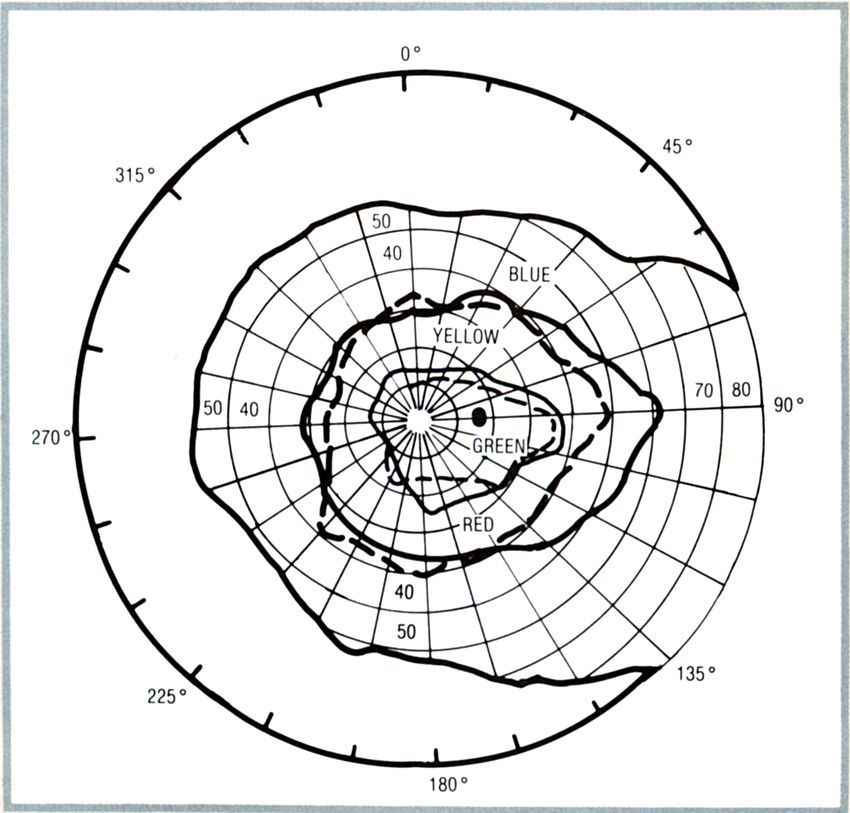
MPV model applications are not restricted to navigation. (a) User continues(b) User is notified(c) User is notified
For example, in video games, the MPV model can provide to walk straight. to turn right. to turn left.
hints to the user in gaming applications, blinking red square
for immediate danger when an enemy is showing up, blue Figure 5: The user view of our MPV navigation application,
background in case of hidden objects to find, or even moving showing the changes on the glass screen during navigation.
symbols (left to right or right to left) to indicate directions. 5a When the entire screen is blue, the user walks straight
ahead. 5b When a red bar on a black color screen blinks to-
Outdoor augmented reality gaming applications can also
wards the right (left to right of the screen), the user turns
benefit from the model [11]. The player can move around right. 5c When a green bar on a black color screen blinks to-
looking at the physical world and pick up visual cues at the wards the left (right to left of the screen), the user turns left.
periphery without looking at them. In this case, the applica- When the entire screen turns black, the user has reached the
tion can change the color of the background when the user desired destination and thus stops.
is looking at a specific object useful for the game. Finally,
important notification alerts can make use of the MPV model
for signaling events such as traffic alerts and incidents, and compared to a handheld device, we select a fixed path in the
weather warnings, although the amount of information to campus between two end-points. The path has 9 locations
display using only simple symbols, colors and movement from start to end, covering various activities. It starts with
patterns may require some adaptation so that the appearance staircases with multiple turns and variable light conditions
of an event won’t cause distraction from his main task. and ends with a straight walk with a single turn in bright
light. This diversity of path and luminosity conditions help
3 EVALUATION in confronting the MPV model to different scenarios.
In this section, we present our implementation of the MPV Outdoor application
model, based on a peripheral vision-based navigation appli- The outdoor application runs on MadGaze Glass X5 as
cation. We will first discuss the application specifications it has a quad-core processor that is more suited for multi-
and then introduce our setup for the peripheral vision experi- threaded GPS applications in outdoor environments. The
ment, followed by two user studies conducted to evaluate the outdoor environment also allows for using a traditional, GPS-
application. Finally, we will present and discuss the results based navigation application for comparison purposes. We
of the experiment. compare our results to a smartglass-based application for
precisely evaluating the difference between central and pe-
Peripheral Vision-Based Navigation Demo ripheral vision on this support. The existing navigation app
Application on both Google Glass and MadGaze Glass has a long delay of
We evaluate our MPV by developing a navigation application at least 3 seconds to detect a change in user position, which
on both Google Glass and MadGaze glass. This application, makes it impossible to use the default navigation app for
based on the above MPV model (Section 2), guides the user in our experiments. Therefore, we design our own responsive
indoors and outdoors environment using peripheral vision. navigation app with more frequent GPS position polling to
The application detects the location of the user and informs compare to our MPV app. Our navigation app simply imple-
him to walk straight or to turn left or right. ments a map and a route with 9 points of interest in a city
Indoor application park. The user follows the route and sees the attractions in
The indoor application operates within the university cam- the city park. The GPS in the city park has a precision of
pus and uses the university public Wi-Fi networks to de- at most 5 meters. We chose a route of approximately 200
termine the location of the user. The application considers meters that takes around 5 minutes to complete. The route
the Basic Service Set Identifier (BSSID) and Received Signal alternates between parts under tree shades and sunshine and
Strength Indicator (RSSI) of Wireless Access Points (WAP) features a variety of decor and colors that may impact the
to estimate the location of the user. We use the Wi-Fi signals user’s reaction to the colors in the MPV model.
with RSSI less than 90 decibels (dB) to have stability in loca- Implementation of the MPV model
tion detection. The application only takes into account the Figure 5 shows the user view of our MPV application, lay-
top 5 Wi-Fi hotspots on the path with highest RSSI. To evalu- ing out the changes that happen on the glass screen during
ate the capacity of users to navigate using peripheral vision the navigation. When the entire screen is blue, the user has toPeripheral Vision: A New Killer App for Smart Glasses IUI ’19, March 17–20, 2019, Marina del Ray, CA, USA
keep walking straight. (Figure 5a). When a red bar on a black 2 seconds from left to the right of the screen at a velocity of
background blinks from left end to right end of the screen, 15 degrees per second. Considering that the AFOV of Google
the user has to turn right (Figure 5b). Similarly, when a green Glass is 30 degrees and that the bars are moving at the rate of
bar on a black background blinks from right end to left end 15 degrees per second, the total periphery stimulation time is
15 = 2 seconds. This ensures that the user receives the hint in
30
side of the screen, the user has to turn left (Figure 5b). We
choose the colors according to our preliminary observations: a reasonable time to react as it has been shown that the visual
when the user goes straight ahead, a blue background helps reaction time to rapid movements is at least 250ms [14]. The
to keep an indication without distracting the user’s attention bar blinks 4 times, covering 7.5 degrees in every half second.
on his main task. Blue cones are indeed the most present in The cue is activated within a radius of 3 meters from each
the peripheral area of the eye and blue is the easiest color to turn. As such, we assume the blinking speed of the bar to be
detect in the peripheral vision. We also notice that the best above the threshold velocity for motion detection at every
way to signal a punctual event was through a combination of retinal eccentricity in the field of view of the glass screen.
color change, movement, and blinking. As such, even though Apart from the blinking, we also consider sliding of the bar
the peripheral area of the eye does not present as many red from one end to the other of the glass screen in the initial
and green cones as blue cones, changing from blue to red and prototype.
green provides enough contrast to signal an event. Moreover, Initial Experiment: maximizing peripheral activation
as red and green are primary colors, they remain easy to through movement
detect when the user is in motion. We avoid using a single We conduct an initial experiment session with 20 users,
color to show different direction changes to prevent confu- where we evaluate both blinking and sliding in the indoor
sion if the user fails to notice the direction of bar movement university environment. The users walk a fixed path consist-
on the small glass screen. These colors, although not optimal, ing of a 2 minutes walk from ground floor to a classroom on
provide a visual reminder of the instruction to follow. They the first floor. The path covers light to dark lighting areas
were also chosen by participants in a study from Luyten et and consists of staircases, a straight walkway path, and 7
al [18] investigating the use of peripheral vision to provide turns (3 for left and 4 for right). The experiment takes place
contrast on the display of symbols in their peripheral vision. in the busy evening time, to make sure the path is crowded
Furthermore, we combine these colors with the movement and the participants have enough diversions to not stare into
of the hint bar to compensate the lack of color cones at the the screen. This experiment shows that 70% of users prefer
periphery and make peripheral detection easier. The yellow blinking over sliding for direction detection. This is particu-
color (Section 2) is not used as it can cause color confusion larly because users’ peripheral vision is not activated quickly
with red and green. The black color provides darkness con- enough with sliding bars, leading them to miss the directions
trast to the eye, which helps the peripheral eye to detect red on the screen. To avoid missing the directions, the users have
and green color bar movement changes even in the daylight to pay more focus on the screen, and thus have problems in
(Section 2). navigating the crowded path. By blinking the bar, we add
As previously said, the navigation hint bars stimulate pe- just the amount of peripheral vision activation necessary for
ripheral vision as much as possible through motion. The the user not to focus on the screen while in motion. Based
bars movement covers the entire 30 degrees of angular field on this initial experiment, we select the blinking option in
of view of Google Glass (Figure 2). Note that many online our high-fidelity MPV navigation application.
reports on the angular field of view measure of Google Glass The main advantage of using a peripheral vision-based
is incorrect, and therefore for this study, we model the exact navigation application as compared to other navigation appli-
2D copy of Google Glass as shown in Figure 2 to measure the cations on mobile devices and wearables is that it simplifies
precise value of the angular field of view. The velocity for multi-tasking and does not obstruct the user’s visual aware-
motion detection of the bar in the application is kept at the ness. Existing navigation applications on the mobile devices
constant rate of 15 deg/sec, to provide the hint for the right and wearables require the user to look into the screen con-
and left turns. This ensures that the velocity is far above the stantly. Through our MPV application, the user does not
peripheral vision motion detection threshold value of 2.15 have to stare into the glass screen and can perform another
deg/sec at 90 degrees eccentricity as it appears in [25]. Since task without obstruction.
90 degrees retinal eccentricity already falls in the far periph-
eral visual field (See Figure 1), the velocity of 15 degrees Experiment Setup
per second stimulates the peripheral vision as the screen is We set up our experiment for both indoor and outdoor envi-
located between near-periphery and mid-periphery region. ronments using the applications described in Section 3. The
The bars on the head-mounted display occupy 25% of the indoor experiment takes place inside the university campus
screen width. Each time the bar appears, it blinks 4 times for while the outdoor experiment takes place in a public park.IUI ’19, March 17–20, 2019, Marina del Ray, CA, USA I. Chaturvedi et al.
We define a primary task and a secondary task for the users. range of light conditions and evaluate the impact of our MPV
The users are asked to perform both tasks simultaneously. model compared to a more traditional navigation application
Experiment 1: Indoor navigation on smartglasses.
The primary task consists of looking at 7 points of interest Experimental methodology
while navigating in the environment. This simulates many We conduct our study on a diverse group of 20 participants
scenarios in real life such as walking in a museum, national for both the indoor and the outdoor environment. The two
park, shopping mall etc. The pointers consist of 14 large col- experiments were performed with entirely different sets of
orful pictures of common animals and fruits placed at each participants to ensure that no one had prior experience with
point of interest. We place 7 pictures on the right-hand side our MPV model. The participants’ age ranges from 18 to 25.
of the user and 7 pictures on the left-hand side along the For the indoor experiment, 90% of the users are using Google
indoor corridors. The pictures are placed within the cue acti- Glass for the first time, whereas, for the outdoor experiment,
vation area. The secondary task is to navigate to a specific all the users are using the MadGaze Glass for the first time.
classroom at the end of the path, using the demo application 70% of the students have eye power glasses and thus wear
without looking directly at the screen. The path is unknown Google Glass on top of their eyeglasses. Two participants in
to the participants, and presents several intersections only the indoor experiment have specific eye conditions, respec-
indicated through our demo application. It is made sure that tively color blindness and strabismus.
path covers different lightning areas and walkaways simi- After the experiment, the users fill a computer-based as-
lar to the Initial Experiment. The primary task is set up to sessment survey after conducting the experiment on both de-
make sure that the users do not directly look into the screen. vices. The survey is based on NASA Task Load Index (NASA
The pictures of the animals and fruits are chosen such that TLX) assessment tool [12]. This tool allows to measure the
they appear quirky and humorous to the user. Further, the perceived workload of a task by asking users to rate the
experiment is conducted in the presence of an observer who effort and frustration experienced during the experiment.
converses with the user while walking on the path. These Mental demand refers to the amount of mental and percep-
distractions ensure that the users do not have focus shifts tual activity to complete the experiment. Physical demand
towards the secondary task of navigation. It helps in evalu- measures the amount of physical activity and whether the ex-
ating whether a user can perform a primary task of looking periment is slack or strenuous for the user. The users report
at pictures while performing a secondary navigation task. the perceived mental demand and physical demand while
The observer does not help the user in any way during the performing the experiment on all devices, on a scale of 1 to
experiment. 10, 10 being the highest. Users also report their frustration
We also run the demo application on a Xiaomi Mi 3 smart- level, which measures the level of irritation, stress, and an-
phone, to compare the user experience of using peripheral noyance that the user feels while performing the experiment
vision-based navigation application, on smartglasses against in a similar fashion. We asked the users the following ques-
mobile devices. The interface of the mobile phone applica- tions, on a scale from 1 to 10, 1 being "very low" and 10 being
tion is entirely the same as the one on the Google Glass and it "very high":
provides the same functionality. We perform the experiment
(1) How mentally demanding was the task?
with both Google Glass and Xiaomi mobile phone for each
(2) How physically demanding was the task?
user. The users alternate the starting device between each
(3) How insecure, discouraged, irritated, stressed and an-
test run to avoid biased perceptions that one device would
noyed were you?
always be used first in the experiment.
Experiment 2: Outdoor navigation These measures are recorded for Google Glass, MadGaze
For our outdoor experiment, we choose a relatively crowded Glass, and the Xiaomi mobile phone. Additionally, we record
city park with many attraction locations. We select a route which device is used to start the experiment and ask the users
with 9 attractions as our primary tasks. The demo applica- for additional comments and opinion about the usability of
tion directs the users with the MadGaze Glass X5 to each our MPV model in real life.
attraction location. We perform the experiment with both The experiment is conducted in the presence of an ob-
our MPV application and the navigation application presented server, to record additional data for our assessment. The
in the previous section. The MPV application allows users to experiment is considered successful if the user reaches the
focus on the environment and the attractions, whereas the destination of the path. The observer records whether the
navigation application requires users to look into the glass user completes the experiment successfully and the total
screen to see the map and follow the route. We evaluate the time taken by the user to trace the path to reach the desti-
impact of both cases on the same smartglasses. The goal of nation. We ask the users to rate the time spent looking into
this experiment is twofold: extend our evaluation to a wider the glass on the following scale: 1 – rarely, 2 – moderate,Peripheral Vision: A New Killer App for Smart Glasses IUI ’19, March 17–20, 2019, Marina del Ray, CA, USA
7
Google Glass - Indoor Google Glass - Indoor
8
6 Mobile Phone - Indoor Mobile Phone - Indoor
5
6
Num ber of Users
Num ber of Users
4
3 4
2
2
1
0 0
1 2 3 4 5 6 7 8 9 10 1 2 3 4 5 6 7 8 9 10
Ment al Dem and Physical Dem and
Figure 6: Mental Demand of 20 users (indoors). Figure 9: Physical Demand of 20 users (outdoors).
7 6
MadGaze Glass MPV App - Out door MadGaze Glass MPV App - Out door
6 MadGaze Glass Nav App - Out door MadGaze Glass Nav App - Out door
5
5
4
Num ber of Users
Num ber of Users
4
3
3
2
2
1
1
0 0
1 2 3 4 5 6 7 8 9 10 1 2 3 4 5 6 7 8 9 10
Ment al Dem and Physical Dem and
Figure 7: Mental Demand of 20 users (outdoors). Figure 10: Physical Demand of 20 users (indoors).
MadGaze Glass
Nav App - Out door MadGaze Glass
Nav App - Out door
MadGaze Glass
MPV App - Out door MadGaze Glass
MPV App - Out door
Mobile Phone - Indoor
Mobile Phone - Indoor
Google Glass - Indoor
Google Glass - Indoor
0 1 2 3 4 5 6 7 8 9 10
Ment al Dem and 0 1 2 3 4 5 6 7 8 9 10
Physical Dem and
Figure 8: The boxplot of mental demand for 20 Users while
Figure 11: The boxplot of physical demand for 20 Users
carrying out the experiment indoor and outdoor, indicating
while carrying out the experiment indoor and outdoor, indi-
the first quartile (Q 1 ), second quartile (Q 2 or median), and
cating the first quartile (Q 1 ), second quartile (Q 2 or median),
the third quartile (Q 3 ) of the data.
and the third quartile (Q 3 ) of the data.
and 3 – often. This scale simplifies the measurement, as we
noticed that the measurement by observation may not be sample size is a typically accepted baseline in many previous
precise, while the more interesting metric, in this case, is works [4]. We repeat each experiment twice with each user
the users’ perception of how often they have to look into the to compare the MVP model with either a similar experience
screen and the amount of time spemt looking into the screen on the phone (indoors conditions) or an ordinary navigation-
of the Google Glass and the Xiaomi mobile phone during based application (outdoors conditions). We limit the exper-
the experiment. We do not record the reaction time of the iment to two applications per user and per experiment in
user after movement detection. The amount of time looked order not to overload them. For the indoor experiments, each
into the screen is normalized to compare the individual time user used our MVP based app and the mobile phone app. The
spent by different users for looking into each device’s screen. experiments are performed on Google Glass and Xiaomi Mi 3
The normalization is done by computing the percentage of respectively. All the users were able to reach the destination
the time the user looked into the screen of the device given using the devices.
the total time of the experiment. We record mental demand, physical demand, and frustra-
tion level during the experiment, for all the devices on a scale
Experiment Results from 1 to 10, 0 being the highest level. Let Q 1 , Q 2 , and Q 3 be
As mentioned in Section 3, the user study involves 20 partic- the first, second, and third quartiles respectively.
ipants for both the indoor and outdoor environment. This Mental demandIUI ’19, March 17–20, 2019, Marina del Ray, CA, USA I. Chaturvedi et al.
smartglass application, confirming the superiority of navigat-
Google Glass - Indoor
8
Mobile Phone - Indoor ing using peripheral vision compared to a similar application
6 using central vision.
Num ber of Users
4
Regarding the outdoor experiment, the results are even
more noticeable. The mental demand required for perform-
2
ing the outdoors tasks is even lower using the MPV app on
0
1 2 3 4 5 6 7 8 9 10 the MadGaze glass. Interestingly, when looking at Figure 8,
Frustration Level
we can see that using the MPV app on a smartphone or a
Figure 12: Frustration level of 20 users (indoors).
navigation app on smartglasses results in a similar distri-
bution of mental demand among participants. We can thus
6
MadGaze Glass MPV App - Out door conclude that the hardware is not the cause of this higher
5 MadGaze Glass Nav App - Out door
mental demand and that activating the peripheral vision no-
4
Num ber of Users
ticeably requires less focus from the user, focus that could
3
be directed to the road in the case of a car driver.
2
Physical demand
1
Figures 9 and 10 show the physical demand required by
0
1 2 3 4 5 6
Frust rat ion Level
7 8 9 10
the users while performing the experiment indoor and out-
door. The graph curve for the physical demand using Google
Figure 13: Frustration level of 20 users (outdoors). Glass (Figure 9) is highly skewed towards the left, and the
physical demand of 50% users falls below the curve at 2.00
or lower. Further, the physical demand of 75% users falls
MadGaze Glass
Nav App - Out door under 3.00. This indicates that peripheral vision approach
MadGaze Glass
significantly reduced the physical demand on the users. The
MPV App - Out door
average physical demand in conducting the experiment us-
Mobile Phone - Indoor
ing Google Glass is 2.65. On the other hand, the curve for
the physical demand using a mobile phone is spread out,
Google Glass - Indoor with the median (Q 2 ) lying at 4.50 (Figure 11), which is 125%
0 1 2 3 4 5 6 7 8 9 10
higher than that of the Google Glass. The upper quartile
Frust rat ion Level
(Q 3 ) for the physical demand using the mobile phone is 6.00,
which is significantly higher than that of the glass (2.00). The
Figure 14: The boxplot of frustration level for 20 Users while
average physical demand required by 20 users in conducting
carrying out the experiment indoor and outdoor, indicating
the first quartile (Q 1 ), second quartile (Q 2 or median), and
the experiment using a mobile phone is 4.65, which is 76%
the third quartile (Q 3 ) of the data. higher than the physical demand using Google Glass.
This difference in physical demand between the smart-
glass and the phone can easily be explained by the fact that
Figure 6 and 7 show the mental demand reported by users smartglasses do require little to no muscle activation for
while performing the experiment respectively indoors and holding. The user can look at the screen through a short eye
outdoors. The results in Figure 8 show that for the indoor movement compared to a handheld smartphone. Comparing
experiment 50% of users experience low mental demand our MPV application to a traditional navigation application
(Q 2 = 4). The curve is skewed towards the left and the upper on smartglasses also shows significant differences in physi-
quartile (Q 3 ) is 5.00, showing that the 75% of users experi- cal demand. Indeed, the data for using a regular navigation
ence low mental demand (< 5). The average mental demand app on MadGaze Glass is strongly skewed towards having
required by 20 users in performing the experiment using a higher physical demand, whereas the data for the same
Google Glass is 3.8. When using the smartphone, partici- experiment with an MVP app shows significantly lower phys-
pants show a much higher mental demand, with much more ical demands. It is however notable that the physical demand
variance in the results. If the first and third quartile are rel- required outdoor is higher in comparison to indoor envi-
atively close (respectively 5 and 7), we observe disparities, ronment as shown by Q 1 in Figure 11. As both applications
with 25% of users experiencing a mental demand between 2 are running on smartglasses in the outdoor experiment, we
and 5, and 25% between 7 and 9. Although the curve clearly can conclude that actively looking at the screen can become
tends towards the right, a non-negligible amount of them strenuous for the user, whereas using peripheral vision al-
reports a low mental demand. When looking at the individ- lows to keep their eye gaze towards their path.
ual results, most users report a lower mental demand for the Frustration levelsPeripheral Vision: A New Killer App for Smart Glasses IUI ’19, March 17–20, 2019, Marina del Ray, CA, USA
Figure 12 and 13 show the frustration level of the users The users report to have spent on average 50% less time look-
during the experiment indoors and outdoors. The curve is ing into the screen of their devices using our MVP model.
more skewed towards the low frustration level region for the In other words, users save approximately 50% more time
Google Glass than for the Xiaomi mobile phone. The Q 1 , Q 2 for their main activity by using their peripheral vision with
and Q 3 for the frustration level as shown in Figure 14 in an smartglasses instead of looking into the screen of a mobile
indoor environment are 1, 2.5, and 4.2 respectively, whereas phone or the display of the glass. They reported their gaze
for a mobile phone is 1.75, 3.5 and 5.2 respectively. This to be directed most of the time towards their path and/or
shows that even though 90% users were first time users of the their main activity instead of the screen. Users can therefore
Google Glass, they experience less frustration in performing focus on the main task without being distracted by the MPV
the experiment using Google Glass than with a mobile phone. application.
The outdoor results are also strongly similar to the indoor The results from the above analysis show that the users re-
results for the frustration level, with a notable point that quire less mental and physical demand while performing the
based on the interquartile range (IQR=Q 3 − Q 1 = 6 − 2 = 4) experiment using Google Glass or MadGaze Glass than with
the frustration for the regular navigation app on MadGaze a regular navigation app on a smartglass or a mobile phone.
Glass is overall higher than all the other experiments. Further, most users experience lower frustration while doing
We also do statistical t-test analysis to further examine the the experiment using a smartglass, even though 90% of them
differences in the metrics. We calculate the paired-sample were unfamiliar with using smartglasses at the beginning
t-test for all data to evaluate the null hypothesis (that is the of the experiment. This allows the users to easily carry out
mean difference between the paired sample data is 0). The both the primary and secondary task simultaneously. Fur-
t-test values for all the indoor data are as follows: ther, users also find it easier to walk on the staircases while
navigating the path through the demo application on Google
t Mental Demand = −1.021, Glass than on a mobile phone, as the MPV model allows
Pr (T 19 ≥ −1.021) = 1 − 0.16 = 0.84 (1) them to focus on their path rather than on the screen. The
users found it more difficult to perform the experiment using
a mobile phone in low light levels. Except for the case of
t Physical Demand = −1.409, color-blind user, other users found it easy to navigate the
Pr (T 19 ≥ −1.409) = 1 − 0.0875 = 0.9125 (2) path using peripheral vision-based navigation demo applica-
tion on the Google Glass. 90% of the users Agree that using
their peripheral vision for the navigation application is more
t Frustration Level = −0.682, beneficial and efficient than looking into the screen.
Pr (T 19 ≥ −0.682) = 1 − 0.2517 = 0.7483 (3) In both indoor and outdoor conditions, our MPV model
performs according to its primary goals:
Given the probability results in the equations (1),(2), and (3),
based on the table of t-distribution values, the probability • The model exploits the peripheral vision properly and
that the means of the two paired-sample data is different is the users do not need to look at the screen to get in-
at least 84%, 91%, and 74% for the mental demand, physical formed of changes in direction.
demand, and frustration level respectively. This shows that • The users spend a low amount of time looking at the
statistically, the sample data for the MVP model is strongly screen, 50% less than a traditional application, keeping
deviating from the same data collected in the experiment their central eye gaze to the main task.
using a mobile phone. Similarly, using the data samples of the • The users experience a low mental and physical de-
outdoor experiments, the probability that the means of the mand when navigation is a secondary task. Our model
two paired-sample data is different is at least 86%, 92%, and allows the users to navigate while focusing on their
71% respectively, indicating that the MVP model performs main task.
even better in an outdoor environment.
User focus and central eye gaze
The user feedback shows that when using the MVP app, Special cases: color blindness and strabismus
the users spend on average a very low amount of time look- Several conditions can affect the detection of movement,
ing into the head-mounted display of the smartglass, whereas color, or even the basic activation of peripheral vision. Among
for the regular navigation app users very often look into the the participants to our study, two users were suffering from
screen. In our questionnaire, we ask the user to report on color blindness and strabismus. This was a good opportunity
the amount of time spent looking into the head-mounted to study the impact of such conditions on our model.
screen with the following discrete scale: 25%, 50%, and 75%. Color blindnessIUI ’19, March 17–20, 2019, Marina del Ray, CA, USA I. Chaturvedi et al. Color blindness is characterized by a decreased ability to 4 CONCLUSION AND FUTURE WORK distinguish colors caused by problems within the color cone In this paper, we have introduced a MPV model that com- system. The most common form of color blindness is the red- bines motion detection with the theories of the peripheral green color blindness. People living with such a condition vision and the color sensitivity of the normal human eye. The experience difficulties differentiating red and green colors. model taps into the peripheral vision of the user to convey As our application is based on red and green visual cues, we information, without having to look at the small screen of expect to observe lower performances for color-blind people. the smartglasses. The MPV model uses the concepts of mo- We tested the indoor application on one color-blind per- tion detection by the peripheral vision, and color perception son. The user did not inform us that he was color-blind and of a human eye. It incorporates rate threshold for motion de- we ran the experiment in the exact same conditions as for tection to make the model adaptable to the varying positions other participants. The participant was unable to complete of head-mounted displays (Section 2). the task. His mental and physical demand levels with the This model can be used on any smartglasses with a head- MVP model are extremely high (respectively 9 and 7). His mounted display overlapping with the peripheral vision with- frustration level also reaches 10. As the participant cannot out any additional hardware requirement. It functions well distinguish between the red and green cues, he has to rely on in both indoor and outdoor environment navigation scenar- looking constantly at the screen for movement. The user also ios. The model resolves the constricted peripheral awareness reports headaches and strain in the eye while performing the problem of the mobile devices and provides a software so- experiment. However, when using the same application on a lution to deal with the small field of view problem of the smartphone, the user reports demand and frustration in the smartglasses (Section 1). first quartile of our result distribution. This is probably due Our experiments on peripheral vision navigation con- to the user starting with the application on smartglass. Even ducted on 20 users show that the model is less demand- though the application on the phone was still not optimal, it ing mentally and physically, and less frustrating for multi- provides intense relief after using the smartglass application. tasking compared with staring into the smartphone screen. This experiment confirms that although a combination On average, user saved 50% more time for other activities by of color and movement can activate the peripheral vision, using their peripheral vision with Google Glass instead of movement alone is not sufficient for our application. We looking into the screen of Xiaomi mobile phone. The user use red and green as they are two primary colors providing assessment survey also shows that 90% of the users find more contrast for most people. For the most common cases using their peripheral vision more beneficial and efficient. of color-blindness, we can adapt the color patterns to the The model also worked in both bright and low light condi- condition. However, in the case of Achromatopsia (no color tions. Compared to a regular navigation application, users detection), our model will lose its validity. were able to focus more on their primary task, and found Strabismus it much less demanding (40 to 50% less) and frustrating. Pe- We also encountered a user suffering from noticeable stra- ripheral vision enabled participants to focus on their main bismus, characterized by a misalignment of the eyes when task, with their central eye gaze being directed at the screen looking at an object. This user reports mental and physical 50%less than when using the MPV model on a smartphone demand levels in the third quartile when using our appli- or a navigation application on smartglasses. cation (respectively 6 and 7) with a low frustration level at In the future, we would like to extend our work and ex- 2. Interestingly, the mental demand when using the smart- periment on different scenarios such as augmented reality phone is significantly higher (9), but the physical demand and virtual reality games, etc. We are also considering the is slightly lower (6). Indeed, the short distance to the screen possibilities to enhance our model with eye tracking features. of the smartglasses caused a slight strain to activate the eye. Finally, we should expand our panel of users to people suf- Similarly, the frustration level when using the smartphone fering from strabismus and color-blindness to precise the was slightly lower (1). evaluation of such conditions on our model. Although not significant, these results show that either our MPV model or smartglasses, in general, are not adapted to people with this condition. However, to precisely eval- 5 ACKNOWLEDGEMENTS uate the impact of each of these components, we should The authors thank the anonymous reviewers for their in- acquire smartglasses with the display on the left side. This sightful comments. This research has been supported, in setup would allow eliminating the interrogations regarding part, by projects 26211515, 16214817, and G-HKUST604/16 one eye being less sensitive than the other. Similarly, smart- from the Research Grants Council of Hong Kong, as well as glasses with a screen on both eyes may mitigate the effect of the 5GEAR project from the Academy of Finland ICT 2023 strabismus on peripheral vision by introducing redundancy. programme.
You can also read