Financial and Fiscal Commission: Submission on the 2020 Fiscal Framework and Revenue Proposals
←
→
Page content transcription
If your browser does not render page correctly, please read the page content below
Financial and Fiscal Commission:
  Submission on the 2020 Fiscal
Framework and Revenue Proposals
     For an Equitable Sharing of National Revenue

                       02 March 2020

                Financial and Fiscal Commission
            Montrose Place (2nd Floor), Bekker Street,
             Waterfall Park, Vorna Valley, Midrand,
             Private Bag X69, Halfway House 1685
                         www.ffc.co.za
                      Tel: +27 11 207 2300
                      Fax: +27 86 589 1038
ii FFC: Submission on the 2020 Fiscal Framework and Revenue Proposals
Contents
List of acronyms .................................................................................................................................... iii
List of tables........................................................................................................................................... iv
List of figures ......................................................................................................................................... iv
1. Background and overview .................................................................................................................. 1
2. Economy and society .......................................................................................................................... 4
2.1 State of the economy and implications ............................................................................................. 4
2.2 Economic prospects .......................................................................................................................... 8
2.3 Diagnosis and government strategy ................................................................................................ 12
2.4 Comment by the Commission ......................................................................................................... 14
3. Fiscal Framework and Revenue Proposals ....................................................................................... 16
3.1 The South African fiscal framework............................................................................................... 16
3.2 Strategy for fiscal consolidation ..................................................................................................... 18
3.3 Structure of revenue and additional revenue initiatives .................................................................. 22
3.4 Considerations of the fiscal framework and revenue proposals...................................................... 23
3.4.1 Distributing the cost of consolidation ................................................................................... 23
3.4.2 Credibility and soundness of consolidation strategy............................................................. 23
3.4.3 Fiscal futures (revenue and expenditure) .............................................................................. 24
References ............................................................................................................................................. 26iii FFC: Submission on the 2020 Fiscal Framework and Revenue Proposals
List of acronyms
GDPG Gross Domestic Product
HCI Human Capital Index
IMF International Monetary Fund
MTBPS Medium Term Budget Policy Statement
PRASA Passenger Rail Agency of South Africa
SARB South African Reserve Bank
SONA State of the Nation Address
Stats SA Statistics South Africa
UIF Unemployment Insurance Fundiv FFC: Submission on the 2020 Fiscal Framework and Revenue Proposals
List of tables
Table 1 - The consolidated fiscal framework (R billion, selected years).............................................. 16
Table 2 - The consolidated fiscal framework (elements as percentage of GDP, selected years).......... 17
Table 3 – Growth in available funds ..................................................................................................... 19
Table 4 - Consolidated expenditure by economic classification, 2016/17 to 2022/23 ......................... 21
Table 5 - Structure of budget revenue ................................................................................................... 22
List of figures
Figure 1 - Socio-economic trends 2008 to 2018 ..................................................................................... 4
Figure 2 - Trends in basic education output quality................................................................................ 7
Figure 3 - Contributions to growth in expenditure on GDP for selected sectors, 2019Q1-2019Q3 ..... 10
Figure 4 - Contributions to growth in GDP for selected sector, 2019Q1-2019Q3 ............................... 121 FFC: Submission on the 2020 Fiscal Framework and Revenue Proposals
1. Background and overview
This document is prepared in terms of Section 4 (4c) of the Money Bills Amendment Procedure
and Related Matters Act, 2009 (Act No. 9 of 2009), as amended, which requires parliamentary
committees to consider any recommendations of the Financial and Fiscal Commission (FFC)
(hereafter the Commission) when considering Money Bills. It is also made in terms of the
Financial and Fiscal Commission Act, 1997 (Act No. 99 of 1997), as amended, which requires
the Commission to respond to any requests for recommendations by any organ of state on any
financial and fiscal matter.
In this document the Commission recaps the key features of the current socio-economic and
fiscal situation and prospects, as also set out in Budget documents. It then summarises the
government economic and fiscal strategy (the latter reflected in estimates for the fiscal
framework and revenue) and makes comments on these. This is done in two sections, one
dealing with broader economic developments and economic policy and a second dealing more
narrowly with the fiscal framework and fiscal policy stance.
The continued weakening of the South African economy as reflected in declining per capita
economic growth numbers and further rising unemployment is threatening the social gains
South Africa has made over the last 25 years.
After 1994, and continuing up until 2017 in terms some estimates, South Africa has managed
to reduce poverty substantially and can be argued to have seen a slightly improved class
structure. However, there has been little progress in terms of inequality, which remains among
the highest in the world.
The last decade, on the back of sustained government investment, has seen an improvement in
basic education outcomes as measured in international standardised assessments. This was
accompanied by a substantial expansion and transformation of our post-school education
sector. Average life expectancy is estimated to have increased by nearly 10 years over the last
decade. These substantial achievements in building the human capital and capabilities of South
African cannot be lost. They are, however, threatened by the current economic and fiscal
trajectory. Slow growth has impacted on government revenues leading to rising deficits and
debts which is constraining government’s ability to invest in society and economy. Further
investments are required if inequality is to be redressed.
The government strategy as outline in Budget 2020 focuses on driving structural change in the
economy, improving the efficiencies and impact of government, and on fiscal consolidation.
In terms of driving structural change, Budget 2020 reiterates an ambitious transformation
strategy to deal with network industries, levels of competition and access in the economy,
expanding exports and supporting labour intensive sectors. It also lists several areas where
government is busy or intends to resolve regulatory matters, in order to create policy certainty
and open opportunities (Examples are the Integrated Energy Resources Plan and energy
generation, visa reforms and spectrum licensing).2 FFC: Submission on the 2020 Fiscal Framework and Revenue Proposals
While progress on all these matters are important the Commission believes that, given the
complexity of the task, careful prioritisation and a phased approach over time is necessary. In
order to start creating trust through visible progress, a focused strategy could start with a more
decisive turnaround at the South African Revenue Services and at the Director of Public
Prosecutions. Progress in this area by enforcing the rule of law, but also through creating
certainty on government’s fiscal resolve and a faster turnaround in government revenue, will
ripple through to the economy.
The Commission also believes that South Africans should take stock of the factors underlying
policy uncertainty and unsatisfactory implementation. These could be the result of intense
conflict in society between those who expect to gain and those who expect to lose from
structural and other change leading to blocking of innovative change. South Africa is replete
with examples, from the introduction of e-tolls and ride-hailing to conflicts around spectrum
release and the migration to digital television. At the heart of the conflict lies inequality and
the unequal benefits of change.
Societies require mechanisms to buy-in those who stand to lose from change. Otherwise change
and implementation of change will be blocked, whether through activism or unobtrusively.
This points to the inadequacy of our social protection system and other mechanism to deal with
the impact of change. The Unemployment Insurance Fund is an example in the way it covers
only a small part of the unemployed and of those at risk of unemployment. It is in this context
that South Africans should see the President and government’s raising the notion of a sovereign
wealth fund which could be seen as a mechanism to give all South Africans a positive stake in
economic and social change.
In terms of fiscal stabilisation and the fiscal framework the South African government
clearly shows the rapid weakening of South Africa’s fiscal situation and the threat coming from
the costs of an increasing deficit and debt. Urgent action is indeed necessary to reduce the
annual deficit and slow down debt accumulation and government’s resolve is welcomed.
Government proposes consolidation through downward adjustment of spending baselines and
rapidly arresting the growth of government expenditure. Restraining expenditure comes
primarily through reducing some large infrastructure grants (most to provinces and local
government) and reducing the provision for wage payments. Slowing wage growth will require
renegotiation of the current wage agreement with public sector unions as the agreement makes
provision for above inflation increases for certain categories of workers in April 2020.
Government leaves the tax structure mostly intact except it makes adjustments for inflation and
argues that an attempt to increase revenues through taxes is likely to hamper economic recovery
and that from a comparative and competitive perspective South African tax (and expenditure)
ratios are already high.
The Commission respects the government’s judgement on constraints on the revenue side but
questions whether the cost of fiscal adjustment could not have been spread beyond civil
servants, and the users of public services who are likely to see a reduction in service levels.
While there is an argument to make that civil servants have benefited strongly from economic
and social change, there are other groups at the top of the SA income distribution that have also
gained and may have gained more. In addition, the Government makes neutral assumptions in
the budget about the potential revenue gains from the rebuilding of the South African Revenue
Service. This seems to be a situation that calls for a more comprehensive social pact to
distribute the cost of consolidation among all those who are likely to benefitting.3 FFC: Submission on the 2020 Fiscal Framework and Revenue Proposals
In terms of the fiscal framework the Commission notes the sometime exciting, sometimes
destructive changes that the world is increasingly subject to. Climate change, population
change, and migration, new technology and power shifts are creating opportunities for South
Africans, but also risks. The country should more intensively investigate and deliberate on how
these changes could impact our fiscal framework on both the revenue and expenditure sides.
On the revenue side the questions relate to how technological change will affect social assets
and income streams and how to ensure that the fiscal system does not lag, obstruct or miss
these developments. The taxation of the digital economy is a case in point. But also, on the
expenditure side South Africa should deliberate on their potential fiscal futures and whether
current assumptions about appropriate revenue and expenditure to GDP ratios can give us the
society we want with high levels of solidarity, mobility and equality.4 FFC: Submission on the 2020 Fiscal Framework and Revenue Proposals
2. Economy and society
2.1 State of the economy and implications
Budget 2020 tells a now well-known story of a South African economy that has weakened over
the last decade, and its implications for South Africans.
After recovering somewhat from the great recession of 2009, South African economic growth
has been on an almost constant deceleration. From 3.3 per cent in 2011 (Error! Reference
source not found.), economic growth dropped to 0.4 per cent in 2016 and has moved sideways
since then (with the latest SARB estimate for 2019 again at 0.4 per cent1 and the National
Treasury’s estimate at 0.3 per cent). Declining growth, combined with population growth at
about 1.5 per cent per year, translated into negative real per capita growth from 2015 onward.
On average, the income available to South Africans to sustain themselves and invest for the
future is declining.
Figure 1 - Socio-economic trends 2008 to 2018
Source: Data from South African Reserve Bank (2019) StatsSA (2019); Zizzamia, Schotte and Leibbrandt (2019)
Declining growth has been mirrored by rising unemployment, increasing from the very high
rate of nearly 22 per cent in 2008 to 29.1 per cent at the third quarter of 20192. Taking into
account broad unemployment (including the discouraged work seekers), youth unemployment
and the high share of long-term unemployment, the situation is even more alarming. current
reports suggest that the progressive weakening of the economy will see further rises in
1
Parliamentary Monitoring Group. 2020. SARB on Economic Performance and Outlook. Minutes of
Parliamentary Finance Standing Committee 18 February 2020.
2
Statistics South Africa. 2019. Quarterly Labour Force Survey 4 2019. Pretoria: Government Printer.5 FFC: Submission on the 2020 Fiscal Framework and Revenue Proposals
unemployment. Given the limited support for the unemployed in South Africa (primarily
through means of the Unemployment Insurance Fund (UIF) which covers only formal sector
workers and a small proportion of the unemployed) and the relatively small size of the informal
and unrecorded sector in South Africa, these levels of unemployment translate into huge
pressure on those who are working or receiving a social grant to provide the safety net for those
not working.
Somewhat surprising, but only taking up to 2017 into account, recent poverty and inequality
measures do not show an increase in poverty and inequality which could be expected given the
weakening growth. The National Income Dynamics Study (NIDS) (Figure 1) reports that after
spiking to 65.7 per cent in 2010 (as a result of the great recession), poverty measured with the
upper-bound poverty line declined consistently to 52.2 per cent in 2017. Statistics South Africa
(Stats SA), however, measured an increase in poverty between 2011 and 2015 (from 53.2 per
cent to 55.5 per cent on the upper-bound poverty line), but nevertheless remaining well below
the 66.6 per cent level of 2006.3
Regarding inequality Stats SA reports a slight improvement in inequality between 2006 and
2015 (with the Gini-coefficient at 0.65 in 2015 against 0.67 in 2006 and the share of the top 10
per cent of income earners declining from 57.2 per cent to 52.6 per cent)4. Taking a different
approach to inequality through defining different economic classes, Zizzamia et al shows the
continuing huge inequality in South Africa with a very small “middle class” (22.4 per cent and
the majority of South Africans (72 per cent falling into the categories of “chronic poor”,
“transient poor” and “vulnerable”.5 While there is no doubting the continuing extreme poverty
and inequality in South Africa, comparing 2008 and 2017 shows a decrease of those in chronic
poverty from 52.0 per cent to 42.0 per cent of the population, which is balanced by an increase
in the transient poor (0.2 percentage points), the vulnerable (5.8 percentage points), the middle
class (3 percentage points) and the elite (0.9 percentage points). (See Figure 1)
3
Zizzamia, R, Schotte and Leibbrandt, M. 2019. Snakes and Ladders and a Loaded Dice: Poverty dynamics and
inequality in South Africa between 2008 and 2017. WIDER Working Paper Series wp-2019-25, World Institute
for Development Economic Research (UNU-WIDER). Stats SA. 2018. Subjective Poverty in South Africa:
Findings from the Living Conditions Survey 2008/2009 – 2014/2015. Pretoria: Government Printer. The latter
study argues that subjective poverty levels in South Africa have declined between 2009 and 2015 when they are
measured by the three subjective poverty measures: Self-Perceived Wealth Indicator (SPWQ), Minimum Income
Question (MIQ) and Income Evaluation Question (IEQ). According to the SPWQ indicator, subjective poverty
levels decelerated from 39.2 percent 2009 to 35 percent in 2015. Based on the MIQ indicator, subjective poverty
levels fell from 59.3 percent in 2009 to 50.7 percent in 2015. In terms of the IEQ indicator, subjective poverty
levels decreased from 58 percent in 2009 to 50.4 percent in 2015.
4
Stats SA. 2019. Inequality … . Pretoria: Government Printer.
5
Zizzamia et al. describe their definitions for “social stratification” as follows: “… we distinguish those with
chances of exiting poverty below the observed average exit rate and thus face a comparatively high risk of poverty
persistence – the chronic poor – from those with above average chances of making it out of poverty – the transient
poor. Analogously, among those currently above the poverty line, we distinguish those who face an above average
risk of slipping into poverty – the vulnerable – from the more secure “actual” middle class, whose members face
a below-average risk of falling into poverty and thus have better chances of sustaining a living above the
subsistence level.”6 FFC: Submission on the 2020 Fiscal Framework and Revenue Proposals
The significant question is how rapidly economic deterioration will impact more strongly on
(measured) poverty and inequality which is likely to fuel substantial further social pressures.
Increasing social tensions will lead to worsening of social protest, unrest, crime and corruption.
While some indicators show South Africa as quite “normal” in terms of corruption (in the sense
that corruption levels are “predictable” given our level of development, inequality and state
capacity)6, further worsening of social indicators will impact on protest, crime and corruption
and is likely to drive furthering weakening of economic confidence.
In addition to raising the spectre of social disintegration and a downward spiral of instability
and economic weakening, the weakening economy is also impacting on the availability of
government revenue and the fiscal situation and thus the ability of government to intervene in
ameliorating hardship and social pressures. The weakening of the South African fiscal
situation, indicated by continuing high deficits and a rapidly growing debt burden, is discussed
as part of the next chapter on the fiscal framework. It is, however, a key factor in economic
performance as debt ratios influence confidence levels as well as the cost of capital, and hence
investment.
Income streams (production) and social conditions are rooted in a range of underlying factors
of which an important part is the assets ownership of South Africans. The assets available to
South Africans7 to mobilise or leverage through organisations8 are central to livelihoods and
jobs and thus the standard of living. In seeking to envisage futures, it is therefore also important
to ask about the asset status of South Africans.
Asset poverty is even more common than income poverty among South Africans and asset
inequality is even higher than income inequality. Stats SA found that in South Africa, wealth
inequality is considerably higher than income inequality, with the wealth Gini coefficient being
estimated at 0.94 in 2014/15. Furthermore, while the top 10 per cent of the population has a
56-58 per cent share of income, it has approximately 95 per cent of all wealth.9 10
Regarding human capital (mostly educational attainment, skills and health), the South African
situation is also regarded as quite dismal. The World Bank’s Human Capital Index (HCI) can
range from 0 to 1 (with 0 at the worst end of the scale and 1 at the best end) and focuses on
health and education achievements by calculating a composite index including child and adult
survival rates, stunting and completed school years adjusted for amount of learning (with
6
See International Monetary Fund. 2020. South Africa – 2019 Article IV Consultation Staff Report (IMF Country
Report No 20/33), Figure 10, “Better governance has multitude of benefits, including higher tax revenue.”
Washington, DC: International Monetary Fund.
7
From natural resources and land to physical and financial assets but also human capital and social capital.
8
Markets, firms, associations, communities, households.
9
Statistics South Africa. 2019. Inequality Trends in South Africa: A multidimensional diagnostic of inequality.
Pretoria: Government Printer.
10
See also Wittenberg, M. and Leibbrandt, M. 2017. They argue that a “picture of falling asset inequality [between
1993 and 2008] contrasts sharply with the money-metric analysis of inequality over the same period. The latter
narrative is one of very high inequality in 1993 that does not fall over the post-apartheid years. Substantively, our
empirical work suggests that the money-metric approach to inequality measurement in South Africa may have
obscured the real progress in large portions of the population and in important dimensions of inequality.”7 FFC: Submission on the 2020 Fiscal Framework and Revenue Proposals
learning measured through performance in international standardised test). In 2018, the South
African HCI was 0.41, far down the ranking, with South Sudan in the worst position at 0.30
and Singapore in best position at 0.88. Brazil is at 0.56 and Rwanda at 0.37.11
If one goes beyond ranking to direction of change, there may be more room for positive
expectations. Education analysts have pointed out that on international standardised
assessments, South African education results have improved as rapidly as can be expected and
that the problem is with the starting point , i.e., the huge schooling inequalities as an apartheid
heritage, rather than the direction and rate of change. In a recent review of the evidence
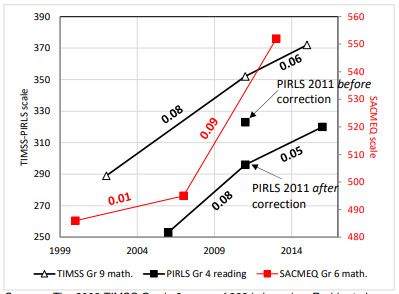
Gustafsson concludes that of the three main international standardised assessments in which
South African participates, basic education output quality is improving at what is an
“international speed limit”12. Much remains to be done, and much of the improvement may be
due to general environmental factors such as lower poverty and rising general literacy, rather
than focused improvement of the education situation, but the fact of improvement impacts
positively on South Africa’s prospects.
Figure 2 - Trends in basic education output quality
Source: Gustafsson 2020
The successful implementation in a heavily resource-constrained health system of the largest
anti-retroviral programme in the world has also been associated with a dramatic turn-around in
South African life expectancy. StatsSA in its 2019 mid-year estimates indicates that average
life expectancy at birth improved from 55.9 to 64.7 between 2002 and 2019. This was
associated with a decline of the infant mortality rate from 56.5 per 1 000 births to 22.1 per
1 000 over the same period and a decline in the under-5 mortality rate for 79 per 1 000 to 28.5
11
See https://www.worldbank.org/en/data/interactive/2018/10/18/human-capital-index-and-components-2018. A
guide is provided in Kraay, A. 2019. The World Bank Human Capital Index: A Guide. World Bank Research
Observer 43(1). pp 1-33. Washington, DC: The World Bank
12
Gustafsson, M. 2020. A revised PIRLS 2011 to 2016 trend for South Africa and the importance of analysing
the underlying microdata. Stellenbosch Economic Working Papers: WP02/2020.8 FFC: Submission on the 2020 Fiscal Framework and Revenue Proposals
per 1 000. While there is also a long way to go in respect of life expectancy rates, these
improvements imply substantial reductions in the costs of morbidity and loss of lives.
While economic and social conditions are therefore threatening and seemingly on a downward
slope, the turnaround in human capital endowments and shifting access to a complete range of
assets and opportunities may be offering a foothold for the future. Much, however, will depend
on the policy responses to the current situation which will have to focus on ensuring that gains
over the past two decades are not reversed.
2.2 Economic prospects
South Africa faces a daunting economic and socio-political future. In neither the international
nor the domestic environment do factors point to a rapid turnaround in growth prospects. As
pointed out clearly by the government in the budget presentations and documents, growth
projections have been adjusted downward for several years and projections going forward are
for muted growth rates.
According to the South African Reserve Bank (SARB), growth is expected to significantly
accelerate to 1.2 per cent and 1.6 per cent in 2020 and 2021 respectively. The World Bank
projects growth to reach 0.9 per cent in 2020 before further increasing to 1.3 per cent in 2021.
The IMF projected the most pessimistic growth outlook at 0.8 per cent for 2020, 1 per cent for
2021 and then recovering somewhat to 1.3 per cent and 1.5 per cent in 2022 and 2023
respectively. GDP growth is therefore projected to stay below population growth for the next
three years.13
On the demand side of the economy, household consumption is a vital driver of economic
growth. On year-on-year basis, the growth rate of this sector declined from 2.1 per cent in 2017
to 1.8 per cent in 2018. On a quarter-on-quarter basis, growth in the sector fell from 2.6 per
cent in the second quarter of 2019 to only 0.2 per cent in the third quarter. The average growth
of the sector in the first three quarters of 2019 was 1.1 percentage point higher than in the
corresponding period of 2018. The sector added only 0.1 per cent to GDP in the third quarter
of 2019. The main positive contributors to growth in the sector were expenditures on food and
non-alcoholic beverages as well as restaurants and hotels. The performance of the sector is
consistent with the slower growth in households’ real disposable income and weaker consumer
confidence. Households are confronted with a number of challenges including high and rising
unemployment, slow wage growth, higher taxes, and rapidly rising electricity and water prices.
Moreover, the FNB/BER Consumer Confidence Index declined significantly from 5 index
points in the second quarter of 2019 to -7 in the third quarter. The prospects for this important
driver of economic growth appear bleak.
Fixed investment has been stuck in a low trend, but the SARB reports that some momentum is
emerging. On year-on-year basis, investment declined from an expansion of 7.2 per cent in
13
International Monetary Fund. Ibid.9 FFC: Submission on the 2020 Fiscal Framework and Revenue Proposals
2013 to a contraction of 1.4 per cent in 2018. On a quarter-on-quarter basis, gross fixed capital
formation expanded by 4.5 per cent in the third quarter of 2019 after increasing by 5.8 per cent
in the second quarter. Investment by the private business enterprises expanded by 10.8 per cent
in the third quarter of 2019, following an expansion of 15.8 per cent in the second quarter.
Public corporation investment increased marginally by 0.2 per cent in the third quarter of 2019,
following a substantial contraction by 11.9 per cent in the second quarter. Investment by
general government contracted sharply by 17.8 per cent in the third quarter, following another
massive deceleration by 16.3 per cent in the second quarter. Fixed investment added only 0.9
per cent to GDP in the last quarter of 2019, after adding 1.1 per cent in the second quarter.
Weaknesses in human capital, infrastructure, and the business environment are key factors that
constrain private investment and growth in South Africa. Innovation, a key condition for
productivity growth, is extremely low with private research and development (R&D)
accounting for only 0.3 per cent of GDP14. These factors make it difficult to move to higher-
value activities in agriculture, manufacturing, and services that are needed to boost growth in
South Africa.
The importance of structural reforms is underscored by the lukewarm performance of
international trade. On year-on-year basis, exports have declined from an expansion of 4 per
cent in 2013 to 2.6 per cent in 2018. Imports have decelerated from an expansion of 5 per cent
in 2013 to 3.3 per cent in 2018. On a quarter-on-quarter basis, exports increased by 3.5 per
cent in the third quarter of 2019, followed by a contraction of 1.5 per cent in the second quarter.
Imports decelerated by 6.8 per cent in the third quarter of 2019, followed by an expansion of
18.3 per cent in the second quarter. Figure 3 shows the contributions to growth in expenditure
on GDP for selected sectors from the first to the third quarters of 2019. Relatively high wages,
an inadequate logistics infrastructure, the regulatory burden on private companies and policy
uncertainty make it difficult to compete with low-cost manufacturing destinations and build a
more export-oriented economy.
14
See The World Bank. 2017. South Africa Economic Update: Innovation for productivity and inclusiveness,
Washington, DC: The World Bank.10 FFC: Submission on the 2020 Fiscal Framework and Revenue Proposals
Figure 3 - Contributions to growth in expenditure on GDP for selected sectors, 2019Q1-
2019Q3
4
2
0
Households Gross fixed capaital Exports Imports
-2 formation
-4
-6
-8
-10
2019Q1 2019Q2 2019Q3
Source: South African Reserve Bank, 2019
The national saving rate (gross saving as a percentage of nominal GDP) for South Africa
declined marginally from 14.8 per cent in the second quarter of 2019 to 14.5 per cent in the
third quarter. The decline is a result of dissaving by general government. The saving rate of
corporate business enterprises increased moderately whereas that of households stagnated or
remained constant. Gross saving as a percentage of GDP for the corporate sector accelerated
to 13.5 per cent in the third quarter of 2019 from 12.6 per cent in the second quarter. General
government saving rate decelerated from 0.9 per cent in the second quarter of 2019 to a
dissaving of 0.4 percent in the third quarter. This reversal in government saving rate could be
explained by the decline in government revenue as a result of lower corporate and personal
income tax receipts, which was not fully compensated for by the slower pace of increase in
government’s nominal expenditure. Gross saving by the household sector as a percentage of
GDP remained unchanged at 1.4 per cent in the third quarter, as the increase in nominal
disposable income was fully offset by that of nominal consumption expenditure.
On the supply side of the economy, the finance, real estate, and business services sector remains
South Africa’s main engine of growth. On year-on-year basis, the sector has grown since 2015
more than any other sector. On a quarter-on-quarter basis, it is the only sector that has not
contracted since the first quarter of 2016. In the first three quarters of 2018, the sector grew at
an average of 2.6 per cent. In the third quarter, the main reasons for the strong performance are
financial intermediation, auxiliary activities, real estate activities and business services. The
sector added 0.3 per cent to GDP in the third quarter of 2019, the second highest contribution
across all sectors.
The manufacturing sector continues to struggle. On year-on-year basis, the sector has not
grown by more than 1 per cent since 2013. On a quarter-on-quarter basis, the manufacturing
sector contracted by 3.9 per cent in third quarter of 2019 and shaved off 0.5 per cent off GDP11 FFC: Submission on the 2020 Fiscal Framework and Revenue Proposals
growth. Six of the ten manufacturing divisions recorded negative growth rates in the third
quarter of 2019: basic iron and steel; non-ferrous metal products; metal products and
machinery; petroleum, chemical products, rubber and plastic products; and wood and wood
products; paper, publishing and printing.
Th rising input costs, reductions in some commodity prices, inconsistent electricity supply and
moderation in global economic growth continue to suppress activity in the mining sector. On
year-on-year basis, the growth rate of the sector has plummeted from an expansion of 4 per
cent in 2013 to a contraction of 1.7 per cent in 2018. On a quarter-on-quarter basis, the mining
sector contracted by 6.1 per cent in the third quarter of 2019 and by an average of 2.2 per cent
in first three quarters of 2019. The sector subtracted 0.5 percentage points from GDP growth
in the third quarter, with platinum group metals (PGMs), iron ore, coal and other metallic
minerals contributing the most to the decline.
The large swings in production in the agriculture sector continues to have significant impacts
on economic growth. On a year-on-year basis, the growth rate of the sector decelerated from a
significant expansion of 21.1 per cent in 2017 to a contraction of 4.8 per cent in 2018, resulting
in the sector being the main reason for the technical recession in 2018. On a quarter-on-quarter
basis, the agriculture sector contracted by 3.6 per cent in the third quarter of 2019, and by 9.1
per cent in the first three quarters of 2019 than in the corresponding period of 2018. It subtracted
0.1 percentage points from the GDP growth in the first quarter of 2019. The decrease resulted
from a decline in the production of field crops. Figure 4 shows contributions to growth in GDP
for selected sectors from the first to the third quarters of 2019. The sector urgently requires
more effective support to emerging farmers in order to increase its contribution to growth. It is
structurally dualistic primarily because production it is highly dependent on a small number of
large capital-intensive commercial farms, while smaller farms face low economies of scale and
inadequate access to financing. Emerging farmers also lack critical skills to enable them to
exploit knowledge and technological advancements in the sector. The sector is also being held
back by fragmented governance that is spread across several departments.12 FFC: Submission on the 2020 Fiscal Framework and Revenue Proposals
Figure 4 - Contributions to growth in GDP for selected sector, 2019Q1-2019Q3
1,5
1
0,5
0
Agriculture, forestry Mining Manufacturing Finance, real estate
and fishing and business services
-0,5
-1
-1,5
2019Q1 2019Q2 2019Q3
Source: South African Reserve Bank, 2019
The assumptions underpinning the slightly improved growth prospects are accelerated
structural reforms and increases in public and private investments. The electricity supply
outages and external demand are expected to restrain economic growth to less than 2 per cent
in the medium term.15
2.3 Diagnosis and government strategy
In the 2019 Medium Term Budget Policy Statement (MTBPS), the National Treasury discusses
the great deceleration of growth in the South African economy over the last decade and what
must be done. In response to the question, “The growth puzzle: why so weak so long?”, the
National Treasury argues that the international environment (steadily rising growth and low
interest rates) and monetary policy (depreciating currency, contained bond yields, inflation
anchoring) have been generally supportive or accommodating of stable growth in recent years
(drought, however, is noted as a complicating factor). Politics and policy have, however, it is
argued, been unable to deal decisively with a range of “structural problems that are well
understood”. The National Treasury then suggests that while the appropriate macroeconomic
policies are in place, the focus needs to be on “microeconomic policy” and reforms, presumably
to deal with the structural factors, and “ensur[e] a well-regulated, efficient business
environment that encourages innovation and the creation of new businesses.16 Progress on these
“policies” has been limited and, presumably together with actual economic conditions, “policy
and political uncertainty” have impacted negatively on business and consumer confidence and
hence investment and growth.17
15
International Monetary Fund. Ibid.
16
For similar thinking, also shifting the focus away from monetary and fiscal policy and pointing to structural
factors, “microeconomic policy” and “politics” (in the case of Sachs) see Naidoo, K. 2019. Don’t blame the goalie
if the striker can’t score, and Sachs, M. 2019. Both directions at once: Fiscal policy in South Africa. Both in New
Agenda South African Journal of Social and Economic Policy, Vol 75.
17
See The National Treasury. 2019. Medium Term Budget Policy Statement. Pretoria: Government Printers.13 FFC: Submission on the 2020 Fiscal Framework and Revenue Proposals
Under structural issues, the National Treasury in the MTBPS 2019 lists “high levels of
inequality, spatial disparities, low levels of education, the uneven quality of public services and
inadequate state capacity”.
In terms of structural constraint and the microeconomic constraints on growth, Budget 2020
reverts more to the National Treasury’s August 2019 discussion document, “Economic
transformation, inclusive growth, and competitiveness: Towards an economic strategy for
South Africa”18. A central mechanism in this approach is to reduce the costs of doing business,
of finding work and the cost of living. This could be seen as a strategy to remove obstacles to
citizens using opportunities, and to empower citizens as producers (both as workers and
business people) and as consumers.
This empowerment through lowering costs or obstacles targets can be seen as including19:
• Continuation of current macroeconomic policies (low and stable inflation, a flexible
exchange rate, and a sustainable fiscal framework) to reduce uncertainty and risk in
investment decisions, and support business and consumer confidence.
• Modernising and reforming network industries, restructuring inefficient and state-
owned companies and inviting private-sector participation
• Promoting competition and small businesses.
• Export-orientated industrial policy for stimulated export demand.
• Promotion of labour intensive sectors (especially, agriculture, services and within (or
across) the latter, tourism.
• Focused and flexible industrial and trade policy.
The IMF20 also refers to the “structural nature of the growth slowdown” and the need for
“reforms that reduce the cost of doing business and boost private investment” but have a
perhaps somewhat narrower list than the National Treasury. The IMF and National Treasury
lists do not overlap perfectly The IMF’s list of structural issues includes governance which is
related to the Treasury’s quality of public services and state capacity and SOE weaknesses,
which point to network industries. In its indicators, the IMF is more explicit about corruption,
reflecting South Africa’s standing in the global corruption rankings and also refers specifically
to quality of schooling: “from the supply side there is much room to improve education and
attainment and skills”. The primary difference between the National Treasury and the IMF is
the centrality of focus of the IMF on concentration, lack of competition and elevated price
levels in product markets (and hence the need for stronger competition policy) and in
maintaining its critique of the inflexibility of South African labour markets.
18
The National Treasury. 2017. Economic transformation, inclusive growth, and competitiveness: Towards an
Economic Strategy for South Africa. Pretoria: The National Treasury.
19
The National Treasury summaries of the strategy highlight different parts in different contexts. Normally macro-
economic policy is not included, but it is in the case of Budget Review 2020 which identifies only three of the
five strategies in the discussion document.
20
International Monetary Fund. Ibid.14 FFC: Submission on the 2020 Fiscal Framework and Revenue Proposals
In addition to the broad thrust of the economic strategy, with a longer-term focus, National
Treasury also raises:
• Measures already in progress (in the MTBPS falling under blockages in Budget 2020)
including the Integrated Energy Resources Plan, visa reforms and spectrum licensing;
and
• Reforms to be implemented without delay, including further tourism and red tape
reform, opening up energy generation, conditions for the expansion of fibre
infrastructure and improvements in business and deeds registration.
2.4 Comment by the Commission
The Commission agrees that the obstacles to South African economic and social development
are not easy or superficial, and hence could be called structural. These structural problems or
constrain citizens as business owners and entrepreneurs, as workers and as consumers. The
focus therefore on the cost of living, the cost of working and the cost of doing business (as in
Budget 2020) is useful as an intermediate objective. What becomes less helpful in the National
Treasury and IMF approaches are the proliferation of structural factors, the lack of reasoned
prioritisation and the vagueness of strategies.
The Commission also points out that in trying to reduce cost to business, workers and
consumers it is important to value collective provision and collective action as mechanisms to
reduce costs. While National Treasury and the IMF continue to raise privatisation and more
flexible regulation, the high cost of work in South Africa is primarily due to the apartheid
spatial structure and the failure to address this structure through spatial planning and public
transport. More attention is therefore required on the issues of why some aspects of public
provision have failed or remain so resistant to change? Policy uncertainty in the shape of failure
to make decisions or force their implementation, and the lack of accountability seem to play an
important role in these failures. Specific examples of failures include digital transition of
television, availability of spectrum, roll-out of fibre, current stalemate with regard to e-tolls
and the continuing stand-off between Uber-drivers and metered taxis.
In many cases, this policy uncertainty relates to more than just weak leadership and
incompetent officials; it is part of real conflicts of interests between different groups of South
Africans and often to different groups in business. South Africa has been changing rapidly and
has to go through a range of further change as a number of structural drivers impact on the
country, including population change and migration, climate change, technological change and
innovation, and power or political economy shifts. These shifts bring benefits to some South
Africans (e.g. those with the ability to invest in solar power, thereby decreasing their
contribution to climate change) on the one hand, but risks and costs to others (e.g., coal miners
and coal transporters who lose jobs and income respectively as reliance on coal is decreased as
part of addressing climate change) on the other. If South Africans who stand to lose are not
included in significant numbers, a range of potentially positive structural changes will be
resisted. The mechanism devised by societies to deal with the costs and resistance to change15 FFC: Submission on the 2020 Fiscal Framework and Revenue Proposals
are social protection and negotiation and pacts about costs and benefits. South Africa has such
mechanism of social protectionism such as UIF, but the coverage is generally woeful and in
the case of negotiation between social partners, NEDLAC seems to be failing us.
In his State of the Nation Address (SONA), President Ramaphosa urged South Africans to
overcome fear. Many of the country’s citizens fear change because, as the NIDS analysis
shows, the socio-economic positions in which they find themselves are tenuous. Society will
have to support its citizens in removing those fears through fair negotiation of the costs and
benefits of change and putting in place the mechanisms to ensure buy in by those who
temporarily loose economically through no fault of their own. Otherwise politics, policy and
the economy will remain gridlocked, as is currently happening in respect of the Gauteng
freeway system as a result of conflict and indecision about financing.
Technological change will provide South Africa with the tools to move forward if we can
negotiate a fair distribution of the gains from technological change which will bring new assets
and income potentials. In this context, a sovereign wealth fund as a tool for inclusion through
investing in South African and their assets may provide a vehicle for moving forward.16 FFC: Submission on the 2020 Fiscal Framework and Revenue Proposals
3. Fiscal Framework and Revenue Proposals
3.1 The South African fiscal framework
Table 1 - The consolidated fiscal framework (R billion, selected years)
2016/17 2019/20 2022/23
Outcome Revised Estimate
R billion estimate
Revenue 1 285,6 1 517,0 1 791,3
Expendi ture 1 442,6 1 843,5 2 141,0
Non-i nteres t expendi ture 1 286,0 1 628,5 1 840,3
Budget bal a nce -157,0 -326,6 -349,7
Gros s l oa n debt 2 232,9 3 176,1 4 383,6
Debt-s ervi ce cos ts 162,6 205,0 290,1
Borrowi ng requi rement 253,8 410,0 424,1
GDP at current prices 4 419,4 5 157,3 6 126,3
Source: National Treasury, Budget Review 2020
The South African fiscal framework has changed significantly in recent years. While
government revenue grew modestly between 2016/17 and 2019/20, at a real average rate of
about 1.1 per cent per annum, expenditure has been growing at just under 4 per cent per annum
in real terms. The result is that the deficit (or budget balance) more than doubled in nominal
terms over the last three years with knock-on effects on gross loan debt (rising from R2.3
trillion in 2016/17 to R3.2 billion in 2019/20), debt service cost from R162.6 billion to
R205 billion per year over the same period and the annual borrowing requirement from
R253.8 billion to R410 billion) (Table 1).
Table 2 - The consolidated fiscal framework (elements as percentage of GDP, selected years)
presents the fiscal data in terms of key ratios relative to nominal GDP. For 2019/20 revenue is
expected to reach 29.4 per cent of GDP and expenditure 35.7 per cent of GDP. The result is a
rapid widening of the deficit to 6.3 per cent of GDP, a ballooning of gross loan debt to 61.6 per
cent of GDP, upward pressure on debt-service costs to 4 per cent of GDP in 2019/20 and the
borrowing requirement to nearly 8 per cent of GDP in 2019/20.17 FFC: Submission on the 2020 Fiscal Framework and Revenue Proposals
Table 2 - The consolidated fiscal framework (elements as percentage of GDP, selected
years)
2016/17 2019/20 2022/23
Outcome Revised Estimate
% of GDP estimate
Revenue 29,1% 29,4% 29,2%
Expendi ture 32,6% 35,7% 34,9%
Non-i nteres t expendi ture 29,1% 31,6% 30,0%
Budget bal a nce -3,6% -6,3% -5,7%
Gros s l oa n debt 50,5% 61,6% 71,6%
Debt-s ervi ce cos ts 3,7% 4,0% 4,7%
Borrowi ng requi rement 5,7% 7,9% 6,9%
Source: National Treasury, Budget Review 2020
Over the next few years, government’s budget measures announced are estimated to stabilise
at the level of these revenue and expenditure ratios. However, these shifts will fail to decisively
turn around the gross loan debt as a proportion of GDP. The debt ratio is expected to reach 71.6
per cent of GDP by 2022/23 which will not yet represent a turning point.
Weak nationally-collected revenue growth was the result of the continuing deceleration of
growth on one hand, and, on the other, governance issues at the South African Revenue Service
(SARS) as a result of corruption. Expenditure growth pressures relate to continued population
growth, expanding mandates in an environment of lack of government-wide prioritisation and
inefficient service delivery execution, and pressure in terms of input costs, including salaries
and wages of civil servants which grew faster than inflation. Thus, despite growth in
expenditure, service delivery remains under pressure because of demand factors, cost factors
and inefficiencies. In addition, for several reasons, including cleaning up governance,
government has been increasingly focussing on compliance with bureaucratic process and
rules. Such compliance activities also impose costs of their own and sometimes impinge on
actual service delivery. A balance between capacitating and containing government has to be
found.
Going forward, slow revenue growth, estimated at about 1.1 per cent on average per annum,
results from low economic growth projections (1.3 per cent per annum on average over the
MTEF), keeping the tax regime and rates unchanged (except for inflation adjustments to
eliminate fiscal drag on income taxes and to maintain tax takes on excise taxes) and factoring
in an expectation of reduced tax buoyancy (tax revenue growth being slower than economic
growth). This slow growth in revenue thus comes from:
• Prevailing foreign and domestic economic conditions;
• A policy decision to maintain the tax burden at current real levels relative to inflation;
• Expectations that the tax take for every Rand of growth will decline; and
• The intention to contain wage growth in the public sector.
Potential improvements in tax administration are not yet factored into government’s revenue
estimates, according to the National Treasury.18 FFC: Submission on the 2020 Fiscal Framework and Revenue Proposals
Given the explosive growth in debt and debt projections, fiscal consolidation is required.
Continued debt growth will lead to future debt costs that will be increasingly difficult to fund
and will impact on country confidence and credit rating. This in turn will impact directly and
negatively on investment and the cost of credit and negatively impact on government spending
on services for citizens. In this context, government is opting for a very specific consolidation
strategy.
3.2 Strategy for fiscal consolidation
To consolidate the fiscal situation more immediately, government is opting to not raise more
revenue through adjusting tax rates beyond the correction for effect of inflation, but rather to
constrain expenditure. According to the Budget 2020, consolidated government spending
reached an historic high of 36 per cent of GDP in 2019, and it is asserted that “this level of
spending is unsustainable”.21
The policy decision not to raise tax burdens seems to be motivated by the view from
government that:
• Tax to GDP ratios (26.2 per cent) are close to their “democratic-era peak”, which is
then presumably seen as an upper ceiling which should not be breached without a
credible strategy on how such expenditure will impact positively on growth. Real
expenditure growth over the last decade, it could be argued, has not been able to ignite
or even maintain growth;
• South African tax rates seem to be relatively high. Reference is made by the National
Treasury to the South African “tax burden” of close to 26.3 per cent of GDP being
relatively high compared with other upper-middle-income countries. For example,
Turkey is at around 25 per cent, Chile at about 20 per cent and Mexico at about 16 per
cent. It, is however, also shown that the South African “burden” is below that of Tunisia
(just over 30 per cent), Brazil (at about 33 per cent) and Hungary (well on its way to 40
per cent). With regard to corporate income tax, the National Treasury refers to the fact
that South Africa’s corporate income tax rate has remained unchanged at 28 per cent
for more than a decade, while in many countries the trend has been towards downward
adjustment. The National Treasury therefore refers to a growing tax rate gap between
South Africa and its trading and investment partners;
• In the context of low growth, government argues that substantial tax increases may
obstruct short-term recovery.
Consolidation is therefore to be effected through constraining expenditure growth to an average
annual real growth of 0.5 per cent compared to the 3.8 per cent of the previous three years. This
is to be done by reducing programme baseline (Budget 2019) allocations by R101 billion and
21
Information and statistics in this section from The National Treasury. 2020. Budget Review 2020. Pretoria:
Government Printer19 FFC: Submission on the 2020 Fiscal Framework and Revenue Proposals
the consolidated wage bill by R160 billion. The reduction will require a renegotiation of the
current collective wage agreement which makes provision for above inflation increases for
certain categories of workers in April 2020.
The consolidation strategy will also impact on both the functional and economic composition
of expenditure and on the division of revenue. In this regard the main points are that:
• After having shifted towards national between 2016/17 and 2020/21, the division of
revenue rebalances over the MTEF. From a share of 50.1 per cent in 2019/20 (driven
by financial support to SOEs), the national share reduces to 47.5 per cent in 2022/23.
After having grown strongly in real terms over the last three years, the national share is
estimated to decline in real terms by an average annual 1.9% over the next three years.
In contrast the provincial share grows by 1.4% per year in real terms and the local
government share by 2%. While provincial conditional grant grows marginally over the
MTEF (0.2% per year), the equitable share grows by 1.7% per year. While the local
government equitable share continues to grow strongly (by 4.5% per year in real terms
following on average annual growth of 5% per year over the previous three years. Local
government conditional grant, however, continue their real decline. After declining by
1.4% per year over the previous three years, they decline by 2.1% per year over the next
three years.
Table 3 – Division of revenue, growth in available funds
Average Average
annual annual
real real
growth growth
16/17 to 19/20 to
R billion 19/20 22/23
National departments 5,2% -1,9%
Provinces 2,4% 1,4%
Equitable share 2,5% 1,7%
Conditional grants 1,5% 0,2%
Local government 2,1% 2,0%
Equitable share 5,0% 4,5%
Conditional grants -1,4% -2,1%
General fuel levy
0,9% 2,3%
sharing with metros
Non-interest allocations 3,7% -0,9%
Source: National Treasury, Budget Review 2020
• Functional allocations by grew by an annual average of 3.3% per annum over the period
2016/17 to 2019/20 but the growth rate declines to 0.4% per annum over the 2020
MTEF. Overall, service delivery will, therefore, be under significant pressure. While
there is compensation for inflation, there is no funding provided for demand growth
(including population change) and cost increases above CPI. In the past, remuneration
has increased significantly above inflation cutting into the purchasing power of20 FFC: Submission on the 2020 Fiscal Framework and Revenue Proposals
departmental allocations. Service delivery levels will therefore hinge critically on
reaching agreement with employees for overall salary adjustments below those of
recent years.
• Several functional and programme areas grow more slowly than the average, and indeed
below inflation thus shrinking in real terms, as debt service costs is rising significantly
faster than inflation at a real annual average of 7.2% per annum. Peace and Security
Budgets are set to decline by 2.2% per year on average, General Public Services by
0,8% per annum and Learning and Culture by 0,5% per annum. The level of agreement
on salaries and wages will therefore be fundamental to these functions – if the current
agreement of CPI plus 1% stands, real reductions will be significant.
• Current payments dominate consolidated government expenditure. Between 2016/17
and 2019/20 current payments (salaries and wages, goods and services, and interest)
grew by an average of just over 3 per cent per year in real terms. This contrasted with
payments for capital assets that declined by 8.2 per cent per year on average in real
terms. The biggest component of current expenditure, compensation of employees,
grew by 2.6 per cent per year in real terms with goods and services growing by just
under 2 per cent per year. The rapid growth in debt service costs (an annual average of
7 per cent) and compensation is impacting on funds available. While capital expenditure
under this heading does not encompass all government capital expenditure (the bulk is
contained in transfers to local and provincial government and certain public entities
such as PRASA and ESKOM), the data shows capital spending declining by a real
annual average of over 8 per cent over this period.
• As reflected in Table 4, Budget 2020 attempts to reverse some of these trends in the
composition of expenditure. Real annual average growth in current payments is
projected to slow to under 1 per cent per annum over the next three years. As was the
case previously, growth is driven by rapid growth in debt service costs of, on average,
7 per cent per annum. The next three years will see government attempt to rein in
spending on compensation and shift emphasis to capital spending. To this end, real
growth in compensation spending is projected to decline by 1 per cent per annum over
the next three years. Conversely capital spending is set to grow by a strong real annual
average of 4.8 per cent per annum over the 2020 MTEF period. Both goods and service
and transfers and subsidies will experience slower real growth over the next three years.You can also read