Jobs and growth: the importance of engineering skills to the UK economy - Royal Academy of Engineering econometrics of engineering skills project
←
→
Page content transcription
If your browser does not render page correctly, please read the page content below

Jobs and growth:
the importance of
engineering skills to the
UK economy

Royal Academy of Engineering econometrics
of engineering skills project

Final Report, September 2012


Jobs and growth:
the importance of engineering
skills to the UK economy
Royal Academy of Engineering econometrics
of engineering skills project

Final Report, September 2012

Author: Matthew Harrison, Director, Education,
The Royal Academy of Engineering

ISBN: 1-903496-92-6

Copyright, the Royal Academy of Engineering, 2012

Available to download from:
www.raeng.org.uk/jobsandgrowth

Acknowledgements
The contributions made by those attending a seminar
held on the 27th June 2012 are acknowledged with
particular thanks to:

Helen Atkinson FREng, Liz Bell (Universities UK),
Peter Glover (UKCES), David Grant FREng,
Sarah Hall (University of Nottingham),
Martin Houghton (TBR),
Charles Levy (Big Innovation Centre),
Stephen Rosevear (Cogent SSC),
Anna Vignoles (Institute of Education)

Table of contents
                 Executive summary                                                    1
                 Introduction                                                         5
                 The nature of engineering                                            7
                 Education, skills and growth                                        9
                 Research programme                                                  13
                 The number of individuals in SET occupations                        14
                 Deployment of SET occupations across the economy                    16
                 Labour market returns for SET occupations and STEM qualifications   20
                 Forecasts of demand for SET occupations                             23
                 Jobs and growth: SET analysis of the UKCES 2010–2020 forecasts      24
                 Towards an industrial strategy                                      28
                 Supply of STEM qualifications in England and the UK                 29
                 Conclusions                                                         32

 Royal Academy of Engineering
Jobs and growth: the importance of engineering skills to the economy

                                                       “I have travelled around in business and seen how other
                                                       nations organise themselves and tilt policy in favour of their
                                                       industrial base. At the highest level, an industrial strategy
                                                       in my view is about giving the right signals to society that
                                                       industrial activity is very important”

                                                       Sir John Parker, President of the Royal Academy
                                                       of Engineering

                                                       The Daily Telegraph, 29th July 2012

Executive summary
This report was commissioned by the Royal Academy of Engineering (the
Academy) to provide evidence of the value of engineering skills to the economy
and to examine analytically the concerns expressed by leaders in business and
industry about the shortage of such skills.

The report provides clear evidence, based on econometric research, that the
demand for people in Science, Engineering and Technology (SET) occupations
exceeds supply and, because the demand is pervasive across the economy, it
persists even in the current recessionary period1,2. As economic growth returns,
demand for engineers and many other SET occupations is likely to intensify3.

The Academy has as its number one strategic priority “To drive faster and more
balanced economic growth”. To achieve this, the provision of engineering skills
should be a key focus of the government’s industrial strategy.

As part of a strategic review in January 2011, the Academy’s Standing Committee
for Education and Training identified a list of priorities including:

n   Building an evidence base for the economic value obtained from the supply of
    engineering skills to the labour market.

n   Compiling evidence on the demand for engineers and technicians in the UK
    workforce, today and into the future.

n   Compiling evidence on sectors of the economy where engineering skills
    contribute to a world-leading advantage.

n   Compiling evidence on where engineering skills can be applied to promote
    new sources of economic growth.

1   The Purchasing Manager’s Index for manufacturing (PMI) has been at or below the 50 level (that
    separates expansion from contraction) for most of 2012. Source: Markit/CIPS News Release,
    3rd September 2012
2   The PMI for construction has been fluctuating in the 50-55 mark for 24 months, dipping to 49.0 in
    August 2012 – the second lowest value since February 2010. Source: Markit /CIPS News Release,
    4th September 2012
3   UKCES Working futures 2010–20, UKCES, December 2011
                                                                                                                                        1
These were built into an 18-month programme econometric research in
                                   five areas:

                                   n   The number of working-age people self-declaring in the Labour Force Survey
                                       (LFS) as working in SET occupations.

                                   n   An analysis of 20 broad economic sectors to identify the concentration of SET
                                       occupations in each.

                                   n   An analysis of the labour market returns to SET occupations and Science,
                                       Technology, Engineering and Mathematics (STEM) qualifications.

                                   n   An analysis of the signals of demand for SET occupations in the economy and
                                       forecasts of future demand for engineering skills in particular.

                                   n   An analysis of the supply of STEM qualified people in England and the UK
                                       more widely.

                                   The research inspects the structure of the UK economy and compares this to
                                   competitor nations. It identifies significant deficiencies in the terminology used in
                                   economic analysis and forecasting, particularly when it comes to activity related
                                   to engineering. These deficiencies are at least unhelpful and at worst could
                                   be hampering public policy making by obscuring the contribution made
                                   by engineering activity in inappropriately broad classifications and by
                                   promoting an impoverished definition of engineering.

                                   The research presented here inspects the evidence for links between education,
                                   skills, productivity and growth. It looks at how the UK school system performs
                                   against international competitors and compares the outputs from higher
                                   education with that of key nations. It presents new analysis of the structure
                                   of the SET workforce, identifying the pervasive way in which SET skills are
                                   distributed throughout the economy.

                                   The research brings together evidence on the labour market returns from
                                   SET occupations and STEM qualifications. It inspects signals of expansion and
                                   replacement demand for SET occupations and compares these with rates of
                                   supply to answer some important questions and in particular:

2   Royal Academy of Engineering
Jobs and growth: the importance of engineering skills to the economy

     n     Is there a link between STEM education, training, qualifications (or
           all three) and valuable economic activity?

     n     Is there a link between STEM education, training, qualifications (or
           all three) and economic growth?

The principal findings of the research are:

1.       Key conclusion: There is good econometric evidence that the demand
         for graduate engineers exceeds supply and the demand is pervasive
         across all sectors of the economy. The implication of this is that the
         economy needs more graduate engineers for both engineering and non-
         engineering jobs. The evidence can be seen in a persistent, sizeable wage
         premium for people holding engineering degrees and this premium has grown
         over the last 20 years. There are also wage premia offered for other (but not
         all) STEM graduates but the size of the premium varies.

2. There is evidence that the demand for people in non-graduate SET
   occupations exceeds supply because wage premia are also offered for many
   of these occupations.

3. There is good evidence that wage premia exist for many, but by no means all
   STEM qualifications. This is indicative of positive impact on productivity4.

4. Independent models of future skills demand are predicting shortages of STEM
   qualified people for all occupational levels in SET (particularly professional
   and skilled trade levels). The models agree that much of this is replacement
   demand due to skilled people leaving the labour market but there are areas
   (nuclear new build, tunnelling, premium vehicle manufacture, banking and
   finance were some examples given by participants in the research) where
   demand is driven by expansion.

5. Surveys of the supply of STEM qualified people through the UK education
   and training systems when compared with models of demand suggest that
   that demand for STEM skills will exceed supply into the foreseeable future.
   Many employers also recruit experienced people from the international
   labour market of course but visa restrictions can make this complicated and in
   certain sectors (such as defence) this is not an option.

6. Independent mappings of the deployment of engineering (and STEM more
   generally) qualified people in the economy show STEM qualified people to
   be widely distributed through the economy (with varying concentration in
   different sectors). Engineers and SET workers more generally are also widely
   distributed. This is a signal of the marketability of STEM qualifications and
   SET workers. Concerns may arise however if there is insufficient supply of
   STEM qualified people or SET workers to meet the needs in all sectors –
   noting that some sectors have inherently higher profitability and hence can
   offer higher wages than others.

7.       The under-representation of women, those from certain ethnic minority
         groups and people with disabilities in SET occupations is well known5. There is
         also evidence of under-representation of people from lower socio-economic
         groups amongst those applying for STEM degrees6 although more research is

4    Increasing productivity is one component of the simplest model for growth – the other being an
     increase in employment (the number of people working and the number of hours worked). Example
     source: BIS (2010), Economics Paper No 4: Supporting analysis for ‘Skills for Growth’ – the national
     skills strategy
5    UKRC (2010), Women and men in science engineering and technology: the UK statistics guide 2010,
     UK Resource Centre for Women in SET, 2010 (pages 81, 94, 103)
6    Engineering UK (2012), Engineering UK 2012: the state of engineering, Engineering UK, 2012
     (page 166)
                                                                                                                                          3
required to understand the impact of sequential subject decisions made prior
                                           to applying to university7. These under-representations provide justification
                                           for successive governments’ focus on participation in and access to STEM
                                           qualifications. When considering government support for STEM, a narrative
                                           around the strategic value of STEM qualifications and SET occupations
                                           should also be explored with reference to innovation, international
                                           competitiveness and security of vital supplies and services (communication
                                           and IT, water, energy, food all rely on SET occupations). Case studies would be
                                           helpful. In addition, more work is required to understand the balance between
                                           the returns received from STEM qualifications and SET occupations by the
                                           individual and the wider returns received by the employer, the economy,
                                           society and so on.

                                   Starting from the clear need to stimulate economic
                                   growth and jobs in the UK, the key messages from this
                                   research are:

                                       n     An industrial strategy, being greater explicit support and
                                             orientation towards areas of production in the UK economy
                                             including IT, infrastructure, construction, manufacturing and
                                             other elements of a widely-drawn 21st Century industrial base
                                             requires investment in particular types of human and other capital.
                                             A focus on UK skills in areas of existing and potential strength
                                             such as Computing & Telecommunications, Manufacturing and
                                             Construction could help deliver the objectives of and industrial
                                             strategy in the short to medium term.

                                       n     SET occupations, and STEM qualifications can have significant
                                             value to the individual and the demand for them is pervasive across
                                             the economy signifying that they have wide value.

                                       n     There is high demand for STEM graduates, and for certain
                                             disciplines the evidence is that demand exceeds supply.

                                   7   There are known links between household income and participation in higher education (Source:
                                       Jake Anders (2012), The link between household income, university applications and university
                                       attendance, FISCAL STUDIES, vol. 33, no. 2, pp. 185–210 ,2012) and the gap in participation
                                       between richer and poorer young people largely emerges before the point of application. The
                                       analysis has not yet been extended to subject of degree.
4   Royal Academy of Engineering
Jobs and growth: the importance of engineering skills to the economy

Introduction
The structure of UK economic output is:           “I have travelled around in business
During that time, the Academy:                     In undertaking this work, the Academy
                                                                                      has sought answer to some important
                                   n   Drew the Science, Technology,                  questions:
                                       Engineering and Mathematics
                                       (STEM) communities together to                 n    Are STEM skills more valuable
                                       find consensus on what is meant                     (at a given level) than other skills
                                       by the terms ‘STEM qualifications’                  (including basic skills)?
                                       and ‘SET occupations’. These
                                       definitions enabled the                        n    If so more valuable to whom? To
                                       subsequent econometric analyses                     the individual? To the employer? To
                                       reported here.                                      the economy?

                                   n   Quantified for the first time the              n    Where does STEM related value
                                       contribution to STEM education                      get captured? In some or all of the
                                       and skills made by the FE &                         economy?
                                       Skills system in England through
                                                                                      n    Are STEM qualifications useful
                                       the Academy’s FE STEM Data
                                                                                           proxies for STEM skills (or do we
                                       project10,11.
                                                                                           need to look at wider competence)?
                                   n   Extensively mined Labour Force
                                                                            n              Is the supply of STEM skills
                                       Survey and other datasets including
                                                                                           sufficient to meet current (business
                                       commissioning unique regression
                                                                                           continuity) and future (business
                                       analysis undertaken at the Institute
                                                                                           continuity plus potential growth)
                                       of Education to isolate the wage
                                                                                           needs?
                                       premia from SET occupations and
                                       STEM qualifications12.               n              Is public investment in STEM
                                                                                           education, training, qualifications
                                   n   Built the first comprehensive
                                                                                           (or all three) justified and if so why?
                                       analysis of the supply of STEM
                                       qualifications by incorporating     and in particular
                                       the findings of the FE STEM Data
                                       Project with data provided by HESA,
                                       HEFCE, BIS and the Department for     n Is there a link between
                                       Education.                                STEM education, training,
                                                                                 qualifications (or all three)
                                   n   As part of its role hosting               and valuable economic
                                       the Technician Council13,                 activity?
                                       commissioned an analysis from
                                       the Big Innovation Centre of the      n Is there a link between
                                       number of SET workers in the UK           STEM education, training,
                                       economy (segmented into 20 broad          qualifications (or all three)
                                       economic sectors) attributing             and economic growth?
                                       economic data such as wages,
                                       gross value added, export data,     These issues are explored in the pages
                                       employment rates.                   that follow.

                                   10 Andy Frost, Clive Greatorex, Matthew Harrison, David Mason (2010), FE and Skills STEM Data
                                      Summary report, October 2010, Blue Alumni / Royal Academy of Engineering
                                      www.thedataservice.org.uk/statistics/other_statistics_and_research
                                   11 Matthew Harrison (project leader) 2011, FE STEM Data Project July 2011 report, Royal Academy of
                                      Engineering www.thedataservice.org.uk/statistics/other_statistics_and_research
                                   12 Charley Greenwood, Matthew Harrison, Anna Vignoles (2011), Institute of Education / Royal
                                      Academy of Engineering www.raeng.org.uk/news/releases/shownews.htm?NewsID=701
                                   13 www.professional-technician.org.uk (accessed July 2012)
6   Royal Academy of Engineering
Jobs and growth: the importance of engineering skills to the economy
The nature of engineering
There was consensus amongst those development is equally complex. For
involved in this study that more needs example, terms drawn from:
to be done to ensure clarity on the
terminology used when discussing the n World Bank definitions of economic
role of engineering in the labour market structure
and in the economy. Confusion around n Standard Industrial Classifications
terms such as ‘professional’, ‘engineer’ n Standard Occupational Codes
‘engineering’, ‘science’ and ‘technology’
n The Joint Academic Coding System
persists in the STEM, economics and
(JACS) codes
public policy communities alike. These
could be settled through coordination n External trade statistics
and increased dialogue between those
are commonly used in public policy
communities.
discourse. In addition, distinctions
In addition, the distinctions often are often drawn between a ‘service
made between ‘productive’ economic economy’ (or trade in services) and
sectors and ‘service’ sectors should be a ‘productive economy’ (or trade in
more nuanced in future. For example goods) whereas both could be seen
the broad ‘Business Services’ grouping as components of a single economic
of Standard Industrial Classification system14. The terms ‘engineering’ and
(SIC) codes includes: architectural ‘technology’ also get intertwined15
and engineering activities; technical which adds to a sense of complexity
testing and analysis; scientific research and perhaps confusion.
and development; other professional,
scientific and technical activities. For the purposes of this study
alternative definitions are offered in
There is a complex taxonomy used Box 1 to provide richer insight into the
to describe the contribution to nature of engineering and engineering
economic output made by engineering skills, acknowledging the need to
activities and through the application engage with the terms listed above
of engineering skills. The taxonomy as they are widely used in economic
applied to STEM education and skills datasets and analysis.
14 Royal Academy of Engineering (2012), Industrial systems: capturing value through manufacturing,
Royal Academy of Engineering, February 2012
15 Harrison (2010), Supporting the T and E in STEM: 2004–2010, Design and Technology Education:
an international journal, Vol 16.1, pp17–25
7Box 1: Defining ‘engineering’
Inspiring visions of engineering are the benefit of mankind.”. introduce new and more efficient
provided for the United States by the production techniques, marketing
National Academy of Engineering16 Definitions developed in the context and construction concepts, or pioneer
of professional engineering UK are18
new engineering services and
“No profession unleashes the spirit
“Engineering is concerned management methods. Chartered
of innovation like engineering. From
with developing, providing and Engineers are variously engaged
research to real-world applications,
maintaining infrastructure, in technical and commercial
engineers constantly discover how
products, processes and services leadership and possess effective
to improve our lives by creating bold
for society. Engineering addresses interpersonal skills”.
new solutions that connect science
to life in unexpected, forward- the complete life-cycle of a product,
A useful insight into the T and E in
thinking ways. Few professions turn process or service, from conception,
STEM is provided by Malpas20
so many ideas into so many realities. through design and manufacture,
Few have such a direct and positive to decommissioning and disposal, “Technology is an enabling package
effect on people’s everyday lives. We within the constraints imposed by of knowledge, devices, systems,
are counting on engineers and their economic, legal, social, cultural and processes and other technologies,
imaginations to help us meet the environmental consideration.”. created for a specific purpose. The
needs of the 21st century.”. word technology is used colloquially
and19
to describe either a complete system,
and by the Accreditation Board for
“Chartered Engineers are a capability, or a specific device.
Engineering and Technology17
characterised by their ability to Engineering is the knowledge
“[Engineering] The profession develop appropriate solutions to required, and the process applied, to
in which a knowledge of the engineering problems, using new conceive, design, make, build, operate,
mathematical and natural sciences or existing technologies, through sustain, recycle or retire, something
gained by study, experience, and innovation, creativity and change. of significant technical content for
practice is applied with judgement to They might develop and apply new a specified purpose; – a concept, a
develop ways to utilize, economically, technologies, promote advanced model, a product, a device, a process,
the materials and forces of nature for designs and design methods, a system, a technology”.
16 National Academy of Engineering (2008), Changing the conversation: messages for improving
public understanding of engineering. Washington D.C: The National Academies Press, 2008
17 This definition of engineering was used widely by ABET before the Criteria for Accrediting
Engineering Programs were adopted in the year 2000 (and subsequently revised). Although still
quoted frequently and attributed to ABET it is not used in current versions of the Criteria.
18 QAA (2012) QAA Subject Benchmark Statement for Engineering, QAA, 2010
19 Engineering Council, (2010), UK standard for professional engineering competence (UKSPEC).
London: The Engineering Council, 2010
20 Malpas, Sir Robert, (2000), The Universe of Engineering: A UK definition. London: The Royal
Academy of Engineering, 2000
8 Royal Academy of EngineeringJobs and growth: the importance of engineering skills to the economy
Education, skills and growth
There is strong evidence that about the links between skills and
continuing years of education prove economic success, for example:24
valuable to the individual. Earnings
tend to rise in line with people’s level “The larger and more complex the
of education with the earning premium education sector, the less obvious any
for tertiary education (when compared links to [economic] productivity become”
with upper secondary) being more than Alison Wolf
50% in over half of OECD countries21.
By contrast, those will poor levels of But a narrative of education and growth
education can earn substantially less remains common, for example:25
than those with upper secondary
education (23% less on average across “The key to the UK getting back
all OECD countries). on track is growth, founded on a
rebalanced economy geared much
Going beyond the returns to the more towards investment and export.
individual, there is general agreement Education and training have a central
that investment in basic education yields role [sic] to play in the process – my
wider economic benefits. For example:22 view is that skills are at the heart of
our ability to sustain economic growth”
“Raising the average literacy and
numeracy skill level of the workforce, John Cridland
and reducing the proportion of workers
at the lowest level of skill, could yield As well as good evidence for and general
significantly higher levels of -growth in consensus on the impact of basic skills
GDP per capita” (for example, in the UK circa 10%, wage
premium for adult literacy and numeracy
Coulombe et al. 2004 skills is reported26), the case for the
economic importance of tertiary / higher
There is also agreement that
level skills is commonly made27. Rates
qualifications are a proxy for human
of return on Apprenticeships are also
capital23
commonly found to be high28.
“Educational attainment is a commonly
There is also strong evidence that many,
used proxy for the stock of human
but not necessarily all, qualifications
capital – that is the skills available in
provide wage premia29. Certain SET
the population and the labour force”
occupations provide premia too30. These
OECD 2011 occupations are found throughout
the economy, although in differing
However, when thinking beyond basic concentrations31. However, the futures
skills, doubts have been expressed for some occupations, particularly those
21 OECD (2011) – Education at a Glance 2011, OECD, 2011 (page 138)
22 Coulombe, S., J.F. Tremblay and S. Marchand (2004), Literacy Scores, Human Capital and Growth
across Fourteen OECD Countries, Statistics Canada, Ottawa, 2004 (page 8)
23 OECD (2011) ,Education at a glance, OECD, 2011 (page 30)
24 Alison Wolf (2002), Introduction to “Does Education matter?”, Alison Wolf, Penguin books, 2002
25 CBI (2012), Page 4, Education and Skills Survey 2012, CBI / Pearson, 2012
26 De Coulon, A., O.Marcenaro-Gutierrez & A. Vignoles (2007), The value of basic skills in the British
labour market, CEE Discussion Paper 77, 2007
27 For example : University Alliance (2010), 21st century universities: engines of an innovation driven
economy, University Alliance, September 2010
28 A recent example – NAO (2012), National Audit office report on adult Apprenticeship, February 2012
29 For example – McIntosh (2004), Further analysis of the returns to academic and vocational
qualifications, Steve McIntosh, Centre for the Economics of Education, January 2004
30 Charley Greenwood, Matthew Harrison, Anna Vignoles (2011), The labour market value of STEM
qualifications and occupations, Institute of Education / Royal Academy of Engineering, 2011
9in the so-called ‘hollowed out middle’32 learning science at school are 1.27
of the range of standard occupational times greater than the odds of
classes look vulnerable at least in the disadvantaged students who do
medium term33,34. not have that opportunity to learn
science at school, after accounting
Notwithstanding doubts over links for a host of student and school
between spending on education and background factors, approaches to
its impact on economic prosperity35, learning and school policies.
there is evidence that more spending
can yield better attainment in national Even taking into account these
or international tests (such as the PISA complexities and inequalities, it is hard
tests)36. However, different nations to see any systematic evidence of a
deploying similar per capita spending significant and positive link between
achieve widely different test scores and ranking in PISA tests and economic
growth (Boxes 2, 3) as several of the
inequalities exist – for example37:
worst performing nations in PISA tests
n On average, across OECD countries, have stronger economic growth than
disadvantaged students spent 20% several of the best performing nations.
less time learning science at school There is some evidence that many of
than their more advantaged peers. the countries that have performed
significantly better than England in
n Across OECD countries, on average, PISA tests also have stronger economic
the odds of being a resilient growth (Boxes 4, 5) but any relationship
learner for disadvantaged students between these two factors is unlikely
who spend an extra hour a week to be simple or even causal.
Box 2: Ten highest performing OECD / G20 countries in PISA tests 200938
Reading Mathematics Science
Shanghai – China Shanghai – China Shanghai – China
Korea Finland Finland
Finland Korea Korea
Canada Canada Estonia
Estonia Japan Canada
Japan Estonia Japan
Australia Netherlands Australia
Netherlands Switzerland Poland
Norway New Zealand Netherlands
Poland Australia New Zealand
(UK 21st amongst OECD /G20) (UK 16th amongst OECD /G20) (UK 21st amongst OECD /G20)
31 For example – TBR (2011),The current and future science workforce, Fiona Dodd, Jon Guest, Andrew
License TBR / Science Council, 2011
32 For a recent discussion of this trend where employment growth is seen in professional occupations
and in semi-skilled and unskilled occupations but not in intermediate occupations see: University
Alliance (2012), The way we’ll work: Labour market trends and preparing for the hourglass,
University Alliance, March 2012
33 For example – UKCES (2011), Working futures 2010–20, UKCES, December 2011
34 The work of the Technician Council in recognising a modern class of technician and promoting
professional technician registration is an example of how intermediate occupations can be
supported and their position in the labour market strengthened – Technician Council (2012),
Professional Technician: the future, Technician Council, 2012 (available to download from
www.professional-technician.org.uk – accessed July 2012)
35 Alison Wolf (2002), “Does Education matter?”, Alison Wolf, Penguin books, 2002
36 OECD 2010 data quoted in Figure 7 of: DfE (2010), The case for Change, Department for Education,
November 2010
37 OECD (2011), Against the Odds: Disadvantaged Students Who Succeed in School, OECD, 2011
38 OECD (2012), Education at a glance 2011 highlights,OECD, 2012 (page 87)
10 Royal Academy of EngineeringJobs and growth: the importance of engineering skills to the economy
Box 3a: The ten best performing Box 3b: The ten worst performing
OECD / G20 countries in the three OECD/G20 countries in the three
PISA tests (2009) with their PISA tests (2009) with their
recent economic growth recent economic growth
(average annual % GDP growth Indonesia (39th in OECD/G20) 5.3%
2000–2010) 39
Argentina (38 in OECD/G20)
th
5.6%
China 10.8% Brazil (37 in OECD/20)
th
3.7%
Finland 2.1% Mexico 2.1%
Korea 4.1% Chile 4.0%
Estonia 4.6% Austria 1.8%
Canada 2.0% Russian Federation 5.4%
Japan 0.9% Turkey 4.7%
Australia 3.2% Israel 3.6%
Poland 4.3% Greece 2.6%
Netherlands 1.6%
New Zealand 2.6%
Looking for influences on economic Much of this technological development
growth beyond basic educational comes from innovation and the
outcomes such as those measured by basic competence (human capital)
the PISA tests, economic models based shown in PISA tests plays a part –
around long term, stable growth42 but so do research, development,
suggest that economic outputs remain IT, organisational capital and the
in equilibrium with inputs (materials, application of higher skills (most
labour, capital, management) so that frequently in SET occupations)44.
a change in population is followed
by a change in output to maintain The UK performance in a number of
equilibrium. In such models, growth factors known to influence innovation
in output per capita (i.e. productivity) can be summarised relative to
depends only on the rate of international comparator nations as:
technological progress: in the outputs
n The UK has had, for some time, a
themselves or in the means of their
lower percentage of firms deemed
production.
‘innovation active’ (36% in 1998–
The rates of output growth in the 2000) than other European nations
modern era are too great to be (for example Germany 61%).
accounted for solely by increases in However the turnover return from
inputs and therefore the centrality of this limited innovation is often best
technological development to economic in Europe45
growth is commonly asserted43.
39 World Bank (2012) World Development Indicators 2012, World Bank, 2012 (page 214)
40 NFER (2010), PISA 2009: achievements of 15 year olds in England, NFER,2010 (page 16)
41 World Bank (2012), World Development Indicators 2012, World Bank, 2012 (page 214)
42 Solow (1956), Model of Cross-Country Growth Dynamics, Oxford Review of Economic Policy 1 23
(2007): pp. 45–62 – referenced in BIS Economics Paper No 15 – Innovation and Research Strategy
for Growth, December 2011
43 Abramovitz, M. (1956) Resources and Output Trends in the United States since 1870, American
Economic Review, vol. 46, no. 2, pp. 5–23 – referenced in BIS Economics Paper No 15 – Innovation
and Research Strategy for Growth, December 2011
44 UKCES (2011) ,Skills and Economic Performance: the impact of intangible assets on UK
performance, UKCES, October 2011
45 DTI (2005), International comparisons of the 3rd community innovation survey, DTI, 2005.
11Box 4: Focus on England
PISA – Countries outperforming England in 2009 to a significant degree40
Reading Mathematics Science
Shanghai – China Shanghai – China Shanghai – China
Korea Singapore Finland
Finland Hong Kong Hong Kong
Hong Kong Korea Singapore
Singapore Chinese Taipei Japan
Canada Finland Korea
New Zealand Lichtenstein New Zealand
Japan Switzerland Canada
Australia Japan Estonia
Netherlands Canada Australia
n The UK gross investment in R&D is n The share of vocational education
Box 5: Recent economic growth modest46 (1.8% in 2010) compared and training (VET) in the UK as a
(average annual % GDP growth proportion of total upper secondary
with the US (3.2%) Japan (2.7%)
2000–2010)41
and Germany (2.8%) but similar to education is smaller (42%) than
China (1.7%). In addition, a much all the other industrial countries in
China 10.8%
higher R&D percentage is invested Europe (Germany – 60%, France –
Finland 2.1% 43%, Czech Republic – 79%) apart
in universities (27% in UK – 8% in
Hong Kong 4.6% China). The number of publication from Greece (34%), Italy (25%) and
Singapore 6.0% citations per unit investment in Ireland (3%)49.
Korea 4.1% R&D is much higher in the UK than
elsewhere (possibly reflecting n 37% of the UK population has
Estonia 4.6%
the concentration of research in experience of tertiary (higher)
Switzerland 1.9% education50 compared with the
universities).
Canada 2.0% OECD average of 30% and the
Japan 0.9% n The US produces four times the EU21 average of 27%. (US – 41%,
Australia 3.2% number of engineering graduates Germany – 32%, France – 30%).
Poland 4.3% compared with the UK:47
UK innovation performance can be
Netherlands 1.6% US graduations in engineering compared to international competitor
New Zealand 2.6% (2008–09)48: nations in a number of ways including
Norway 1.7% Bachelors – 137,500 the number of patent registrations
UK 1.8% Masters – 38,000 in key markets around the world51.
Doctoral – 8,000 In 2009, the UK was the 8th largest
UK graduations in engineering contributor to US patent registrations
(HESA 2010–11) behind the US, Japan, Germany, South
Bachelors / MEng – 23,000 Korea, Chinese Taipei, Spain and
Masters – 15,000 Canada. In 1989 it was 5th behind the
Doctoral – 2,500 US, Japan, Germany and France.
India produces eight times the
number of engineering graduates,
China twenty times.
46 Universities UK (2011), Driving economic growth, Universities UK, October 2011
47 G. Gereffi, V. Wadhwa, B. Rissing, R. Ong (2008), Getting the numbers right: international engineering
education in the United States, China and India, Journal of Engineering Education, January 2008
48 NCES (2011),The condition of education 2011, NCES, 2011-. Also – Digest of Educational Statistic
2010, NCES 2011-015). Longitudinal data available in – Anderson, Fact book on Higher Education,
American Council on Education
49 OECD (2010), Learning for jobs, OECD – page 13, 2010
50 OECD (2010), Learning for jobs, OECD, 2010
51 Royal Society (2011), Knowledge, networks and nations: scientific collaboration in the 21st Century,
Royal Society, March 2011
12 Royal Academy of EngineeringJobs and growth: the importance of engineering skills to the economy
Research programme
The Academy has undertaken an 18-month programme of
econometric research in five areas:
n The number of working-age n An analysis of the signals of
people self-declaring in the Labour demand for SET occupations in the
Force Survey as working in SET economy and forecasts of future
occupations. demand.
n An analysis of 20 broad n An analysis of the supply of STEM
economic sectors to identify the qualified people in England and the
concentration of SET occupations UK more widely.
in each.
n An analysis of the labour market
returns to SET occupations and
STEM qualifications
13The number of individuals in
SET occupations
The work to quantify the labour market Greenwood et al. there are 30 million
returns to SET occupations and STEM workers in the UK economy53. Based
qualifications undertaken by Greenwod on a very detailed inspection of the
et al.52 is based on the FE STEM Data first quarter of 2011 LFS data (not
Project classification of which Standard seasonally adjusted) there are:
Occupational Codes (SOC) can be
identified as SET. This has been used
to produce estimates of SET workers n 730,000 self-declaring
(at both Professional and Technician ‘engineers’ of which 60%
levels) in broad sectors of the UK hold the tertiary level
economy (Table 1). qualifications normally
required for professional
However, the worker estimates in
engineering registration
Table 1 are not corrected to account
for the significant proportional of
n 700,000 self-declaring SET
self-declared SET Professionals and
‘technicians / associate
Technicians who hold only low level
professionals’ who hold
qualifications. Figure 1 illustrates the
the Level 3+ qualifications
typical distribution of qualification
normally required for
levels for the case of self-declared
professional technician
‘Professional Engineers’.
registration
Analysing the four quarters of Labour
force Survey data from 2009 using n 880,000 skilled engineering
the classifications developed by the operatives.
FE STEM Data Project and reported in
‘Professional’ engineers: LFS Jan–Mar 2011–NVQ level (circa 730,000 total)
6%
5%
n Level 0 or unknown
15%
n Level 1
n Level 2
60% n Level 3
14% n Level 4+
Figure 1: Distribution of
qualifications amongst self-
declaring ‘Professional’
engineers.
52 Charley Greenwood, Matthew Harrison, Anna Vignoles (2011), The labour market value of STEM
qualifications and occupations, Institute of Education / Royal Academy of Engineering
www.raeng.org.uk/news/releases/shownews.htm?NewsID=701
53 Author’s calculations
14 Royal Academy of EngineeringJobs and growth: the importance of engineering skills to the economy
Number of technicians Number of SET professionals Total number of workers
Agriculture & Mining 10,000 40,000 440,000
Low-tech Manufacturing 90,000 140,000 930,000
Med-Low tech Manufacturing 110,000 320,000 780,000
Med-High tech Manufacturing 110,000 330,000 650,000
High-tech Manufacturing 30,000 120,000 160,000
Utilities 40,000 90,000 280,000
Construction 410,000 590,000 2,130,000
Retail & Wholesale 230,000 290,000 4,630,000
Transport & Storage 80,000 100,000 1,470,000
Accommodation & Food – – 1,890,000
Media & Publishing 80,000 50,000 370,000
Computing & Telecommunications 70,000 420,000 740,000
Finance & Insurance 30,000 100,000 1,110,000
Business Services 180,000 410,000 2,710,000
Support Services 30,000 70,000 2,270,000
Public Admin & Defence 170,000 150,000 1,510,000
Education 80,000 130,000 2,680,000
Health & Social Services 90,000 110,000 3,690,000
Arts & Entertainment 20,000 30,000 800,000
Other Services 60,000 90,000 800,000
UK Total 1,930,000 3,600,000 30,040,000
This makes 2.3 million skilled people Table 1: Employment estimates
in the engineering-related skills base n Manufacturing – £130 billion from 2009 Labour Force Survey
– 8% of the workforce. There are 7 n Utilities – £40 billion (Source: Big Innovation Centre
million people working in the productive analysis for the Technician
economy – 23% of the working n Construction – £90 billion
Council commissioned by the
population serving a similar proportion n Transport & storage – Royal Academy of Engineering –
of the national economic output. £60 billion based on SOC code classifications
from the FE STEM Data Project
Analysing the four quarters of Labour n Computing & Telecoms – and reported in Greenwood et al.
Force Survey (LFS) data from 2009 £50 billion 2011)
again along with ONS Supply and Use (Total £370 billion)
tables, the Gross Value added (GVA)
from engineering-related sectors
was54: With the GVA of the total economy
at £1.3 trillion in 2009, the easily
identified ‘engineering’ output is
observed to be 28% of the total
economy.
54 Author’s calculations
15Deployment of SET occupations
across the economy
Legend
Concentration of SET Number of SET
economy. Each sector is constructed
Utilities
SET
10,000 High-tech Manufacturing from a number of Standard Industry
Concentrated 100,000
Finance & Insurance Classification (SIC) codes grouped
Not SET 400,000 together. The groupings were chosen
Concentrated
carefully to give the closest practicable
Productivity
match to the various groupings used in
Agriculture & Mining
Media & Publishing the following ONS datasets:
Computing & Telecommunications
Business Services
Low-Tech Manufacturing
Transport & Storage
Med-High Tech Manufacturing n Labour Force Survey
Average
Public Admin & Defence
Other Services
1 Construction
n ‘Blue Book’
2 Education
Support Services Arts & Entertainment Health & Social Services
Key
1 – Med-Low Tech Manufacturing
n Annual Survey of Hours &
2 – Retail & Wholesale Earnings
Average Average Wage
n Supply and Use Tables
Source: ONS Labour Force Survey, Annual Survey of Hours & Earnings, Supply & Use Tables, Business Registration & Employment Survey
n Business Registration &
Employment Survey
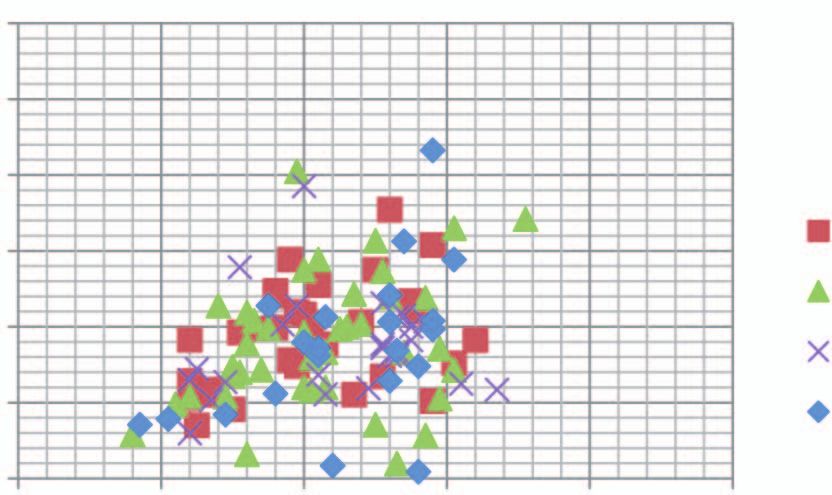
Figure 2: UK economic indicators Results from analyses commissioned and in the UKCES ‘Working Futures’
2009 – average wages for SET from the Big Innovation Centre by the forecasts 2010–2020.
professionals vs productivity. Royal Academy of Engineering for
Source: The Big Innovation Centre Gross value added (GVA) is taken here
the Technician Council are shown in
commissioned by the Royal
Figures 2–6. to be a measure of sectoral output.
Academy of Engineering for the
Technician Council
GVA per employee is taken here as a
This research aims to represent proxy for productivity. One limitation
graphically where those who self- of this measure of productivity is that
declare that they work in SET it does not account for capital inputs
occupations (as defined by SOC2000 of machines, computers and other
codes using the conventions developed aids to production. Some productive
by the FE STEM Data Project and industries such as mining and parts of
reported in Greenwood at al.) are manufacturing are highly automated
deployed in the UK economy and some to the point where few workers are
of the key characteristics of those needed to produce a high output. For
sectors. It does this using scatter plots most sectors, however, it is a strong
of economic indicators, with bubble proxy for labour productivity.
size representing the number of SET
workers in each sector. It is important to Exports are shown in Figure 3. Some
appreciate, however, that these plots do sectors do not lend themselves to
not imply a causal relationship between international trade in their goods
the variables presented. All data refers and services and this needs to be
to 2009 unless otherwise stated (using considered when assessing the relative
the four 2009 calendar quarters of the trade performance of different sectors.
LFS, with a weighted average giving the
final figure – this removes any seasonal The employment forecasts in
bias and increases the raw sample size Figures 5 and 6 come from the
to make the final estimates more robust forecasts published by UKCES in
robust) in order to remain consistent December 201155 and measure
with UKCES ‘Working Futures’ forecasts both the net change and the trend
2010–2020. annual percentage change in sectoral
employment between 2010 and 2020.
The 20 economic sectors displayed This gives an impression of which
in Figures 2–6 represent all of the UK sectors will be growing or declining
55 UKCES (2011), Working futures 2010-20, UKCES, December 2011
16 Royal Academy of EngineeringJobs and growth: the importance of engineering skills to the economy
Figure 3: UK economic indicators
Utilities
High-Tech Manufacturing
2009 – productivity vs exports
(with numbers and concentration
Legend
Finance & Insurance Concentration of SET Number of SET
of SET professionals). Source:
SET
10,000 The Big Innovation Centre
Concentrated 100,000
commissioned by the Royal
Productivity
Agriculture & Mining Not SET
Academy of Engineering for the
Computing & Telecommunications 400,000
Technician Council
Concentrated
Business Services
Media & Publishing
Public Admin & Defence Transport Low-Tech Manufacturing Med-High Tech Manufacturing
& Storage
Average
Construction Med-Low Tech Manufacturing
Education
2 1
Support Services Key
3 1 – Other Services
2 – Retail & Wholesale
Arts & Entertainment 3 – Health & Social Services
Average Exports
Source: ONS Labour Force Survey, Business Registration & Employment Survey, Supply & Use Tables,
Figure 4: UK economic indicators
Key
1 – Construction
Computing & Telecommunications 2009 – output growth forecast
2 – Retail & Wholesale
3 – Health vs historic growth (with
Media &
4 – Business Services
5 – Food, Drink & Tobacco Publishing Support Services Arts & Entertainment numbers and concentration
Manufacturing
Finance & Insurance of SET professionals). Source:
2
Electronic & Precision Engineering 3 4
The Big Innovation Centre
Transport &
5 Storage commissioned by the Royal
Education
Academy of Engineering for the
0%
Utilities Public Admin & Defence
Technician Council
Legend
Output Growth Forecast
Agriculture & Mining
Concentration of SET Number of SET
10,000
SET
Concentrated 100,000
Not SET 400,000
Concentrated
Other Services
0% Historical Output Growth
Source: ONS Labour Force Survey, Blue Book 2011, UKCES Working Futures 2010–20
in terms of future employment and or because of retirement or incapacity.
also of how the structure of the UK Some sectors that are shrinking in
economy will be different in 2020. terms of employment, such as high-
It is important to note that this is a tech manufacturing, may still have
forecast. Any unexpected shocks to significant job opportunities because
the UK economy occurring after the of replacement demand that a simple
UKCES publication such as a prolonged view of net employment changes may
period of recession would change obscure.
the outlook.
The bubble colour relates to the
The historical employment changes, concentration of SET occupations in a
presented in the same form as the given sector. Where the proportion of
forecasts and again taken from UKCES, workers in SET occupations in a sector
illustrate the changing employment exceed the proportion in the economy
structure of the UK economy between as a whole, the bubble is coloured red.
1990 and 2010.
A large number of sector-specific
When viewing both the forecast and observations could be made
the historical employment data, the following inspection of Figures: 2-6
role of replacement demand should be (supplemented by inspection of the
borne in mind. The data presented in data behind these) but for brevity only
Figures: 5,6 only represents net changes the more general observations will be
in employment due to expansion presented here:
demand. Much of the demand for
workers is to replace those who have n There are 3.6 million self-
left, either to move to a different sector declared SET workers in the UK
17Figure 5: UK economic indicators Legend
2009 – overall employment Concentration of SET Number of SET
Employment Growth Forecast
10,000
growth forecast vs historical SET
Concentrated 100,000 Finance & Insurance
employment growth (with
numbers and concentration Not SET
Concentrated
400,000 Media &
Publishing Arts & Entertainment
of SET professionals). Source:
Business Services
The Big Innovation Centre Construction
commissioned by the Royal Support Services
Academy of Engineering for the Utilities Transport & Storage
Technician Council Food, Drink & Tobacco
Retail & Wholesale Other Services Health
Computing & Telecommunications
0%
Education
Manufacturing
Agriculture & Mining Public Admin & Defence
Electronic & Precision Engineering
Historical Employment Growth 0%
Source: ONS Labour Force Survey, UKCES Working Futures 2010–20
Figure 6: UK economic Legend
indicators 2009 – employment Concentration of SET Number of SET
growth forecast vs output
Employment Growth Forecast
10,000
SET Finance & Insurance
Concentrated
growth forecast (with
100,000
numbers and concentration
Not SET
Concentrated 400,000 Arts & Entertainment
of SET professionals). Source: Business
Media & Publishing
Services
The Big Innovation Centre
commissioned by the Royal Construction
Support Services
Academy of Engineering for the Utilities Transport & Storage
Computing & Telecommunications
Technician Council Other Services Retail &
Food, Drink & Tobacco Wholesale
0%
Education Health
Agriculture & Mining Manufacturing
Public Admin &
Defence
Electronic & Precision Engineering
Output Growth Forecast 0%
Source: ONS Labour Force Survey, UKCES Working Futures 2010–2020, Blue Book 2011
out of a working population of n What is labelled as ‘Business
30 million (12%). Of these SET Services’ is a sector worthy of
workers, just over half (1.9 million) particular attention. It has above
are technicians or skilled SET average productivity and wages, a
operatives. However, we know large number of SET workers and
from analysis of the raw LFS above average SET concentration
data reported earlier that many (Figure 2). It has above average
of these do not hold the level of exports (Figure 3), good growth
qualifications commonly required history and growth prospects
for professional registration. (Figure 4). It has good employment
prospects (Figures 5 and 6). The
n SET workers are found in every activities involved are:
sector of the UK economy - least
in Agriculture & Mining and Real Estate Activities
most in Construction (Figure 2). Legal & Accounting activities
Manufacturing, Computing Activities of head offices;
& Telecommunications and management consultancy activities
Construction have the highest Architectural and engineering
concentrations of SET workers. activities; technical testing and
analysis
n Sectors with both above average
productivity and above average Scientific research and development
wages tend to have higher than Advertising and market research
average SET concentration - with Other professional, scientific and
Finance & Insurance being the technical activities
exception (Figure 2). Veterinary activities
18 Royal Academy of EngineeringJobs and growth: the importance of engineering skills to the economy
Therefore the role of SET in the and 3.5 years survey points)
evolution of Business Services appear consistent with what is
might be emphasised and known about the distribution of
discussed more in public policy SET workers through the various
discourse. sectors of the economy to meet the
needs of the wider economy.
n The UK is clearly still in the valuable
business of manufacturing. n Engineering & technology
However, future jobs may mostly graduates are mostly (but not
be there to replace retirements exclusively) found in the top
unless there is a rebalancing of three occupational groups (Senior
the economy more towards an Managerial, Professional, Associate
industrial base. Professional).
n Construction is an important n Some differences in destinations
employer of SET workers – after for men and women are evident
a period of shedding jobs it is (data only available for first
forecast to be an expanding destinations) – higher proportions
employer in the future. of women than men are found in
sectors outside of the ‘intuitively
n The importance to future growth of obvious’ engineering sectors such
Computing & Telecommunications as manufacturing and construction.
as a sector is clear. However Higher proportions of women
it is also true that human and than men are found in lower
other forms of computing and occupational groups.
telecommunication capital also
enable the economic performance n After 3.5 years most holders of
of many other sectors. engineering degrees are found in
intuitively obvious engineering
An inspection of HESA ‘first destination’ occupational groups and sectors.
and ‘longitudinal’ data for graduating
engineers56 reveals: n UKCES57 two-digit SOC analysis
suggests that after 3.5 years, 74%
n Engineering & technology graduate of engineering graduates are in SET
destinations (both at 6 months occupations
56 www.hesa.ac.uk (accessed July 2012)
57 UKCES (2011), Working futures 2010-20, UKCES, December 2011
19Labour market returns for SET
occupations and STEM qualifications
60 quantify the wage premia for STEM
qualifications and SET occupations.
50
n The typical wage paid to the
40 youngest people working in
Hourly pay (£)
a ‘professional’ engineering
30 All engineers and assoc. occupation is only slightly more
professionals than the wages paid to young
20 skilled engineering operatives
Linear (All engineers and
assoc. professionals) (Figure 9). However, the premium
10
paid for experience is much greater
0
for professional engineering
0 20 40 60 80 100 occupations compared to that paid
for either engineering technicians
Age (years)
or skilled engineering operatives
– and they have access to the
highest wages.
Figure 7: Raw LFS data, January– Analysing the first quarter of Labour
March 2011, for ‘engineering Force Survey data from 2011 using Although plotting raw LFS wage data
professional’ SOC codes. Wages the classifications developed by the
are gross hourly wages.
is useful as it reveals the variability in
FE STEM Data Project and reported in wages obtained by individuals in similar
Greenwood et al. reveals the following occupations, statistically significant
characteristics of the labour market quantification of relative reward for
for SET professionals, technicians and SET occupations requires as much LFS
skilled operatives: data as possible and a sophisticated
n The hourly pay of engineering regression analysis to separate out
professionals rises steeply with the influence of competing factors:
age (Figures 7,8). If age is taken age, occupation, region, gender,
as a proxy for experience then qualifications and so forth.
this suggest that engineering Greenwood et al.58 take Labour Force
occupations pay a premium for
Survey data (27 quarters for the period
experience.
March 2004 – December 2010 with
n There is a lot of variability in wage 163,218 people surveyed aged 16–64
data for engineering occupations in England & Wales) and then identify
(Figures 7, 8). For example, for those with STEM qualifications (using
older workers hourly wage can the FE STEM Data Project59 coding
vary by a factor of three or more for conventions) and those working in SET
individuals who are the same age occupations. Regression analysis is used
in the same occupation (SOC code). to identify the relationship between:
This means that ‘average’ wage
n Qualification type
estimates are difficult to interpret
when seeking to understand n Qualification level
labour market behaviour amongst
n STEM subject
engineering occupations. This
illustrates why Greenwood et al. n Deployment of a STEM qualification
used regression analysis to in a SET occupation
58 Charley Greenwood, Matthew Harrison, Anna Vignoles (2011), The labour market value of STEM
qualifications and occupations, Institute of Education / Royal Academy of Engineering
www.raeng.org.uk/news/releases/shownews.htm?NewsID=701
59 Andy Frost, Clive Greatorex, Matthew Harrison, David Mason (2010), FE and Skills STEM Data
Summary report, October 2010, Blue Alumni / Royal Academy of Engineering
www.thedataservice.org.uk/statistics/other_statistics_and_research
20 Royal Academy of EngineeringJobs and growth: the importance of engineering skills to the economy
30 Figure 8: Raw LFS data, January-
March 2011, for selected SOC
25 codes shown in Table 1. Wages are
gross hourly wages.
20
Hourly pay (£)
Civil engineers
15
Mechanical engineers
10
Electrical engineers
5 Electronic engineers
0
0 20 40 60 80 100
Age (years)
30 Figure 9: Comparison of linear
All engineering professionals
regression lines taken from
25 data shown Figure 2 with lines
All engineering technicians
obtained from data relating to SOC
20 codes for engineering technicians
Hourly pay (£)
All skilled engineering
operatives and skilled engineering
15 operatives . Regressions of raw
Linear (All engineering LFS data, January-March 2011.
10 technicians) Wages are gross hourly wages.
Linear (All skilled
5 engineering operatives
0 Linear (All engineering
0 20 40 60 80 100 professionals)
Age (years)
on hourly wages. The method cannot Hybrid Science /Engineering
account for the general ability of the occupations do not attract a premium.
individual so the findings are not
necessarily causal. Statistically significant evidence for
substantial additional wage premium
Greenwood et al. find that the premium is found for many but not all STEM
for working in STEM occupations is qualifications, particularly when used in
substantial SET occupations:
n 19% premium for STEM overall n First / Foundation degrees (up to
(average over all levels of 12% additional wage premium)
occupation – best relative returns
n HNC / HND (up to 11%)
at occupations below Managerial)
n Level 3 NVQ (up to 10%)
n 10% premium for Science
occupations n Level 3 City & Guilds (up to 14%)
n 33% premium for Technology Wage premia for engineering graduates
occupations have been calculated over many
years as part of a general effort to
n 15% premium for Engineering understand the graduate premium and
occupations its nuances60:
60 Machin and Vignoles (2005), “Does Education Matter?”, Steve McIntosh, (Machin & Vignoles –Eds),
Princeton University Press, 2005 (page 182)
21You can also read